
Black, ominous clouds have been dumping heavy rainfall over southeast China ever since May 12.
Warm winds, laden with the moisture spilling off a super-heated Pacific Ocean, collided with an intense storm track that often combined upper level moisture flows spilling off the heat dome near the Caspian, a high intensity heat and evaporation event now ongoing over India, and cold, unstable air streaming down from the Kara Sea in the Arctic. Since mid-May this relentlessly persistent pattern has been in effect. And the inundation has been ongoing and extraordinarily intense with day-after-day deluges pounding a sprawling region from south-central China and on to the coast.
(Chinese news report from yesterday showing widespread flooding.)
Each new dawn brings with it fresh losses with numerous major roads closed, bridges washed out, and adding to what is now an almost endless tally of evacuation orders. Daily rainfall totals in the range of 2-6 inches or more have saturated grounds, burst riverbanks, and turned streets into torrents. By today, more than 1 million people had been impacted with nearly a half million evacuated or rescued from flooded buildings. Since the, still ongoing, floods began in mid-May, more than 25,000 homes and 40 souls have been lost to the epic storms.


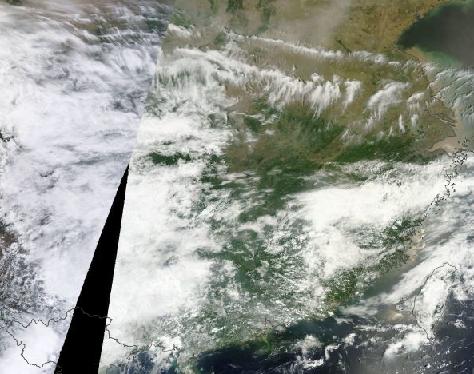
(Relentless heavy rainfall over Southeast China visible in the above four satellite images on [left to right, top to bottom] May 12, May 18, May 23rd and May 27th. Image source: LANCE-MODIS.)
The Chinese have invested heavily in flood defenses since the 1998 deluge that resulted in 4,000 dead, over 15 million homeless, and 26 billion dollars in damages. During that year, a strong El Nino set off severe storms that turned large Chinese rivers into raging inland seas. The Three Gorges Dam on the Yangtze was built, in part, to prevent this kind of terrible flooding.
But fears of a possible repeat of the 1998 event are on the rise despite heightened Chinese defenses. A strong El Nino may again be gathering in the Pacific and with global temperatures now warmer than even those seen during the late 1990s, atmospheric moisture loading is probably at its highest in at least the last 10,000 years.
Extreme Floods Linked to El Nino and Climate Change
This extreme atmospheric heating and global trend toward El Nino could well result in continuing and possibly worsening local impacts for Southeast China. It is the second region this spring to suffer epic flooding after the worst flood event in 1,000 years resulted in the destruction of over 100,000 homes in the Balkans.
High atmospheric heat content increases both the frequency of severe rain and drought events due to an amplification of the hydrological cycle through evaporation. Overall, it is estimated that the current .8 C of warming over 1880s temperature averages has caused a 6% amplification of the hydrological cycle worldwide. That’s 6% heavier rainfall and 6% more intense droughts when averaged over the entire globe. But as we well know, weather isn’t an evenly distributed phenomena. Some regions are more likely to receive a bulk of that increased rainfall even as others are more prone to see a majority of the increased drying. Add to this consequence a meandering Jet Stream (set off by loss of Northern Hemisphere sea ice) with the tendency to lock in very persistent weather patterns and you end up with a greatly enhanced likelihood for extreme weather due to the wide-ranging effects of atmospheric warming.
Weather Forecast Calls for More Severe Storms
For southeast China, weather patterns will remain locked in for a continuation of potential extreme rainfall over the next week. The large heat domes over the Caspian and India will continue to spill out moisture over Southeast China even as the extraordinarily warm Pacific provides its own moisture flow. Notably, the weather forecast for this Wednesday calls for another large outbreak of thunderstorms with the potential to drop 2-4+ inches of rainfall over already saturated and inundated grounds. Thursday through Sunday is expected to bring yet more waves of severe thunderstorms to the region.
Given this combined extreme weather and climate state it is certainly possible that the current flood tally will continue to lengthen for Southeast China.
Links:
Half a Million Evacuated as China Braces for More Flooding
More Rain for Flood Ravaged South China
Recovering From Balkan Flood Disaster Will Cost Billions
Hat tip to Colorado Bob


Gerald Spezio
/ May 27, 2014Storms of My Grandchildren, my children, my friends, my family, my neighbors, myself …
LikeLike
Mark from New England
/ May 27, 2014Yes Indeed. If we’re seeing all this crazy weather with only 1C of global average temp increase, what’s it going to be like at 2C, 3C?
LikeLike
Mark from New England
/ May 27, 2014Robert, good update on the Chinese flood situation. Isn’t this the same part of the world that suffered intense humid heat last summer?
A few days ago TGI posted a video of Prof. Tony Barnston stating that the factors that favor the development of a strong El Nino appear to be weakening. Here’s TGI’s previous post:
2014 Niño unlikely to be a strong one?
May 2014 Climate Briefing Highlights, with Prof. Tony Barnston
Just wondering what you think of this. Is it still early to tell just how likely this El Nino is to be a strong one? How are things trending as of late-May?
LikeLike
robertscribbler
/ May 27, 2014I think this is generally a good assessment. The feedbacks tend to ebb and flow. And as of five or so days ago, they were in a bit of an ebb.
Today, we’re back to pretty anomalous west winds over broad sections of the typical trade zone. So the feedback pattern today is much more El Niño supportive.
Looking back through the data we see the Nino 3.4 zone tracking just shy of 1997 which still puts us in the range of concern. Overall, the Kelvin Wave was the strongest in the record, the upper ocean heat content for the equatorial Pacific rapidly rose to hit +1.7 C and then tracked back to +1.2 C, a bit below the +1.8 to 2 C range shown during the draw up to the 1997-1998 El Nino. A second strong Kelvin Wave could break this threshold, but weather would have to permit (more strong west wind back bursts like the ones we saw during January and February). Rather intense ocean surface warming in the range of +1 to 2 C anomaly from 130 to 180 East Longitude makes this event possible but not certain. A rather strong warming near the date line in the Pacific is also indicative of strengthening toward El Nino.
As of late May, it is too early to call a strong El Nino with absolute certainty. The El Nino could be weak, moderate, or not form at all. My opinion remains that a moderate to strong event is most likely, primarily owing to persistent very high subsurface anomalies even during the cool phase of the current Kelvin Wave. This would tend to point toward a long-build event, should it arise. Also, rate of temperature increase for the Nino 3.4 region was, as of this week, just shy of 1997-1998 trend setting. So the build-up is still along the lines of a strong event but we are very early.
I think it likely that the good Dr. saw the weekly drop of 0.5 C to 0.4 C in the Nino 3.4 region last week (negative trend), and took that into consideration. This week, we are back to +0.5 C with the trend line heading up. Also, the current warming seen near the date line is indicative of likely further Nino 3.4 increases.
So, yes, too early to call, but from where I’m sitting this still looks like a moderate to strong event with high upward potential, weather permitting.
LikeLike
Mark from New England
/ May 27, 2014“This would tend to point toward a long-build event, should it arise.” – I take it most El Nino’s are fairly short-lived affairs, with a rapid build-up and culmination periods; but some take longer to build and hence can release heat into the atmosphere over a longer period? Thanks for the update Robert.
LikeLike
robertscribbler
/ May 27, 20141991 to 1992 was an example of a long-build El Nino event in which upper ocean heat content built slowly through 1990 to late 1991 and peaked at around 1.5 C positive Anomaly and Nino 3.4 hit +1.5 C as well. 1997 to 1998 was a more rapid build event in which upper ocean heat content jumped to about +2 C from mid to late year with Nino 3.4 hitting +2.4 C.
LikeLike
robertscribbler
/ May 27, 2014As for last year’s heat wave — yes very extreme heat for the same region that now sees major flooding.
LikeLike
Colorado Bob
/ May 27, 2014Since Wednesday, storms in Guangdong have left 15 dead, five missing and affected 800,000 people, with accumulative precipitation of 628 mm in Shanwei City.
( just short of 25 inches)
http://www.thestandard.com.hk/breaking_news_detail.asp?id=49829&icid=2&d_str=
LikeLike
robertscribbler
/ May 27, 2014Average = 3.5 inches per day.
LikeLike
Mark from New England
/ May 27, 2014That’s a lot of rain. I imagine this deluge will also later result in swarms of mosquitos, something else to be concerned with in areas that will get warmer and wetter. Malaria and other diseases will be spreading north out of their tropical haunts.
LikeLike
Colorado Bob
/ May 27, 2014Speaking of ocean heat –
As Jeff Masters noted in his blog today (May 27th) , Hurricane Amanda, the first tropical storm of the season in either the Eastern Pacific or Atlantic Ocean Basins, developed into the strongest such storm ever observed in the modern era during the month of May when it attained its peak intensity Sunday morning, May 26th, with a central pressure of 932 mb (27.52”) and sustained winds of 155 mph, just short of Category 5 status. Here is a brief historical review of Eastern Pacific tropical storms.
http://www.wunderground.com/blog/weatherhistorian/comment.html?entrynum=277#commenttop
LikeLike
robertscribbler
/ May 27, 2014Holy dear goodness! Now we have Cat 4+ storms in May? Now that’s a clear sign oceans surface temperatures are getting out of control.
LikeLike
Mark from New England
/ May 28, 2014Robert, you can use stronger language – it won’t upset us! 😉
LikeLike
robertscribbler
/ May 28, 2014Ha!
LikeLike
robertscribbler
/ May 28, 2014Comes from years of presenting at schools. You get in trouble if you say the word ‘suck.’
LikeLike
dtlange
/ May 27, 2014” But this year, perhaps, we ought to be paying more attention. The eastern Pacific hurricane season started on May 15, and already, with its first storm, it has set an ominous record. The hurricane in question, named Amanda, spun up south of the Baja California peninsula Thursday, and on Sunday it attained maximum sustained wind speeds of 155 miles per hour—just below Category 5 status. Or as National Hurricane Center forecaster Stacy Stewart put it when the storm reached its peak strength: “Amanda is now the strongest May hurricane on record in the eastern Pacific basin during the satellite era.”
http://www.motherjones.com/environment/2014/05/hurricane-amanda-record-climate-el-nino
LikeLike
robertscribbler
/ May 27, 2014Just six months after Haiyan…
LikeLike
Colorado Bob
/ May 27, 2014Hong Kong University and CSR Asia predicted in a report at the end of 2008. Hong Kong can expect:
a significant increase in the frequency and intensity of extreme weather events, such as heat waves, tidal surges, typhoons and very heavy rainfall. Sea levels will continue to rise for decades. The impacts of these changes on Hong Kong will be increased risks of flooding, droughts and dangerously hot weather. There will also be secondary and indirect impacts, including an increased risk of infrastructure damage, ground instability and landslides, and further increases in dangerously poor air quality periods.
http://qz.com/193476/a-freak-storm-provides-a-possible-preview-of-hong-kongs-extreme-weather-future/
LikeLike
robertscribbler
/ May 27, 2014They nailed it. From the article’s data references, a 0.2 C per decade warming is very fast for an equatorial zone.
LikeLike
Colorado Bob
/ May 27, 2014May 12 , 2014 –
Among the worst-hit were Hong Kong Island, Tai O on Lantau Island, Lamma, Cheung Chau and the northeast New Territories, which saw 300-400mm of rainfall in 24 hours ending at 8am today, according to the Hong Kong Observatory……………… Floods were blamed as more than 430mm of rain fell on the Longhua district of northern Shenzhen by 7pm, according to the Shenzhen Meteorological Bureau.
http://www.scmp.com/news/hong-kong/article/1510155/downpour-shenzhen-cripples-rail-link-hong-kong-guangzhou
LikeLike
robertscribbler
/ May 27, 2014That 10-13 inch storm was the start. Quite a big one…
LikeLike
Colorado Bob
/ May 27, 2014Yep, the tough thing is when one of these events begin is where to set the marker, and follow it to the end. I would love to see the doppler radar estimates for the last 60 days.
Hong Kong got it brains beat in at the end of March with a storm that made golf ball hail.
These large hail producing storms are worry some in that they represent storms that reach above 50,000 feet to nearly 60,000 feet. To me, this is like seeing the warm ocean melting the base of the PIG.
Heat seeking a condenser , at ever more extreme examples . Physics 101. Just look at the TRMM data when the next one comes. They call them ‘heat towers”. Large shafts of hot water vapor punching through the troposphere.
I’ve yet to see a paper, but storm tops are getting higher . And that means more rain, more & bigger hail, and deeper snows when it’s cold.
Hail is by far the largest insurance payout in North American, and tall storms love to make hail.
LikeLike
Colorado Bob
/ May 27, 2014Satellite images show Lake Powell half full
NASA’s Earth Observatory recently released satellite imagery showcasing the decade-plus drying-up of the reservoir that helps quench the thirst of more than 20 million Americans. The images above show Lake Powell, from 1999 to the present, as its water levels have slowly descended down the canyon walls.
The photographs were captured by satellites from NASA’s Landsat program.
Read more: http://www.upi.com/Science_News/2014/05/26/Satellite-images-show-Lake-Powell-half-full/4761401123306/#ixzz32xGT2EN1
LikeLike
robertscribbler
/ May 27, 2014I always find these images to be a rather brutal reminder of the ongoing droughts out west.
LikeLike
Spike
/ May 27, 2014The opposite story is playing out in the Iberian peninsula with severe drought.
https://www.euroweeklynews.com/news/spanish-news/item/120795-spain-suffering-from-worst-drought-in-150-years
LikeLike
robertscribbler
/ May 27, 2014The Sahara is moving north…
LikeLike
Colorado Bob
/ May 27, 2014And it is moving south .
LikeLike
Mark from New England
/ May 27, 2014I recall seeing the projected Palmer Drought Severity index maps of the Mediterranean area for the period 2075 – 2100, under about 3-4C of warming. As Robert points out, it basically will become an extension of the Sahara desert. Spain, southern France, southern Italy, Greece and the many small countries of the eastern Mediterranean may become uninhabitable in a few decades.
LikeLike
todaysguestis
/ May 28, 2014Is this the graph you mean Mark?
LikeLike
Mark from New England
/ May 28, 2014TGI – yes, I believe that’s the graph. Notice how hyper-arid the Mediterranean basin becomes by 2060, even in comparison to the Sahara itself.
LikeLike
Colorado Bob
/ May 27, 2014Spike.
Nice catch, and last winter was the wettest in 250 years in England. I find these ever sharper extremes , so close to each other really amazing. But when the system wiggles , you go from the worst 4 year drought on record, to floods in 4 days. As we just saw in Texas.
“As a system nears a tipping point, it moves to the extremes, there it gets stuck, before slamming to the opposite extreme. ”
Therefore, the Balkans are about to see the worst drought on record.
LikeLike
Colorado Bob
/ May 27, 2014The studies this spring have showed us that deeper denser heat is moving in the oceans On top of it is a fresher, and cooler run off. And as we both know. the amount of salt in the layers is very important . I think a very warm layer of deeper saltier water is about to change the world .
Salt water , holds more heat than fresh water .
LikeLike
robertscribbler
/ May 28, 2014Melting glaciers create an expanding zone of fresh surface waters that deflects warmer, saltier water toward the bottom. Terrible implications for both ocean health and warming feed backs. The seabed hydrate store is in the firing line. In addition, you end up with a thickening anoxic layer, rising chemoclines, and overall lower ocean carbon storage/solubility.
LikeLike
David Goldstein
/ May 28, 2014Robert – is it possible to find daily updated data regarding how hot a given month is relative to the same months in the temp. records- that is, is there somewhere I can find how hot this May is compared other historical Mays as of this date?…… or do we have to wait for the monthly summaries that come out from Nasa and NOAA the following month?
LikeLike
Bassman
/ May 28, 2014David, I’m not aware of anything. The “Climate Reanalyzer” app is good for daily measurements and it would seem to suggest that May will be a massive scorcher but after NASA processes everything it’s hard to say. UAH and RSS report (correct me if I’m wrong) air temps by satellite at a certain altitude very early. They lag the El Niño index the most and are often way over sensitive to it. If daily temps are any indication however I would say May temps will be the hottest on record for the month.
LikeLike
robertscribbler
/ May 28, 2014May will almost certainly be the hottest on record.
LikeLike
robertscribbler
/ May 28, 2014Daily updating for the major measures isn’t available, unfortunately.
LikeLike
Mark from New England
/ May 28, 2014“The Impossibility of Growth Demands a New Economic System – Why collapse and salvation are hard to distinguish from each other” by George Monbiot
http://www.commondreams.org/view/2014/05/28-0
We need to transition to a non-growth, steady-state economy if we’re going to survive and preserve what’s left of the Earth’s biodiversity and keep global warming from running away, if indeed it’s not too late to avert the worst case scenarios:
http://steadystate.org/
LikeLike
robertscribbler
/ May 28, 2014Collapse is a terrible outcome. You end up with far worse impacts due to destabilization.
Growth has been poorly defined.
We have 1. population growth, 2. consumption growth, 3. productivity growth (progress). (I don’t like the term productivity, but it’s what economists use as a kind of catch-all for progress, so I’m using it here)
1. Needs to hit zero to net negative growth
2. You can divide into numerous areas. I’ll divide it into fossil fuel consumption, other materials consumption, and services consumption. For fossil fuel consumption, this needs to go to zero rapidly. So that entire section of the economy needs to be replaced with something else or go away entirely. Of the other materials consumption, land use (deforestation) and meat consumption (especially industrial meat consumption) are the most harmful and need to be radically curtailed. Generally, net materials consumption needs to be radically brought down through recycling and continued advancement of sustainability measures. Services consumption is fine and could continue to grow with little harm.
3. Here is where we can make major strides through innovation. Renewable energy systems are a form of productivity growth in that they produce energy with low to near zero externalities. In addition, industrial processes and scaling greatly reduce energy systems costs and increase EROEI. Decarbonization is a form of ‘productivity’/progress growth as well. Increasing overall sustainability is productivity growth. Other innovations on the positive side of the ledger are important and helpful.
Overall, we can probably cut out all fossil fuels, reduce harmful consumption, and increase productivity/progress all while reducing population at -0.1 percent per year and sustain real growth in the range of 1 percent per year. Such action would require sound policy that we don’t currently see. In addition, under a slower growth regime equality policies become far more important due to the fact that capital becomes concentrated through inheritance when growth is slower.
LikeLike
Gerald Spezio
/ May 28, 2014“For fossil fuel consumption, this needs to go to zero rapidly.”
Wish in one hand & shit in the other – see which one fills up the fastest.
Even with massive economic & social collapse fossil fuel consumption wouldn’t drop to zero.
Drop my foot – it is accelerating.
Guy McPherson is probably the foremost spokesman for “industrial collapse.”
I agree with everything that he says except his cavalier & murderous flying.
But he regularly flies all around the planet for personal titillation spewing tons of CO2.
He recently flew to Ecuador for new age grief counseling.
McPherson’s justifies his flying & CO2 production by quoting the Jevons Paradox & the Khazzoom-Brookes Postulate – two political axioms of the the never ending growth economy.
Calling me an ignorant jerk, he recently answered my criticism of his flying & gigantic CO2 production with; “Conservation is largely irrelevant, as explained by Jevons’ paradox, the Khazzoom-Brookes postulate, and reality.”
You bet we are doomed.
LikeLike
robertscribbler
/ May 28, 2014The big if is always policy action. In my opinion, as opposed to that of many economists, policy is critically important and not symptomatic of so-called natural states. Quite the opposite, large scale action leads directly to a given state. So the choice is critical to the outcome.
Individual action is also important, especially when repeated over large scales. So leadership and example setting is very important.
Conservation is certainly relevant in that actively reducing demand for harmful goods increases pressure for replacement/adaptation. A kind of boycott/behavior pressure, if you will.
LikeLike
ccgwebmaster
/ May 28, 2014Guy McPherson also latches onto the most fringe and insane pieces of junk science (Malcolm Light’s “methane firestorm”, Paul Beckwith predictions, etc.) out there and folds them into his case for inevitable near future human extinction. It’s kinda sad people follow him in such large numbers, too damn lazy to get up and do something I guess – easier to coast to defeat.
That civilisation should collapse, objectively viewed, looks very likely – a question of when rather than if.
Extinction doesn’t necessarily follow even in the worst case outcomes.
LikeLike
Mark from New England
/ May 28, 2014Yes, especially in the next few decades as he (McPherson) claims. IF we let things get so out of hand that we bring about a Canfield ocean spewing hydrogen sulfide gas, then, perhaps, human extinction is in the cards – several hundred years from now.
LikeLike
robertscribbler
/ May 28, 2014I generally do not like the types of cards being added to the deck these days…
LikeLike
ccgwebmaster
/ May 28, 2014Even then, it wouldn’t be assured (though the odd would rise substantially, I grant).
LikeLike
Gerald Spezio
/ May 28, 2014From the product description of McPherson’s book, GOING DARK;
“…. conservation biologist Guy McPherson proposes we act with compassion, courage, and creativity.
He suggests we act with the kind of empathy for which humans are renowned. In other words, he suggests we act with decency toward the humans and other organisms with which we share this beautiful planet.”
Flying on massive jet airplanes for new age fun & games & producing tons of CO2 is acting with “DECENCY” & “COMPASSION” toward our drowning, displaced, starving, & dying fellows on the planet???
Justifying such outright murderous flying by quoting neo-classical economic theorists like Jevons & Khazzoom-Brookes is hypocrisy & intellectualism gone bonkers.
LikeLike
robertscribbler
/ May 28, 2014Taking responsibility for our individual carbon emissions is very helpful and shouldn’t be downplayed. We can do this by actively denying certain kinds of consumption all while pushing for responsible policy actions to free the captive consumer, as it were.
LikeLike
ccgwebmaster
/ May 28, 2014Action has to start with the individual. That’s all society is – a collection of individuals.
LikeLike
robertscribbler
/ May 28, 2014In my opinion, both individual direct action and individual political action (supporting helpful policies) are necessary.
LikeLike
giniajim
/ May 29, 2014I read recently a note that individual action has no real impact on whatever the problem is, but, and its a big but, individual action can lead to larger social and policy changes. We all want to do the right thing, encourage others to do the same, and lobby our policy makers to adopt related changes. But on the other hand, we can’t martyr ourselves.
LikeLike
robertscribbler
/ May 29, 2014I think the notion that individual action has no impact is relatively overdone. Society is an aggregate of individual action after all. But my opinion is that policy action — such as a carbon tax, direct regulation of carbon fuels, fee in tariffs for renewables, plans for 100% renewable energy use by X date, establishing emergency protocols, and putting pressure on other nations to reduce carbon emissions — are by far the most effect means available.
LikeLike
Gerald Spezio
/ May 28, 2014We are going to cut back on fossil fuel consumption?
Gang banging a bleeding on-its-knees & helpless planet – “Hey, if I don’t do it somebody else will.”
LikeLike
Apneaman
/ May 28, 2014Gerald
I imagine a enormous drop in emissions from economic collapse will be quickly made up by war emissions. Hope I’m wrong.
BTW it’s not Guy McPherson any more it’s Gee McPherson.
Robert, Bob or anyone. Can enough fresh water be released into the oceans to reduce or slow down acidification?
Really great work here, Robert. Much appreciated.
LikeLike
robertscribbler
/ May 28, 2014Fresh water release has marginal impact on ocean acidification. The rate of CO2 emission of months is equal to the fresh water release of years.
LikeLike
pintada
/ May 28, 2014I know Guy is not flying a private jet. So, he is sitting with the rest of the 99% in the back of the jet that would be going that way anyway. So, what is the NET increase of carbon emissions from his weight given that the jet would be going that way regardless of his behavior? Minuscule. He would emit more CO2 if he walked.
I have a pius and all the trappings of the collapse aware, but I try to keep my holier than thou pronouncements to a minimum. No matter who/where you are in the developed world, you are sucking at the teat of industrial society.
They have a word for people that (actually) wear the hair shirt while billions of his contemporaries do not. Chump.
LikeLike
robertscribbler
/ May 28, 2014Free the captive consumer…
LikeLike
robertscribbler
/ May 28, 2014The person who decides to do something to reduce the severe harm coming down the pipe is, in my view, a hero and an example, not a chump. The chump is the idiot who fought rational change every step of the way.
LikeLike
ccgwebmaster
/ May 28, 2014The Prius isn’t even that fuel efficient, though I guess by US standards it’s incredible.
LikeLike
robertscribbler
/ May 28, 2014The total carbon footprint is about half that of a typical American car.
LikeLike
ccgwebmaster
/ May 28, 2014Yeah, but that’s a pretty poor comparison. When I owned a car, I never owned a car that did worse than 54mpg, and the best did around 70mpg (a little 20 year old diesel… not exactly state of the art stuff). I also never owned anything remotely as fancy and new as a Prius, just was struck that a little purely petrol (er, gas) combustion engine car can beat it, and yet everyone touts it as though it was some giant leap forwards.
US fuel efficiency standards are abysmal…
In any event, virtually any combustion engine now burns too much fuel.
LikeLike
robertscribbler
/ May 28, 2014Have to agree on the final point. All future cars need to be zero emissions very soon. The Leaf, Tesla, and the Volt are good examples of where we should have been yesterday.
LikeLike
ccgwebmaster
/ May 29, 2014Except that lithium is also a finite resource and not plentiful enough to sustain the worlds engine habit. Personally I think there are other ways of storing energy that don’t rely on such scarce resources – flywheels, maybe even compressed air (albeit inefficient), much better use of aerodynamics (note speeds of fully faired recumbent bicycles) and mass transportation (efficient within cities, less so in the countryside).
But… well, no sign we’re going to about turn to the right direction… and too late in the day probably anyway.
LikeLike
robertscribbler
/ May 29, 2014There are many materials useful in batteries. The global lithium store / production cap hasn’t been fully explored either.
LikeLike
ccgwebmaster
/ May 29, 2014It doesn’t matter if there is “enough lithium to last for generations” – that’s exactly the thinking that led to the mess with oil in terms of resource scarcity. If we want true sustainability it cannot be predicated heavily on finite resources.
Lithium is particularly relevant to the high capacity (by weight) batteries currently typically used in electric vehicles. As soon as we deplete any finite and even slightly scarce resource at appreciable rates, we cause problems for people down the line. The challenge ought to be true sustainability, not eking a few more consumer generations out of the planet.
LikeLike
robertscribbler
/ May 29, 2014This is not an apples to apples comparison. First, the use of battery storage materials has a near zero climate externality. Second, the battery materials are recyclable, while the fossil fuels are not. Third, as mentioned above and plainly ignored, lithium isn’t the only material available for battery storage. What we have is an expanding competitive array.
What is the most damaging aspect of fossil fuels? That it is a finite resource or that it’s use causes climate catastrophe? I’d say the latter. Finite resources for multiple use battery storage is a far more solvable problem.
LikeLike
Gerald Spezio
/ May 28, 2014The plane is going anyway????
The catastrophic ENERGY COST of jet air travel.
Some Brits call it; PLANE STUPID.
“Let’s make clear what this means. A long international flight once per year has an energy cost slightly bigger than leaving a 1 kW electric heater (1000 watts) on, non-stop, 24 hours a day, all year.”
Moreover, One intercontinental flight produces two pounds of CO2 absorbed into our planet’s atmosphere PER PASSENGER PER MILE.
This is caused largely by the weight of the extra fuel.
Therefore, a six thousand mile intercontinental flight from San Francisco to Paris (12 thousand miles round trip) produces a total of 12 tons of CO2 per passenger.
12 TONS!
Here is part five of David MacKay’s book entitled; “Planes.”
http://www.inference.phy.cam.ac.uk/withouthotair/c5/page_35.shtml
LikeLike
Mark from New England
/ May 28, 2014Yes, it’s amazing the amount of fuel burned per passenger in air travel. Looks like the transcontinental transportation of the future will be first large ocean liners, and then sailing ships eventually. Sort of a variation on ‘My grandfather rode a camel, my father drove a car, I ride in a plane, and my son will ride a camel…” or however the Saudi saying goes.
LikeLike
ccgwebmaster
/ May 28, 2014And the damning thing is that the airlines get the fuel without paying the taxes that you do to fill up a car…
LikeLike
robertscribbler
/ May 28, 2014Carbon tax would be helpful…
LikeLike
ccgwebmaster
/ May 28, 2014Good to see the coverage – one thing I’m wondering – what are the agricultural impacts of this and the Balkans flooding?
LikeLike
robertscribbler
/ May 28, 2014FAO index at 209 for April. Will have to see what happens in May.
Drought building for Central and Northern India…
LikeLike
Gerald Spezio
/ May 28, 2014If a scientist of Guy McPherson’s unquestioned stature & on point knowledge will try to justify his own homicidal personal flying with intellectual nonsense, you know that we are not going to cut back on much of anything, except advocating cream pies-in-the-sky along with carbon reductions.
LikeLike
robertscribbler
/ May 28, 2014I wouldn’t use the bad example as the sole example.
LikeLike
Spike
/ May 28, 2014Some parts of eastern England had a month of rain in 24 hours according to the BBC.
http://www.bbc.co.uk/news/uk-england-norfolk-27604149
LikeLike