
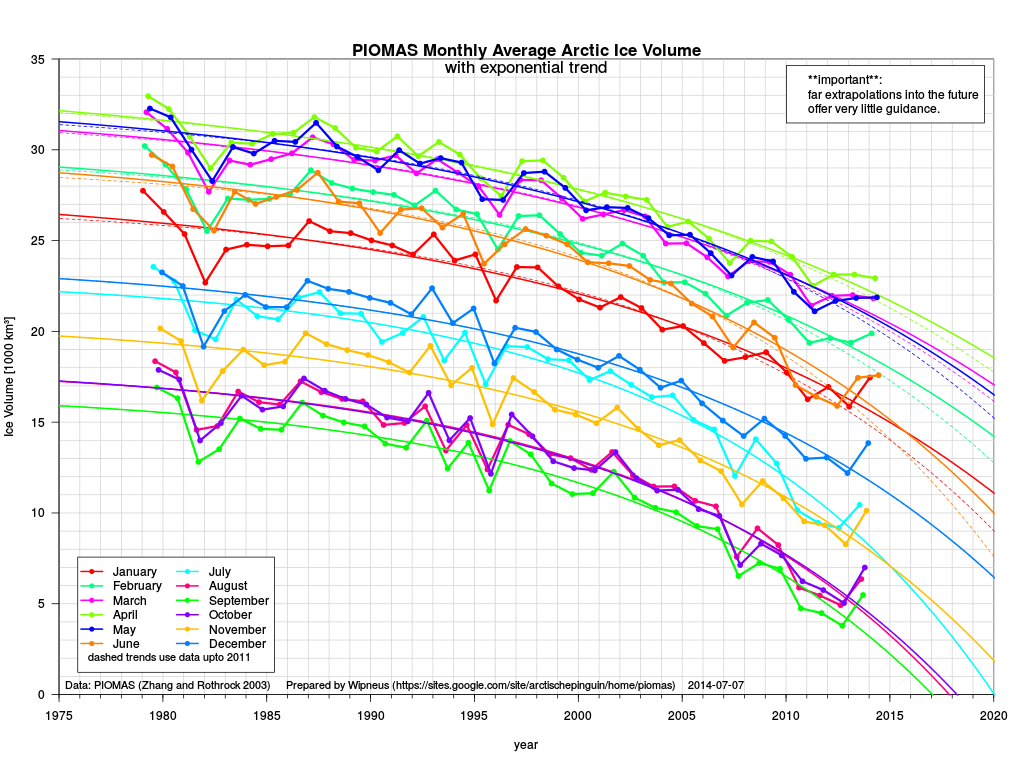
(Rate of Arctic sea ice volume decline with trend lines for all months in the PIOMAS measure. Updated through June of 2014. Image source: Wipneus.)
What it really all comes down to is heat energy balance. Beneath a warming, moistening Arctic atmosphere, sea ice loses resiliency due to slow attrition of the ice surface, due to loss of albedo as ice melts, and due to slower rates of refreeze during winter. Atop a warming Arctic Ocean, sea ice loses bottom resiliency, tends to be thinner and more broken, and shows greater vulnerability to anything that churns the ocean surface to mix it with the warming deeper layers — storms, strong winds, powerful high pressure systems.
It is this powerful set of dynamics under human caused climate change that has dragged the Arctic sea ice into what has been called a ‘Death Spiral.’ A seemingly inexorable plunge to zero or near zero ice coverage far sooner than was previously anticipated.
But in the backdrop of what are obviously massive Arctic sea ice declines and a trend line, that if followed, leads to near zero ice coverage sometime between next year and 2030, lurk a few little details throwing a bit of chaos into an otherwise clear and, rather chilling, picture of Arctic sea ice decline.
The Fresh Water Negative Feedback
One of these details involves the greatly increasing flow of fresh water into the Arctic Ocean. For as the Arctic heats, it moistens and rainfall rates over Arctic rivers increase. This results in much greater volumes of fresh river water flushing into the Arctic Ocean and freshening its surface. Another source of new fresh water flow for the Arctic is an increasing rate of Greenland melt outflow. The volumes, that in recent years, ranged from 300 to 600 cubic kilometers, can, year-on-year, add 1-2% to the total fresh water coverage in the Arctic Basin and North Atlantic. These combined flows mean that fresh water accumulates more rapidly at the surface, resulting in an overall increase in fresh water volume.
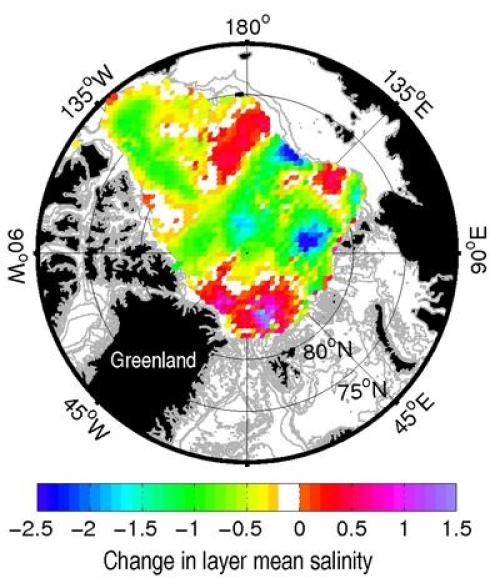
(Change in Arctic Ocean Salinity between the mid 1990s and mid 2000s. Image source: Benjamin Rabe, Alfred Wegener Institute via Science Daily.)
Since 1990, we have observed just such an accumulation. For a recent study in 2011 showed that since 1992, Arctic Ocean surface fresh water content had increased by 20%. A remarkable increase due to the changing conditions that included greatly increased river outflows into the Arctic Ocean as well as a ramping ice melt from Greenland and the Canadian Archipelago Islands.
Fresh water is less dense than salt water and will tend to float at the surface. The physical properties of fresh water are such that it acts as a heat insulator, deflecting warmer, saltier ocean water toward the bottom. As such, it interrupts the heat flow from deeper, warmer Arctic Ocean waters to the sea surface and into the atmosphere.
As an added benefit to the ice, fresher water freezes at higher temperatures. So as the Arctic Ocean freshens, it creates a bit of wiggle room for the sea ice, giving it about a 0.5 to 1 C boost so it can sometimes even form during conditions that were warmer than those seen in the past.
In this manner, an expanding fresh water zone acts as a kind of last refuge for sea ice in a warming world. A zone in which sea ice may even periodically stage comebacks in the backdrop of rampant human warming. We may be seeing such a comeback in the Antarctic sea ice, which has shown anomalous growth and even contributed to an expanding cool atmospheric zone in the Southern Ocean, despite ongoing global warming. The freshwater and iceberg feeds from the vast Antarctic ice sheets have grown powerful indeed due to warm water rising up to melt the ice sheets from below, letting loose an expanding surface zone of ice and fresh water. This process will necessarily strengthen as more and more human heating hits the deep ocean and the submerged bases of ice sheets. An effect that will dramatically and dangerously reverberate through the ocean layers, setting the stage for a horrible stratification.
But today, we won’t talk about that. Today is for negative feedbacks due to fresh water flows from increasing polar precipitation and through ice sheet melt.
In the end, human warming dooms Arctic sea ice to an eventual final melt. But before that happens the increasing volume of fresh water from river flows and the potentially more powerful negative feedback coming from a growing ice and fresh water release from Greenland and the Canadian Archipelago will inevitably play their hands.
The Slower Than Terrible 2014 Melt Season
And so we arrive at the 2014 sea ice melt season for the Arctic. As with 2013, the melt got off to a relatively rapid start and then slowed through July as weather conditions grew less favorable for ice melt. Above freezing temperatures hit the ice above 80 degrees North about one week later than average, also providing some resiliency to the central ice — a condition that historically leads to higher end-season sea ice values in about 80 percent of the record.
The high pressure systems of early June gave way to weak storms and overall cloudy conditions. This shut down the cycle of strong melt, compaction, and transport of ice out of the Arctic that may have put 2014 on track for new records and another horrible slide down the Arctic sea ice death spiral. Instead, conditions set up for slower melt. Ice was retained and backed up through the Fram Strait, and the ice spread out, taking advantage of the thickened fresh water layer to slow its summer decline.
This is in marked contrast to the terrible 2007 and 2012 melt seasons which severely damaged the ice, making a total Arctic Basin ice melt all more likely in the near future. And it was also cutting against the 2010 to 2012 trend in which sea ice volume measures continued to plunge despite ambiguous numbers in sea ice area and extent (no new record lows) during 2010 and 2011. For this year, sea ice volume is now, merely, ‘only’ 4th lowest on record, according to the PIOMAS measure.
The fact that we are looking at a 4th lowest year as another bounce-back year is a clear indication of how terrible things became since 2010. And so far, this year’s melt has, like 2013, simply not been so terrible and terrifying. A wag back toward 2000s levels that is likely due to the inherent negative feedback of freshening surface water and to a swing in natural weather variability that, during any other year and in any other climate, would have pushed summer ice levels quite high indeed.
If the storms had been strong enough to draw a large enough pulse of warm water to the surface, the story might have been different. But, as it stands, this summer of weak Arctic weather hasn’t activated any major melt mechanism to push the ice into new record low territory. And so in many major monitors we are now above 2013 melt levels for this day.
Cryosphere Today shows sea ice area at 5.22 million square kilometers, above 2013 and just slightly above 2011 while ranging below 2008 for the date. Overall, the area measure is at 6th lowest on record for the date. Meanwhile, NSIDC shows sea ice extent at 7.74 million square kilometers or just above 2013 values for the same day but remaining below 2008 and 2009 by a substantial margin. Overall, also a sixth lowest value for the date:
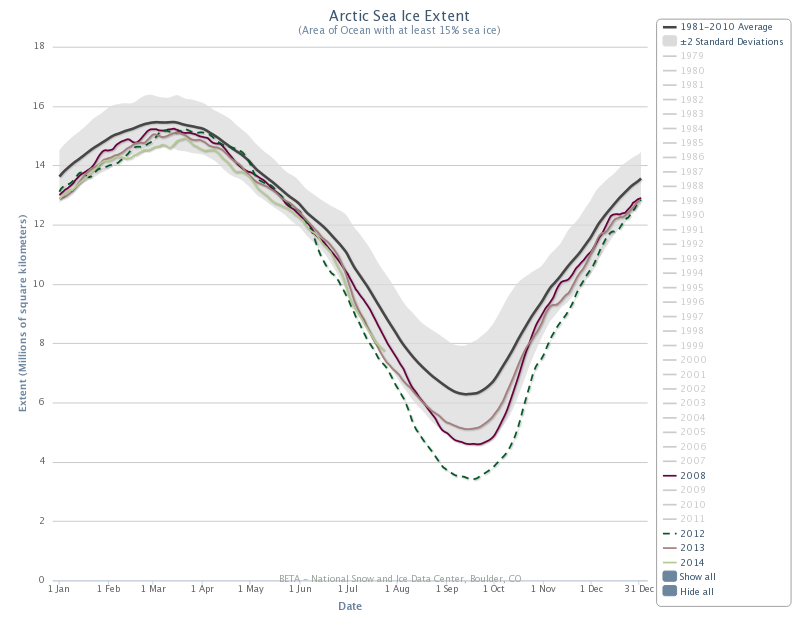
(NSIDC chart comparing sea ice melt years 2012 [dashed green line], 2008 [maroon line], the 1981 to 2010 average [solid line] and 2013 [pink line]. Image source NSIDC.)
So in the sea ice butcher board tally, with the negative feedback of fresh water floods and glacial melt moderately in play and with weather that is highly unfavorable for melt, we currently stand at 4th lowest in the volume record, 6th lowest in the extent record, and 6th lowest in the area record.
And now, things may just be about to get interesting…
Forecast Shows Arctic Heatwaves on the Way
GFS and ECMWF model runs show two warm ridges of high pressure developing over the Arctic this week. And the emergence of these warm and moist air flows into the Arctic may well have an impact by pushing the Arctic back toward melt-favorable conditions.
The first ridge is already expanding across the Canadian Archipelago. Yesterday it brought 80 degree temperatures to Victoria Island which still sits between wide channels clogged with sea ice. Smoke from wildfires is being entrained in this ridge and swept north and east over the remaining Archipelago sea ice and, today, the Greenland Ice Sheet.
While the smoke aerosol from fires blocks some of the incoming solar short wave radiation, it absorbs and re-radiates it as long-wave radiation. Many studies have shown this albedo-reducing darkening of the cloud layer by black and brown carbon aerosols has a net positive warming effect. In addition, the soot falls over both land and sea ice where it reduces reflectivity medium to long-term (Dark Snow).
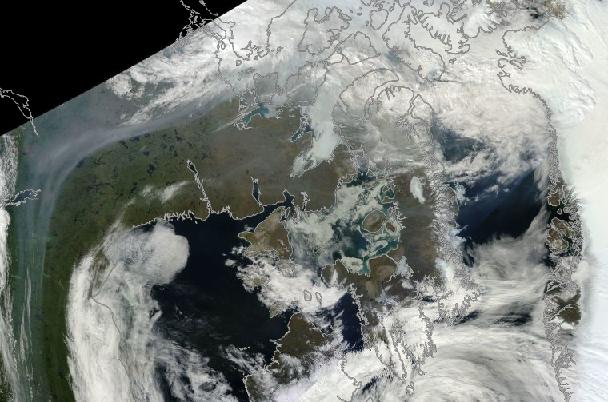
(Smoke associated with record wildfires in the Northwest Territory streaming over the Canadian Archipelago, Northern Baffin Bay, and Northwestern Greenland beneath a dome of record heat. Image source: LANCE-MODIS.)
The ridge is expected to expand east over the next few days until it finally settles in as a moderate-strength high pressure system over Greenland. There it is predicted to juxtapose a set of low pressure systems that will slowly slide south and east over Svalbard. The conjoined counterclockwise cyclonic wind pattern of the lows and the clockwise anti-cyclone of the high over Greenland in the models runs over the Fram Strait. And so, for at least 4-5 days, the models predict a situation where sea ice transport out of the Arctic may be enhanced.
Meanwhile, on the other side of the Arctic, a series of high pressure systems are predicted to back up over the Pacific Ocean section of Irkutsk and Northeast Siberia. This ridge is expected to dominate coastal Siberia along the Laptev and East Siberian Seas. Temperatures along the coast are expected to reach 15-20 C above average, while temperatures over the waters are expected to rise to melt enhancing levels of 1 to 5 C.
Ahead of the ridge runs a warm frontal boundary that is heavily laden with moisture and storms. So a liquid and mixed precipitation band is likely to form over the East Siberian and Beaufort Sea ice as the ridge advances.
The ridge is projected to drive surface winds running from the south over the East Siberian Sea, across the polar region, and into the Greenland and Barents Seas. This cross-polar flow of warm, moist air will also enhance the potential for ice transport.

(Pattern more favorable for sea ice melt and transport emerging over the next seven days. This Climate Reanalyzer snapshot is at the 120 hour mark. Note Arctic positive temperature anomalies at +1.18 C. Will the pattern override potential negative feedbacks such as high fresh water content in the Arctic and unfavorable weather likely produced by the late emergence of temperatures above 0 C in the 80 North Latitude zone? Image source: University of Maine.)
Overall, it is a weather pattern that shows promise to increase melt, especially in the regions of the Canadian Archipelago and the East Siberia Sea, and to speed ice mobility and transport. Persistent lows near the central Arctic for the first half of this period and shifting toward Svalbard during the latter half will continue to disperse sea ice which may lend one potential ice resiliency feature to a pattern that is, otherwise, favorable for ice loss.
Negative Feedbacks and Weather Unfavorable For Melt
If the melt pattern described above comes to impact the ice and push greater rates of sea ice loss over the coming days and weeks, it’s likely that end season 2014 will end up with sea ice measures below those of 2013, but above the previous record lows seen during past years. This would likely put 2014 well within the range of the post 2007 era at 3rd to 5th lowest on record for most monitors. Not a new record year, but still well within the grips of the death spiral.
If, however, the weather predicted does not emerge or the sea ice retains resiliency through it, then 2014 stands a chance of pushing above final levels seen in 2013. In such an event, end season area and extent measures may challenge levels last seen during 2005 while sea ice volume maintains between 4th and 5th lowest.
If this happens, we may need to start asking this question:
Are negative feedbacks, in the form of greatly increased freshwater flows from rivers and glaciers, starting to pull the Arctic sea ice out of a high angle nose dive and are they beginning to soften the rate of decline? Or is this just a year when weather again wagged the dog as natural variability played a trump card for the summer of 2014 but further drives for new records will follow come 2015, 2016, or 2017?
In any case, near-term sea ice forecasts remain somewhat murky, as they should given the high instability of the current situation.
Links:


robertscribbler
/ July 25, 2014A rather multi-faceted post, I admit. Will be interesting to hear conjecture on this subject. Of course climate change deniers will wrongly declare the end of global warming if sea ice loss doesn’t hit new records lows in every single consecutive year. And, eventually, we will have to deal with GIS negative feedbacks. So this subject is worth advancing now before the really big negative feedbacks (along with very bad weather) hit.
LikeLike
pintada
/ July 26, 2014What about the thermohaline circulation?
There was that recent study that showed the return flow from the gulf stream slowing by – i forget – was it 2% per year? (decade?) At any rate a shockingly high number. Obviously, this fresh water if in the right place would wreak havoc with it.
Everything is connected: the fresh water keeps the arctic frozen, but it also has to go somewhere …
LikeLike
robertscribbler
/ July 26, 2014Absolutely. The fresh water wedge goes to work set ratifying the ocean and pushing heat toward the sea floor, among other things.
LikeLike
joni
/ July 25, 2014Put me in the camp that thinks this year and probably the next few are just anomalies. An essentiall ice free arctic for more than 2 weeks at the height of summer is certainly coming within the next 20 years, probably in the next 15 and possibly within the next 5 to 10. My guess is that the first day of “ice free2 conditions will happen before the 2020 melt season concludes.
I do think that there will always be some summer ice (~5% total coverage) left for the forseeable future, but it will be too patchy and thin to mean anything for the climate.
LikeLike
joni
/ July 25, 2014meant to say “essentially” there.
LikeLike
robertscribbler
/ July 25, 2014Thanks Joni. Good thoughts.
I’m still in the camp for zero or near zero ice by 2020. But a 2013, 2014, and 2015 set of bounce-backs in volume would make me question that. This now appears possible for 2014.
LikeLike
ccgwebmaster
/ July 26, 2014I’m sticking with “any year now”. I would be a little surprised to see the ice hold on until 2020. The wrong weather setup and one suspects it could essentially all go away rather suddenly any year now.
That said – I’m not sure it automatically precludes it returning the subsequent year if conditions then favour retention over melt – the increasing heat flux (which of course is what is driving extreme weather as per Francis) means ice can form faster as the cover is less (less insulation stopping heat loss from ocean to atmosphere). That’s a negative feedback I suppose? Only if the increased ability of the system to shed the excess heat from the summer albedo shift is overwhelmed would one expect the state to become permanent? And at that time the ice free period will extend out into the rest of the season and we will see significantly more dramatic changes than to date.
LikeLike
robertscribbler
/ July 26, 2014Caveat…
I said ‘by 2020,’ but my position is still by or before 2020.
I agree, any extreme change in the weather could wipe the ice out during any summer going forward. The ice state is extraordinarily fragile and the high amplitude, meridonal jet may provide just that.
The fresh water feedback is negative at the ocean surface and in the local atmosphere. Of course, if you’re taking the entire climate system into account, it simply moves heat from the ocean surface and the atmosphere and transfers it to the deep ocean by preventing radiative cooling at the surface. In this way, heat captured by sinking ocean water is not returned to the air.
LikeLike
robertscribbler
/ July 26, 2014Ha! Latest ECMWF shows ridge ripping the summer polar vortex (admittedly a feeble cyclone) apart. Ridge building over the Beaufort, ESS, and Chukchi now.
The ice is quite fragile in many regions. If this thing forms as predicted could see large drops. Otherwise, it’s an ice cube sea.
LikeLike
ccgwebmaster
/ July 26, 2014And when it’s heavily fragmented the surface area available for heat exchange/melt is much greater.
I think we had a nearer miss in 2012 than most think, but mostly basing that statement on the fragmentation found by ice breakers that showed as solid ice on the satellites. The data we have isn’t necessarily perfect, notwithstanding that we have a lot more of it than for many other things going on.
LikeLike
robertscribbler
/ July 26, 2014Dipole over Russia, at this point, is massive. Lots of energy in this thing.
LikeLike
Griffin
/ July 26, 2014I would agree with this as well. I would expect anomalies in the progression of ice loss if for no other reason than the fact that there is supposed to be ice up there. Although we have altered the climate, we have not altered our orbit or angle to the sun and I would expect some pushback on the road to an ice free Arctic.
LikeLike
james cole
/ July 28, 2014“mean anything to the climate” I think that is a great statement. We all track and await when an Ice Free Summer comes. But what matters is when the ice is so insignificant that it losses it’s major effects on how climate operates up there. When is functional “Ice Free” going to effect our climate rather than when if literal zero ice in a part of Summer going to happen. This point is important because we could see a “wrecking ball” effect on climate well before we reach an all agreed ice free summer state. It stands to reason that decreasing ice can reach a functional state of zero before being at zero.
LikeLike
robertscribbler
/ July 28, 2014Losses have an impact on climates now, I would say…
In any case, we are seeing some pretty impressive initial drops in sea ice totals due the ridge building in from the Laptev through the ESAS and Beaufort. Looks like the ice is quite responsive at the moment.
LikeLike
james cole
/ July 25, 2014It’s good to hear the fresh water negative feedback explained. This easily gets overlooked by a superficial look at what is going on up there. We see this working in the Antarctic where more melting freshens the water making ice formation easier for the short run. It stands to reason that lots of melting up in the high arctic and Greenland can flush fresh water into those seas.
LikeLike
robertscribbler
/ July 25, 2014Thanks James. I see very few discussing the fresh water negative feedback. But fresh water outflows from glaciers will play a huge role in how climate change unfolds. The southern ocean is likely more sensitive to the negative feedback as Antarctica is essentially dumping it’s stored cold into the ocean surface.
LikeLike
Burgundy
/ July 25, 2014I think the thing to keep in mind is that once things have changed, they’ve changed, and cannot return to the exact same prior state again. So advanced sea ice extent due to negative feedbacks will not induce the same climate as we had previously at those ice extent levels. Negative feedback does not provide the equivalent outcome as a stable and predictable climate that took thousands of years to come to equilibrium. The devil is in the detail (in Chaos Theory).
So whatever is happening in the Arctic it will bring something that is new with it.
LikeLike
robertscribbler
/ July 26, 2014It’s a result of warming. Primarily the result of softening the ice sheets. The cold that was locked there for ages is broken up. Some of it ends up on the surface of the ocean. We call this the fresh water wedge and it pushes the heat deep into the water. While some may see this as a benefit, calling it sequestration, it isn’t. It basically goes to work killing the oceans and turning them into poison producing machines. Ocean stratification, deep ocean warming… In addition, it puts the hydrate stores at risk.
There are always consequences.
LikeLike
Colorado Bob
/ July 26, 2014The cost of America’s forest fires has more than quintupled in the past 20 years
Wildfires are scorching the earth and burning through the United States’ bank account.
More than 1.5 million acres of American forest have been burned to the ground so far this year, and that isn’t even all that much. Last year, nearly 4.5 million acres were scorched; the year before, almost 9.5 million.
Forest fires have destroyed some 143 million acres since 1985, or roughly 5 million acres a year, on average.
http://www.washingtonpost.com/blogs/wonkblog/wp/2014/07/25/the-cost-of-americas-forest-fires-has-more-than-quintupled-in-the-past-20-years/
LikeLike
Colorado Bob
/ July 26, 2014The Sixth Great Extinction Is Underway—and We’re to Blame
The Earth has been stripped of up to 90% of its species five times before in the past 450 million years. Now it’s happening again—and this time there’s no rogue asteroid to blame
Here’s hoping the human species likes its own company, because at the rate Earth is going, we might be the only ones we’ve got left.
http://time.com/3035872/sixth-great-extinction/
LikeLike
Andy in San Diego
/ July 26, 2014All,
This article is worth a read. But more importantly the picture of the air in downtown Yellowknife, and even more importantly the map of fires which are local to Yellowknife. If you look at that map it is pretty much out of control fires in volume and number. If the NWT looks like this all over, then all hell has broken loose.
http://www.torontosun.com/2014/07/22/yellowknife-still-under-heavy-smoke-as-forest-fires-continue-to-burn
LikeLike
Andy in San Diego
/ July 26, 2014A great resource for NWT & Cdn fires. If you look at the scale of the map, then at the size of the fires around Yellowknife you can get a decent reference to the size of the fires.
http://cwfis.cfs.nrcan.gc.ca/interactive-map?zoom=0&lon=416654&lat=1858768&month=7&day=25&year=2014
LikeLike
Colorado Bob
/ July 26, 2014Nice catch .
LikeLike
robertscribbler
/ July 26, 2014Great resource, that’s quite a large area.
LikeLike
Greg Smith
/ July 26, 2014There don’t appear to be fires in Nunavut. Is this a data collection issue or is this in fact accurate? Thanks
LikeLike
Andy in San Diego
/ July 26, 2014I’m not sure Greg. Nunavet hasn’t seemed to get the heat surge like the Mackenzie River region, however it certainly has a lower population thus the chance of fires being reported could be much lower.
LikeLike
Colorado Bob
/ July 26, 2014Forest fires: Climate change’s new normal
Few people know better than Lori Daniels that the pillars of dark smoke rising over the forests of British Columbia this summer are going to increase in both frequency and intensity in the future.
The University of B.C. associate professor knows that in part because of what she sees looking into the deep past, studying the fire scars left on trees as far back as 700 years ago when the Black Death was sweeping through Europe and the Ming Dynasty was beginning in China.
http://www.theglobeandmail.com/news/british-columbia/forest-fires-climate-changes-new-normal/article19793117/
LikeLike
Colorado Bob
/ July 26, 2014Who Is Most To Blame For Climate Change?
The average Marshall Islands resident has a carbon footprint less than 1/10th that of the average American. Yet the grassroots (that is to say, nongovernmental) viewpoint manifests itself as a subtype of universal blame that is heavy on self-blame. Based on his own surveys and interviews, as well as information publicly available in the media, Rudiak-Gould offers example after example of self-blame discourse. Repeatedly, the Marshallese lamented their own bad behavior that contributes to climate change, including driving cars and running air conditioners.
http://www.npr.org/blogs/13.7/2014/07/24/334883092/who-is-most-to-blame-for-climate-change
LikeLike
Colorado Bob
/ July 26, 2014Terra/MODIS
2014/206
07/25/2014
04:00 UTC
Fires and smoke in eastern Russia
(true color)
LikeLike
robertscribbler
/ July 26, 2014Yeah, saw this earlier today. Quite brutal.
LikeLike
Andy in San Diego
/ July 26, 2014This seems to be a good fire coverage map, you can DL KML overlays for google maps.
Covers Con US, Canada, Alaska. Wish they had coverage for Siberia too.
http://activefiremaps.fs.fed.us/googleearth.php?sensor=viirs&extent=conus
LikeLike
mikkel
/ July 26, 2014I have two points and a conjecture.
First, fresh water is both a positive and negative feedback. The increased runoff is being tied to rapid disintegration of fast-ice (ice attached to land) and on the Arctic Sea Ice thread they are commenting about pockets being opened up near Greenland that have never been open before. Interestingly, these pockets are creating very complex and strange local currents and vortices that play havoc with any known dynamics.
So while your explanation of negative feedbacks is absolutely correct, it is likely to apply most to the central basin and ice far away from land.
The second point is that the weather was extraordinarily bad in 2012. Even during that year, several of the observers said it’d be unlikely to see weather that poor for another 5-10 years unless it was a new normal caused by radically changed dynamics.
So my conjecture is that the negative feedbacks will help maintain ice area away from land, but that the lack of fast ice and warm water going into the Arctic will create massively warm water sitting underneath the ice that — when combined with its completely mobile nature — a weather year equal to 2012 could take it all out in one shot.
At that point the Arctic will start warming up extraordinarily quickly, and often get to near zero ice, but the huge amount of fresh water runoff from Greenland may put us back to where we are now in 20-30 years. Of course it will also mean that SLR will be closer to 3-5m this century instead of 3 feet and the thermohaline circulation will be in trouble. Then it’d take until 2060+ in order to overcome that cooling.
This is my understanding of what’s happened in the past when coming out of ice ages.
LikeLike
ccgwebmaster
/ July 26, 2014Do you really think fresh water run off from Greenland would increase that much more? Or would we expect to start seeing rapid deglaciation with large amounts of ice being shed into the ocean? (my understanding is that this would be far more limited with Greenland vs portions of Antarctic due to different topography underneath the ice).
LikeLike
mikkel
/ July 26, 2014Yeah I didn’t make it clear. The melting of ice around Greenland allows for rapid deglaciation because the blockages are constantly melted away. There is plenty in Greenland that can go this way, just not as much as Antarctica!
LikeLike
robertscribbler
/ July 26, 2014There is a massive zone beneath the central ice mass below sea level. Many channels plunge all the way to its heart. If Greenland completely melted out, it would look like an Archipelago surrounding a central sea.
LikeLike
robertscribbler
/ July 26, 2014This is generally my view, though the time tables, temperature effects, and rates of sea level rise are a bit different.
We probably do get an ice free year (or near ice free) by or before 2020. We probably do get rising Greenland outflows with a very strong negative feedback enough to drop temps in the area local to Greenland and the Atlantic by 2-4 C at between 1-2 meters of SLR (half coming from Greenland, half Antarctica).
My view is we hit this level of melt sometime between 2040 and 2080. This is enough to keep global temps in the range of +2-3 C through the negative feedback mechanism during this time. The upshot is that the weather is terrible. Far worse than what we are seeing now. In a potential worst case, we could advance this period into the 2030s, but that may be premature.
3-9 feet this century is enough to result in severe feedbacks at the ocean surface and in the atmosphere. Not to mention the fact that it’s a rather fast kill for ocean circulation.
We see the first vestiges of this process now.
LikeLike
joni
/ July 26, 2014http://www.thefiscaltimes.com/Articles/2014/07/25/Chikungunya-and-Other-Diseases-You-Now-Have-Worry-About
Humans in general, and those residing in the U.S. in particular, might prefer to ignore the evidence that the planet’s climate is changing. Unfortunately, mosquitoes, and the viruses they carry, are paying closer attention.
Among other things, that means things are about to get a lot more expensive when it comes to protecting the public health.
Last week, Florida health officials confirmed the first cases of the tropical disease chikungunya acquired in the United States. Chikungunya is a mosquito-borne virus native to Africa and South Asia that, until now, has never been endemic to the United States. It causes debilitating fever, and intense joint pain, and though it is seldom fatal, is very dangerous for people whose health is already compromised and can cause long-term arthritis-like symptoms.
LikeLike
Andy in San Diego
/ July 26, 2014There are 41,000 gas wells in NE Pennsylvania. 40% are or will be leaking (venting ) gas into the atmosphere and/or water table in that region alone.
Besides the photo ops of faucets catching fire and destroyed aquifers, these may pump methane into the atmosphere.
There are ~970,000 abandoned gas / oil wells in Pennsylvania.
http://theenergycollective.com/josephromm/416476/four-10-fracked-wells-pennsylvania-are-projected-fail-spewing-methane-air-and-wate
LikeLike
robertscribbler
/ July 26, 2014To one degree or another, they all leak methane. Nearly a million wells in PA alone and counting…
LikeLike
Andy in San Diego
/ July 26, 20141.1 million active frack wells. 239,247 added in 2010 (last data I could find).
Over 11 million abandoned in past 150 yrs <== hard number to find.
http://www.fractracker.org/2014/03/1-million-wells/
http://www.drillingmaps.com/us.html#.U9Pq2EDGKjE
LikeLike
Griffin
/ July 26, 2014The exclusion of fracking for nearly every environmental protection law on the books is perhaps the single most destructive act in American history.
LikeLike
robertscribbler
/ July 26, 2014It’s pretty brutal. And for what? The net effect is to delay the adoption of renewable energy sources. Yes, there’s a good talk-talk on replacing coal with nat gas. But it keeps the fossil fuel burning infrastructure in place. So when gas goes bust, guess what? It’s back to coal.
LikeLike
Griffin
/ July 26, 2014Money. There is simply no other reason than money. Big Energy wants to sell it, and Big Politics loves the money that lines their pockets as a result. As long as they keep the issue obfuscated among the general public, BAU continues and the money train keeps rolling. Let’s hand it to them, they have done a masterful job at their craft. One word enables them to slow the public reaction to the greenhouse effect more than any other, and they are so good at using it. Believe. Do you “believe” in global warming? Oh, that is a stroke of genius right there. Sow the seeds of doubt and the average american will scoff at the issue, dismiss it without a second thought. If you look at it, we have generations of folks who don’t even dare to dream when they look at the night sky. After all, to “believe” that there could ever be anything up there that we don’t know about is to invite ridicule upon oneself. It is not to compare climate change with UFO’s, but only to show that the word “believe” is generally discouraged in social circles. I hear it at work, “Oh, so your one of them Global Warming Believers…” Yes, I am actually. Anyway, in my opinion the seeds of doubt have made a select few more money than the rest of us can even imagine. And you are right, when the gas is gone, we are left with the mess.
LikeLike
1 C MAX
/ July 27, 2014Robert,
“The net effect is to delay the adoption of renewable energy sources.”
While adoption of renewable energy sources is better than fossil sources, that’s a pretty low bar to set. Renewable energy sources are no panacea for avoiding the climate catastrophe. As Kevin Anderson and others have shown, implementation of supply side energy technologies cannot reduce emissions fast enough to keep global mean temperatures below desired ceilings. Demand reduction is the primary measure required, and is also the most odious to the vast majority of the Earth’s human population. In addition, as Ozzie Zehner has shown exhaustively in his excellent book Green Illusions, there are many adverse effects associated with the full cycle of renewables production, implementation, and maintenance, not the least of which is extremely low ERoEI for some renewables options. We have the following paradox: the least effective ameliorative measures are the most desirable, and the most effective are the least desirable.
What do we do?
LikeLike
robertscribbler
/ July 27, 2014The best strategy, in my view, is to increase efficiency, reduce consumption, and shift energy reliance toward renewables all while maintaining a stance that supports population restraint. Focusing on any single issue will not get the job done, but failure to shift to renewables brings the whole house down. As such, I see it as a center of gravity RE the problem as renewables also tend to drive efficiency and reduced consumption especially if they are the soul source you’re reliant on.
LikeLike
Spike
/ July 28, 2014“An important finding … is that controls on air-pollution levels can improve agricultural yields and partially offset adverse impacts of climate change on yields. Thus, the increased use of clean energy sources that do not emit either greenhouse gases or conventional air pollutants, such as wind and solar energy, would be doubly beneficial to global food security, as they do not contribute to either climate change or increased surface-ozone concentrations.”
http://newsoffice.mit.edu/2014/climate-change-air-pollution-will-combine-curb-food-supplies-0727
LikeLike
robertscribbler
/ July 28, 2014Hmm… Sounds familiar…
LikeLike
Nicole
/ July 26, 2014We won’t be around long enough to find out when it goes. We’re going first. 2015-2020.
LikeLike
robertscribbler
/ July 27, 2014By climate change, not too likely.
LikeLike
1 C MAX
/ July 27, 2014Given BAU, one could more or less safely predict (with present global climate models) we could get global mean temps on the order of 6 C by the end of the century. Lynas has shown in his book Six Degrees that human species could go extinct at such temperatures. If one adds positive feedback mechanisms to the predictive models, the temperature increase would be accelerated, and extinction could occur perhaps one or two generations before century’s end. So, while Nicole or McPherson may be over-reaching in their estimates of when human extinction could occur, on the time scale of human civilization, the differences among the above three estimates are but a blink of an eye. Unless we institute the most stringent demand cutting measures TODAY, along with massive reforestation and vegetation-soil management, and perhaps accompanied by interim geo-engineering to keep the max temperature peaks below some acceptable ceiling, we will be history in a century or less.
LikeLike
robertscribbler
/ July 27, 2014In my view, BAU gets us to between 4-9 C depending on the strength of transient negative feedbacks — chiefly the ability of fresh water flows from glaciers to prevent ocean-atmosphere heat exchange and to drive heat into the deep ocean (also a very bad outcome, which may well be worse than the added atmospheric heat as it kills off the oceans).
LikeLike
jonzo13
/ July 27, 2014By war, more likely.
LikeLike
robertscribbler
/ July 27, 2014IMO, climate change gets us to civilization destabilization between now and the 2030s. Mass extinction in species ramping up through this century. Human extinction from climate change in the cards, but more likely post 2100.
Geopolitical conflict driven by resource scarcity and dominance seeking political regimes is certainly a risk, especially when one considers the possibility of a nuclear exchange. Unfortunately, as players for dominance grow more desperate or unilateral in their actions, the likelihood of such an exchange increases. Growth Shock is one of the reasons why dominance-based systems cannot continue without catastrophic failure in the face of current problems. Systems based on broad cooperation will be needed to avoid the geo- political worst case.
LikeLike
Paul from NSW
/ July 27, 2014Robert putting on your fictional hat for a moment, do you think a, say, 9C rise would be an extinction, if some of humanity had moved under ground? Assuming the correct mix of technologies, food from Algae/Azolla/mushrooms etc, power from Thorium/Biogas/Solar/Wind, light from fibre optic cables, manufacturing from 3D printing, automated logistics etc.
The temperatures at the start of the Tertiary hit perhaps 27C average and mammals survived (albeit small ones). A lot of them were burying species.
I am trying to understand the extinction connection with temperature. I understand the issues with WBGT but those temperatures would not be experienced underground. Is it an assumption of BAU in our current living arrangements? Or is it an assumption of a multiplying effect on other systems, such as phytoplankton?
The underground scenario is not really that far fetched considering how quickly they achieved it in N. Korea. Necessity is the mother of invention, and with 685,000 tonnes of TNT dropped on them, they had the necessity.
LikeLike
robertscribbler
/ July 28, 20149 C is only survivable through extreme adaptation. Many surface regions would be uninhabitable, so quite a lot would need to move below ground. In addition, at those temps you start to have to deal with large hydrogen sulfide emissions from the ocean.
LikeLike
Paul from NSW
/ July 28, 2014Robert, I read your post
It was a brilliant blend of mythology, science and humanity. Also very disconcerting.
LikeLike
robertscribbler
/ July 28, 2014In a past life, I was the Editor for, among other things, a prominent chemical and biological weapons response guide. In short, the stuff is brutish and ugly. Warm the Earth enough and that’s what you end up with on a massive scale — ancient microbes enabled to conduct chemical warfare against higher life forms on a massive scale. It was probably the most violent killing mechanism during the Permian and we’re playing with the trigger now.
9 C is a terrible world. And if we get to 9 C by the end of this century, we’re probably looking at 14-18 C long term. That’s right in the range of the worst hothouse event in geological reckoning. We really don’t want to go there. It’s an ugly world.
LikeLike
mickyle
/ July 26, 2014Prepare yourself, Nicole, for some deserved ridicule. Though first I’ll cheerfully acknowledge the upside of your prediction: you now don’t have to lift a finger – do you? – to try to change this catastrophe in progress we’re all going through. Such beliefs are a cheap and easy get-out-of-caring card.
LikeLike
Weir Bohnd
/ July 27, 2014If the cretins in the District of Criminals make a sufficiently serious miscalculation in their brazen attempt to expropriate Ukrainian gas and oil, Nicole’s assertion could prove to be right on. If it is of any interest, the report on one 10 year climate model run of a post nuclear exchange is available here.
Click to access RobockNW2006JD008235.pdf
LikeLike
pintada
/ July 27, 2014The obvious question mickyle is what are you doing that is so effective that you can ridicule anyone?
I am serious, and not just asking to re-assign the guilt. So, don’t even bother answering if you don’t want. I’ll even help: I do nothing effective and I have never done anything that made one tiny difference. On the other hand, maybe our friend Nicole is doing everything possible as am I.
But your work is different? Wow! What do you do?
LikeLike
robertscribbler
/ July 27, 2014Go vegan. It helps.
LikeLike
todaysguestis
/ July 26, 2014Abrupt Climate Shifts in the Past Offer Warning for Future
http://www.scientificamerican.com/article/abrupt-climate-shifts-in-the-past-offer-warning-for-future/
LikeLike
robertscribbler
/ July 27, 2014Thanks TG. Good one.
LikeLike
Andy in San Diego
/ July 26, 2014An item of concern on the fracking issue is the short lifespan of the wells. Where the original estimate gave lifespans of 15+ years per well, they are running out in the 5 to 10 year range.
This seems logical as the lifespan is a function of the amount of high pressure liquid distribution within the geology. One can only press this material so far before natural forces can not be overcome.
The side effect of this is increasing the number of wells, and increasing the frequency of wells. Even though the lifespan is ~1/3 of the original estimate they are still profitable, thus the shortened life span does not slow them down, it allows for more (200% more?).
The average injection includes roughly 4.4 million gallons of water. 19,000 wells for high pressure fracking put in place in 2012. That is 83,600,000,000 gallons of water (~83 billion gallons). An acre foot is ~271,000 gallons. This is 308,487 acre feet. Lake Michigan contains ~2.6 million acre feet of water. This represents roughly 10% of the volume of Lake Michigan worth of water requirement brought online per year.
So if the life span is ~10 years, and we call the 4.4 million gallons a lifetime of well
requirement, then the equivalent of Lake Michigan is being pumped at up to 9,000 psi underground as a mixture slurry including sand & chemicals (the 4.4 million is just the water).
This is occurring in drought challenged areas as well. Some farmers are fighting for the water (generally losing as who owns the lawyers with big pointy teeth), some are finding it more profitable to sell the water and not farm.
Now, with a ~40% leak rate, that is 1.04 million acre feet of chemical stew plus methane being compromised into the water table and above ground including atmosphere. Over the 10 years, this is ~4 Lake Michigan’s.
No wonder these numbers are hard to find, and never put into the same document.
LikeLike
robertscribbler
/ July 27, 2014It’s a nightmare. Even the profitability is questionable. Chesapeake, for example, is a basket case.
LikeLike
Griffin
/ July 27, 2014The lessons learned in America have apparently not yet made it across the pond. Fracking licenses are being “fast tracked” in England now.
http://www.thesundaytimes.co.uk/sto/news/uk_news/article1439294.ece
LikeLike
robertscribbler
/ July 27, 2014Looks like we’ve got a fracking methane monster to contend with in addition to an Arctic methane monster. If this stuff goes global, atmospheric methane may well see another jump from human activity.
LikeLike
pintada
/ July 27, 2014“Even though the lifespan is ~1/3 of the original estimate they are still profitable, …”
No sir, they are not profitable. It is the fracking bubble created from spin, debt and lies. Peak oil just like anthropogenic global warming is a fact supported by existing data. If you haven’t spent the hour to watch this presentation, you should.
http://energypolicy.columbia.edu/events-calendar/global-oil-market-forecasting-main-approaches-key-drivers
LikeLike
robertscribbler
/ July 27, 2014Have to agree with Pin that we have a bit of a bubble situation going on here. Europe would be far better off financially going to renewables.
LikeLike
Apneaman
/ July 27, 2014Not having false hope, is not the same as not caring.
LikeLike
pintada
/ July 27, 2014Indeed.
LikeLike
Andy in San Diego
/ July 27, 2014I was curious whether the acidity changes and dilution of salt in the oceans may affect evaporation and condensation in the precipitation cycle. I didn’t find any direct research on this (doesn’t mean there isn’t any, just means I didn’t find any).
It appears that water ph itself is not a significant variable for evaporation. This would be in respect to the behavior of the water only.
However, affinity to minerals change with ph shifts, thus the end result (“water with stuff”) would in fact behave differently. As the water become more acidic, the ability to dissolve & hold minerals (ie: pB,Cd etc..) increases.
Sodium Chloride appears to be neutral to the acidity change issues underway. So this may indicate that dilution of the oceans due to fresh water injection may not affect ph further. The CO2 is doing a bang up job on it’s own.
The increase of minerals in the solution (ocean water) in conjunction with lower density due to temperature changes may affect ability to evaporate. Lower density increases this, unsure of the effect of a slightly high density of minerals / metals. The increased inclusions or minerals may affect the binding, clumping behavior of the precipitation itself perhaps as well.
Thus perhaps the ph change may play a part in that it affects affinity between minerals and water which come into play later in the precipitation cycle.
However, the info I have scraped up may not be directly relevant or obsolete. Or I may be completely off my rocker. If anyone knows otherwise, do chime in.
Click to access 389_Duffey.pdf
http://www.epa.gov/superfund/remedytech/tsp/download/issue14.pdf.
LikeLike
dtlange
/ July 27, 2014Andy, I was wondering many of the same things myself. Thanks.
LikeLike
Mark from New England
/ July 27, 2014How hot will your city / area get in the century ahead? Interesting interactive at Climate Central:
http://www.climatecentral.org/news/co2-hot-days-u.s.-17814
LikeLike
robertscribbler
/ July 27, 2014Brutal.
LikeLike
twemoran
/ July 27, 2014Weir – I hope your assessment of the Ukraine situation proves wrong. That said we are certainly poking a sleeping bear with a sharp stick.
I’ve come to see all of Washington’s actions over the past few decades as a desperate attempt to gain control over the world’s energy supplies. Each atrocity more egregious than the last.
Is it possible that TPTB are not motivated by ideology or even money but are instead planning ahead for the time when global society breaks down & those with troops on the ground at the various well heads are the only ones with access to the oil and gas that will fuel whatever follows? Climate change isn’t some boogie man that appears in the future. If you live in Somalia, Iraq, Libya or now Ukraine the results are already being felt. Rule by Law has been succeeded by Rule by Strength. National Sovereignty has been superseded by International Piracy. Aren’t these the things that we spoke of as the likely results catastrophic climate change?
Those of us that still have lights that respond to the flip of a switch may not be aware of it yet, but the displaced Somali or the Iraqi trembling in fear that ISIS might open the dam and wash his city into the desert has already experienced some of our worst projections. We don’t have to look to the future to see what’s in store for us, we just have to look around.
Terry
LikeLike
robertscribbler
/ July 27, 2014Another issue that would be better managed by shifting to renewables. The quest for fossil fuel energy dominance is too dangerous geopolitically.
Fossil fuels:
1. Dirty and environmentally and climatological lay devastating.
2. Geopolitically and economically dangerous, conflict generating and destabilizing.
3. Depleting.
A hellish mix.
LikeLike
Weir Bohnd
/ July 27, 2014If controlling wellheads is the name of the game, we clearly have no skill at it. The report card sez that everywhere we go the boogeymen end up controlling the wells and the pipes. The other common denominator is that the oily host country suffers a severe reduction in consumption of oil and gas. An example of Steve Ludlum’s “conservation by other means.” If that is the best idea TPTB have on their menu, you know they will eventually have to start working their way up the food chain and bomb the bejezus out of bigger and wealthier countries that are only consumers. That is likely to be the time when Plutocratic thoughts turn unreservedly to visions of mushrooms (clouds that is).
Paul Craig Roberts reports that when he questioned several legislative and diplomatic persons about studies such as the one I linked above. None had ever heard of any such thing.
The plutocrats do not live on oil, they live on the vig. It is we who live on the oil and we who pay the vig. I imagine that even they know the oil runs out someday. What they care about is staying on top of the heap. When future proto-wars fought with sticks and stones, per Einstein’s prediction, erupt they probably hope their heirs will be in a position to rent the sticks and stones to the combatants.
LikeLike
robertscribbler
/ July 28, 2014Oh, there’s a whole brand of plutocrat entirely sunk in oil/gas/coal ownership and actively trying to deny access to alternative energy systems through global market dominance and political gamesmanship. The struggle to kill renewable sources has been ongoing since their inception.
In any case ‘plutocrats’ don’t all think alike or act in a unified fashion, it’s more just factionalized groups pursuing narrow interests.
US policy attempting to increase the flow of fossil fuels globally and to keep the price low has been an abject failure. We’ve wasted huge amounts of treasure and life in this crusade and it’s time to have done with it. We can cheapen the price of energy by moving to other sources. Fossil fuels are a resource trap spiked with an environmental calamity.
LikeLike
Andy in San Diego
/ July 27, 2014Pintada,
Thanks for that link.
If one summarizes and uses analogies, it is a repeat of the housing bubble with holes in the ground. Similarity pretty much ends there.
Now in the housing bubble, 1/2 finished McMansion tracts were abandoned and lots of foreclosures. Will they do the same with wells? You can bulldoze a pile of 2×4’s, but to leave a partially finished well or low producer by a bankrupt driller leaves whom (if anyone) to clean that up.
I’ve seen a wide price range on dealing with one well to decommission it. With a driller / lease holder walking away (cheaper to pay a small fine than fix it) it leaves the public to deal with it. And I doubt that would occur.
That could leave a lasting legacy. If our parents were the greatest generation, does this make us the worst?
LikeLike
pintada
/ July 27, 2014Andy, that presentation is one of the more interesting that I’ve heard, or read in the past few months. I think the gentleman has some good credentials, and the data looked good to me. So, it is a privilege to share it with you.
I’m not particularly worried about the wells finished or unfinished since they are just holes in the ground that likely will leak a little methane. Nasty, and sloppy sure, but not the worst insult the planet has suffered. Not as bad as actually completing the well in my opinion.
I saw another talk by oil men that left me with similar conclusions. Their guess was that the fracking bubble would burst at some point near 2020. Some say 2016 … . For this comment I will assume some time between 2016 and 2025:
1. there will be a vast amount of debt that simply cannot be repaid;
2. the banks will need to be bailed out again, but the government will be unable;
3. at the same time, the lie that no oil assets are stranded will be obviated, and;
4. the stock value of the major oil companies will take a hit or collapse.
The good news is that a drop in global GDP of say 5% per year for 5 years starting in the early 2020’s might just prevent NTE due to population overshoot and methane clathrate eruptions, so I’ve got my fingers crossed that the depression happens. (If somebody figures out how to prevent the above depression and we just keep going, well … .)
Andy asked: “That could leave a lasting legacy. If our parents were the greatest generation, does this make us the worst?”
I think it makes us the generation, neither the best nor worst, that faces some simple facts, which are:
1. Populations in overshoot must decline. If the overshoot is extreme (i.e. an extra 6 billion people that have exhausted their resources), the population decline is equally painful.
2. There are immutable physical and practical laws – the four laws of thermodynamics, and the law of diminishing returns for example – that cannot be violated.
3. Humans are not special and, (the religion of perpetual progress not withstanding) we are subject to those laws.
(NTE – near term extinction – as used colloquially – as far as I can tell – doesn’t necessarily refer to the death of every person. No doubt under even the worst conditions there will be a few people eking out a living (by eating jellyfish caught out of the arctic ocean for example) somewhere on the planet.)
Here is the link again so people will know what we are talking about:
http://energypolicy.columbia.edu/events-calendar/global-oil-market-forecasting-main-approaches-key-drivers
See also:
Joseph A. Tainter. The Collapse of Complex Societies (New Studies in Archaeology)
LikeLike
Andy in San Diego
/ July 27, 2014“Populations in overshoot must decline.”
Agree 100%, we have passed the equilibrium point with planetary renewable resources in the late 70’s / early 80’s. We are consuming the planetary production (plants, agriculture, fish etc…) at close to a 150% rate at this time. We are now in a race to pillage resources, like drunks fighting over the last beer.
We lost the opportunity to transition to new energy sources some time ago (90’s perhaps?). Had we done so at that time, we could have transitioned without such an economic hit. We would have likely seen new industry, spear headed by the energy companies as that is their expertise.
As you stated, we now have to dent the economy to slow this down. The denial industry has created a self fulfilling prophesy with their “you will hit the economy to fix this thus lets not do anything different” meme.
LikeLike
todaysguestis
/ July 27, 2014Ten people die, 1,400 rushed to hospital amid heat wave
The city of Higashiomi in Shiga Prefecture clocked a record-breaking 38.8 degrees, and the mercury reached new all-time highs at 13 other locations, including Obama in Fukui Prefecture, at 38.6 degrees.
http://www.japantimes.co.jp/news/2014/07/27/national/much-japan-swelters-summer-heat-wave/#.U9VJE6gwLUh
LikeLike
pintada
/ July 27, 2014What was the wet bulb temperature? Can it be calculated using the humidity and wind speed, or must it be measured? I’m looking for that famous 35 degree wet bulb temp.
LikeLike
robertscribbler
/ July 27, 2014In the range of 30-32 C. We probably won’t see 35 C wet bulb until ocean temps approach 35 C. Probably.
LikeLike
pintada
/ July 27, 2014Got it. Thanks.
LikeLike
Paul from NSW
/ July 27, 2014Interesting link to the relationship of labor capacity and WBGT.
http://www.gfdl.noaa.gov/news-app/story.77/title.heat-stress-reduces-labor-capacity-under-climate-warming/menu./sec./home.
LikeLike
robertscribbler
/ July 28, 2014Say goodby to productivity without air conditioning.
LikeLike
Andy in San Diego
/ July 27, 2014Greenland melt starting earlier, ending later.
LikeLike
robertscribbler
/ July 27, 2014Saw this earlier in the week. Well worth reading. Strong Greenland melt this year. Very strong edge melt.
LikeLike
Andy in San Diego
/ July 27, 2014Yup, NE has been the main feeder this summer. Very odd.
LikeLike
todaysguestis
/ July 27, 2014First observations of methane release from Arctic Ocean hydrates
Just a week into the sampling program and SWERUS-C3 scientists have discovered vast methane plumes escaping from the seafloor of the Laptev continental slope. These early glimpses of what may be in store for a warming Arctic Ocean could help scientists project the future releases of the strong greenhouse gas methane from the Arctic Ocean.
http://www.su.se/english/research/leading-research-areas/science/swerus-c3-first-observations-of-methane-release-from-arctic-ocean-hydrates-1.198540
LikeLike
Andy in San Diego
/ July 27, 2014That is a terrifying read.
My question is as follows for you folks (I value your opinions):
We have said for some time “if we don’t do anything, we’ll reach a tipping point”. Are we IN the tipping in now? To me, 2014 looks like we are entering/undergoing the tipping.
LikeLike
robertscribbler
/ July 28, 2014Some tipping points are crossed now. Looks like we hit about 2-4 C warming even if we go cold turkey on fossil fuel emissions. The window is rather narrow at the moment and if we wish to helpfully mitigate, not only are we going to have to cease fossil fuel emissions soon, we are going to have to engage in atmospheric capture and probably change the way we use land. In the end, we’ll also need long term population restraint.
LikeLike
Colorado Bob
/ July 27, 2014todaysguestis / July 27, 2014
Background info –
Scientists Igor Semiletov and Natalia Shakhova have been busy getting ready for an international research expedition across the Arctic Ocean that will begin next week and continue through October.
Semiletov and Shakhova, both of the University of Alaska Fairbanks International Arctic Research Center, will join the Swedish-Russian-U.S. Arctic Ocean Investigation of Climate-Cryosphere-Carbon Interactions.
With 80 researchers on board Sweden’s icebreaker Oden, SWERUS-C3 is the largest international research expedition in which Shakhova and Semiletov have participated.
The 100-day expedition will take place in two legs. From July 6 to Aug. 20, the Oden will sail from Tromsø, Norway, to Barrow, along the coast of the Russian polar sea. With Semiletov as chief scientist, researchers will study methane held in permafrost and gas hydrates in the seas above the East Siberian Arctic Shelf.
The second leg will follow a course from Barrow to Tromsø over the Lomonosov Ridge, an underwater mountain chain near the North Pole. Researchers will investigate how relatively warm Atlantic water flows and how carbon is transported from the East Siberian Arctic Shelf seas to the deep seas of the Arctic Ocean.
Throughout the expedition, researchers will also study the role of arctic clouds in the climate system.
To learn more about the SWERUS-C3 program, visit http://www.swerus-c3.geo.su.se/
http://www.thetundradrums.com/story/2014/07/24/national/uaf-scientists-to-join-arctic-ocean-expedition/1542.html
LikeLike
lesliegraham1
/ July 28, 2014Not much actual information in that article,.
For example; what on Earth does the term “vast” signify in that context.? It’s simply meaningless. Vast compared to what? A walnut?
And “50 times background levels” – also meaningless if you don’t know what the ‘background level’ is in the first place. Is it one part per trillion increased to 50 parts per trillion?
And if the volume is indeed “vast” by any conventional understanding – ie; significant, then why isn’t it showing up on NOAA’s methane monitoring equipment at Mauna Loa?
Fair enough the methane levels as measured at Mauna Loa are rising steadily, but there is no significant recent ‘spike’ that one might expect to see if the emissions were “vast” compared to – say – a mountain.
Very frustrating reading. Still none the wiser as to how serious this is or even what the rate of release is. They should print their best estimate in terms of cubic kilometres or some internationaly recognised unit of measurement.
LikeLike
robertscribbler
/ July 28, 2014They also act as if the ESS observations of substantial Arctic Methane releases did not exist.
In any case, rumblings of methane releases from the Laptev have been ongoing for some time, so it’s good to get even partial observations.
LikeLike
Colorado Bob
/ July 28, 2014lesliegraham1 / July 28, 2014
Scientists Igor Semiletov and Natalia Shakhova have pioneered this field , the last time they were in the field , they found methane plumes larger than a kilometer in diameter.
I am certain this expedition is visiting were they have done previous observations.
If you google them, you’ll get a ton of info. on their past work.
As for “background levels” , I’m almost certain they are referring to the area being sampled,
As for what they are finding, it’ll take time to see what’s going on, but it don’t look good
todaysguestis / July 27, 2014
Thanks for catching this , I for one, am extremely interested in this expedition. The only thing I had seen before, was some Dutch girl at sea for the first time, with a lot of golly gee wizz on her blog.
This is one hell of an expedition, and they’re sailing their asses of.
The interactive map of where they are :
http://oden.geo.su.se/map/
LikeLike
robertscribbler
/ July 28, 2014S&S primarily focused on the ESS. This study is in the region of the Laptev.
LikeLike
Danabanana
/ July 28, 2014“And if the volume is indeed “vast” by any conventional understanding – ie; significant, then why isn’t it showing up on NOAA’s methane monitoring equipment at Mauna Loa?”
CH4 shows up every summer as Noctilucent Clouds as the residual H2O left by Hydroxil process. NLC’s have been growing in intensity and extent of late years… Without increased CH4 you wouldn’t get displays of NLC’s like we currently do.
LikeLike
Paul from NSW
/ July 28, 2014My understanding is that the quantities of atmospheric hydroxyl at the poles is actually relatively small.
LikeLike
robertscribbler
/ July 28, 2014Good point.
Also, we see a growing overburden in the northern polar region which is evidence of a rather substantial local emission.
LikeLike
lesliegraham1
/ July 29, 2014“If you google them, you’ll get a ton of info. on their past work.”
Iv’e read every single word they’ve ever published at the time that it was published.
It still doesn’t explain what ‘vast’ means.
Even the last time they were up there they at least said things like “plumes a kilometre accross’ so it was just possible to get some kind if visualisation even if it was impossible to ascertain if these kilometer wide plumes were new or just part of an ongoing ancient cycle.
I want comparative FIGURES damn it – not ambiguity..
This subject is way too important – possibly the most important piece of news on Earth today!But who can tell what they are seeing? I certainly can’t. If the scientists don’t know how to write a decent unambiguous press release they should employ someone who does.
LikeLike
robertscribbler
/ July 29, 2014Single plume composed of hundreds of seeps. A few kilometers across.
It’s about 200-500 meters deep or more at the lowest point, but seeps in the upper slope are up to 60-70 m down. So it ranges a good deal along the slope system.
Bubbles hit the surface, which is something that you don’t typically get direct observation of outside of ESAS.
LikeLike
Paul from NSW
/ July 29, 2014I wonder if some of the methane venting at shallower depths is not from geological gas forming hydrates but organic permafrost from the Azolla event.
http://en.wikipedia.org/wiki/Azolla_event
What do you think?
LikeLike
robertscribbler
/ July 30, 2014Certainly possible.
LikeLike
Paul from NSW
/ July 30, 2014On a side note I hadn’t heard of Azolla prior to a few weeks ago. Fascinating plant. Symbiotic organisms give me warm and fuzzy thoughts.
LikeLike
robertscribbler
/ July 30, 2014Life systems involve so much cooperative inter-linking. It’s good to see it in action.
LikeLike
Andy in San Diego
/ July 27, 2014Question:
As the potential El Nino is having trouble strengthening, and/or is becoming less of a probability, it leaves me with a question.
Is El Nino / La Nina a function of a relative delta from the current observed water temperatures? Or is it a delta from a static value (say 1990’s or whatever).
My guess (subject to being 100% wrong) is it would be a function of the current temperature and current delta from that current norm in addition to a function of the atmospheric norm versus the atmospheric delta.
I am curious if any of you know or are aware of research into this issue. Also, has anyone done any work on the correlation of the trade winds along there which impact this behavior in relation to the change of viscosity of the atmosphere as it is underway?
Basically, does a viscosity change in the atmosphere due to composition changes impact the response, behavior with their impact on ocean currents (and otherwise perhaps)?
LikeLike
Andy in San Diego
/ July 27, 2014“My guess (subject to being 100% wrong) is it would be a function of the current temperature and current delta from that current norm in addition to a function of the atmospheric norm versus the atmospheric delta.”
These imply current values and deltas, not a historical pegged value. It could be surmised from the post otherwise. I had not been explicit without leaving opportunity for the statement to misrepresent itself, my apologies.
LikeLike
Griffin
/ July 28, 2014For what it is worth, Dr. Michael Ventrice from WSI posted a pic of CFSv2 forecast Nino 3.4 SST anomalies which shows a projected increase from the end of this month and peaking near 1.5°C in January. He has stayed the course on this year producing El Nino conditions, and cautions against looking into seasonal variability within the greater picture. I guess time will tell if the models are correct though.
LikeLike
robertscribbler
/ July 28, 2014+1.5 C would be a strong El Niño.
NOAA is predicting weak to moderate, but is still showing an 80% probability.
We have some prominent researchers predicting a fizzle.
The atmosphere/ocean interchange at this time is ambiguous. We have relatively substantial atmospheric conditions favorable for El Niño, but the subsea environment has cooled and awaits another strong Kelvin Wave. So, at this point, most indicators in the Equatorial Pacific are ambiguous.
LikeLike
robertscribbler
/ July 28, 2014Equatorial Pacific is at around +0.65 C anomaly now global SST is at +0.95 C positive anomaly. The highest deltas are in the North Pacific, the North Atlantic, and the Arctic.
ENSO is on the positive side of neutral and PDO has been running positive for about a year. This has an effect on overall SST. If we gat an EL Niño on top of current conditions, the global anomaly would probably hit between +1.1 to + 1.7 C SST for some time. Contextually, that’s a raging variation to the hot side.
As for El Niño prospects, the strong Kelvin wave has dumped a good amount of its heat already. However, we have had pretty persistent westerlies. If this continues, another Kelvin wave and an El Niño may be on the way. If not, it’s a fizzle.
Model forecasting this year has been a real bear… So it’s wait and watch for conditions as they emerge.
LikeLike
pintada
/ July 28, 2014Is this your chance for a Nobel prize, or am i full of it?
Oh, wait. I should propose and share the brilliant theory first … You are welcome.
SO. This El Nino stuff all depends on wind. The trade winds must fail and be replaced with west to east winds of some strength and duration. Then there is this PDO thing that I’ve read about, but still do not get … anyhow, wind, wind, wind. But the jet stream is all weird and slow for the first time (probably) since the Eocene. Given a weird jet stream is an El Nino impossible?
LikeLike
robertscribbler
/ July 28, 2014The northward movement of the Jet in both hemispheres and the meridonal flows (waviness) have allowed for the formation of very strong high pressure ridges, especially over the oceans. In recent years, this strongly reinforced the trades.
Such an atmospheric pattern biases the heat transfer process so that more of the heat caused by the human greenhouse gas overburden is driven into the ocean.
In a normal climate warming if surface waters and a transfer of warmer deep water across the Pacific and upwelling of that water to the surface generates a kind of atmospheric feedback that facilitates strong ocean to atmosphere heat transfer. The main atmospheric mechanism is the propagation of westerlies which reinforce and drive the heat transfer switch.
In this way, the hot ocean sets off feedbacks that rebalance ocean-atmosphere heat energy periodically.
Would strong atmospheric heating overwhelm in the back and forth between El Niño and La Niña?
To prove that, we would have to see strong Kelvin waves continue to be suppressed for some time.
It’s possible that we instead see the ocean heat up until the heat feedback it powerful enough to collapse the new, more intense, atmospheric pattern. And that response would be worse than the El Ninos we are used to seeing.
Historically, ocean heat breaks out into the atmosphere. This process generates El Niño. I think we’re premature to say this process is entirely shut down. However, there does appear to be a higher barrier for El Niño break out at this time. We should have had El Niño last year. But the relatively energetic Kelvin wave was snuffed out. We should have had El Niño this year and probably by now, but the very strong Kelvin wave running across the ocean was not powerful enough to initiate strong atmospheric feedbacks. We have some of those atmospheric feedbacks now, somewhat late in the game.
So, for recent years at least, it seems El Niño is struggling to break out and that a changed atmospheric pattern and atmosphere-ocean heat balance may be effecting this outcome.
LikeLike
pintada
/ July 28, 2014A truly interesting possible phenomenon – thanks for the response. Bender has a discussion on the temperature relationship between the equator and poles during the Eocene and your response gave me a reason to review it.
“Data in figure 6.2 indicate that, during the Eocene, Earth was warmer by ~5C in the tropics and 30C or more at certain high-latitude locations. In calculating global temperature, we need to weight the low latitudes more, since half of Earth’s surface is within 30 degrees of the equator. Thus, a reasonable estimate for Eocene warming compared with modern conditions is ~7C based on the reconstruction of Greenwood and Wing (1995), and ~14C based on Huber and Caballero 2011).
…
“A number of ideas has been advanced to explain the high latitude warming. One is that more heat was transported from the tropics toward the poles. A second is that increased Paleogene vegetation lowered the albedo of high latitude continents. A third is that wintertime clouds at high latitudes would have exerted a strong greenhouse warming.
I don’t like the vegetation or cloud ideas, because it seems to me that cooling the equator would be more important, and more applicable to the problem than heating the poles. After all, “half of earth’s land surface is within 30 degrees of the equator” and the sun shines there all the time, not just in summer. Of course, the actual scientists working on the issue disagree since there is less energy differential to drive ocean currents or wind. In fact the only proposed mechanism currently available that would move enough energy would be in the stratosphere.
“Kirk-Davidoff et al. (2002) suggest that dynamic changes would lead to more cloudiness in the winter polar stratosphere. They argue that higher Paleogene CO2 would lead to warmer climates that would, in turn, slow down the circulation of the stratosphere. Air entering the stratosphere in the tropics would be warmer and would thus have a higher vapor content. On the other hand, the polar stratosphere would be colder, and thicker polar stratospheric clouds would condense. A simulation showed that this mechanism could deliver a radiative forcing of about 15 W m–2, which again would be quite significant.”
So, I think that I am hearing that the El Nino/La Nina phenomenon is on its way out since (except for huge tropical cyclones) there wouldn’t be energy to produce the winds required to make them work. I think you offered that as a rather nasty possibility above. Am I wrong to extend this to mean that the planet in a few hundred years (the timing is hard to even guess at) is looking at SST at the equator of 35 – 40C, anoxic seas at depth, and giant cyclones occasionally bringing that anoxic water to the surface?
Text in quotes is from:
Bender, Michael L. (2013-08-25). Paleoclimate (Princeton Primers in Climate) (Page 110 – 116). Princeton University Press. Kindle Edition.
LikeLike
robertscribbler
/ July 28, 2014Yes. But you don’t need cyclones to bring the anoxic waters to the surface. Methane and hydrogen sulfide pressure from below raises the chemocline and does that without Ekman pumping.
RE shutting down El Nino. That’s a tough call at this point. We don’t quite see how all the changes stack up. At least for now, we have an expanding Hadley Circulation and an increasing prevalence of Meridonal flows.
One last point to consider, the net effect of ghg accumulation is to reduce the temperature differential at the poles. The increasing overburden of ghg reduces the net effect of solar heating at the equator by increasing, overall, the rate at which the heat is re-radiated. Nights and winters warm to greater degrees than days and summers. Add in water vapor and a few cloud feedbacks and it’s not too hard to imagine why the poles were so warm during the Eocene.
In any case, equatorial down-welling due to ocean surface warming there is bound to drive severe atmospheric changes. What we see now probably isn’t even a rough corollary. In the end, weather becomes very stagnant, but it probably goes through a period of extreme storminess as the ice sheets melt.
LikeLike
pintada
/ July 28, 2014And this conversation brought to you by an administration policy that will not allow, “Its all because Al Gore is fat.” to be offered as a scientific issue. Thank you again, Robert!!
On subject though, me thinks if I was a modeler I would look very hard at what happened the last time the earth went through this and would try to add that insight to the model. Extrapolations of past behavior makes less and less sense every day.
New post. WooooHoo.
LikeLike
robertscribbler
/ July 28, 2014NCAR does this a bit. IMO, their models tend to be more realistic.
LikeLike
robertscribbler
/ July 28, 2014In any case, the notion of coal gasification is about as terrifying to me as Arctic methane release. The question is what gets to you first, failed human nature or Mother Nature?
LikeLike
Colorado Bob
/ July 28, 2014RS –
Have a double link in the spam filter RE the SWERUS-C3 scientists.
LikeLike
robertscribbler
/ July 28, 2014Got it!
LikeLike
robertscribbler
/ July 28, 2014Lots coming out of this expedition already.
LikeLike
Colorado Bob
/ July 28, 2014The best part, they are on the icebreaker “Oden”
The Norse gods are rolling in their graves.
LikeLike
robertscribbler
/ July 28, 2014Frost and fire giants too.
LikeLike
robertscribbler
/ July 28, 2014Canadian wildfires looking very intense in the MODIS shots today.
LikeLike
Colorado Bob
/ July 28, 2014robertscribbler / July 28, 2014
S&S primarily focused on the ESS. This study is in the region of the Laptev.
One does not have S&S , and not visit their previous sites.
I got 2 dollars that says they are sailing East for the next 3 weeks. I promise you they visit these locations, after all they came from Sweden , they are moving West to East. It’s 100 day cruise. And they are sampling their asses off. This is a very dig deal.
LikeLike
robertscribbler
/ July 28, 2014This year. Previously, their expeditions focused on ESS.
LikeLike
Colorado Bob
/ July 28, 2014The best part, they are on the icebreaker “Oden”
The Norse gods are rolling in their graves.
What a beast
LikeLike
Colorado Bob
/ July 28, 2014LikeLike
Colorado Bob
/ July 28, 2014The Oden is a large Swedish icebreaker, built in 1988 for the Swedish Maritime Administration. It is named after the Norse god Odin. First built to clear a passage through the ice of the Gulf of Bothnia for cargo ships, it was later modified to serve as a research vessel. Equipped with its own helicopter and manned by 15 crew members it has ample capacity to carry laboratory equipment and 80 passengers, functioning independently in harsh Polar ice packs of the Arctic and Antarctic seas. It was the first non-nuclear surface vessel to reach the North Pole (in 1991), together with the German research icebreaker RV Polarstern.[3][4] It has participated in several scientific expeditions in Arctic and Antarctica.
Wiki
LikeLike
robertscribbler
/ July 28, 2014Ugly looking thing.
LikeLike
Colorado Bob
/ July 28, 2014.
We have 89 more days of data.
Coming.
Never mind the words.
LikeLike
robertscribbler
/ July 29, 2014Amazing expedition.
Want to thank you for all the links, very helpful. I had not initially realized this was the S&S voyage for this year. A spate of the absentminded professor’s disease.
In any case, I’ve dug in and believe this is one hell of a story. I wonder if the large-scale sea ice recession we see in the Arctic this year is due to deep water upwelling associated with the warm water current and the methane plumes the expedition is tracking.
LikeLike
Tom
/ July 28, 2014Robert, all:
http://www.independent.co.uk/environment/el-nino-weather-phenomenon-will-strike-this-year-met-office-warns-9577018.html
El Nino weather phenomenon will strike this year, Met Office warns
India and Australia are likely to be hit the hardest but the fallout could also be felt in Britain, where the last El Nino event in 2009/10 contributed to the heavy snowfall in the UK that winter.
The term El Nino relates to feedback between the atmosphere and ocean that occurs every two to seven years and can wreak havoc on the weather system, inflicting droughts and excessive rainfall across the world.
“El Nino is associated with colder than average winters, but is only one of the players that determine the weather,” a Met Office spokesman said.
This means that while the phenomenon increases the chance of a cold winter, and was found to have contributed to the freezing conditions across Northern Europe last time it struck, it was by no means certain that the UK would become blanketed in snow.
In a report that concludes the event is “probable”, the Met Office predicts that the worst effects of the El Nino will be felt in India, during the forthcoming three-month Monsoon season.
“The risk of a poor monsoon is two to three times greater this year than normal. So far the progress of the Indian monsoon rains bears this out, with a late and weak start to the season with less than 50 per cent of normal rainfall in June over much of India,” a Met Office spokesman said.
The prospect of a weak monsoon season has raised fears of low crop production and rising food prices.
LikeLike
robertscribbler
/ July 28, 2014Oh the Monsoon has certainly been significantly weakened this year due to a Pacific Ocean shift toward El Niño.
NOAA still has 80% chance of El Niño formation, but the atmosphere-ocean interplay is now a bit ambiguous.
The fact that we see El Niño like effects prior to El Niño emergence or even without a full blown El Niño is a pretty clear sign of how much we’ve pushed the climate system.
Been tracking this for months and will keep you guys abreast of any shifts.
LikeLike
dtlange
/ July 28, 2014I speak from a sailor, naturalist, photographer, and a sky and weather watching perspective.
I add my thoughts and observations.
For me, every hour not spent outdoors on a naturalist type field trip are wasted hours.
I am in the Pacific Northwest but am familiar with the Southern California Bight, the Coconino Plateau, and the Front Range and Rocky Mountains of Colorado. Of El Ninos via almost forty years living in So Cal, I have watched them deliver — or not.
Will a significant El Nino event take place? I am skeptical.
Over the past months, the air mass over the PNW, western North America, and the eastern Pacific has been quite mushy and stagnant. Is it absorbing dynamic energy weather forces and diminishing their strength?
The atmosphere is unnaturally saturated with particulate and moisture. Much of the particulate is from fossil fuel pollution, and human forced drought and desertification.
Ocean heat and energy transfers moisture to the air, yes? The jet stream over North America is misplaced, and is providing a haven for blocking highs.
Moisture will attach itself to dust particles, I believe. On the other hand, doesn’t the friction from moving dust particles cause positive electrical charges? All this, to what effect? (Readers, please correct any false assumptions you see here.)
We seem to be trying to describe, and second guess, a whole new weather paradigm. No?
We do know that changes are accelerating beyond society’s expectations or comprehension. We are definitely in uncharted but should-have-been-foreseen-and-avoided territory.
All should look at the visible atmospheric pollution and the character of the sunlight. Look closely at outdoor scenes around you — and in the media, videos, photos, etc. Almost every location has dense, hazy, or smoggy air. All of the photos, etc. look like they were taken in the same place at pretty much the same time of day. If the air is clean, you usually can’t see it.
###
LikeLike
james cole
/ July 28, 2014I saw a half hour examination of Canadian Tar Sands present and future operations. This is a mind blowing operation, and the process is straight from hell. Hard to imagine a more deadly way to produce functional oil and the CO2 foot print of production is huge. Burning masses of natural gas to release the tar from the sands and the water resources used and the downstream pollution from tailings. The answer to this disaster and Canada’s total commitment to it for at least the next 20 years is summed up in this figure. Canada expects to earn “2 trillion dollars” over the next two decades from tar sands operations already on the drawing tables. “2 trillion”, Canada would fight a war before they would stop mining this Tar. Such a sad and terrible disaster for climate. The worst possible thing man could do, is being done. Sadly the Canadian Prime Minister is a dedicated climate change sceptic! 2 trillion dollars ensures he remains a denier for life. The story went to visit the town built up around the operations, there is no way to gloss over how happy these people from all over the world are to be working the Tar Sands, New homes, New Cars, New playthings and secure money every week. The battle between these jobs and the real “alternative energy jobs” we SHOULD be creating is stark!
LikeLike
robertscribbler
/ July 28, 2014Then they’re engaged in a war to profit from wrecking the future. The very definition of a petro-state.
LikeLike
pintada
/ July 28, 2014Per James: “The worst possible thing man could do, is being done.”
Sorry buddy, not true;
Most coal seams dip to a point that they are too deep to mine. So, most coal is economically unreachable. The solution is to drill a well in the center of the coal seam and light it on fire. Then, you pump air down the central well at high pressure. Then, drill wells around the central well and collect the gasses that come from the fire. Obviously, you must try to control the air feed so that the fire is inefficient and leaves lots of hydrocarbons unburnt. With a little compression and cooling its easy to separate the CO2, CO, H2S and other waste gasses from the nat gas. The waste gasses, of course, are vented to the atmosphere. After the coal is burnt, the land subsides, and un-captured gasses are forced through the overlying strata (i.e. aquifers) to the surface.
Tar sand mining is radical environmentalism by comparison.
http://www.alternatefuelsworld.com/in-situ-coal.html
“An Ergo executive told me that the company could produce Fischer Tropsch diesel for $18 a barrel. The cost at a conventional FT plant would be at least $25 per barrel and probably close to double that. This looks like something that could really work and could provide the United States with a dependable alternative liquid fuel supply in fairly short order.”
http://www.ucg-gtl.com/australian-ucg-underground-coal-gasification-process.html
“The technology could be used to ensure that coal remains a part of the global energy mix by providing a solution to reduce and abate greenhouse gas emissions (GHG).”
Invest now!! Get in on the ground floor!
LikeLike
robertscribbler
/ July 28, 2014Have to love how they call this “a solution to reduce and abate greenhouse gas emissions.”
How?
LikeLike
Apnea man
/ July 28, 2014There is not a country in the world that would not exploit/rape their land if they had tar sands under it. This is who and what we are. America fracks, China gassafies coal. This is why I am not at all hopefull.
LikeLike
robertscribbler
/ July 28, 2014This needs to change if we’re going to make it. Plain and simple. We need to set the fossil fuel energy slaves, along with the coming generations, free from what is becoming a very oppressive system.
LikeLike
Phil
/ July 29, 2014Yesterday, the Commonwealth Government in Australia gave approval for the biggest coal mine in Australia, the Carmichael Coal Mine in the Galilee Basin in Queensland – it now has both State and Commonwealth approval. The mine owner is an Indian company called Adani.
It will be interesting to see to what extent it gets backing from the financial sector – many analyst have questioned its financial viability and more recently a number of international investment banks pulled out of a Abbott Point port development that would have supported exports from it and other such coal mines.
LikeLike
robertscribbler
/ July 29, 2014It’s good to see the international investment banks taking responsible action in this case. Someone has to be the adult in the room.
LikeLike
Phil
/ July 29, 2014Given the lifespan of the new mines and the enormous uncertainity over the climate change impacts and policy in the future, it would be hard to see how any bank would get involved with financing such projects – the danger is that they will become stranded. This should also begin to occur for any other emission intensive projects whether they be coal gasification or tar sands type projects.
Will be interesting to see how things evolve over the next couple of years. If these things have more than a decade lifespan, there is a prospect that they could become stranded.
I am following your recent posts. Is the heatwave conditions forecast for the Arctic starting to emerge? I have seen some of your recent comments on Arctic Sea Ice Forum together with Friv and JDAllen which seem to point to some interesting times ahead. Will be interesting to see how long it lasts.
LikeLike
robertscribbler
/ July 29, 2014Melt favorable conditions are now in force. Model runs predict them intensifying and remaining through at least early next week.
We’ve already had rapid sea ice recession over the past couple of days. The Laptev in particular has been hammered. The set up is for a melt wedge formation in the ESS which under melt favorable conditions could rapidly bring sea ice reductions there.
15-25 mph winds and rains over the Beaufort this evening are also very melt favorable, enhancing wave action and surface ice melt. It’s an odd situation as we have high pressure dominating but with rain beneath its circulation. This is primarily due to wind interaction with the sea ice forming condensation and a kind of warm front effect.
Overall, it looks very melt favorable at the moment. Will probably need a new blog post on it tomorrow.
LikeLike
robertscribbler
/ July 29, 2014Very high amplitude jet stream wave extending above 80 North now… This is a strong pattern.
LikeLike
Mark from New England
/ July 29, 2014Robert,
Thanks for keeping us informed on the arctic sea ice situation. I’m amazed at how rapidly conditions can change from melt unfavorable to very melt favorable.
LikeLike
robertscribbler
/ July 29, 2014Well, I think we’re still up in the air whether or not we get below 2013 levels at end season. My opinion is that the large fresh water pool is starting to play a part. Which means things could get interesting rather quickly RE weather.
LikeLike
Mark from New England
/ July 28, 2014It’s tornado day in New England. Once a rare occurrence, they have definitely picked up over the last few years. This one – http://www.necn.com/07/28/14/LIVESTREAM-Tornado-touches-down-in-Rever/landing.html?blockID=869756&feedID=11106
occurred in coastal Revere, MA this morning; and one is now (4:25 pm EST) running across southern Maine towards the southern end of Sebago Lake.
In the past, most happened in the warm Connecticut River valley in CT and MA, but in recent years they’ve expanded their range.
By Midwestern standards, most NE tornadoes are pretty weak affairs, but that too is changing. I’ll take a blizzard any day over a tornado.
LikeLike
robertscribbler
/ July 28, 2014Cool dipole creating all sorts of instability over the central and eastern US today.
LikeLike
John Christian Lønningdal
/ August 5, 2014Sea Ice Area at Cryosphere has plummeted below 2013 now so there is some serious melt going on now. Will be interesting to see if it keeps this up to give us a lower extent than 2013 this year.
http://arctic.atmos.uiuc.edu/cryosphere/arctic.sea.ice.interactive.html
LikeLike
robertscribbler
/ August 5, 2014And here we are. Been an interesting two weeks. More to come…
LikeLike