
Imagine, for a moment, the darkened and newly liberated ocean surface waters of the Kara, Laptev, and East Siberian Seas of the early 21st Century Anthropocene Summer.
Where white, reflective ice existed before, now only dark blue heat-absorbing ocean water remains. During summer time, these newly ice-free waters absorb a far greater portion of the sun’s energy as it contacts the ocean surface. This higher heat absorption rate is enough to push local sea surface temperature anomalies into the range of 4-7 C above average.
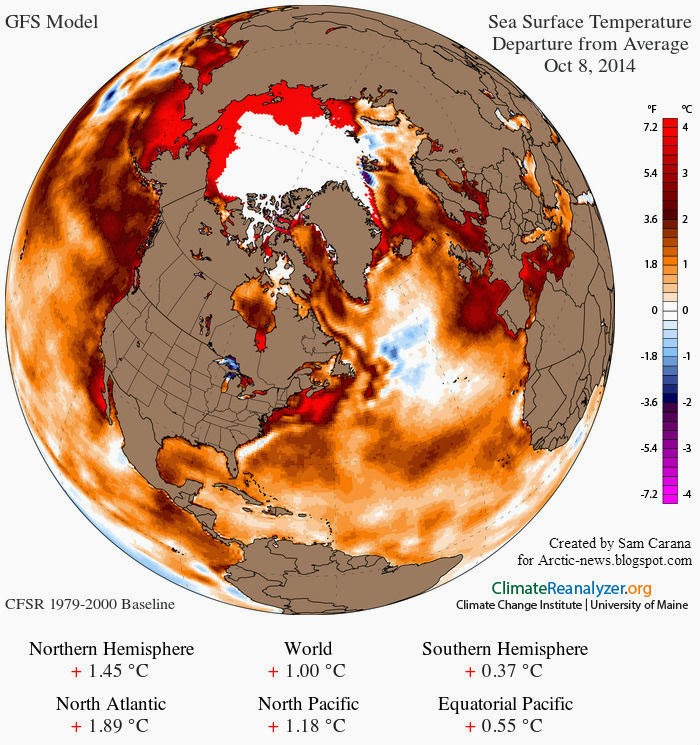
(Remnant extreme heat at Arctic Ocean surface on October 8, 2014. Extraordinary warmth in the range 0f 4-7 C above average is due to recent loss of summer sea ice in the Kara, Laptev, East Siberian and Beaufort Seas. Newly exposed dark surface waters absorb more of the sun’s rays which results in a highly visible temperature anomaly. Image source: Climate Reanalyzer. Image archived by: Arctic News.)
Some of the excess heat penetrates deep into the water column — telegraphing abnormal warmth to as far as 50 meters below the surface. The extra heat is enough to contact near-shore and shallow water deposits of frozen methane on the sea-bed. These deposits — weakened during the long warmth of the Holocene — are now delivered a dose of heat they haven’t experienced in hundreds of thousands or perhaps millions of years. Some of these deposits weaken, releasing a portion of their methane stores into the surrounding oceans which, in turn, disgorges a fraction of this load into the atmosphere.
The rate of release intensifies throughout summer. But during the Arctic Fall, it reaches a peak. Then, as sea ice begins to re-form over the surface waters, a kind of temperature inversion wedge develops. The surface cools and the ice solidifies — forming an insulating blanket, trapping heat. The insulating layer, in turn, pushes the anomalously hot mid level waters toward the bottom. This process delivers a final and powerful dose of heat to the Arctic Ocean bottom water and sea bed.
Methane release rates spike as the methane flooding up from the sea bed squeezes out through cracks in the newly forming ice or bubbles up through open waters just beyond the ice edge.
Observed Arctic Methane Over-Burden
During recent years, a troubling methane over-burden has been observed in the atmosphere above these regions during the months of September through November. Dr. Leonid Yurganov — a researcher at the University of Maryland — has been using the IASI sensor to record these events. Last year, he developed this map of September through November methane readings for the 2009-2012 period:
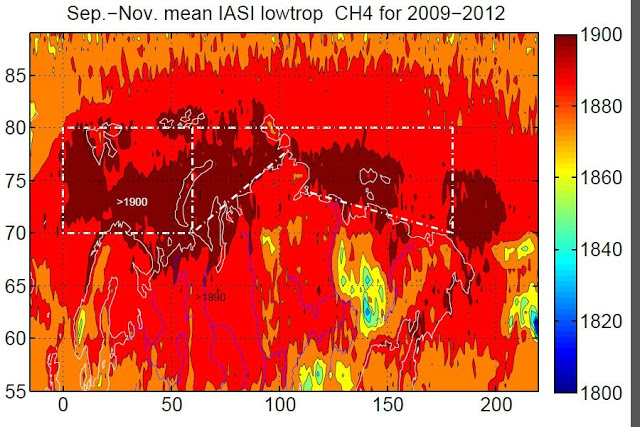
(Highest lower troposphere global atmospheric methane readings were found in the region of the East Siberian, Laptev and Kara seas during September through November of 2009 through 2012. Data provided by IASI. Image source: Dr. Leonid Yerganov via Arctic News.)
The readings above show near-surface averages over a three month period in the regions of highest release. Note that highest methane levels occur over coastal Siberia and in the above ocean zones of near-Russia Arctic Ocean waters.
These measurements have been ramping higher in recent years with near-surface readings in the range of 1950 to 2000 ppb now common for the months of September through November in the areas affected (for comparison, global surface averages are now in the range of 1840 ppm).
By themselves, these measurements are evidence of a substantial Arctic methane release. But further up in the troposphere — at the mid cloud level — even higher levels of methane have been recorded.
For as methane releases from the sea and land surface, it becomes trapped in the mid-cloud layer. There, a sandwich of cloud and moisture form a cap beneath which methane tends to concentrate. In this layer, readings can be quite a bit higher than surface measurements. Recent years have shown numerous instances where methane readings in the mid-cloud layer spiked above 2300 parts per billion.
Last year during September, the now annual plume of methane emitting from the Arctic Ocean pushed readings as high as 2571 parts per billion at this level of the atmosphere. It was a reading more than 700 parts per billion above the global surface average. A spike fueled by the anomalously high rates of methane emission from the Arctic surface waters and Siberian tundra during the Fall of 2013.
This year, despite extraordinarily spotty coverage due to cloud interference, the METOP sensor found Arctic methane concentrations in the range of 2666 parts per billion in the mid cloud layer. The spike occurred just this past Sunday and exceeds the September 2013 spike by 95 parts per billion — a level more than 800 parts per billion above current global surface averages.
(Arctic methane spikes to 2666 parts per billion in the mid-cloud layer on Sunday October 26. Image source: OSPO/METOP.)
In combination, observations of a rapidly warming Arctic Ocean and observations of Arctic methane readings between 6 and 60 percent above the global average in near surface regions and in the mid cloud layer are a clear signal that human-caused Arctic warming is forcing an ever-greater methane release. To a greater and greater extent, large carbon stores are being weakened and tapped by the various mechanisms that are an up-shot of human warming. The location of these large-scale releases, as observed in the satellite record, is confirmation of ground and ocean based observations conducted by Arctic researchers such as Dr. Semiletov and Shakhova. And the releases themselves may well be some validation of our more dire concerns.
This new spike is yet more evidence of a sizeable, anthropogenic-spurred, release that is impacting not only regional methane levels, but global levels as well. Whether this newly observed release is part of a slow global response to the initial human heat forcing — one that will take centuries to fully emerge — or is part of a much more rapid and dangerous response to an also very rapid human heat forcing is now unclear.
What is clear is that feedbacks to the human heat forcing are now starting to become plainly visible. That they are providing evidence of a stronger release from some sources on a yearly basis. A troubling amplifying feedback to the already dangerous and extraordinary human emission. One that should serve both as a warning and as a spur to reduce and eliminate human greenhouse gas emissions from all sources and to switch energy systems away from fossil fuels as swiftly as possible.
Links:
NOAA’s Office of Satellite Operations


wili
/ October 29, 2014Thanks for this (I guess :-\).
What kind of seabed sources are we thinking these emissions are coming from primarily? Seabed surface permafrost?
Sediments washed down from the mainland?
Sub-permafrost methane hydrates, particularly on slopes?
(My recollection is that their stability zone is considerably lower than 50 meters, so in normal circumstances, wouldn’t it be fairly difficult for surface warmth to telegraph down to them, especially where they are deeply buried in permafrost and other stuff? I think this is the main argument folks like Archer have against the notion that any kind of major methane hydrate release is or could ever happen on any kind of human time scale. So it would be nice to see that argument addressed here.)
Anyway, thanks again. Good to see you getting back to GW science.
LikeLike
robertscribbler
/ October 29, 2014I cover energy, climate and sustainability. Mostly climate, but energy is intrinsic to the broader issue. We can’t solve the climate problem without solving the energy problem.
S&S have observed methane release from sea-bed clathrate sources and have found rather shallow stability zones in the ESAS. Overall, a much broader increasing release of methane has been observed from terrestrial sources, but the ocean zone is the highest emitter and we have numerous observations of clathrate destabilization in those areas already. SWERUS C3 observations pending.
Archer has yet to address this overburden sufficiently. If he is confronted, he will probably down-play the issue by pointing out its probable relative small size (compared to the overall human emission). But if the human emission was so much larger, relatively speaking, then why don’t we see an atmospheric overburden of this kind near human emissions sources?
The Arctic emission during this time of year is overwhelming. You have to parse the data to ignore it.
The 50 meter warming depth is first stage warming. Second stage is transfer of that warmth to the bottom zone during surface freezing. ESAS average depth is 100 meters.
LikeLike
wili
/ October 29, 2014Thanks, rs.
“I cover energy, climate and sustainability. Mostly climate, but energy is intrinsic to the broader issue. We can’t solve the climate problem without solving the energy problem.”
That makes sense.
On the general issue of changes to seabed that may affect methane emissions:
I always hear that the two main features for clathrate stability are pressure and temperature.
But surely salinity must play a role. Is there any indication that salinity levels are changing in ESAS, as far as you know? It seems to me that there was some indication that Atlantic currents were making their way further and further into the Arctic. I would think that they would introduce more salinity into the area.
Thanks again.
LikeLike
robertscribbler
/ October 29, 2014RE stability, temperature is king. Pressure and salinity are lesser issues.
Some salinity change has occurred with more fresh water influx generally ongoing from Arctic rivers and from ice sheet melt as the Arctic warms and hosts stronger precipitation events.
LikeLike
Griffin
/ October 29, 2014Thank you taking the time to put together this fantastically informative post Robert!
LikeLike
robertscribbler
/ October 29, 2014Cheers Griff. We go dark on feedbacks at our own risk.
LikeLike
wili
/ October 29, 2014Sao Paulo update:
http://www2.sabesp.com.br/mananciais/DivulgacaoSiteSabesp.aspx
The Cantareira system supplies 6.5 million people in Greater São Paulo.
10.7% of the 12.7% is ‘dead volume’
So down to 2% usable volume?
LikeLike
robertscribbler
/ October 30, 2014To my knowledge, they have some capacity to tap dead volume but require permission to do so.
LikeLike
robertscribbler
/ October 30, 2014Brazil is clouding up a bit. Rain in the forecast with Nov 9th showing a long range forecast for 60 mm+. We’ll see, but, so far, the rainy season now about 3 weeks late.
LikeLike
james cole
/ October 30, 2014As usual I get a good physics lesson here! One would think that the fall icing up of the warmed arctic seas would spell good news! “Oh, the water is now cold again!” Forgetting all the warmth trapped below the frozen surface ice, and now unable to escape to the surface, giving an extra jolt of heat to those methane deposits. I can see someone on FOX trying to declare that the surface iced up again could possibly mean more heat given to the ocean floors methane deposits.
In any case, it’s hard to stay calm in the face of the arctic changes, and the methane stores up there, which can and will release as warming continues.
Our experience with the end of winter ice sheets on Lake Superior and the rapid rise to all time high surface water temperatures due in part to this falling ice coverage. The same forces work to some degree in the Arctic. Once ice retreats, water temperatures head up very fast!
Northern Minnesota 2014, Oct. 29th and no hard frost yet! In the 1980’s we would expect a hard frost early September! Fall colors just fizzled due to no killing frost to set the color chemistry into motion. Result, disappointed tourists
LikeLike
robertscribbler
/ October 30, 2014The re-icing stores a portion of the excess summer heating through the inversion process. It’s a mechanism we should probably be taking a good look at going forward…
Similar mechanism in play RE basal ice sheet melt. So we really can’t ignore one and accept the other.
LikeLike
Bassman
/ October 30, 2014I have yet to see any quantitative data on how heat is stored due to ice cover vs gained in the reduction of albedo. I don’t dispute anything being said, I just wonder how much heat is given off from lack of fall ice cover.
Also, trenberths article in “Conversationalist” today states that the stuck jet stream is causing arctic amplification rather than the other way around. This seems to conflict a bit with recent published work.
http://theconversation.com/what-caused-the-pause-in-global-warming-32257
Robert, do you have any thoughts on this?
LikeLike
robertscribbler
/ October 30, 2014Loss of heat at the surface causes the freeze. This pushes the mid level heat toward the sea bed where it is needed least. We have a rising methane spike from the related seas as some signal of this action. The time-frame is another consideration as the spike occurs at the same time this inversion layer forms.
Trenberth has disputed the jet stream theory for some time now. So no surprise. That said, if we have El Niño, the Jet will tend to flatten as the storm track intensifies and the equator heats up. It is unlikely that this will be enough to cancel the impact of current polar amplification, however.
LikeLike
uknowispeaksense
/ October 30, 2014Reblogged this on uknowispeaksense.
LikeLike
Bassman
/ October 30, 2014“We highlight that cold winters in Europe go along with a warm Arctic. In fact it is likely the Arctic has warmed more than otherwise expected owing to the wave patterns that have occurred over the past decade. So “Arctic amplification” is a consequence, not a cause of the increased waves, as has been suggested in the past.”
-Kevin Trenberth Oct 29th 2014
LikeLike
robertscribbler
/ October 30, 2014Chicken and egg… Does Trenberth ignore the other factors involved in Arctic warming? We could certainly name a few.
LikeLike
Spike
/ October 30, 2014If jet stream changes cause the warming and are due to natural cycles we’d expect previous episodes in the last few centuries. Any sign of them?
LikeLike
robertscribbler
/ October 30, 2014Hello sea ice hockey stick!
LikeLike
wili
/ October 30, 2014“So “Arctic amplification” is a consequence, not a cause of the increased waves, as has been suggested in the past.”
That seems oversimplified at best. Surely albedo shift and some other factors are very important elements of Arctic amplification essentially separate from increased atmospheric waves.
LikeLike
robertscribbler
/ October 30, 2014It’s a funny play on words… And we thought scientists weren’t very PR savvy. We could learn a thing or two …
LikeLike
dtlange
/ October 30, 2014Without any prejudice towards Mr. Trenberth and his motives or qualifications on this matter — I do assume that we can count on having a designated ‘Nay Sayer’ counter some of our firmly held positions, or those of our experts. More so, of those that are the crux of our estimates — and especially if they offer a more extreme point of view. Too wordy, but OK for a diplomatic PR preamble to the following:
Without naming names in this matter, or questioning anyone’s motives — I add some of my experience as a field naturalist/activist testifying before agencies and decision makers. There was almost always someone from the opposing side giving ‘expert’ testimony that directly contradicted my/our documented findings. Since the subject was always biological — in private, we called them ‘biostitutes’. We were never sure if they really believed their own findings, or if they only found what they were paid to look for. Again, I say this without any known reason to question Trenberth’s findings or opinions.
But be sure that when the stakes are high, as they are in human forced climate change — any and all weapons, or arguments will be used against us. Even if it is just to distract us.
Do know too, that we do want our findings to be tested at any time — so we may repair any defects.
But, if our main challenge is distilled to the archaic “chicken or egg” test — I will sleep well at night.
LikeLike
robertscribbler
/ October 30, 2014😉
LikeLike
cartoonmick
/ October 30, 2014There are just too many interlocking cycles and systems to be reasonably sure as to what will be happening in the immediate (or distant) future.
Each system has the ability to influence associated systems in different ways, and these then go on to influence other systems and cycles.
Nobody really knows where this will all end up, but there’s very high chance, there’ll be changes which will make it very uncomfortable (or impossible) for us to live.
Hot or cold arguments are irrelevant if we don’t have a liveable environment.
Those in authority must get on top of the situation now and start listening to the scientists.
Our main problem for this are deniers with authority, as explained in this cartoon . . . .
Cheers
Mick
LikeLike
robertscribbler
/ October 30, 2014Anyone against broad policy action to both replace ff and reduce excessive consumption is a part of the problem at this point.
It would also help greatly if the richest among us stopped consuming resources at such a frivolous rate. Using farm water in California to water golf courses or having single wealthy homes that consume as much water as a small community is not helpful.
LikeLike
Oliver Castañeda
/ October 30, 2014Hey Robert, have you been following the debate in the energy community about rebound effects (ie: Jevon’s Paradox), and whether or not they negate the energy-saving effects of improvements in efficiency? A paper in the New York Times sparked a debate about LED light bulbs, and it’s been interesting to watch engineers and economists battle it out. Basically, the problem is that improving efficiency in some place tends to, overall, reduce energy prices while simultaneously increasing the value of energy, so market forces may lead to no substantial reduction in energy consumption (Tim Garret’s work, eg). Some swear by energy efficiency as the best way to cut emissions (in lieu of shifting energy sources), others think it’s pointless (Although it might all be pointless with that venting methane). Have any thoughts about it?
LikeLike
robertscribbler
/ October 30, 2014Cheers, Oliver.
My thoughts are that Jevon’s Paradox is both relevant and sometimes over-stated. That the issue is not whether the philosophy dominates. But what policy conditions lead to it becoming a problem, and how we set in place policy-based catchments that maximize efficiency gains while reigning in the consumption and price-swing backlash.
In a more pure capitalist system, efficiency creates abundance, abundance drives down cost, low cost spurs greater demand. Greater energy demand increases the rate at which materials are consumed. So you have a whip-lash that reduces sustainability.
That said, for most people, there is a level at which energy consumption will tend to level off — enough to meet food, water, lighting, communication, and yes, entertainment needs/desires. So the issue here is that if you have a non-pure capitalist system in which the inputs to meet these needs/desires are regulated to an extent (CAFE, agricultural standards [lower meat consumption etc], light bulb efficiency standards, energy commitment standards for devices, materials use standards etc) then the paradox has less of a bite.
Carbon pricing and other harmful behavior use pricing also helps in a non-laissez faire economic environment.
In such instances there is a risk that bad actors reduce gains — and you could well assume bad actor countries if whole countries start adopting increasingly more positive policy measures. So any sustainability regime that involves efficiency (as it should) would include ways to punish bad actors at the individual, community, state, and nation level.
My view is that efficiency, though generally helpful, cannot effect the changes needed in a vacuum, or worse, in a laissez faire economic system. In general, though, this is the case with renewables as well. For without a pricing scheme, the price of fossil fuels is driven down as renewables become more abundant, making them more appealing options and generating a whip-lash in which a renewables/efficiency boom can make oil, gas, and coal economically appealing all over again.
In such a back and forth, I suppose it’s possible, after decades and probably at least a century or two, that renewables and increases in efficiency come to dominate. But not after a number of fossil fuel boom and bust cycles that leads to far more emissions than we can probably survive.
Politically, we are in a bind. We have one political set that generally supports renewables and efficiency standards. We have another set that is actively trying to kill such measures as swiftly as they arise. Further, the fossil fuel political backers are the same that support economic systems in which Jevon’s Paradox has the most bite. Under such a system, there are very few ways to escape very severe climate crisis.
In the end, I don’t think Jevon or efficiency dominates in a vacuum. I think what determines the effectiveness of efficiency is base policy aimed at limiting overall energy and materials consumption while still meeting a base level of need/desire. But we should really be thinking about aiming policy to punish excess consumption of harmful goods/services beyond a certain point. Without that safety lever, then yes, Jevon can eat your efficiency gains and renewable energy advances for lunch.
LikeLike
robertscribbler
/ October 30, 2014I’d like to add that we could well call this the Capitalist Paradox. In that in a system that pushes for ever-increasing consumption of energy and materials, you end up with just that. It’s not inevitable. It’s economics by pure capitalist design.
LikeLike
Oliver Castañeda
/ October 31, 2014Thanks for that response, I think you are right, we could never expect a “free market” to deal with this issue, and strong action to punish bad actors and hopefully levy taxes seems to me to be much more effective than pushing for efficiency gains.
I do think that, should some energy source be harnessed that undermined the value of fossil fuels (which is unlikely, but it could happen) then demand would decrease and we would see emissions decline. To truly reduce emissions, we need the value of fossil fuels to decrease, in one way or another, either because something else is better, or because the prices/consequences are too severe.
In terms of capitalism, I often wonder to what extent we can really separate “capitalism” from “consumption.” 7 billion people need to eat and keep warm in the winter after all, no matter the economic system.
LikeLike
robertscribbler
/ October 31, 2014Happening now with wind, solar, and efficiency gains. No new coal plants this year, primarily due to a combination of renewables, nat gas, and efficiency. That 7 percent cut in electricity consumption is like shutting down scores of plants.
In any case, working to disincentivize bad actors helps to continue and solidify efficiency gains, which we definitely should do. Bad action at this point = all fossil fuel consumption.
LikeLike
Spike
/ October 30, 2014Fortunately the rebound effect isn’t nullifying gains in many countries eg in the US
http://www.dallasnews.com/business/energy/20131230-powering-down-home-electricity-use-in-u.s.-falls-to-2001-levels.ece
LikeLike
robertscribbler
/ October 30, 2014Note that this is mostly due to a positive application of energy policy. We required the use of more efficient light bulbs and appliances. Then we fast tracked adoption in the markets. We toughened building codes, resulting in more efficient homes and offices.
For the US energy market, which is a closed system local to the US, this can have strong impacts. And it has. The thing, right now, on the side of Jevon is a potential surge in the number of new, power-hungry, gadgets. So we should probably keep an eye on the over-proliferation of electronic stuff we generally don’t need.
LikeLike
Oliver Castañeda
/ October 31, 2014I dunno how much I believe these claims. 2001 really wasn’t all that long ago, and as the article mentions, our lives are growing increasingly electrified. Efficiency seems to be about neck and neck with demand, thus illustrating Jevon’s. Another example is gasoline consumption in the US, which was steadily increasing despite decades of efficiency gains.
It would seem that gas prices are a better indicator of energy consumption. You can pretty much point to any metric and show how it’s fallen during and since the recession / oil shocks of mid 2000s. Now, we’re seeing energy consumption and CO2 emissions rising again, on pace with economic growth and oil prices decreasing. People just can find all sorts of things to do with energy.
I’m all for increasing efficiency, but I think a lot of the end results (in terms of consumption) are driven by energy prices/supply more than efficiency. Towards that end, I think the best means of reducing our emissions is by not digging up fossil fuels in the first place. I’m worried efficiency targets are something of a smokescreen.
LikeLike
robertscribbler
/ October 31, 2014Sorry Oliver, but that’s bad information.
US liquid fuels consumption was 21 million barrels per day in 2005. We are at 19 million barrels per day now. Some of this is due increased oil prices, some due to major gains in efficiency. Some due to replacement with alt fuels vehicles.
LikeLike
robertscribbler
/ October 31, 2014If you want to see so Jevon’s paradox go to work on liquid fuels consumption, elect conservatives who will then cut CAFE standards, work to eliminate electric vehicle development, and frack the US and global tight oil basins to oblivion. If you wish to challenge Jevon, simply elect those who will continue to push through responsible efforts to limit demand and dis-incentivize over consumption.
In any case, I see far too many using Jevon as an excuse to fail to act.
LikeLike
Gerald Spezio
/ October 30, 2014Oliver, Guy McPherson & I have had a long acrimonious dispute about both the Jevons Paradox & the Khazzom – Brookes Postulate.
McPherson passionately defends has international flying by quoting the deep wisdom of both Jevons & K-B.
He openly accused me of being “ignorant” for NOT believing.
Hello Lufthansa!
LikeLike
robertscribbler
/ October 30, 2014Using Jevon as an excuse to consume conspicuously is setting a very bad example and feeds right into laissez faire thinking.
LikeLike
Oliver Castañeda
/ October 31, 2014I haven’t been on an airplane in years on principle, but I do drive a car, sometimes over very long distances, and I must admit I justify it with the logic that If I don’t burn that gas, someone else will. It’s obviously not a compelling excuse, but, I imagine we’re all guilty.
As for Jevons/KB, I really think the whole issue can be quite straightforward depending on the lens with which one approaches the topic. The IPCC seems to gloss over the issue, saying it’s real but not a game-changer, citing rebounds of a few percent, and up to 50%. They describe it a very complex issue that requires lots of research in many different sectors and applies differently in various situations /markets, etc.
However, taking a step back – one has to ask, is there any reason to imagine that all the fossil fuels produced in a year will not get burned? Would the world reject more oil entering the market? As far as I can tell, the United States is fervently pursuing any and all means of increasing oil production, and while demand may be showing signs of declining in certain markets, you can pretty well count on developing nations like India to grab whatever the rest of us pass up on. I guess the essential question is, is there any reason to imagine there is a limit to how much energy people will use if it’s available to them?
Once again, I don’t mean to come off as just another doomer, although I admit I wear that tag quite a bit, but I firmly believe that many of these supposed solutions could be off the mark. I believe the only appropriate solutions are those which directly lower the value of fossil fuels.
LikeLike
robertscribbler
/ October 31, 2014Absolutely. If the fuel is produced and there’s a market for it, it will be burned. Which is why you have to collapse both those markets and the production of the fuel.
I guess what I’m saying is that efficiency is one tool that helps ease any transition away from such a large scale consumption as we see with fossil fuels now. We don’t have on silver bullet and as anything else efficiency gains has it’s pros and cons. But as a part of a mix of actions, it is very effective to be able to do more with less…
LikeLike
Robert A. Vella
/ October 30, 2014Hey, Royal Society! Are you listening?
LikeLike
robertscribbler
/ October 30, 2014At least listen to the satellites, for God’s sake.
LikeLiked by 1 person
dtlange
/ October 30, 2014Though they have made many significant contributions in the past, the Royal Society may have become mired down as another ‘scientific bureaucracy’. There are a lot new players in the ‘game’ now — many are very sharp too. I.m a bit of a relic myself.
LikeLike
Colorado Bob
/ October 30, 2014New study shows three abrupt pulse of carbon dioxide during last deglaciation
A new study shows that the rise of atmospheric carbon dioxide that contributed to the end of the last ice age more than 10,000 years ago did not occur gradually, but was characterized by three “pulses” in which C02 rose abruptly.
Read more at: Link
LikeLike
Spike
/ October 30, 2014Interesting that those pulses were 10-15ppm over 1-2 centuries, so 10 times slower than human addition over the last century or so. And “At the same time CO2 was increasing, the rate of methane in the atmosphere was also increasing at the same or a slightly higher rate,” Marcott said.
LikeLike
robertscribbler
/ October 30, 2014Small relative heat forcing that caused this response… We are talking very slight changes to the way the sun warmed the Earth. The human heat forcing is much stronger.
2011 ghg insolation is 2.3 watts per meter squared (with aerosol negative forcing included, without it, it’s 3.2 watts per meter squared) this is about 5 times the insolation increase at the end of the last ice age of 0.45 watts per meter squared. By the end of this century under BAU we are looking at 6-8.5 watts per meter squared initial forcing from the human emission alone — about 15-20 times what we saw at the end of the last ice age.
LikeLike
robertscribbler
/ October 30, 2014“At the same time CO2 was increasing, the rate of methane in the atmosphere was also increasing at the same or a slightly higher rate,” Marcott said. “We also know that during at least two of these pulses, the Atlantic Meridional Overturning Circulation changed as well. Changes in the ocean circulation would have affected CO2 – and indirectly methane, by impacting global rainfall patterns.”
Fingerprints of the great flood? More water over land = more methane.
….
OK. Radical hypothesis time…
1. Most of the ocean’s CO2 is stored at depth.
2. Ocean warming destabilizes some clathrates.
3. The upwelling clathrates generate a sea-bed to surface flow.
4. The clathrates break the surface dumping more methane into the atmosphere.
5. The added carbon in the deep ocean combines with upwelling to swell both the deep ocean carbon store and push it toward the surface.
6. In places, especially in columns where the methane is bubbling up, the higher CO2 concentration waters contact the surface.
7. Warmed, these higher CO2 concentration waters disgorge more of their carbon load in the form of CO2 into the atmosphere.
(Hat tip to David Archer for some of the basis for this line of thought, as he ironically gives some grounding for an abrupt climate change thought experiment.)
LikeLike
Colorado Bob
/ October 30, 2014Relocation or Adaptation: São Paulo Nears Collapse as Drought Continues
The economic toll from the drought is already beginning to be felt and will likely grow worse. Half of the country’s textile producers are in São Paulo and are unable to continue their dyeing processes because of the water scarcity. Solvay’s Rhodia chemical plant halted some of its production, as well. Meanwhile, concerns that the drought will affect the country’s soybean production has brought up prices worldwide. The state of São Paulo is responsible for a third of Brazil’s GDP, so any slowdown there would bring down the country’s overall growth.
Brazil has been racked by protests for the past several years. Now, people are rioting explicitly because of water (or the lack thereof). In the city of Ito, outside of São Paulo, people have been burning buses and hijacking water tankers.
Of course, the state of São Paulo is not the only place in the world currently experiencing water shortages. According to the Global Drought Information System, other regions experiencing extreme drought conditions include: Northern China, Somalia, Kenya, the southwest United States, and most of Australia.
Link
LikeLike
robertscribbler
/ October 30, 2014Excellent article, Bob. Thanks for this one.
LikeLike
dtlange
/ October 30, 2014Yes, and from an architect POV — it’s very good.
LikeLike
danabanana
/ October 30, 2014Well, with those CH4 readings we can expect another good show of NLC’s next summer.
LikeLike
Mark from New England
/ October 30, 2014NLCs? I forgot what that acronym stands for!
LikeLike
danabanana
/ October 30, 2014Sorry Mark, Noctilucent Clouds. 🙂
LikeLike
robertscribbler
/ October 30, 2014Noctilucent Clouds. Very high altitude cloud formations that can reflect sunlight well after terrestrial sunset in a certain region. They would typically form after major volcanic eruptions. But with the rising global temperatures, they seem to have become more common.
The primary cause is high level water vapor in the stratosphere which forms into very high level clouds. Methane reaction with hydroxyl can generate this water vapor as well, which is why some have attributed more abundant NCLs to increasing methane levels.
LikeLike
robertscribbler
/ October 30, 2014You get a lot of those in your region?
LikeLike
danabanana
/ October 30, 2014Every year. Best display I’ve managed to see here in the Midlands was in 2010 but the Daisy has intensified year on year with many places enjoying fantastic displays. Spaceweather.com has a gallery with many good pictures from around the Northern hemisphere.
LikeLike
PaulW
/ October 30, 2014The Tiksi Russia atmospheric gas measuring station right in the middle of that area, is not measuring any methane spikes this year. It is more-or-less flat since it was established in 2010.
LikeLike
robertscribbler
/ October 30, 2014The Tiksi station is a dot on the map. These satellite measures provide a much broader picture. So are you saying that IASI is not providing good information?
In any case, Tiksi is consistently above 1920 ppb CH4. With a global surface average of 1840, these measures are hardly any indication that methane levels at this dart on the board location are low…
LikeLike
Spike
/ October 31, 2014I posted the satellite data on Twitter – someone came back and said don’t worry it will never reach the ocean surface……
Those arguments against any significant methane impact are being lapped up by the usual suspects.
LikeLike
Andy in San Diego
/ October 30, 2014Systema Cantareira – reservoir for Sao Paolo reports 12.6% this morning. Rainfall to date for October is 42.5mm, normal is 130.8mm.
12.6%-10.7% = 1.9% capacity above dead pool.
After reviewing ~60 daily readings it appears that depletion runs at about 0.1% per 24 – 48 hrs currently.
At ~0.1% per 35 hrs, dead pool should be reached roughly around 28 days from now (end of Nov). This lands on ~November 26th. Added rainfall may add a few days at the current rainfall rate. If the dead pool were to be tapped (not sure how much is viable), and all 10.7% could be used, then that buys 160 days (~6 months).
Without replenishment, there is 7 months of water in a blue sky perfect world. They are utterly at the mercy of the rainy season. If it peters out again, then there is not enough capacity to cover the dry season in 2015.
I can see conflict (legal) with down river cities & communities as desperation drives Sabesp to cannibalize other sources for Sao Paolo.
Everything depends on the season rainy season which begins normally in December.
LikeLike
Andy in San Diego
/ October 30, 2014And Roberts get a hat tip for mentioning the volume of the dead pool above. That solves the mystery of the sudden increase of ~11% around the 24th. Sabesp commented out the line of code that subtracts dead pool from capacity before posting it to their site.
If they didn’t, people would be panicking with a reported 1.9% volume. And of course, the impact on the election…..
LikeLike
Gerald Spezio
/ October 30, 2014Andy, cut to the Watergate investigation & a supremely dressed lawyer for the Watergate investigators?
“Was it a volitional act?”
LikeLike
robertscribbler
/ October 30, 2014Adding in the dead pool volume gives us 19 percent as of May of this year to the 12.6 percent now. How much of that dead pool volume is actually usable is up for discussion. Not sure we can consider the full 10.7 percent a viable resource. Perhaps half to 2/3 at a stretch?
LikeLike
robertscribbler
/ October 30, 2014Whether they admit it or not, they’re already in a state of heavy rationing.
LikeLike
Gerald Spezio
/ October 30, 2014Trenberth’s preposterous linguistic subterfuge at THE CONVERSATIONALIST is a both a study in human depravity & credentialed bamboozling.
“In fact it is likely the Arctic has warmed more than otherwise expected owing to the wave patterns that have occurred over the past decade. So “Arctic amplification” is a consequence, not a cause of the increased waves, as has been suggested in the past.
If amplified (increasing) temperatures in the Arctic from greenhouse heating are NOT causing ( causing = a major variable in the causal chain) our meandering/stuck jet stream (wave patterns); it IS being caused by natural variability? – angels? – space aliens? the Taliban? or radical Islam (ISIS)?
Jennifer Francis is wrong, wrong, wrong? RIGHT?
Objectively observed dramatic temperature increases are “consequences” of jet stream changes caused by 1. malicious demiurges (devils) as in Joseph Campbell’s Jungian literary flapdoodle? or 2. Gawd, as in the Holy Bible?
The changing wave patterns of the jet stream are like Gawd.
Gawd made (caused) everything, but nothing made Gawd.
Just like Gawd the bonkers jet stream causes a lot of other crazy stuff like Arctic amplification (increasing temperatures) & floods & droughts.
LikeLike
Colorado Bob
/ October 30, 2014Brazil’s hydroelectric facilities almost dry due to drought
Opinions vary and scientific data mounts as to why Sao Paulo, Brazil, is experiencing one of the country’s most severe droughts in recorded history. But, all affected by the drought agree – many of the hydroelectric facilities that serve Sao Paulo are below 10% capacity.
During the past nine months, the lack of water that flows through, or is maintained in, Brazilian hydro facilities is having an immeasurable negative effect on social concerns in Sao Paulo. An article on TheWeatherNetwork.com reports people suffering from forced water rationing have “burned buses in protest as taps run dry and hijacked water tankers in desperation.”
Why is the situation so dire in areas of the South American nation that is known for its abundant tropical areas?
Link
LikeLike
Colorado Bob
/ October 30, 2014New solar power material converts 90 percent of captured light into heat
A multidisciplinary engineering team at the University of California, San Diego developed a new nanoparticle-based material for concentrating solar power plants designed to absorb and convert to heat more than 90 percent of the sunlight it captures. The new material can also withstand temperatures greater than 700 degrees Celsius and survive many years outdoors in spite of exposure to air and humidity. Their work, funded by the U.S. Department of Energy’s SunShot program, was published recently in two separate articles in the journal Nano Energy.
Read more at: Link
LikeLike
robertscribbler
/ October 30, 2014Good to see solar making more advances. This energy source has quite a lot of potential over the coming years. Not sure the ff interests can fully push solar back into its bottle at this point.
LikeLike
Colorado Bob
/ October 30, 2014New satellite technology shows Amazon absorbing less carbon due to less rainfall
(Phys.org) —A team of researchers in the U.S. with another member from Brazil has found that parts of the Amazon rainforest are receiving less rainfall than was received just a couple of decades ago, and because of that are less green. In their paper published in Proceedings of the National Academy of Sciences, the researchers discuss how new satellite technology has allowed for more accurately measuring rainfall amounts in the Amazon river basin which allows for noting changes in rainfall over multiple years.
Read more at: Link
LikeLike
Colorado Bob
/ October 30, 2014200 year flood hits west Norway towns
Rescue crews and volunteers worked through the night to evacuate hundreds of people and limit damage as Voss, Odda and several other towns suffered the worst floods to hit western Norway in more than a century.
Areas hit included the town of Lærdal, which was partly destroyed by fire less than a year ago.
LikeLike
Colorado Bob
/ October 30, 2014Major Floods Hit Western Norway (video)
LikeLike
robertscribbler
/ October 30, 2014Did you get the Cat 2 hurricane hitting the Arabian Peninsula? Rather rare event.
LikeLike
Colorado Bob
/ October 30, 2014Dr. Masters reported it was #3 in the record , in terms of power at it’s peak.
LikeLike
todaysguestis
/ October 30, 2014These Maps of California’s Water Shortage Are Terrifying
http://www.motherjones.com/tom-philpott/2014/10/caliifornia-groundwater-withdrawal-china-india-middle-east
LikeLike
robertscribbler
/ October 30, 2014Brutal.
We need more restrictions on water usage. It would help if we started with the biggest individual users and those related to conspicuous consumption. Simply adding fines for excess use is not enough. At a certain point of excess, the supply should be rationed.
Unsustainable water use should also be brought into check. I find it ironic that the article considers corn water usage from the Ogallala without considering the rampant and unsustainable meat based agriculture that demands much of that corn. The water resource use difference between corn and beef per pound is on the order of beef having at least a x20 water use footprint.
http://water.usgs.gov/edu/sc1.html
In this case, meat should be considered a luxury item if we are really going to get serious about water use.
LikeLike
Colorado Bob
/ October 30, 2014The Scariest Thing You Could Possibly Read
Global economy and ecology. If we don’t figure out how to stem climate change, both are going down the tubes. Game over.
The fact that the two are intertwined is nothing new. And the scary reality of climate change isn’t either.
Cities, island nations and crops will disappear. Droughts will get worse. Storms more intense. There’s no upside. This has already been happening. Only people living in intellectual mineshafts are denying this reality.
Naomi Klein, author of This Changes Everything, is the latest savant to take up the sword to battle climate change inaction. There’s very little that’s new in her book about climate change or the denial movement blocking any change. In fact, when I saw her speak last night at the Chicago Council on Global Affairs in the Second City, there were a lot of nodding heads.
Link
LikeLike
Colorado Bob
/ October 30, 2014NOAA removes 57 tons of marine debris from Northwestern Hawaiian Islands
A team of 17 NOAA divers sailing aboard NOAA Ship Oscar Elton Sette has returned from a 33-day mission to remove marine debris from Papahānaumokuākea Marine National Monument in Hawaii, a World Heritage Site and one of the largest marine conservation areas in the world.
In total, they removed approximately 57 tons of derelict fishing nets and plastic litter from the monument’s tiny islands and atolls, sensitive coral reefs and shallow waters.
“The amount of marine debris we find in this remote, untouched place is shocking,” said Mark Manuel, operations manager for NOAA Fisheries Coral Reef Ecosystem Division and chief scientist for the mission. “Every day, we pulled up nets weighing hundreds of pounds from the corals. We filled the dumpster on the Sette to the top with nets, and then we filled the decks. There’s a point when you can handle no more, but there’s still a lot out there.”
Link
LikeLike
dtlange
/ October 31, 2014I saw that… a terrible mess — NOAA as garbage collector. So much waste, and most of it is plastic too.
LikeLike
dtlange
/ October 30, 2014Methane: here’s an impressive video on Vimeo. It’s been up there for 8 months by Sven Jense of Amsterdam. Haven’t watched the whole thing but — Wow! Art, cinema, and science like it should be. 14 minutes of ‘Methane-1mrt’ — Arctic ice involved.
LikeLike
wili
/ November 2, 2014Long-time methane tracker A4R at neven’s forums had this response to my posting of a link to this thread there:
“I appreciate Robert Scribbler’s description of factors that are in play in Arctic methane release.
However, I am not supportive of the use of one highest range reading of one 12 hour period in the METOP IASI to shape the conversation that this is related to Arctic Methane release. The is a presumption that the image somehow tells us that is where the spike occurred, in reality it does not.
I have blogged further on this issue: http://a4rglobalmethanetracking.blogspot.com/2014/11/methane-spikes-lots-of-hype-no-long.html
A4R”
LikeLike