
Antarctica. A seemingly impregnable fortress of cold. Ice mountains rising 2,100 meters high. Circumpolar winds raging out from this mass of chill frost walling the warm air out. And a curtain of sea ice insulating the surface air and mainland ice sheets from an increasingly warm world. A world that is now on track to experience one of its hottest years on record.
Antarctica, the coldest place on Earth, may well seem impregnable to this warming. But like any other fortress, it has its vulnerable spots. In this case, a weak underbelly. For in study after study, we keep finding evidence that warm waters are rising up from the abyss surrounding the chill and frozen continent. And the impact and risk to Antarctica’s glacial ice mountains is significant and growing.
(Collapse of ice structure at the leading edge of the Filchner-Ronne Ice Shelf adjacent to a rapidly warming Weddell Sea during January of 2010. A new study has found warm water upwelling from the Circumpolar Deep Water is rapidly approaching this massive ice shelf. Loss of Filchner-Ronne and its inland buttressed glaciers would result in 10 feet of sea level rise. Image source: Commons.)
For a study this week confirmed that Antarctica is now seeing a yearly loss of ice equal to one half the volume of Mt Everest every single year. A rate of loss triple that seen just ten years ago. An acceleration that, should it continue, means a much more immediate threat to coastal regions from sea level rise than current IPCC projections now estimate.
Shoaling of the Circumpolar Deep Water
The source of this warm water comes from a deep-running current that encircles all of Antarctica. Called the Circumpolar Deep Water, this current runs along the outside margin of the continental shelf. Lately, the current has been both warming and rising up the boundaries of the continental zone. And this combined action is rapidly bringing Antarctica’s great ice sheets under increasing threat of more rapid melt.
According to a new study led by Sunke Schmidtko, this deep water current has been warming at a rate of 0.1 degrees Celsius per decade since 1975. Even before this period of more rapid deep water warming, the current was already warmer than the continental shelf waters near Antarctica’s great glaciers. With the added warming, the Circumpolar Deep Water boasts temperatures in the range of 33 to 35 degrees Fahrenheit — enough heat to melt any glacier it contacts quite rapidly.
Out in the deep ocean waters beyond the continental shelf zone surrounding Antarctica, the now warmer waters of this current can do little to effect the great ice sheets. Here Sunke’s study identifies the crux of the problem — the waters of the Circumpolar Deep Water are surging up over the continental shelf margins to contact Antarctica’s sea fronting glaciers and ice shelves with increasing frequency.
In some cases, these warm waters have risen by more than 300 feet up the continental shelf margins and come into direct contact with Antarctic ice — causing it to rapidly melt. This process is most visible in the Amundsen Sea where an entire flank of West Antarctica is now found to be undergoing irreversible collapse. The great Pine Island Glacier, the Thwaites Glacier and many of its tributaries altogether composing enough ice to raise sea levels by 4 feet are now at the start of their last days. All due to an encroachment of warm water rising up from the abyss.
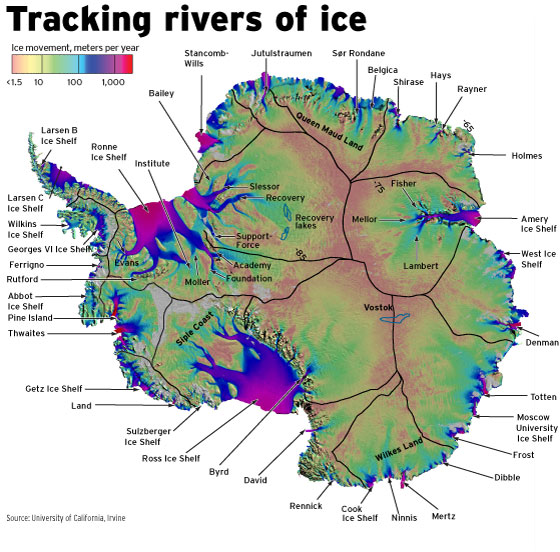
(Antarctic rivers of ice. Rising and warming waters from the Circumpolar Deep Water along continental margins have been increasingly coming into contact with ice shelf and glacier fronts that float upon or face the surrounding seas. The result has been much higher volumes of melt water contributions than expected from Antarctica. Image source: University of California.)
But the warm water rise is not just isolated to the Amundsen Sea. For Sunke also found that the warm water margin in the Weddell Sea on the opposite flank of West Antarctica was also rapidly on the rise. From 1980 to 2010, this warm water zone had risen from a depth of about 2100 feet to less than 1100 feet. A rapid advance toward another massive concentration of West Antarctic ice.
The impacts of a continued rise of this kind can best be described as chilling.
Sunke notes in an interview with National Geographic:
If this shoaling rate continues, there is a very high likelihood that the warm water will reach the Filchner Ronne Ice Shelf, with consequences which are huge.
Filchner Ronne, like the great Pine Island Glacier, has been calving larger and larger ice bergs during recent years. Should warm waters also destabilize this vast ice shelf another 1.5 feet of sea level rise would be locked in due to its direct loss. Including the massive inland glaciers that Filchner Ronne buttresses against a seaward surge, much larger than the ones near the Amundsen sea, would add a total of 10 feet worth of additional sea level rise.
Together, these destabilized zones would unleash much of West Antartica and some of Central Antartica, resulting in as much as 14 feet of sea level rise over a 100 to 200 year timeframe. This does not include Greenland, which is also undergoing rapid destabilization, nor does it include East Antarctica — which may also soon come under threat due to the encroachment of warm waters rising from the depths.
Are IPCC Projected Rates of Sea Level Rise Too Conservative?
The destabilization of glaciers along the Amundsen sea, the imminent threat to the Filchner Ronne Ice Shelf, and the less immediate but still troubling threat to East Antarctica’s glaciers, together with a rapidly destabilizing Greenland Ice Sheet, calls into question whether current IPCC predictions for sea level rise before 2100 are still valid.
IPCC projects a rise in seas of 1-3 feet by the end of this Century. But much of that rise is projected to come from thermal expansion of the world’s oceans — not from ice sheet melt in Antarctica and Greenland. Current rates of sea level rise of 3.3 milimeters each year would be enough to hit 1 foot of sea level rise by the end of this Century. However, just adding in the melting of the Filchner Ronne — a single large ice shelf — over the same period would add 4.4 milimeters a year. Add in a two century loss of the Amundsen glaciers — Pine Island and Thwaites — and we easily exceed the three foot mark by 2100.
Notably, this does not include the also increasingly rapid loss of ice coming from Greenland, the potential for mid century additions from East Antarctica, or lesser but still important additions from the world’s other melting glaciers.
Such more rapid losses to ice sheets may well reflect the realities of previous climates. At current CO2e levels of 481 ppm (400 ppm CO2 + Methane and other human greenhouse gas additions) global sea levels were as much as 75-120 feet higher than they are today. Predicted greenhouse gas levels of 550 to 600 ppm CO2e by the middle of this century (Breaking 550 ppm CO2 alone by 2050 to 2060) are enough to set in place conditions that would eventually melt all the ice on Earth and raise sea levels by more than 200 feet. For there was no time in the past 55 million years when large ice sheets existed under atmospheric CO2 concentrations exceeding 550 parts per million.
Glaciologist Eric Rignot has been warning for years that the IPCC sea level rise estimates may well be too conservative. And it seems that recent trends may well bear his warnings out. If so, the consequences to millions of people living along the world’s coastlines are stark and significant. For the world, it appears we face the increasing likelihood of a near-term inland mass-migration of people and property. A stunning set of losses and tragedy starting now and ongoing through many decades and centuries to come.
Links:
Warming Seas Drive Rapid Acceleration of Melting Antarctic Ice
Mass Loss of the Amundsen Sea Embayment of West Antarctica
Multidecadal Warming of Antarctic Waters
Research Casts Alarming Light on Decline of West Antarctic Glaciers
Antarctic Ice Shelf Being Eaten Away by Sea


Ouse M.D.
/ December 5, 2014Offtopic:
meandering jetstream in my homeland caused whole forests freezing to death.
Absolute devastation in northern Hungary
http://index.hu/video/2014/12/05/fapokalipszis_most/
similar events in 2004, 2011
LikeLike
robertscribbler
/ December 5, 2014Man that’s rough.
LikeLike
climatehawk1
/ December 5, 2014Not really off topic–folks frequently share climate-change-pertinent clips here, making it a great place to learn. MHO.
LikeLike
robertscribbler
/ December 5, 2014All things climate change are on topic.
LikeLike
climatehawk1
/ December 5, 2014Thank you for the confirmation, Robert. Thought I would venture reassurance in case you were busy.
LikeLike
Apneaman
/ December 6, 2014Robert scribbles for economic social and environmental justice. Says so right in the header ;))
LikeLike
james cole
/ December 6, 2014Looks like mega ice storm damage. The weight of ice breaks trees to bits when the winds arrive after the freezing rain. Several major incidents of this type have damaged our forests, hard woods take the worst of it, pines do better, but still the little ones bend over and break. It takes a perfect temperature blend, freezing rain as a big cold front moves in, a large ice build up followed by subzero arctic winds. This is new to us too, in the last decade three major incidents of this type.
LikeLike
Griffin
/ December 6, 2014And its downright scary when the trees are all iced up and that wind starts to blow, you can feel the destruction all around you.
LikeLike
Eric
/ December 6, 2014A few years back there was a big ice storm in Charlotte, NC and surrounding area. The leaves were still on the trees so a good sized tree could have literally tons of ice forming on its branches and leaves. This leads to some very heavy ‘natural’ pruning.
LikeLike
robertscribbler
/ December 6, 2014I think with these more intense precipitation events, as a result of an amped up hydrological cycle, that we would expect some of the icing events to be more extreme than is typical.
LikeLike
humortra
/ December 5, 2014“Natural gas: The fracking fallacy
The United States is banking on decades of abundant natural gas to power its economic resurgence. That may be wishful thinking.”
http://www.nature.com/news/natural-gas-the-fracking-fallacy-1.16430
LikeLike
Ken Barrows
/ December 6, 2014Not may be. Is. But perhaps someone, someday, can demonstrate the positive cash flow at current prices. Haven’t seen it yet.
LikeLike
james cole
/ December 6, 2014Indeed! Right now Poland and Hungary had pinned great hopes on shale gas reserves. Upon closer examination 90% of the miracle disappeared. After all the leases and test holes, after changes to the laws taking away land owners rights, and ditching water regulations. After all that, it came to nothing, the reserves were an illusion. I must say, I hope for the same result in the United Kingdom, before one of God’s great gifts, the British Isles are spoiled by mass fracking.
LikeLike
Spike
/ December 6, 2014You and me both James.
LikeLike
Ed-M
/ December 9, 2014And it looks like once the US fracking extraction peaks, Russia will be in the catbird seat for a good time to come. Of course, they’ll be having their own peak FF problems by then, too, what with the Russkies and ExxonMobil already drilling in the Arctic, eastern and central Siberia being eyed for fracking, and AGW possibly throwing a monkey wrench into that tundra methane deposits, which the Federation may be counting on for reserves. (Hint: it can no longer be counted as reserve, once it’s escaped into the air!)
Yep. We are ALL in for a world of hurt.
LikeLike
Kevin Jones
/ December 5, 2014Very thorough synopsis, Robert. Thanks yet again. Ouse MD. Don’t know your language but your trees and those here in northeast USA are speaking the same. Thanks all.
LikeLike
Spike
/ December 5, 2014Strangely enough Robert I was reading this old article today:
“Hansen could be more right than he thought back then. The new study, conducted by a team of earth and atmospheric scientists of Arizona University, and upcoming in Geophysical Research Letters, has tried to better reconstruct the Eemian ocean temperatures from the fossil record. They find the temperature difference was even smaller, just +0.7 degrees Celsius (> late Holocene).
They also use an adjusted figure for the Eemian sea level, which they state was [at the peak about 125,000 years ago – sea level height is much easier to reconstruct from sediments than temperature] 8-8.5 meters higher than today.”
http://www.bitsofscience.org/eemian-sea-level-rise-2189/
So it looks like the last interglacial was about as warm as today, and looking at the original paper the authors suggest “estimates of the sea level contributions from the Greenland Ice Sheet, glaciers and ice caps, implies that 4.1 to 5.8 m of sea level rise during the Last Interglacial period was derived from the Antarctic Ice Sheet. These results reemphasize the concern that both the Antarctic and Greenland Ice Sheets may be more sensitive to temperature than widely thought.”
LikeLike
robertscribbler
/ December 5, 2014Too bad Hansen’s in semi-retirement. We need more like him.
LikeLike
bassman
/ December 5, 2014Hansen really got me interested in CC. I like the way he explains the science.
LikeLike
Kevin Jones
/ December 5, 2014Hansen’s work over the past 35 years has informed my thinking probably as much as all others combined. The man has truly known what he has tried so hard to share. He said recently that he feels he’s failed to communicate. I assured him he had not failed me.
LikeLike
robertscribbler
/ December 6, 2014I think his communication was mostly blocked. He needed a bigger platform and no-one with the ability to give it to him seemed to recognize that fact.
I recall Hansen’s discussion of the Eemian. It would seem that some of the more visible scientists might have caught up with him by now.
My view is mostly informed by Hansen in that I think we’re probably already out beyond the Eemian when it comes to temperature. There’s no comparison at all when it comes to net forcing and total ghg levels (3 million + years). And the rate of buildup, especially of the initial forcing, is probably unprecedented in all the geological record.
We just simply can’t go on like this. He knows it. That’s why he’s out there fighting pipelines and coal plants.
LikeLike
wili
/ December 6, 2014“And the rate of buildup, especially of the initial forcing, is probably unprecedented in all the geological record.”
And as I tried to point out to my students today, rate of change is everything.
I held up a piece of chalk and asked if it looked dangerous. (They mostly look at me like I’m crazy when I ask these kinds of things, which…maybe I am…but at least I got their attention for a few seconds…Beuller, Beuller??)
Then I asked if it would be dangerous if I very slowly moved it towards my head (and I obligingly slowly moved it toward my head and slowly moved my head as it started pushing against it). (More embarrassed silence…”OK, now he has completely lost it…”)
Then I asked what would happen if I loaded the piece of chalk in a gun and shot it into my head point blank…(again, at least I got their attention).
Then I pointed out that the only difference between these scenarios was rate of change.
Rate of change is everything.
We are firing the bullet rather than gently pressing the piece of chalk next to the nutty prof’s bewildered head….
LikeLike
robertscribbler
/ December 6, 2014I think this is a wonderful illustration, Wili. Your students are fortunate to have you.
LikeLike
climatehawk1
/ December 6, 2014Yes, he definitely gets a gold star for the “loading the climate dice” analogy. Was the best thing I saw until steroids, which hadn’t yet been “popularized” when he testified in 1988. And may I just add that the American Wind Energy Association, of which I was then Executive Director, and the Solar Energy Industries Association sponsored a conference called the Forum on Renewable Energy and Climate Change in early 1989, with James Hansen as the keynote speaker? Too bad we collectively decided to bag the next 25 years.
LikeLike
Andy in San Diego
/ December 6, 2014He communicates just fine, the issue is people don’t want to listen.
LikeLike
Kevin Jones
/ December 6, 2014Re: Hansen’s efforts
http://www.businessweek.com/articles/2014-12-04/global-warming-james-hansen-on-introducing-it-to-the-public
LikeLike
robertscribbler
/ December 6, 2014Great article. Glad to see Businessweek covering it.
LikeLike
mikkel
/ December 6, 2014Hansen deserves a lot of credit, but I wish that the history of global warming theory was talked about more. For example, I happened to run across a book written in the 60s that was the record of a symposium about energy in which Edward Teller (quite the radical leftist) was warning that we had to completely cease fossil fuel usage by the year 2000 due to the threat of global warming. He stated an ESS of 6 degrees.
I just happened to run by Shell arguing against global warming potential back in 1959
http://books.google.co.nz/books?id=qYkP2bThsFEC&pg=PA644&lpg=PA644&dq=teller+american+chemical+society+1957&source=bl&ots=EgHZMHNY9n&sig=ZmHxV6Ejkb_d_sprjIKfewQ34RE&hl=en&sa=X&ei=L_WCVKPbBJe58gXg_YCgCg&ved=0CDoQ6AEwBQ#v=onepage&q=teller%20american%20chemical%20society%201957&f=false
LikeLike
mikkel
/ December 6, 2014Also Alvin Weinberg http://www.the-weinberg-foundation.org/learn/alvin-weinberg/
His landmark 1974 Science journal article, ‘Global Effects of Man’s Production of Energy’ , warned of the long-term consequences for the climate of continued fossil fuel use. In 1975, Weinberg persuaded the US Department of Energy to fund a groundbreaking climate change research program at ORNL. The program trained up a cohort of energy and climate change specialists, and helped clarify the human and environmental costs of ongoing reliance on coal for electricity.
LikeLike
robertscribbler
/ December 6, 2014It’s true that quite a bit happened pre Hansen. I think it’s also pretty true that fossil fuel companies have been running misinformation cover for climate change since the 1950s. It would be a good study to dig back into both the climate policy history, the media coverage, and related fossil fuel advertising campaigns from the 1950s through the late 80s. Climate change denial as a montra was certainly alive and well by the 80s and Hansen has to confront that head on in his initial public discussions.
LikeLike
robertscribbler
/ December 6, 2014Teller was right…
LikeLike
Andy in San Diego
/ December 6, 2014The “hiatus” (non-hiatus) comes to bite us.
That is a tremendous amount of energy required to push those deep temperatures up. Is it a slow current in the deep? And if so, is there the opportunity for even high temperature water to follow on that current?
LikeLike
Griffin
/ December 6, 2014Great questions Andy. After reading Roberts post I wondered some of the same. How could we know that in a few years that those glacial fronts won’t be kissed by water that’s 37F and inducing an even greater loss rate? Tripled in a decade already, that’s catapult-shot acceleration.
LikeLike
robertscribbler
/ December 6, 2014I don’t mention natural variability in the article, or how variability may affect the trend. But given what we’ve seen in other regions, the advance of this whisking heat is likely to be uneven. That said, I think Hansen’s dice are loaded for more going forward, with broader and broader geographic effect.
LikeLike
robertscribbler
/ December 6, 2014We have strong down-welling in the region of 60 degrees south Latitude. This is driven to a degree by warmer, saltier water flowing south and to a degree by fresh meltwater moving north from the more rapidly melting glaciers. The downwelling zone transfers warm waters into the deep current which swells to over-ride the continental shelf zone.
A process driven by ocean warming and related stratification.
LikeLike
Steve Bloom
/ December 6, 2014I haven’t seen those details. Link(s)? TIA.
LikeLike
robertscribbler
/ December 6, 2014I’ll need to go back through my notes to dig up the relevant studies, which may be possible by Monday. Levitas had a recent paper showing high heat uptake in this Southern Ocean zone at the surface and ranging into the depths, for example.
You can see this downwelling effect at the surface as cooling in all global climate monitors, though. Any given day on the climate reanalyzer will do. It’s a constant feature these days.
LikeLike
Steve Bloom
/ December 12, 2014Robert, I was particularly interested in the connection between the 60s downwelling and the warmer water cresting over the continental shelf. I don’t think Levitus covered that. Any pointer on this would be appreciated.
LikeLike
Steve Bloom
/ December 12, 2014Is this the Levitus paper you were referring to, BTW?
LikeLike
Griffin
/ December 6, 2014Thank you for another great post Robert!
LikeLike
robertscribbler
/ December 6, 2014Cheers Griffin, best to you!
LikeLike
Miep
/ December 6, 2014Reblogged this on There Are So Many Things Wrong With This and commented:
Surprise, surprise.
LikeLike
Apneaman
/ December 6, 2014LikeLike
robertscribbler
/ December 6, 2014Hey, that’s Luthiel 😉
LikeLike
Apneaman
/ December 6, 2014Press briefing
Lima, Peru
Thursday, 04 December 2014
http://unfccc6.meta-fusion.com/cop20/events/2014-12-04-12-30-abibimman-foundation-united-planet-faith-science-initiative/abibimman-foundation-united-planet-faith-science-initiative-2
LikeLike
robertscribbler
/ December 6, 2014The AMEG, in my view, is an important voice, following an important trend of Arctic meltdown. However, this pushing of geo engineering as a silver bullet solution and taking the focus off of emissions risks the danger of continuing emissions and increasing danger. In addition, the impact of geo engineering on global weather patterns may also be damaging to crops and stable societies.
In other words, you can’t solve the problem at its root unless you deal with the source of the problem itself.
In my view, the fossil fuel companies would much rather attempt to delay emission reductions through this kind of geo engineering. So that line of reasoning to me doesn’t take into account the broader FF company push to ensure continued fossil fuel consumption.
I believe, as an aside, that it is this aspect of the AMEG that has scientists like Gavin Schmidt so concerned about the catastrophic science. If this is true, then it is a valid concern. But it may be resulting in an attack on that wing of the science for the wrong reasons. For example, if there’s a reason to be concerned about AMEG’s geo-engineering policy advancement and ignoring the elephant of continued carbon emissions, then it’s better to address that concern directly, rather than overly down-play potential catastrophic impacts — some of which could well emerge.
LikeLike
robertscribbler
/ December 6, 2014In other words, I would be much more comfortable with AMEG if it were pushing for a rapid reduction of fossil fuel emissions first. Not basically ignoring the issue of fossil fuel emissions — which is the key driver of the whole potentially catastrophic process.
Instead, AMEG pushes untested and likely disruptive geo engineering as a silver bullet when it is, at best, a risky and unproven stopgap. It doesn’t address the underlying driver of warming — fossil fuel emissions. Nor does it seem to contemplate what impacts will arise from pumping more CCN and likely more water vapor into the troposphere and stratosphere. And It doesn’t seem to acknowledge that the Arctic is already growing more cloudy due to added heat driven water vapor in that region.
LikeLike
robertscribbler
/ December 6, 2014Lastly, polar amplification of the kind AMEG warns of is a pure exponential curve. We probably won’t see that kind of ramping, rather a period of spikes and slow downs. On the issue of sea ice, a total loss by 2015 is of much lower likelihood. 2017 and 2020 are more likely, but still nowhere near certain. However, we are dealing with a cloudier Arctic summer and increasing outflows of cold, fresh water from Greenland as negative feedbacks to melt. We can’t ignore these factors as well as the underlying climate variability.
LikeLike
Apneaman
/ December 6, 2014Yes. Intentional geo engineering to fix our unintentional geo engineering is absurd. It would not be inaccurate to say that it is no longer unintentional, since we know the consequences, yet carry on nonetheless. Many free market warriors, like Bill Gates (he doesn’t have enough yet) have positioned themselves to profit from geo engineering, so it would never be just a billion dollars nor would it ever end. Unlike typical street junkies who leave a wake of pain and destruction in their families and communities, power junkies can destroy us all. Our lives mean nothing to these people. Maybe continuing to play nice is a guaranteed death sentence for everyone?
LikeLike
robertscribbler
/ December 6, 2014Nor would it ever end without breaking… Nor would it have all the intended consequences… Nor would it ever address the underlying root problem, only some of the symptoms…
It really is a kind of pure free market approach to global warming, isn’t it? Profit from treatments, increasingly complex and expensive, while never looking for a cure.
Bill Gates is positioned to profit from geo-engineering? I wasn’t aware that a market position for this had yet been established.
LikeLike
climatehawk1
/ December 6, 2014Plus, how long would it take to really find out the results of any geoengineering experiment? It is taking decades to understand the results of the massive one we’re doing now, and surprises are still coming in.
LikeLike
Kevin Jones
/ December 6, 2014Apneaman. Gaia vs. Anthropocene? You picked a fine time to leave me Luthiel! (apologies to Kenny Rogers…and everyone else!)
LikeLike
Apneaman
/ December 6, 2014lol. I’m still waiting for Kenny to Apologize for “Six Pack”
LikeLike
robertscribbler
/ December 6, 2014Gaia vs Anthropocene? I like that 🙂
LikeLike
Apneaman
/ December 6, 2014Nothing has been officially established, but all the necessary maneuvering has taken place. Pass the legislation or whatever it takes and it’s game on. Gates has the multiple patents. Gates has funded the research of a scientist, David Keith, who also has a company that will conveniently perform, for a profit, the service. There was no market for fluoridated water either until they conjured one up. Lot’s of heavy hitters besides Gates.
David Keith hopes we don’t have to use his ideas to reverse global warming
http://www.bostonglobe.com/magazine/2013/10/19/how-geoengineering-and-harvard-david-keith-became-hot-topic/JBkPRydP1Tnd86oclwJT8K/story.html
LikeLike
robertscribbler
/ December 6, 2014Geo-engineering should not become a means to get us into more Faustian debt than we already are. Emissions cuts are the foremost importance. And geo engineering is a stopgap. We shouldn’t see it as anything other than a very risky stopgap.
LikeLike
wili
/ December 6, 2014Apologies if this has been linked already.
Here’s a new article featuring Rignot who says a third of the West Antarctic Ice Sheet (WAIS) will be gone between 100-200 years:
http://www.washingtonpost.com/national/health-science/research-casts-alarming-light-on-decline-of-west-antarctic-ice-sheets/2014/12/04/19efd3e4-7bbe-11e4-84d4-7c896b90abdc_story.html
” So how fast could the loss of West Antarctica unfold? Velicogna’s co-author, Eric Rignot of UC-Irvine, suggested that in his view, within 100 to 200 years, one-third of West Antarctica could be gone.
Rignot noted that the scientific community “still balks at this” — particularly the 100-year projection — but said he thinks observational studies are showing that ice sheets can melt at a faster pace than model-based projections take into account.
The consequences of such an amount of sea-level rise for the United States — or for any other coastal region — are staggering to contemplate.”
(Nice animation, too, though a little slow, and in need of captions or explanatory voice-over–and of course there is the obligatory commercial.)
I found the text and graphics here to be useful in understanding these dynamics, especially under “Current melting, thinning and acceleration.” Not sure how to post graphics in here, though. http://www.antarcticglaciers.org/glaciers-and-climate/shrinking-ice-shelves/pine-island-glacier/
LikeLike
wili
/ December 6, 2014Oops, I just noticed that my first link is in robert’s list at the end of his post. Rignot seems to be on the forefront of these new predictions. I wonder if at some point he is going to get some backlash from some of the modeler types, as we’ve seen wrt methane in the Arctic.
LikeLike
robertscribbler
/ December 6, 2014I don’t know. Many if the models have simply assumed ice sheet response would be slow. Not all, though.
LikeLike
robertscribbler
/ December 6, 2014I think a part of the vehemence to a more rapid Arctic carbon response than expected is due to AMEG’s promotion of geo engineering and downplaying of the larger fossil fuel emissions problem. And that concern is certainly valid regardless of how rapid the Arctic carbon response ends up being, ultimately.
LikeLike
wili
/ December 6, 2014I’m going to try to drag the image in here and see what happens, since it illustrates, I think, very well the mechanism described under robert’s section, “Shoaling of the Circumpolar Deep Water”:
LikeLike
Griffin
/ December 6, 2014Good graphic. I would think that how much acceleration of basal melt occurs would be very difficult to predict once the grounding line retreats back from the ridge. Float, melt, break. On and on.
LikeLike
robertscribbler
/ December 6, 2014One of the researchers for this most recent series of basal melt papers compared the process to rolling a ball down a hill. You can’t really stop it once it gets going.
LikeLike
robertscribbler
/ December 6, 2014It’s a good one, Wili. Thanks for including it here.
LikeLike
robertscribbler
/ December 6, 20141/3 of West Antarctica in 100-200 years is 4.5 feet from that melt zone alone.
LikeLike
Tom
/ December 6, 2014Reposted this essay on SOTT
in response to yet another “global warming is a scam” comment
[by the author of an article called :
Report claims consumers are uninformed regarding ‘cowgate’ contribution to global warming
where he arrives at the erroneous conclusion that because this particular report is spurious, the concept of global warming is non-existent]
presented as evidence to the contrary with a link to here.
LikeLike
robertscribbler
/ December 6, 2014Cheers, Tom. The blame shifting away from fossil fuels continues apace. Although, Veganism certainly helps matters.
Best to you.
LikeLike
Ouse M.D.
/ December 6, 2014Back to the polar vortex splitting in January 2013
Vortex splits up to now mainly in February, January and December.
I guess with this one in November another record broken…
Pretty good explanation:
LikeLike
robertscribbler
/ December 6, 2014The late November event is out of the context of NH winter. It didn’t feature SSW, though it did feature an anomalous warming of the stratosphere. Might be more a weird hybrid event. That said, we did see a polar vortex split as well as a massive polar warm air invasion.
Since then, the dipoles have weakened, the Jet has strengthened and the Pacific storm track has intensified. El Niño is a stronger prospect.
We’ll have to keep an eye out through early to mid December. But the pattern shaping up so far appears rather different from last year. With more to point toward an El Niño like pattern despite the strange late November event.
LikeLike
rayduray
/ December 7, 2014Bloomberg’s Grid feature discusses the severity of the California drought:
http://www.bloomberg.com/news/2014-12-05/california-s-drought-ranks-worst-in-at-least-1-200-years.html
In brief:
“Record rains fell in California this week. They’re not enough to change the course of what scientists are now calling the region’s worst drought in at least 1,200 years.
“Just how bad has California’s drought been? Modern measurements already showed it’s been drier than the 1930s dustbowl, worse than the historic droughts of the 1970s and 1980s. That’s not all. New research going back further than the Viking conquests in Europe still can’t find a drought as bad as this one.”
LikeLike
robertscribbler
/ December 7, 2014A critical study that both shows how resilient California has been to an extraordinary event as well as highlighting an instance of overwhelming scale that begs the question — how much longer can communities in a California hold out?
Climate change in action.
We have a succession of storms in the pipe, but it will take a score of events of the intensity we saw this week to break the drought.
In the 5-10 day forecast, the ridge returns. But this time it sets up in the middle of the US through Central Canada, bringing temperatures up to 30 degrees above average to places like Hudson Bay. At any other time, meteorologists would be declaring a freak winter warm up. But the weather media has so normalized extreme events that this shift barely warrants a passing remark.
Up to my nose in papers on carbon release at the end of the last ice age and potential carbon store releases during the current human warming. Rather sobering. At the very least, the Schuur survey of Permafrost experts is a must read. Will be posting on the new research from late November and putting it into the context of the expert survey this coming week.
Worth noting that carbon will also come from the warming ocean in both the form of release from the near surface store as well as from those deeper stores that do destabilize.
LikeLike
Wharf Rat
/ December 7, 2014California’s holiday gift: forecasts of a wet winter
Kurtis Alexande, San Francisco Chronicle
Updated 9:40 am, Saturday, December 6, 2014
Meteorologists say periodic showers are likely through the middle of December, while new federal climate models, including a bumped-up forecast for El Niño, hint at definitively soggier months ahead.
http://www.sfgate.com/bayarea/article/California-s-holiday-gift-Forecasts-of-a-wet-5938485.php
my area
North Coast stream flows above normal
Area retains exceptional drought designation
Stream flows are running above “normal” in the region following the series of storms during the past week. The Thanksgiving storms dropped .92 inches on Nov. 28; .80 on Nov. 29; .72 on Nov. 30; .04 on Dec. 1; .88 on Dec. 2 and 1.36 on Dec. 3 in the Willits area. Since Oct. 1 area rains are “normal” based on 102 years of data
http://www.ukiahdailyjournal.com/ci_27075845/north-coast-stream-flows-above-normal?source=most_viewed
Experts don’t think the drought can be broken in one year. Rat saw it happen in ’78.
LikeLike
robertscribbler
/ December 7, 2014Rather long train of storms heading toward California now. The block has been squashed off to the south. North California more likely to see the bulk of this current batch, though.
LikeLike
todaysguestis
/ December 7, 2014Updated estimates of arctic soil carbon stocks…
” Total estimated SOC storage for the permafrost region is ∼1300 Pg with an uncertainty range of ∼1100 to 1500 Pg. Of this, ∼500 Pg is in non-permafrost soils, seasonally thawed in the active layer or in deeper taliks, while ∼800 Pg is perennially frozen. This represents a substantial ∼300 Pg lowering of the estimated perennially frozen SOC stock compared to previous estimates.”
http://www.biogeosciences.net/11/6573/2014/bg-11-6573-2014.html
LikeLike
robertscribbler
/ December 7, 2014Thanks TDG. This is 400 pg lower than previous estimates I’ve seen (2013). Still a very large store for the soil carbon only even if this revision bears out.
LikeLike
robertscribbler
/ December 7, 2014Actually, this is not a reduction for carbon stored in the 0-3 meter range 1035 Pg for this work, as opposed to 1027 Pg for earlier estimates.
LikeLike
robertscribbler
/ December 7, 2014Actually, the 0-3 meter layer is basically unchanged (1035 vs 1024). The deep layer below 3 m is revised downward from 680 approx to 282 approx.
LikeLike
robertscribbler
/ December 7, 2014Won’t exceed the potential human emission. But it will make matters worse and it will continue on for centuries to come. Worth noting that rapidly reduced emissions by humans cuts the size of this pulse by 2/3. So cutting and eliminating emissions from the human source is critical.
LikeLike
wili
/ December 7, 2014“Won’t exceed the potential human emission.” Would you say that this is the difference between a (potentially very large, in this case) positive feedback and a (limited) runaway? Does a feedback have to exceed the initial forcing to be considered runaway?
I look forward to your discussion of permafrost. Skeptical Science did a review of the science back a ways, and it convinced the main writer there (I forget who) that this is the one that is most likely to have the largest impact this century. I got the impression that reviewing the latest science kind of freaked him out.
LikeLike
robertscribbler
/ December 7, 2014I should have said — probably won’t exceed the rate of human emission as a result of permafrost feedback.
Here’s a brief preview of what I have:
1. The Bolling Allerod period included a 100 GT C emission from the permafrost store. Enough for a 20 ppm CO2 spike (approx) and a 150 ppb methane spike. This is a total of 20 and 30 percent of the methane and CO2 response to the small orbital forcing changes that triggered the end of the last ice age. The permafrost spike was only due to partial thaw and occurred over two centuries.
2. Permafrost includes shallow and deep carbon stores. The shallow store is more vulnerable to rapid release. But the deep store can be tapped by water driven melt wedges. Wildfire is also a primary trigger of shallow carbon store release.
3. Once the Permafrost thaws, most of the carbon eventually releases to the atmosphere. This process happens over decades. Some of the carbon is captured by biota. But these in turn release N2O, which offsets a good portion of the captured carbon. The effect of Permafrost thaw is that between 80 and 100 percent of the carbon is released or effectively released.
4. The Northern Hemisphere terrestrial shallow and deep permafrost carbon store is 1700 gigatons. Which is, by itself, enough to double or more the current total atmospheric carbon store.
5. If human emissions were kept to RCP 2.6 levels, then the annual emission from the permafrost carbon store alone is estimated to be 10 percent of current human emissions or 1 GT per year by the end of this century. This is twice the rate of the Bolling Allerod emission. (Schuur paper)
6. We passed the RCP 2.6 threshold two years ago.
7. Under ECS climate sensitivity, we have emitted enough ghg to warm the Earth by 1.9 C by the end of this century already.
8. The mainstream science assumes that 2-3 percent of the Permafrost Carbon store comes out as methane.
9. The Schuur Paper assumes that warming stops at 2100. But despite this lowball warming assumption, under RCP 2.6 (the lowest continued emissions scenario, whose threshold we have already passed) permafrost carbon store emissions continue on through at least 2300. The levels of these emissions continue at a rate at least twice those observed just prior to Bolling Allerod.
10. The 20 + ppm CO2 and 150 ppb methane per century atmospheric increase from the release of these carbon stores is enough to continue gradual warming even after all human emissions cease.
11. Warming won’t stop at 2100 as the Schuur paper assumes even if we manage to get back to the RCP 2.6 threshold (through major emissions cuts).
12. We are currently on the path to RCP 8.5 and a permafrost carbon response equal to about six times that seen during the Bolling Allerod.
13. The terrestrial permafrost carbon store does not include the ocean carbon store or the Antarctic a Permafrost carbon store. It does not include the global carbon store that will generally release more carbon as it warms.
14. Based on this assessment there is at least a moderate risk that we are already at the beginnings of a mini runaway. This is defined by conditions that will cause the permafrost to melt entirely over time (many centuries now, much faster if we keep burning fossil fuels and emitting carbon), cause other permafrost stores to release, and eventually melt the major ice sheets, releasing the carbon they store as well.
15. Continued carbon emission of any kind will make this outcome a near certainty. RCP 2.6 is already excessively dangerous. RCP 8.5 is a nightmare beyond science fiction.
LikeLike
wili
/ December 7, 2014Thanks for this overview. Just one point for now: “Once the Permafrost thaws, most of the carbon eventually releases to the atmosphere. This process happens over decades. Some of the carbon is captured by biota.” To the extent that these biota come in the form of tallish bushes and trees, they can drive a locally strong albedo shift–more positive feedback.
LikeLike
Apneaman
/ December 7, 2014No climate-change deniers to be found in the reinsurance business
http://www.theglobeandmail.com/report-on-business/rob-magazine/an-industry-that-has-woken-up-to-climate-change-no-deniers-at-global-resinsurance-giant/article15635331/?page=all
LikeLike
robertscribbler
/ December 7, 2014Maybe they should have a little chat with ALEC.
LikeLike
climatehawk1
/ December 7, 2014If only a chat would have some effect. The wind energy guys attempted to engage with ALEC. No dice–they got some support, but my third-hand impression is that most of the ALEC folks were laughing quietly up their sleeves. Like having a chat with Heartland Institute about misrepresenting climate science.
LikeLike
robertscribbler
/ December 7, 2014Tongue in cheek mainly. True that these guys are zealots unwilling to even acknowledge the problem. If they did, I’d probably be suspicious of some kind of dirty trick.
LikeLike
Griffin
/ December 7, 2014Heavy rain (in Florida of all places) resulted in a nuclear power plant emergency. This is a perfect example of complacency in the face of the changing dynamic of the hydrologic cycle. Extreme precipitation has sometimes unforseen consequences for sure.
http://www.eenews.net/stories/1060009671
LikeLike
robertscribbler
/ December 7, 2014Degrading safety amidst increasingly intense rainfall and rising sea levels is not a good combination…
LikeLike
Alexander Ač
/ December 7, 2014We cannot have safe energy infrastructure in unstable climate. Indeed, we cannot have stable inter-connected global civilization in unstable climate. Only thing guaranteed in unstable climate is chaos.
Alex
LikeLike
robertscribbler
/ December 7, 2014Nuclear plants are very vulnerable to climate disruption and sea level rise, for a certainty. If you’re looking for resilience, you’re basically looking at distributed renewables.
LikeLike
Mark in New England
/ December 7, 2014I wonder how coastal nuclear plants like Seabrook in New Hampshire, for example, are planning for sea level rise? (and how much rise. I suspect the conservative IPCC estimates.)
Will they build giant seawalls around these plants? Relocate them inland? Or better yet, start planning on decommissioning and decontaminating them soon.
LikeLike
robertscribbler
/ December 7, 2014I’ve hear of no plans for decommissioning coastal nuke plants. But there are quite a few very vulnerable sites I’d start with first. South Florida certainly comes to mind.
LikeLike
Griffin
/ December 8, 2014This is a good summary on the subject Mark.
LikeLike
Griffin
/ December 8, 2014And the link!http://www.huffingtonpost.com/2014/05/19/maps-rising-seas-storms-threaten-flood-coastal-nuclear-power-plants_n_5233306.html
LikeLike
robertscribbler
/ December 8, 2014Thanks for this, Griffin.
LikeLike
Tom
/ December 7, 2014http://www.desdemonadespair.net/2014/12/graph-of-day-number-of-natural.html
Graph of the Day: Number of natural disasters, 1900-2012
[quote]
Natural disasters are increasing in frequency and intensity. Between 1901 and 1910 there were 82 recorded disasters, but between 2003 and 2012 there were more than 4,000. Even allowing for better recording, the increase is substantial. Particularly worrying is the much greater incidence of hydrological and meteorological disasters (figure 2.11). Although fatalities from natural disasters appear to be declining, the number of people affected is increasing.
Human Development Report 2014 [link at site]
LikeLike
JWREbel
/ December 7, 2014“The impacts of a continued rise of this kind can best be described as chilling.”
Speaking of metaphors…
LikeLike
robertscribbler
/ December 7, 2014We need a negative metaphor based on heat. Because that’s what’s happening in Antarctica. Basal heating.
LikeLike
Andy in San Diego
/ December 7, 2014The main water supply for Sao Paolo is Sistema Cantareira. It is now at 8.0%.
Rainfall to date should be roughly 216mm (Nov + ~25% of Dec). It has received 138 mm (~63% of normal). Unfortunately, the water level is still dropping 0.1% / day.
Total accumulation so far for December is 3.3mm. This looks like a repeat of last year so far.
LikeLike
wili
/ December 7, 2014I think that someone mentioned that in the Southern Hemisphere summer they are now experiencing, there is a big increase in evaporation from the reservoirs. So you need substantial rains just to keep up with that loss.
On a broader level, so much deforestation has already happened in the Amazon over all that the whole area may be on the verge of tipping over to a vastly different ecosystem, basically savannah/grassland. http://www.digitaljournal.com/news/environment/brazil-pushes-amazon-to-the-brink-of-the-abyss-scientists-warn/article/412357
LikeLike
robertscribbler
/ December 7, 2014With all the basement fires, all this slash and burn and with the rainy season fading, it does appear that tipping point isn’t too far off.
LikeLike
robertscribbler
/ December 7, 2014The pattern looks pretty dry as well. November clouds over the rain forest have receded into December.
LikeLike
joni
/ December 8, 2014http://www.bloomberg.com/news/2014-12-05/india-says-pollution-levels-need-to-rise-further-to-boost-growth.html
“India said its pollution levels will need to increase in the years ahead to support its economic development and it won’t discuss limiting greenhouse-gas emissions at United Nations climate talks that began this week.”
http://www.ibtimes.com/climate-change-could-cost-world-over-half-trillion-dollars-year-2050-un-report-1737524
“Developing nations could need as much as $500 billion a year by 2050 to adapt to the effects of a warming climate, the United Nations said, significantly revising its earlier figure of $100 billion a year estimated by the U.N.’s Intergovernmental Panel on Climate Change (IPCC). The new figures were presented in the first ever Adaptation Gap Report released by the agency on Friday.”
LikeLike
robertscribbler
/ December 8, 2014Fantastic post Joni. Pretty clear that continued fossil fuel emissions are incompatible with economic prosperity.
LikeLike
Spike
/ December 8, 2014Heatwaves in Europe of 2003 severity likely every other year by 2030s.
http://www.theguardian.com/environment/2014/dec/08/heatwaves-likely-every-other-year-by-2030s-says-met-office-study
LikeLike
robertscribbler
/ December 8, 2014The 2020s look like a pretty rough decade when it comes to ramping impacts…
LikeLike
joni
/ December 8, 2014This current one has already been awful and it isn’t even half done….
LikeLike
robertscribbler
/ December 8, 2014It’s been a rough haul.
LikeLike
climatebob
/ December 13, 2014We know very little about the deep oceans as there are no long term records but we do know that the wind in the southern ocean has been getting stronger. I wonder if this has speeded up the ocean currents and has caused warm water to spill into new areas?
http://www.climateoutcome.kiwi.nz/blog/infrastructure-loss-in-new-zealand-due-to-sea-level-rise
LikeLike
Peter Malsin
/ December 17, 2014I’m wondering if Laura Koenig’s research on the formation of aquifers IN the GIS, reported Monday at the AGU conference, has been covered here; another driver/feedback accelerating melt. The magnitude of these hidden water bodies is pretty stunning.
http://www.csmonitor.com/Environment/2014/1216/Why-Greenland-could-lose-more-of-ice-sheet-than-predicted
LikeLike