
The Russian side of the Arctic is heating up.
A high amplitude ridge in the Jet Stream is forecast to develop atop the Yamal region of Russia, expand northward over the Kara and Laptev seas, inject a plume of anomalously warm air over the polar region, and then proceed on along the Arctic Ocean shores of Siberia. Beneath this ridge, temperatures over the Arctic Ocean will spike to +1 to +4 C above average while temperatures over land will hit extreme +20 C and higher anomalies.

(Arctic heatwave invades Siberia in the GFS forecast for later this week as depicted by Climate Reanalyzer.)
Arctic Ocean zones are forecast to see temperatures climb above freezing for much of the 80 degree North Latitude zone. Over Siberia, land-based temperatures are predicted to range from the 40s and 50s along the Arctic Ocean boundary and climb to the 60s to 80s in regions just inland.
As temperatures tend to flatten out over Arctic Ocean waters and as permafrost zones in Siberia are used to far cooler readings during Northern Hemisphere Summer, the predicted heatwave is likely to have some rather strong impacts should it emerge. Most notably, snow cover over remaining land and sea ice is expected to see a rather extreme reduction over the next seven days. In other words, GFS forecast models show Northern Hemisphere snow cover basically getting crushed:


(Massive reduction in Northern Hemisphere [NH] snow cover predicted coincident with Siberian Heatwave later this week. Left frame shows current NH snow cover. Right frame shows predicted NH snow cover for Tuesday, June 9. Image source: Climate Reanalyzer.)
Sparse remaining snow cover in Northeast Siberia along the East Siberian Arctic Shelf coastal zone is expected to be pretty much wiped out. One foot average snow cover along the shores of the Laptev and Kara seas is also expected to melt. And a broad section of remaining snow upon the sea ice is predicted to retreat away from the North Polar region — receding back toward the final haven near Greenland.
Snow is important for spring and summer-time Arctic temperature moderation due to the fact that it provides insulation to sea ice and permafrost as well as serving as a reflective, high-albedo surface that bounces back some of the incoming heat from the 24-hour seasonal Arctic sun. Snow melt, on the other hand, serves to form albedo-reducing melt ponds over the Arctic Ocean sea ice during summer. A critical factor in late season melt forecasting in which more June melt ponds tend to mean lower sea ice totals by end season. In addition, snow melt fills permafrost zone rivers with above-freezing waters that then flow into the Arctic Ocean — providing yet another heat forcing to the sea ice.
Conditions in Context
This weekly trend and forecast is consistent with an ongoing tendency during 2015 for strong ridge formation and warm air slot development over both Alaska and the Yamal region of Russia. The high amplitude ridges also likely have teleconnections with larger weather patterns such as El Nino in the Pacific, the warm water pool (hot blob) in the Northeast Pacific, and record low sea ice extents continuing for most of Northern Hemisphere Spring. Observations that are also consistent with the predictions made by Dr. Jennifer Francis that are a direct upshot of polar amplification set off by human-caused warming of the global climate system.

(GFS model forecast as depicted by Earth Nullschool showing ridge Northwest Territory, trough Greenland and North Atlantic, ridge Kara and Laptev region of Siberia. A dynamic that may be the result of teleconnections set off by factors related to human-caused climate change. Image source: Earth Nullschool.)
It’s worth noting that many of these factors are self reinforcing. For example, more sea ice melt results in higher amplitude wave formation in the Jet Stream. Higher amplitude wave formation in the Jet Stream transports more warmth to the Arctic environment, resulting in more sea ice and snow melt which in turn weakens the Jet Stream further. A longer-term amplifying feedback of Arctic carbon release may also be in play (hinted at by an overburden of both CO2 and methane in the local Arctic atmosphere), which would also contribute to the conditions we now observe.
A final feedback, this one somewhat negative, occurs as a result of Greenland Ice Sheet (GIS) melt. Large cold, freshwater outflows from GIS into the North Atlantic result in localized cooling in that region. This feedback (also related to AMO weakening) enhances trough formation throughout the North Atlantic region adjacent to Greenland and the Canadian Archipelago. A final potential teleconnection to the ridges we see forming over both Yamal and the Alaska/Northwest Territory zone.
Links:
Rapid Arctic Sea Ice Loss Linked to Extreme Weather
Tracking for Early Season Melt Pond Formation at The Arctic Ice Blog


kevin jones
/ June 2, 2015Great job, Robert. I noticed this forecast this morning but got side tracked. This prompted me to visit Rutgers for the first time in a week or so. Huge increase in negative snow cover anomalies to start this heatwave with. http://climate.rutgers.edu/snowcover/chart_daily.php?ui_year=2015&ui_day=152&ui_set=2
LikeLike
wili
/ June 3, 2015A while back at neven’s blog someone posited that the best indicator of season final melt was the level of June snow cover. If that’s true we are likely looking at new lows this year.
LikeLike
robertscribbler
/ June 3, 2015Forecast still needs to bear out. Storm on the way as well. My opinion has been that storms can pull more warm air into the Arctic. The models agree in the forecast. However, we’ll have to wait to see if that prediction bears out.
LikeLike
robertscribbler
/ June 2, 2015Great graphic, Kevin and YIKES. Already in bad shape.
LikeLike
Bill H
/ June 2, 2015Robert, Another negative feedback of the melting of the Greenland ice sheet is that this produces a layer of fresh water on top of the salt water of the arctic ocean (fresh water is less dense than salt water). Since fresh water has a higher freezing point it will freeze more readily. Overall effect: arctic sea ice extent may actually increase, as has been seen in the antarctic as the continental ice has flowed into the sea.
LikeLike
robertscribbler
/ June 2, 2015Well aware of the freshwater wedge feedback. Been writing about it for three years now. And it’s likely one reason we have temporary sea ice expansion in the Southern Hemisphere. The issue with the Northern Hemisphere is that you have a much stronger amplifying feedback from all the albedo loss and carbon store response. So you need a much stronger melt pulse from Greenland to get sea ice growth. Most likely what we see is sea ice retreating toward a haven near Greenland and possibly some expansion into the North Atlantic at the cost of sea ice for the broader Arctic Ocean in the nearer term.
It’s also worth noting that we already have large scale fresh water expansion in the Arctic Ocean proper due to increased river outflow.
So yes, if we have a blue ocean event and this pushes the GIS to hard and fast melt then we may see a pseudo recovery of sea ice as a kind of bounce-back. And in a very bad Greenland melt case where we see 1 meter of sea level contribution from the GIS by mid century, we may see a multi-decadal recovery. But this is in the context of overall long term Arctic and global warming.
This is phase II climate change where equatorial warming and storm formation really start ramping up with high latitudinal T deltas and crazy storm track amplification. Storms of my Grandchildren scenario — something we want to try to avoid like the plague that it is.
Last piece, but a big one to consider. Fresh water outflow from Greenland takes surface heat and transports it to deeper levels in the world ocean system. This is not cooling so much as reshuffling the heat deck. And an ocean with a hot bottom is a dead ocean. So no good news spin there.
LikeLike
Timothy Chase
/ June 4, 2015Bill H writes:
The NSIDC suggests that a slightly higher freezing point has a negligible role and other mechanisms are in play.
Please see:
LikeLike
robertscribbler
/ June 4, 2015Highly recommended reading there.
LikeLike
climatehawk1
/ June 2, 2015Tweet scheduled on this.
LikeLike
KTraugh2
/ June 2, 2015Pretty much^ RS
All benefits gained from negative GIS feedbacks are lost when you account for sea level contribution and enhanced storminess/erosion. This process is discussed in Storms of my Grandchildren by James Hansen.
LikeLike
robertscribbler
/ June 2, 2015Fantastic book which I recommend to anyone interested in future impacts of climate change.
LikeLike
danabanana
/ June 3, 2015This is a posting I did on a known media outlet. My bit is after the quote:
——————————–
In response to SteB1
“A relatively small proportion of the population is scientifically literate. A very small proportion of the scientifically literate have a good grasp of environmental science and scientific ecology. And a very small proportion of these have a fairly good overview. The reason climate change is not seen as an urgent and dire problem, is not because it isn’t a massive problem. It is simply because of a lack of insight or knowledge. ”
That is indeed the real problem. It doesn’t help that we live in a society overloaded with so many distractions and banal information.
Only yesterday I decided to get a copy of Storms of My Grandchildren so I visited a well known high street bookstore. As I browsed through the popular science section I noticed that there was only a small shelf for literature about Climate Change. I couldn’t find the book but I did find multiple copies of various books by James Lovelock and also a dozen copies of Global Warming and Other Bollocks by Stanley Feldman. I went to the desk to ask about James Hansen’s book and they told me that had to be ordered for me from their warehouse. I questioned the salesman as why were there copies of the books mentioned above and not a single copy of Hansen’s and the reply was simply ‘because those books sell more’. It gave me an insight on the level of ignorance that exists out there as well as the pessimistic thought that we are truly done for. When the public chose to buy books on pseudo-science and shun one of the most accurate forecasters of AGW you know we are a long way from accomplishing any significant changes.
Thanks for another great post.
—————————
Sad but true.
LikeLike
firstdano
/ June 2, 2015I was looking at the 500mb baroclinic polar projection the other day and saw this ridge and the one over AK developing, looking for a third for a stable pattern. Looking today, this weird blob looks like two rex blocks will set up, not sure how many times I’ve seen that sort of pattern before at this time of year…anyway, these unusual patterns are becoming more….usual. Not sure I’m comfortable with that.
Best,
D
LikeLike
robertscribbler
/ June 2, 2015Not a normal pattern, but one that was oddly predictable. Yeah, not something to be comfortable with.
LikeLike
rayduray
/ June 2, 2015NASA’s Earth Observatory has an image of boreal forest fires in Canada today.
http://tinyurl.com/qcyzllr
LikeLike
robertscribbler
/ June 2, 2015And speaking of things that make one rather uncomfortable…
LikeLike
james cole
/ June 3, 2015Wood Buffalo National Park. That is some fire!
LikeLike
Andy in San Diego
/ June 3, 2015Bloody shame, that is a beautiful area. I’ve driven through there to Fort Smith from Pine Point.
LikeLike
robertscribbler
/ June 3, 2015These guys are really starting to pop up. Said it before but Canada is catching up with Siberia…
LikeLike
Griffin
/ June 2, 2015According to earth.nullschool, current surface temps at the North Pole are above freezing. I would think that this would not bode well for the continuing progression of the melt season up there.
LikeLike
robertscribbler
/ June 2, 2015You got it, Griff. Nearly entire Arctic in melt pressure temp range now. That and we have wind patterns pushing broad ice export on both sides.
LikeLike
DonnaLou
/ June 3, 2015I’ve been following your blog for a few years now, Robert. But this is my first comment. Can you please define the type of storms we may be looking at in the future? I live in urban Kentucky and plan to build a small house, or perhaps a monolithic dome, on the outskirts of the county next year. I have no idea of what to prepare for…not that anyone does. Or should I just move closer to Mammoth Cave?
LikeLike
robertscribbler
/ June 3, 2015If we get the kind of high T deltas Hansen talks about, if we get the ‘continent sized frontal storms packing the strength of Hurricanes,’ then you may just want to consider moving closer to Mammoth. The kinds of storms we could see in second phase climate change are just tremendous. It’s the pace of change that really makes the potential systems look so out-sized. Lots of cool in one place, lots of hot in another. Ice sheets going down and pushing some amazing instability.
LikeLike
Ed-M
/ June 3, 2015T delta = temperature gradient between hot air mass and cold?
LikeLike
robertscribbler
/ June 3, 2015And welcome to you, Donna!
LikeLike
Andy in San Diego
/ June 3, 2015It has looked all spring long like a low snow pack situation. This will reduce land based albedo, reduce ground moisture, increase spring/summer temperatures. Heat will soak into the permafrost deeper.
LikeLike
robertscribbler
/ June 3, 2015And it looks like a warm storm at Arctic center mass in three days.
OT: anyone find a verification on that crazy forecast calling for 65 C temps in Saudi Arabia by mid June? Just one unverified report from a Saudi climatologist that has rippled through the web. The model runs I’m looking at show 50 C peaks in the 7 day timeframe. Needless to say 65 C would be an all-time global record and likely result in some serious trouble for the Kingdom.
LikeLike
Eric Thurston
/ June 3, 2015That is really crazy! I looked at my thermometer that has both C and F scales to get a quick translation of 65C into F degrees. Well, my thermometer doesn’t go that high. We are heading off the charts.
LikeLike
Jacob
/ June 3, 2015149F is unfathomable. Forecast highs that I can find for Riyadh up to 6/17/15 are 112F.
LikeLike
robertscribbler
/ June 3, 2015Yep. That’s what I find as well. This might basically be a rumor.
LikeLike
Wake
/ June 5, 2015I had read that the 165 was a direct sunlight estimate, wheras all real record are in the shade, with some sort of official covering
I have often wondered how much hotter something can get in the sun, does it simply depend on how fast the material radiates out the energy and is different for every item therefore, or does it depend on airflow, etc
I think the same source said 65 translated to 50 in the shade
LikeLike
Syd Bridges
/ June 3, 2015We’re already at record low levels on NSIDC extent and JAXA area for this time of year. The Kara is rapidly melting and there is some melt in the Laptev. If they and the ESS see huge losses, then the 2012 record low could be under threat this year. I’ve watched the Arctic for a few years now, but I don’t recall such an influx of heat as this before the summer solstice. The loss of snow cover, should it occur, can only make matters worse. But a Congressman has seen a snow goose (or one might have seen what might have been a snow goose), so there’s clearly nothing to worry about.
LikeLike
Paddy
/ June 4, 2015I’m in no hurry to predict a new record, with PIOMAS so far behind what it was in 2012. That’s a lot of ice to melt. But who knows… I wouldn’t have predicted what happened in 2012 either :S
LikeLike
John
/ June 3, 2015Reblogged this on jpratt27.
LikeLike
rayduray
/ June 3, 2015The Christian Science Monitor invites you to take a climate change quiz.
http://www.csmonitor.com/Environment/2012/0928/Think-you-know-the-odd-effects-of-global-climate-change-Take-our-quiz/sealevels
LikeLike
rayduray
/ June 3, 2015Alas, I discover the quiz was old. From 2012. I believe this blog helped me achieve good results however. I scored an 83% correct total. Average is 59%. I imagine this group of Robert Scribbler readers will be considered “gifted” by the CSM people. 🙂
LikeLike
robertscribbler
/ June 3, 2015I think we’d do OK on that one. A few obscure bits that might well be termed climate change culture related. Although I’d say the Monitor could do with some added oomph to their own climate change coverage 😉
LikeLike
Andy in San Diego
/ June 3, 2015NWT Firemap shows ~36 fires active and 9 out.
They were mostly from the Alberta border to Fort Simpson area for about 3 weeks. It is in the past week they have started spreading up to the Norman Wells area.
I’ve been watching this as well as the Yukon fires over the past month or so. They are popping up like daisies now.
http://www.nwtfire.com/nwt-fire-map
LikeLike
rayduray
/ June 3, 2015As compared to the Canadian NW Territories, the U.S. is remarkably quiet right now as regards wildfire. Only 14 incidents on Inciweb. And only one of any size at all (in Florida).
http://inciweb.nwcg.gov/
LikeLike
Andy in San Diego
/ June 3, 2015Yellowknife News
NWT wildfire update: ‘Well in advance of a normal year’
There have been 51 fires to date burning an area of just over 69,000 hectares. There are currently 38 fires still burning in the NWT. As a comparison to our average for this time of year, we’d usually expect seven fires this time of year and just over 5,000 hectares burned, so we’re well in advance of a normal year.
NOTE: Fire crews have been deployed to the NWT from Ontario to help with staffing and response. Crews are getting fatigued already this early in the season.
http://www.myyellowknifenow.com/5540/nwt-wildfire-update-well-in-advance-of-a-normal-year/
LikeLike
Andy in San Diego
/ June 3, 2015‘Staggering’ NWT oil reserve revealed – but it’ll need fracking
The central Northwest Territories is home to around 200 billion barrels of oil, according to a new assessment released on Friday.
Canada’s National Energy Board (NEB), working with the NWT’s Geological Survey, says the Canol Shale holds an estimated 145 billion barrels of oil, with the Bluefish Shale accounting for a further 46 billion barrels.
If you look at the map, it is located on the Mackenzie River. That is bad as we know where the water comes from for fracking. That is bad as we know where the effluent goes.
http://www.myyellowknifenow.com/5284/staggering-nwt-oil-reserve-revealed-but-itll-need-fracking/
LikeLike
Tom
/ June 3, 2015Leave it in the ground [LINGO]!
LikeLike
Paddy
/ June 4, 2015It probably will be left in the ground so long as oil prices remain low. But these things can change.
LikeLike
robertscribbler
/ June 3, 2015Tom’s sentiment is seconded. Leave the darn stuff in the ground.
LikeLike
Ken Barrows
/ June 4, 2015No problem. I guarantee you that marginal cost is greater than marginal revenue
LikeLike
Andy in San Diego
/ June 3, 2015From January, but relevant
Researchers say N.W.T. permafrost is thawing at a dramatic rate
Researchers studying permafrost in the Northwest Territories say it’s thawing at an alarming rate, with parts of the territory losing about a metre a year.
http://www.cbc.ca/news/canada/north/researchers-say-n-w-t-permafrost-is-thawing-at-a-dramatic-rate-1.2900813
LikeLike
robertscribbler
/ June 3, 2015I’m curious about the overall impact this has on holdover fires that just burn and burn through winter only to flare again during spring. From observation, thaw and provision of fuels in the deeper layers is a primary driver.
LikeLike
Andy in San Diego
/ June 3, 2015I read something on that last night as a concern in the NWT. I’ll see if it’s in my browser history or I can find it again.
LikeLike
Andy in San Diego
/ June 3, 2015“Ice asks no questions, presents no arguments, reads no newspapers, listens to no debates. It is not burdened by ideology and carries no political baggage as it changes from solid to liquid. It just melts.”
Dr. Henry Pollack,Professor of Geophysics
University of Michigan
LikeLike
climatehawk1 (@climatehawk1)
/ June 3, 2015Hmmm, so clearly it is being duped by the communist/pinko/liberal conspiracy.
LikeLike
climatehawk1 (@climatehawk1)
/ June 3, 2015The factual bias (notoriously liberal) is a dead giveaway.
LikeLike
dtlange
/ June 3, 2015– My morale improves if I work up something to add to the fray.
A Fossil Fuel Induced Atmospheric ‘Oven’ at the Top of The World.
JUNE 2015: A rudimentary (Google Earth) graphic of some extreme conditions in the northern latitudes — centered on the Gulf of Alaska.
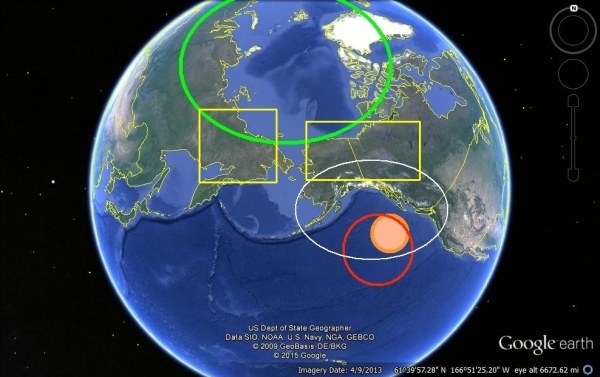
– Resilient RED Ridge’ of high pressure — and a two color ORANGE circle of warm water: E. PACIFIC.
– Baked tundra and permafrost YELLOW fire boxes: E. SIBERIA/AK/NWT.
– Bubbling and bursting methane minefield LITE GREEN circle: SIBERIA/ARCTIC
– Dome of hot stale air under a faltering jet stream. WHITE oblong circle: AK,PNW/GULF OF ALASKA
…
LikeLike
dtlange
/ June 3, 2015-A Fossil Fuel Induced Atmospheric ‘Oven’ at the Top of The World.
SUMMARY:
We have a fossil fuel induced atmospheric ‘oven’ at the top of the world.
Sea ice, glaciers, ice fields, and mountain snowpack are quickly melting, or are absent.
The Eastern Pacific is rapidly acidifying.
The Pacific Northwest, and its rainforests, is fast becoming a giant Desert Northwest.
Methane, an extremely powerful climate killing Green House Gas is exiting its traditional subterranean home through warming and thawing earth surfaces.
Fossil fuels are being extracted and burned at a ravenous rate.
It is only June.
Another five months of the ‘summer’ of 2015remain.
###
LikeLike
robertscribbler
/ June 3, 2015That’s a good graphic, DT. May want to also look over at the Yamal Side where we have another warm air slot in play and to the North Atlantic where it appears we have trough development coincident with AMOC slow down (possible AMO flip).
LikeLike
Greg
/ June 3, 2015In tribute to those who are preparing to fight the fires this “season”, some of whom will likely be lost doing so…
http://www.wired.com/2015/06/fire-season-prep/
LikeLike
dtlange
/ June 3, 2015Yes, and I hope we have no repeats like the needless sacrifice in Arizona of the Granite Mountain Hotshot crew in 2013.
They were sent to work in close to protect homes and structures built in the forest, or the boundary.
Hotshots are there to dig fire lines around the perimeter at a safe distance — not in close with homeowners.
I always thought highly of all Hotshots
I was in Flagstaff at the time. So I followed the story closely.
Almost no one would admit to recklessness of the command actions.
Ps. For many years, during many wildfires, I lived near the end of the main runway of SBA airport when fully loaded air tankers would take off barely clearing the Eucalyptus trees near us.
My wife and i would make sandwiches and snacks, and take them down to the tanker crews.
The sandwiches were well received. 🙂
LikeLike
Ryan in New England
/ June 5, 2015I’m sure all your support for them was well received! Very kind of you and your wife, DT. You’re good people. That’s the kind of thing I tend to do too. In the near future we will all need to be more helpful and kind to one another. This will be a big change for most in America, land of rugged individualism and I-got-mine-so-screw-you attitudes.
LikeLike
kevin jones
/ June 3, 2015If the Climate Reanalyzer Arctic forecast holds it sure looks like a repeat of June 2012 sea ice extent nosedive in coming days. http://nsidc.org/arcticseaicenews/
LikeLike
Andy in San Diego
/ June 3, 2015Only 3 years between low values that run below -2 std deviations. To me it is not as much the low value being challenged, but rather the overall trend seeming to accelerate in the 2000’s.
A lot of contributions to the delta on the trend (albedo, waves, intrusion of southern heat etc…). All bad contributions, all seeming to increase in their contribution.
LikeLike
kevin jones
/ June 3, 2015Yes, Andy. Reminds me of: “The sum of the whole is worse than it’s parts.” Stephen Schneider (a long time ago)
LikeLike
kevin jones
/ June 3, 2015Considering the fantastic changes year to year, ‘repeat’ may not be the appropriate word.
LikeLike
Colorado Bob
/ June 3, 2015Sea levels in retreat a sure sign El Niño’s grip is tightening
El Niños are well known for unleashing droughts, hotter-than-usual weather and paradoxically worse frosts in Australia, but they also drive remarkable – if temporary – changes to global sea levels.
While the shifts under way are so far barely discernible along the Australian coast, pointers of the forces are more evident in countries to Australia’s north.
“The western Pacific has already dropped about 20cm below its normal height, and the eastern Pacific – because it’s warmed up, it’s expanded – is 20-30cm higher than normal,” Andrew Watkins, head of climate prediction services at the Bureau of Meteorology, said.
“You literally start to see less water in the western pacific flowing through the Indonesian Archipelago.”
http://www.brisbanetimes.com.au/environment/weather/sea-levels-in-retreat-a-sure-sign-el-nios-grip-is-tightening-20150603-ghdwix.html
LikeLike
kevin jones
/ June 3, 2015Impressive Time series of ice mass chart at bottom of your link,CB. I’d not seen such an up-to-date one.
LikeLike
robertscribbler
/ June 3, 2015The bit I’ve been wondering about lately is the pretty strong spike we see in the satellite sea level measure. I’m curious if this is an indicator of 2014-2015 El Nino strength, or just the current El Nino amplifying an already quickened trend (implied at 4.4 mm per year rather than 3.3). If it’s an indicator of El Nino strength we are already past 1998 in the standard deviation measure. And still moving higher at this point.
LikeLike
dtlange
/ June 3, 2015“The western Pacific has already dropped about 20cm below its normal height, and the eastern Pacific – because it’s warmed up, it’s expanded – is 20-30cm higher than normal,”
-That’s good. It makes me think of squeezing a water filled balloon, and watching the opposite end bulb out.
LikeLike
Ed-M
/ June 3, 2015There’s a video on YouTube that shows a seaside hotel pool and patio being flooded by seawater. I assume it’s on the Pacific.
LikeLike
Colorado Bob
/ June 3, 2015Indian chicken prices surge to record as heat wave kills millions of birds
* Heat wave kills more than 17 million chickens in May
* Chicken prices in western India soar to record 95 rupees/kg
* Poultry feed demand down nearly 30 percent in 2-3 weeks
http://www.reuters.com/article/2015/06/01/india-heatwave-chicken-idUSL3N0YM0B920150601
LikeLike
robertscribbler
/ June 3, 2015Been looking at the FAO index. So far, so good despite these various droughts and heatwaves. But a decent disruption of the monsoon could change that, especially in the regions impacted.
The US SW looks like it will get some moisture from these tropical systems in EPAC. Information flow from Brazil has again shut down to a trickle.
LikeLike
rayduray
/ June 3, 2015Robert,
Here’s something to go along with the FAO report, this being about the bottom falling out of the corn market in the midwest.
http://www.wsws.org/en/articles/2015/06/02/farm-j02.html
My point is that with the recent inundations in the middle of North America breaking the drought, there’s going to be abundant harvests this year. The Four Horsemen are just going to have to hold their horses….. a bit longer.
LikeLike
robertscribbler
/ June 4, 2015Breaking the U.S. SW drought does serve to mitigate some potential impacts from India. Not sure how India feels about it, given Harsh’s recent comments. South America and Eastern Europe/Central Asia still wild cards.
LikeLike
Brian
/ June 3, 2015From Charleston SC and would like anyone’s thoughts on future hurricane chances, probable strengths, and potential sea level rise for the area given the changing climate. Last storm of note being Hugo a category 4 in 89′. I have recently moved further inland but still work downtown and am curious about the long term sustainability of the downtown area. Thanks in advance.
LikeLike
robertscribbler
/ June 3, 2015Charleston, SC is one of the US’s most vulnerable cities to sea level rise. A combination of factors including global warming based sea level rise due to glacial outflow, reduction in Gulf Stream current strength, subsidence of the region due to crustal rebound, and gravity based SLR due to Antarctic melt all have an impact on Charleston.
Even under a mild global SLR of 3 feet by the end of this century, Charleston is likely to see nearly twice that due to the above factors. And, unfortunately, the range of SLR during that time is likely to be 3-9 feet globally and 5-14 feet for Charleston.
Large areas of Charleston are low-lying so only 1-2 feet of additional sea level rise is enough to cause serious trouble and greatly increase vulnerability to storm surge.
In addition, though hurricane potential may be somewhat murky due to a number of factors (the strongest storms are likely to get stronger, and the season in which storms may form is likely to get longer, but other factors may weigh on frequency), the prevalence of coastal storms along the US East Coast will almost certainly increase as we approach mid-century and as AMOC continues to weaken.
My opinion is that, like many other cities, Charleston will have to decide whether to fight or move inland. Most will fight and this will mean a mounting investment with likely ultimate failure to hold back the rising seas. Some residents will realize this and, as a result, we’ll likely start to see a degree of migration away from the coast. The hit to real estate values, then, is probably coming, and probably coming rather soon.
My opinion is that within the next ten years many people will be planning to move away from the coast (5-20 percent of coastal populations) and that this will be the first of many major setbacks to come for coastal communities.
You can take a look at SLR impacts from this NOAA calculator here:
http://coast.noaa.gov/digitalcoast/tools/slr
You may also try adding storm surges of 3, 6, 9, 12, and 20 feet to determine added vulnerability on top of projected sea level rise.
Finally, there is an outlier chance that sea level rise will proceed faster due to catastrophic destabilization of various glacial systems. In such instances, Century based sea level rise can hit or exceed 10-16 feet globally. The risk for this increases as we approach 2 C above the Holocene average temperature.
Best of luck to you, Brian. For my own part, I’ve been trying to get my parents, sister, and grandparents — who live in the Virginia Beach area — to move inland soon (the sooner the better).
LikeLike
Ed-M
/ June 3, 2015So New Orleans is toast, then. We expect the La. Gulf Coast to subside 3 feet by century’s end. With a 12 foot SLR we’d have to evacuate for every storm.
LikeLike
Ryan in New England
/ June 5, 2015It’s best to move away from the shore while property values still hold. The most vulnerable coastal cities will face a crisis when SLR is acknowledged and factored into decisions by banks, and 30 year mortgages and other loans/investments are refused for continued development. Right now, Miami is still building luxury high rises just a couple feet above sea level, while the streets flood during king tides already. When people stop buying properties because they’ll face flooding by the end of the mortgage, billions upon billions worth of beach front property will become nearly worthless.
LikeLike
rayduray
/ June 3, 2015Hi Brian,
The good news is that the summer appears to be shaping up to be one of the quietest Atlantic hurricane seasons. Various groups have recently made their predictions, many of them summarized at the Jeff Masters’ blog on the Wunderground website and the consensus is that relatively low sea surface temperatures in the Main Development Region, combined with the shearing effects of El Nino should prevent much action.
As regards the Carolinas, I recommend you take a peek at Dr. Orrin Pilkey’s “The Rising Sea” http://tinyurl.com/q84xvoy
Your region is set to have some of the most dramatic dislocations anywhere in the U.S. regarding sea level rise over the next few hundred years. But you’ll probably be just fine tomorrow.
LikeLike
robertscribbler
/ June 4, 2015It’s well known that El Nino reduces Hurricane frequency in the Atlantic. That said, the North Atlantic is still +0.15 C above the already hotter than normal 1979 to 2000 average. So saying it’s cooler is like saying it’s cooler than pretty ridiculously hot. Much of the suppression in extreme deltas is due to North Atlantic cooling near Greenland.
In addition, we have a strong temperature gradient setting up as the Gulf Stream appears to have been shoved southward by the cooler water outflow from the near Greenland region. This gradient increases risk for storm generation as well as for the kinds of hybrid storms that we don’t really like to see either.
One last point — single, very powerful storms have developed during El Nino years. So though frequency has been tamped down, the instance of very powerful storms does not appear to be impacted by El Nino.
Anyone living on the coast in the Southeast or Mid Atlantic is seeing the impact of SLR now. It just gets worse from here. Hopefully, we can hit zero carbon emissions soon and prevent some of the very worst stuff.
LikeLike
Brian
/ June 3, 2015Thank you very much for the detailed response and link to the NOAA calculator. Big help. Looks like I may have made the right choice in moving ahead of the rush. My best to you and good luck with your family.
LikeLike
robertscribbler
/ June 3, 2015Sometimes people ask me where I feel safe in relation to SLR. My answer is that I moved above the fall line.
LikeLike
Greg
/ June 3, 2015Well done answer. I too have family in Va Beach and don’t bother with the get out of there discussion anymore as everyone doesn’t want to talk about downers. They live one mile from the beach and I have the fortune of having a great place to visit and enjoy without any of the responsibility. When I inherit this property I will sell immediately. I think the future developed world progressive coastal communities are going to become very flexible in terms of architecture and infrastructure (or perish) and cater to the well to do mostly who will live on large boats able to move from place to place at a moment’s notice to avoid bad weather and to find the best values in terms of docking/port fees and resource availability.
LikeLike
robertscribbler
/ June 3, 2015No-one wants to talk about downers. I give people books to read instead, then let them come to me with questions.
LikeLike
Greg
/ June 3, 2015For some of my family I would just recommend Nicholas Sparks novellas and be done with it!
LikeLike
robertscribbler
/ June 4, 2015People often complain about how apathetic we’ve become. My view is that this happy bubble reality fuels it.
LikeLike
dtlange
/ June 3, 2015– PDX variable temp swings:
We have been having 4 to 5 days of 30 to 34 F between high and lows — interspersed with two days of a 8 or 9 F difference. And the low is usually quite higher than the norm.
My body is confused. I’m sure the wildlife and flora is too.
LikeLike
dtlange
/ June 3, 2015PDX has low 90 F temps forecast for this weekend.
LikeLike
Taylor
/ June 3, 2015RS, thanks for a great post. I’m a middle school Earth Science teacher in Boston. I’ve found my way here a handful of times from Reddit and have always appreciated your lucid analysis.
One question, based on how flummoxed I am by the idea of a +20C anomaly: Is that entirely unprecedented? If not, where and how often has it happened before?
LikeLike
robertscribbler
/ June 3, 2015It’s happened quite a bit lately. You can usually find one region or another at +20 C (+36 F) anomaly in the global climate maps these days. It usually does mean new record daily highs within that zone, though. It’s a signature of warming pushing new temperature extremes over broader areas. So unprecedented and new normal all together.
Think of it this way. If the average high temperature for the day is 85 degrees F and you’re in one of those +36 zones, then you’re looking at 121 F for that day.
Spatially, we’ve typically seen much of the extreme anoms in the 50-70 North Latitude zones during late spring and summer. Coincident with polar amplification hitting the thawing permafrost zones. Extreme anoms during winter often hit the far upper Latitudes (70-90 North), which is also a blantant signal for polar amplification.
We haven’t seen much of this in the mid latitudes or equatorial zones. So it’s more ‘unprecedented’ when it happens there.
In any case, those living in the far north should be well aware that the climate is changing because they are really, really seeing it.
LikeLike
dtlange
/ June 3, 2015Nice dialogue between you two.
Super synopsis of polar amplification and northern Latitudes.
🙂
LikeLike
Griffin
/ June 3, 2015Stick around Taylor! We get flummoxed on a daily basis on this blog.
In all seriousness, Robert’s blog has become my favorite place for clear information regarding climate. Sometimes the information is relevant to us right here in Massachusetts. Hopefully you become a regular reader of not just the posts, but also all of the comments. The amount of information posted here can be staggering. All of it relevant to the single most important topic of our time. What I have learned here has allowed me to speak on the subject with much more confidence, and has pushed me to activism.
LikeLike
Ryan in New England
/ June 5, 2015Well said, Griffin! There is a fantastic amount of information and knowledge shared here, both in Robert’s great writing/posts and the comments. And you never have to deal with any nonsense from deniers…which is blissful.
LikeLike
dtlange
/ June 3, 2015Harsh Vardhan blames climate change for deadly heatwave, weak monsoon
NEW DELHI
Earth Sciences Minister Harsh Vardhan has blamed climate change for a heatwave that has killed 2,500 people and for deficient monsoon rains, after the government said on Tuesday the country was headed for its first drought in six years.
“Let us not fool ourselves that there is no connection between the unusual number of deaths from the ongoing heat wave and the certainty of another failed monsoon,” Harsh Vardhan said. “It’s not just an unusually hot summer, it is climate change,” he said
http://in.reuters.com/article/2015/06/02/india-climate-change-idINKBN0OI1EG20150602
LikeLike
robertscribbler
/ June 4, 2015Good to see another science guy affirming that ‘climate change is happening now.’ What kills me is that we have to basically heat people over the head with verbal bricks to get them to figure this out.
LikeLike
dtlange
/ June 3, 2015– I do like: ‘British artists KennardPhillipps’ new version of the painting ‘Pearblossom’ by David Hockney. ‘
Why climate action needs the arts
“Art is not a mirror to reflect reality,” wrote Bertolt Brecht, ”but a hammer with which to shape it.” …

LikeLike
dtlange
/ June 3, 2015Environment 100 months to save the world
Why climate action needs the arts
http://www.theguardian.com/environment/2015/jun/03/why-climate-action-needs-the-arts
LikeLike
rustj2015
/ June 3, 2015Yes, art matters and does have effect, though mostly our side of the aesthetic would realize it.
This comment in Bonn involves scientists tenderly presenting the idea that 2 degC is not a good benchmark for current civilization and a lower temp would be better:
Thomas Stocker, a senior Swiss scientist from the U.N.’s Intergovernmental Panel on Climate Change, said governments faced tough choices in managing the risks of warming.
“The elephant in the room is what we can do to change the trend in emissions,” he told delegates.
Mr. Stocker does not mention the tyrannosaurus rex** also present in the room, politely called “the economy” and fitted out with conglomerate human intelligence of its original mendacity and appetite. This beast is adamantly resistant to changes in its diet, is partaking of the discussion and able to respond demonstratively to offense, and sees the planet as its rightful realm.
I believe it has dined on many who have pointed at it in disgust and digested a large portion of the debate. I do not believe it shows more than a pecuniary appetite for art.
These are the presences and atmospheres building for Paris.
**Or, more modern, those beasties in The Matrix
http://www.trust.org/item/20150602173912-ijyvo/?source=fiHeadlineStory
LikeLike
rustj2015
/ June 4, 2015urp, “has digested”
LikeLike
robertscribbler
/ June 4, 2015It’s pretty clear that capitalism’s central flaw is what happens when an industry ends up in a position where its profits come from harming the public and wrecking the commons. That said, directly targeting the destructive industries is a good response. I’d term it a defensive response. The best response, however, is to change the system so that industries do not develop in this manner. That harm reduction is built into the system. Such a system is definitely not capitalistic in nature, as the ideal value inherent to the system would not be based on profit generation. The best ideal would be a value generation system, one that is nimbly adept at confronting harmful behaviors and deconstructing them as well as directly aimed at a broad increase in life value for both humans and all living creatures.
This is a benevolent ideal and one we should consider as an appropriate counter to the greed and hunger that is at the center of capitalism. That said, we live in a hybrid system that includes a good degree of capitalism today. And so we must confront what is the reality at hand. That means fighting the defensive action to take down the harmful industry that is now entrenched.
LikeLike
luddite
/ June 3, 2015At cci-reanalyzer.org go to forecasts, go to Arctic, go to parameter precipitation and clouds. It is raining in the Arctic Ocean. It has been raining in the Arctic Ocean. Considerable rain is in the forecast for the Arctic Ocean. Some posters over at Neven’s are following the precipitable water forecasts. I can’t find any indication anywhere that anyone has noticed that it is raining.
LikeLike
robertscribbler
/ June 4, 2015Warm storm…
LikeLike
Colorado Bob
/ June 3, 2015Warming From Greenhouse Gas Can Be Felt in Just Months, Scientists Say
Global warming is often thought of as a slow, gradual process that plays out over decades, but a new study by climate scientists at the Carnegie Institution for Science says the impact from burning fossil fuels can be felt in a matter of months. Carnegie’s Xiaochun Zhang and Ken Caldeira compared the heat generated by burning coal, oil and natural gas with the warming caused by the resulting release of carbon dioxide into the atmosphere. It took just 34 days for the CO2-caused warming to exceed the amount of heat released by the combustion of a lump of coal. The same threshold was reached in 45 days for a single incident of oil combustion, and in 59 days for a single instance of burning natural gas. “Ultimately, the warming induced by carbon dioxide over the many thousands of years it remains in the atmosphere would exceed the warming from combustion by a factor of 100,000 or more,” Caldeira said in a Carnegie news release.
http://www.nbcnews.com/science/environment/researchers-say-warming-greenhouse-gas-can-be-felt-just-months-n368536
LikeLike
Griffin
/ June 4, 2015Hi CB, curious if you have seen Gavin Schmidt’s media response when asked for his opinion on the paper? He is quoted here.
http://www.climatecentral.org/news/fossil-fuels-heat-climate-dramatically-19062
LikeLike
climatehawk1 (@climatehawk1)
/ June 4, 2015He is saying same on Twitter: https://twitter.com/ClimateOfGavin/status/606166881838497795 . I’ll hazard a wild guess that he thinks the info is more appropriate for a general-audience blog post.
LikeLike
Griffin
/ June 4, 2015I will be honest, I found his remarks to be distasteful. As many of us try to communicate the urgency of our situation, it is important that we consider the mindset of the audience. Many folks may hear that power plants contribute to our warming planet. They really may not know how that works, they may very well think that the heat coming out the stack is part of it. OK, to a climatologist, that is ridiculous, I get that. But coming out and publicly bashing the work, I am not so sure that such remarks do much to help anyone. I thought that the message of the dangers of greenhouse gases was the more defining message of the authors. Perhaps they were looking to reach a broader audience, but that’s who needs to know.
LikeLike
climatehawk1 (@climatehawk1)
/ June 4, 2015Agreed. As often noted here, scientists are not always great communicators. Climate Central messes up now and then also (e.g., very recent tweet about heat waves not as dangerous as moderately cold weather). Scientifically accurate, I assume, but I’m not sure what constructive purpose publicizing it serves, particularly against the backdrop of the Indian heat wave.
LikeLike
dtlange
/ June 4, 2015My take — is that heat is heat.
New heat is introduced heat that was not there before.
Adding heat and heat trapping GHG to a finite atmosphere surrounding a mostly water covered planet is a recipe for disaster — and all of it’s attendant positive feed backs.
Whichever data, or aspects, one throws at the problem — the better.
Life, as we know it, is made possible only because of a relatively small ambient temperature range on our dear Mother Earth.
If we keep adding heat to it — we cook.
So it seems to me.
LikeLike
robertscribbler
/ June 4, 2015I agree with Mann. This is a good study that highlights the massive long-term impact of fossil fuel burning. It also underlines the importance of rapid cessation of fossil fuel burning, which I feel is absolutely necessary at this time.
LikeLike
Colorado Bob
/ June 3, 2015Scientists finally have an explanation for why huge lakes atop Greenland are vanishing
Back in the summer of 2006, scientists studying the vast and in some places mile-thick Greenland ice sheet observed something that can only be called breathtaking.
Due to meltwater, lakes form atop the ice sheet in the summer – scientists call them “supraglacial lakes” — and they can grow to be quite large. And in July 2006, one large lake, over 2 square miles in area, suddenly vanished. It lost most of its water in under two hours – researchers calculated that the rate of drainage “exceeded the average flow rate over Niagara Falls.”
Link
LikeLike
Colorado Bob
/ June 3, 2015Can anyone say “Feed back loop” ?
LikeLike
Colorado Bob
/ June 4, 2015Can anyone say “Feed back loop” ?
That Greenland paper is real depressing , it speaks to an ice sheet that is turning into Swiss cheese. And every a time a lake drains, it’s melt water carries more heat into the ice. Making more voids where water can travel . That water jacks up the ice cracks it, and adds to the ice flow . All of which is transporting heat deep into ice sheet .
We are melting Greenland top, bottom, and middle.
LikeLike
robertscribbler
/ June 4, 2015Every time a giant melt lake bores into the ice it’s like a gigantic hammer blow to the GIS. A furious forge for climate disruption.
LikeLike
climatehawk1 (@climatehawk1)
/ June 4, 2015Aaaand deniers open a new front:
Fact check: Is #climate change ‘helping Africa’?: @carbonbrief http://www.carbonbrief.org/blog/2015/06/factcheck-is-climate-change-helping-africa/#.VW-nF2erNmZ.twitter
LikeLike
Colorado Bob
/ June 4, 2015RS –
The Greenland paper –
Yes, well no one had the numbers.
But these folks measured it. for 9 years And as we know, measurements are are what science does . And the findings are interesting , before the lake drains , the ice rises and moves to the sea. Then the bottom of the lake cracks open, and the lake drains . But other sources of water are jacking up the bottom of this lake.
This all points to a melt pump in Greenland. And as robertscribbler points out that shows up as that one spot in the North Atlantic South East of the rip of Greenland where SST’s remain cooler . That’s melt water coming off Greenland doing that. I think it’s a jet. because there is wall of land in that area. With one gateway. And it points directly at his spot. A huge amount of Greenland fresh water is doing this.
LikeLike
Jay M
/ June 4, 2015Seems like the Laurentide ice sheet vanished in a meer twinkle of the eye due to increased insolation from planetary movement. Different animal when you are liquidating world wide inventories that have been one of the mechanisms sequestering terrestrial carbon stores.
LikeLike
Colorado Bob
/ June 4, 2015http://i.livescience.com/images/i/000/056/407/i02/Greenland3.jpg?1377792929
LikeLike
Kevin Jones
/ June 4, 2015A mariner friend, speaking of a ship’s displacement, once asked how much water would be required to float a large one in a dry dock shaped to perfectly fit it’s hull. (hint: FAR less than it’s displacement when afloat in the water) Your image sure reminds me of that chat….
LikeLike
TomCobbler
/ June 4, 2015Heads up! Big paper coming out tomorrow at 2pm In Science from NOAA’s NCDC. Rumors that it is something about “the pause” ending. I hate to reference WUWT but I had to figure out Gavin Schmidt’s last tweet about the CATO institute freaking out about the paper before its even released. If anyone knows anything additional, please add.
LikeLike
robertscribbler
/ June 4, 2015Thanks for the head’s up, Tom! The May temperature readings also fit the larger trend. Looks like +0.7 to +0.8 C.
LikeLike
rayduray
/ June 4, 2015Amidst all the doom and gloom […] here’s some damn good news. Coal is dying, as an industry and a source of greenhouse gases and pollution. And not just in America.
http://www.politico.com/agenda/story/2015/05/inside-war-on-coal-000002
If you are breathing a little easier now, you can thank me. Or… you can thank basic economics. It turns out that natural gas is eating coal for lunch. Burp!
LikeLike
Tom
/ June 4, 2015i guess that’s why Obama has recently okayed many more areas open to coal mining.
May 29, 2015
Obama opens thousands more acres of public land to coal mining
http://www.vox.com/2015/5/29/8687659/public-land-coal-leases
LikeLike
Vic
/ June 4, 2015Yep, coal’s downfall is beginning to show an uncanny resemblance to the legend of Old King Cole…
“Desperate for some relief, however, the enemy advanced an all-or-nothing attack on Coel’s stronghold. Coel and his men were taken by surprise, overrun and scattered to the winds. It is said that Coel wandered the unknown countryside until he eventually got caught in a bog at Coilsfield (in Tarbolton, Ayrshire) and drowned.” 😃
http://www.earlybritishkingdoms.com/bios/coelhnt.html
LikeLike
robertscribbler
/ June 4, 2015Glad to see coal go. But gas is no solution at all. We need solar + wind + other no carbon energy + efficiency to eat oil and gas’s lunch. Otherwise, no real fix. Otherwise, the near worst case is still locked in. In this analysis, you really need to consider coal, oil and gas to be three legs on the same ugly stool. And you can’t take the darn thing down unless you remove all the legs.
LikeLike
Mblanc
/ June 5, 2015We all know it’s never going to be quick enough. But at least one leg is finally starting to go. Better very late than never! 🙂
Is it just me, or is anyone else surprised how quickly this seems to have turned for coal, not just in the US, but China too? Were we expecting this?
A testament to the new economics of power generation, I guess. Which FF will be next, I wonder?
LikeLike
Andy in San Diego
/ June 4, 2015Robert,
Here’s a slight reference to permafrost fires.
The term to look for is “muskeg fires”.
http://www.kfsk.org/2015/05/22/logging-restrictions-in-place-for-dry-weather-on-tongass/
LikeLike
Dave Person
/ June 5, 2015Hi Andy,
No muskegs in SE Alaska and in the Tongass National Forest sit over permafrost.
dave
LikeLike
Andy in San Diego
/ June 4, 2015A muskeg fire that burned for years in 1950.
On Monday the 18th, a peat muskeg fire that had been smoldering for years near Newbrook, 75 miles north of Edmonton, was activated by high winds.
http://the-red-thread.net/dark-day.html
LikeLike
robertscribbler
/ June 4, 2015That is one hell of a tale. Given the right atmospheric conditions and considering the size and prevalence of today’s fires, we could well see many such dark days to come.
LikeLike
DonnaLou
/ June 4, 2015Regarding heat wave in UAE, this was posted this morning on RSOE EDIS. Interesting site, in case you aren’t familiar with it.
http://hisz.rsoe.hu/alertmap/site/index.php?pageid=event_desc&edis_id=HT-20150603-48505-ARE
LikeLike
NevenA
/ June 4, 2015Great, concise post, Robert. I referred to it twice in the second ASI update over on the Arctic Sea Ice Blog: Take me to the other side.
LikeLike
robertscribbler
/ June 4, 2015Fantastic article, Neven! I’ll be looking at it for my next update.
LikeLike
kevin jones
/ June 4, 2015NevinA. My other most favorite (i.e. informative) blogger! You and RS have helped my understanding immeasurably. Thanks to you both!
LikeLike
Greg
/ June 4, 2015A very nice walk through of what an alternative energy world looks like. This is Orkney Islands which are generating more than 100% of their energy from renewables and are, in fact, needing electric vehicles to soak up the excess!
http://insideevs.com/orkney-island-future-fully-charged/
LikeLike
robertscribbler
/ June 4, 2015Nice! Now that’s what I like to see!
LikeLike
Greg
/ June 4, 2015Even heating greenhouses with the excess. That is what happens with renewables. Why think in terms of 50% or 60%, why not capture all of this wind, solar and tidal power and go beyond our immediate needs to create something bigger that brings local jobs, and agriculture, and excitement to these otherwise barren rocks!
LikeLike
Greg
/ June 4, 2015Mainstream media coverage of the Texas flooding, India Heatwave and Boston snowstorms based on Jennifer Francis and Natasa Skific’s just published paper. Even said climate change! (thanks to Peter Sinclair)
http://climatecrocks.com/2015/06/04/more-research-links-warming-arctic-to-extremes/
LikeLike
TomCobbler
/ June 4, 2015The “no hiatus” by NOAA paper will be released in minutes in the Journal science. Here is an initial media news story on it.
http://www.cbc.ca/m/news/technology/global-warming-continues-as-temperatures-rise-study-finds-1.3100345
LikeLike
Greg
/ June 4, 2015If you aren’t mobile the link is:
http://www.cbc.ca/news/technology/global-warming-continues-as-temperatures-rise-study-finds-1.3100345
LikeLike
TomCobbler
/ June 4, 2015http://m.sciencemag.org/content/early/2015/06/03/science.aaa5632.abstract?sid=2d771e35-9a8e-4e61-9860-ac808457e896
Just heard it will be open access immediately
LikeLike
TomCobbler
/ June 4, 2015http://www.noaanews.noaa.gov/stories2015/noaa-analysis-journal-science-no-slowdown-in-global-warming-in-recent-years.html
On NOAA’s site. Can’t read it just yet.
LikeLike
TomCobbler
/ June 4, 2015“Our new analysis suggests that the apparent hiatus may have been largely the result of limitations in past datasets, and that the rate of warming over the first 15 years of this century has, in fact, been as fast or faster than that seen over the last half of the 20th century.”
LikeLike
Colorado Bob
/ June 4, 2015Study dismisses ‘hiatus’ in global warming, says temperatures up
OSLO (Reuters) – An apparent slowdown in the pace of global warming in recent years may be an illusion based on skewed data, according to a study on Thursday that found no break in a trend of rising temperatures.
Read more: Link
LikeLike
Wharf Rat
/ June 4, 2015Hurricanes Blanca and Andres Set Records For Early-Season Northeast Pacific Activity
Hurricane Blanca put on a furious display of rapid intensification this week, going from a tropical storm with 70 mph winds on Tuesday morning to a Category 4 storm with 135 mph winds on Wednesday morning–a remarkable 65 mph increase in winds in 24 hours, an intensification rate that is rarely seen. Blanca topped out at 140 mph winds on Wednesday afternoon, making it the fourth strongest Northeast Pacific hurricane for so early in the year. It has been a remarkable run of early-season activity for the region, since just two days before that Hurricane Andres topped out as a Category 4 storm with 145 mph winds, becoming the second strongest Northeast Pacific hurricane for so early in the year. Only six Northeast Pacific major hurricanes have occurred prior to June 5 since accurate satellite records began in 1971, and two of them were this year:
1) Hurricane Amanda, 2014: 155 mph winds on May 25
2) Hurricane Andres, 2015: 145 mph winds on June 1
2) Hurricane Adolph, 2001: 145 mph winds on May 29
4) Hurricane Blanca, 2015: 140 mph winds on June 3
5) Hurricane Alma, 2002: 115 mph winds on May 30
6) Hurricane Bud, 2012: 115 mph winds on May 25
http://www.wunderground.com/blog/JeffMasters/comment.html?entrynum=3006
LikeLike
robertscribbler
/ June 4, 2015Half of the top six in 2014-2015… Just nuts.
LikeLike
TomCobbler
/ June 4, 2015http://surfacetemperatures.blogspot.com/2015/06/the-karl-et-al-science-paper-and-isti.html?spref=tw&m=1
Last linked post for now, I think this will be the biggest paper we have seen in a while. I know some could argue there are no new surprises, but I would argue this paper is still a really BFD.
LikeLike
TomCobbler
/ June 4, 2015From RC
“With the NOAA updates, the recent trends goes from 0.06±0.07 ºC/decade to 0.11±0.07ºC/decade, becoming ‘significant’ at the 95% level”
– See more at: http://www.realclimate.org/index.php/archives/2015/06/noaa-temperature-record-updates-and-the-hiatus/#.dpuf
LikeLike
Greg
/ June 4, 2015I’d say NOAA’s temperature graph, based on the paper, pretty much says it all:
LikeLike
kevin jones
/ June 4, 2015Thanks Greg. Interesting synopsis from Sci Am: http://blogs.scientificamerican.com/observations/the-pause-in-global-warming-is-finally-explained/
LikeLike
kevin jones
/ June 4, 2015and Thanks, TomCobbler for the heads up!..
LikeLike
kevin jones
/ June 4, 2015Ha! Did I blow it!. Sci Am piece an old one. Can’t be too careful… Note to self: ALWAYS read publication date!
LikeLike
Greg
/ June 4, 2015While heavy rains in Ghana in June are not abnormal, this year’s have been especially bad. This gas station exploded when heavy rains resulted in fuel escaping before hitting an ignition source. Bitter irony that the world’s most vulnerable are hit the hardest by their climates and these Ghanaians, seeking shelter at a fossil fuel source, resulted in at least 73 of their deaths:
http://news.yahoo.com/least-73-dead-ghana-explosion-gas-station-075607945.html#
LikeLike
kevin jones
/ June 4, 2015A bit more up to date… http://www.theguardian.com/environment/2015/jun/04/global-warming-hasnt-paused-study-finds
LikeLike
Greg
/ June 4, 2015As an aside, for you Game of Thrones fans, and those who should be, its secretly a story all about climate change:
LikeLike
kevin jones
/ June 4, 2015A WORD OF CAUTION. Routinely I do a Google search of climate news. I just saw this: In-Depth Los Angeles Times 54 minutes ago Global warming ‘hiatus’ puts scientists on the spot by Monte Morin …a lousy piece. then I notice the date: Sept. 22, 2013 8 AM…this ‘news’ was not there an hour or so ago. Google. Is this deliberate obfuscation?
LikeLike
rayduray
/ June 5, 2015Kevin,
I’m seeing more and more of this with Google searches. Today, for one example, I was searching for reviews of Apple TV. After wading through a ton of ads I spotted an Ars Technica piece. I got to page three of this in-depth review before realizing that the article was written in 2007. They’d buried the date in tiny print at Ars Techica and Google gave no indication at all as to how stale the article was. I was miffed. I’m not buying the damn thing! 🙂
Another annoyance I’m seeing all over the place is “click bait” at the bottom of decent articles on decent sites leading to crappy promotional materials.
LikeLike
Cristóbal Camarero
/ June 8, 2015Maybe you are interested in reading about a MIT’s petition to divesting MIT’s endowment from fossil fuel companies. Explained by Scott Aaronson in http://www.scottaaronson.com/blog/?p=2316
LikeLike
Gail Griffith
/ June 12, 2015With the new heat wave in the Siberian Arctic, will methane eruptions from thawing permafrost and release of methane from shallow clathrates on the sea bottom have a significant effect on warming?
LikeLike