
Hint: it’s a glitch.
*****
On February 26, The Global Forecast System model recorded an (unconfirmed) intense and wide-ranging carbon monoxide (CO) spike over the US West Coast. A region stretching from British Columbia, through Washington and Oregon, and on over most of California experienced CO readings ranging from about 5,000 parts per billion over the mountains of Southwestern Canada to as high as 40,000 parts per billion over Southern California. Very high peak readings appear to have occurred from Northern California near Eureka and along a line south and eastward over much of Central California to an extreme peak zone just north and west of Los Angeles near Palmdale.
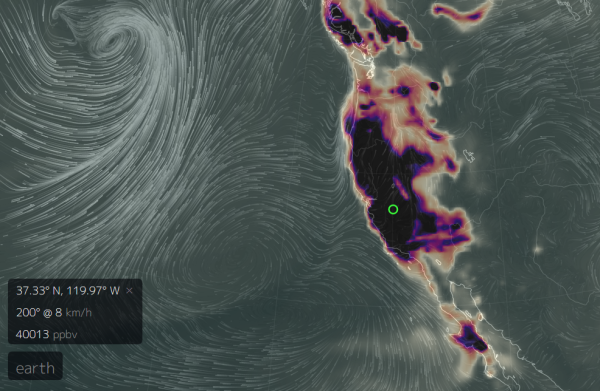
(Very large [unconfirmed] CO spike over Western North America near major geological features on February 26, 2016. Image source: Earth Nullschool.)
For reference, these (unconfirmed) readings in the Nullschool Monitor were between 25 and 200 times above typical background CO levels of about 200 parts per billion and up to twelve times higher than second highest peak readings over polluted regions of China during the same period.
Major Spike Appeared in Just 3 Hours Starting February 25th
Human-based carbon monoxide sources are not generally known to produce spike readings so high and so wide-ranging over such a short interval of time. It would typically take a considerable emission many days to build up under a stagnant air mass. And, to this point, we do have a couple of dome high pressure systems which have tended to form near the California region over recent days. That said, surface winds in the region at 5-15 mph over most areas could hardly be considered stagnant. In addition, the current spike appears over an interval of three hours in the Nullschool data — going from zero coverage to covering all of California and parts of Nevada, Oregon, Washington and BC over that single short interval. It’s a very brief period for such a large and wide-ranging peak reading to appear so soon. One that would require a rather extraordinary pulse of pollution to produce the readings indicated on February 25-26.
Wildfires could produce a longer-term emissions spike under stagnant air as well. However, the wildfires now reported for California are small and isolated. They have flared, off and on, under drought conditions, for weeks without resulting in any significant large fire outbreaks or related major pollution spikes. So it appears unlikely that they are the source of the current burst. Other events related to the ongoing California drought may have had an impact (apparently, burning of desiccated trees from California’s orchards is currently quite widespread due to ongoing drought conditions remaining in place since 2012). However, such instances would have to have been very sudden and wide-ranging to produce the spike we saw on the 25th and 26th. Canadian wildfires — of which there have been very small and low intensity hotspot events recently (noteworthy due to their anomalous appearance out of season, if not for their intensity) — were very far from peak readings in California and did not produce even a moderate level of emissions (undetectable from the visible MODIS sensor).
The Earthquake Precursor Hypothesis
A final suspect for this preliminary observation (which has gotten much hype in social media circles over recent days) is geological. As the apparent spike in the monitor occurs over large fault lines, volcanoes, and above other active geological features along the US and Canadian West, it appears that activity within these features might have produced a brief if intense burp of this gas. Sulfur dioxide (SO2) readings — another geological gas — were also elevated in the monitor, with peak readings again appearing in Southwestern California.
It’s worth noting that no major US or Canadian geological organization has yet made any report on this particularly large CO spike. However, a piece of scientific research in Nature Asia, by K. S. Jayaraman notes that major CO and SO2 spikes may be an indication that future earthquake activity is on the way. According to Nature this kind of intense CO spike occurred prior to a 7.6 magnitude earthquake that shook Gujara in 2001 killing 20,000 people:
Singh said that CO levels were taken by an instrument onboard NASA’s Terra satellite — launched in 2009 — circling the earth in a polar orbit at a height of 705 km. The instrument measures CO concentrations at different heights and also computes the total amount of the gas in a vertical column of air above the earth surface.
Analysis of the satellite data showed a large peak in CO concentrations during January 19 and 20 — a week before the main earthquake event. On January 19, the total CO in the vertical column was also higher than usual. After the 26 January earthquake the concentration of the gas dropped.
According to the scientists, CO gas is forced out of the earth due to the build up of stress prior to the earthquake “influencing the hydrological regime around the epicentre.”
But before we tilt too far into alarmism on this particular possibility, we should consider the fact that the above paper appears to have had no confirmation or further comment in the sciences at this time. So the predictive usefulness of large CO spikes prior to earthquakes remains quite uncertain. And, as noted above, no major geological information outlet has made any warning or comment on earthquake risk.
Furthermore, there’s been no observed spike in earthquake activity along any of the major fault lines over the past week according to USGS observations. Contrary to what some irresponsible analysts have been implying, earthquake activity in the California region over the past 7 days was well within the normal range. At 161 over the past week, this small number is not indicative of any abnormal activity near the various active fault lines. Each year, Southern California alone experiences 10,000 earthquakes, most of which are so small that people don’t even feel them.
The US geological survey also maintains that:
There is no scientifically plausible way of predicting the occurrence of a particular earthquake. The USGS can and does make statements about earthquake rates, describing the places most likely to produce earthquakes in the long term. It is important to note that prediction, as people expect it, requires predicting the magnitude, timing, and location of the future earthquake, which is not currently possible.
Thus the apparent, current very large West Coast CO spike near major fault lines (and over regions suffering from what is now a very severe five-year drought) in this particular monitor remains a bit of a mystery.
Or is it all Just a Glitch?
Considering that all the wildfire and human potential sources for the CO pulse are unlikely to produce the spike in the Nullschool data, that we have no warning of potential impending geological activity from the major agencies, and that we have had no other reports from related agencies to confirm the spike, we should also consider that there may well be something wrong with the monitor. Artifacts can appear in the satellite model data and it’s not unheard of to get a spike reading due to other signals impacting how physical models interpret sensor data.

(Hourly carbon monoxide observations in Central San Bernardino do not match high surface CO measures recorded by the GEOS 5 model. Similar lower atmospheric readings come from station observations throughout Southern and Central California. Image source: California AMQD.)
To this point, lack of confirmation at ground reporting stations for high CO readings appearing in the GEOS 5 monitor increase the likelihood that these high peak readings were a glitch or an artifact in the physical data. A cursory view of local warnings shows no local CO air quality alerts for the areas indicated in the Nullschool data set (You can view a list of the local monitors here). Analysis of this data also shows much lower CO readings from these stations in the range of 400 to 1200 parts per billion — quite a bit lower than what the GEOS 5 monitor is showing.
So what we have is one model showing a very high CO spike, but none of the related ground monitors picking it up. Since there are hundreds of ground stations in this region, it seems quite a bit less likely that there is something wrong with each of the readings coming from these stations than from the GEOS 5 model itself.
This begs the question — was there some kind of false positive that confused GEOS 5? Was there some other signal that tripped the model to show such a high reading? But to these points, a general lack of overall confirmation from the hundreds of ground sensors scattered across the region seems to point to the likelihood that such elevated readings in the GEOS 5 monitor were a glitch, an artifact, or a false reading for this atmospheric level.
UPDATED: Final Confirmation — It’s A Model Algorithm Error
Dr. Gavin Schmidt, head of GISS NASA, has confirmed the glitch in his twitter feed which you can read here. He notes:
The Elevated Carbon Monoxide concentrations in the GEOS 5 products since February 25 of 2016 are incorrect. They are the consequence of unrealistic CO emissions computed by our biomass burning algorithm, which is based on satellite observation of fires… GMAO is working to correct this problem.
An excellent further explanation has been given by Bryan, a blogger over at Of Tech and Learning. His explanation is as follows:
“It’s pure coincidence that at MOPITT resumed data collection over western North America while its operating temperature was still stabilizing. Had the instrument’s temperature remained unstable for a few days, it would have looked like the whole globe was erupting gas. If MOPITT has started collecting data over the south pole, open ocean, or some other obscure location, I doubt anyone would have noticed and made a big fuss. MOPITT uses light collected in the infrared part of the spectrum. Based on Terra’s system status, the CO, CO2 and SO2 data collected by MOPITT on the 25th and 26th of February should be highly suspect. On the Earth map, the CO, CO2, and SO2 levels spike sometime between 1pm and 4pm Pacific time on Feb. 25th, which is between 2100 UTC on the 25th and 0000 UTC on the 26th. This is precisely during the time window when MOPITT’s operating temperature is still unstable.”
So a glitch does appear to be the cause of the current CO spike in the Nullschool data.
Links:
Dr Gavin Schmidt’s Twitter Feed
Carbon Monoxide May Signal Earthquake
An Explanation of Carbon Monoxide Concentrations on US West Coast
Hat tip to Mike
Hat tip to MlParrish
Hat tip to WeHappyFew
Hat tip to Coopgeek
Hat tip to Greg
Hat tip to Bryan
Hat tip to FishOutofWater
Hat tip to Jim Benison


Miep
/ February 29, 2016Reblogged this on There Are So Many Things Wrong With This.
LikeLike
Mark from OZ
/ February 29, 2016Feb 29 2016
Strong quake hits near New Zealand’s South Island on anniversary of Christchurch tragedy
http://www.smh.com.au/world/strong-quake-hits-near-new-zealands-south-island-on-anniversary-of-christchurch-tragedy-20160222-gn0am4.html
LikeLike
pekapekapones
/ February 29, 2016Yeah and on the 27th there was a 3-6 hour period where there was up to 721 ppbv of Carbon Monoxide over Christchurch, while the rest on NZ was at around 50 ppbv ??
LikeLike
nigel64
/ February 29, 2016Christchurch commonly has smog / inversion issues due to surrounding hills and mountains whereas much of the rest of ‘clean green nz’ is better ventilated.
LikeLike
Ralph
/ February 29, 2016Is CH4 to CO conversion in the atmosphere possible? Just an idle query remembering there was a large CH4 release there recently.
LikeLike
Ralph
/ February 29, 2016Forget that, the CO concentration is way too high…
LikeLike
labmonkey2
/ February 29, 2016Well…when Mother Earth passes some gas… 😉 you gotta expect the unexpected. I just hope there’s more warning for future tectonic displacement than an SBD.
LikeLike
Loni
/ February 29, 2016Thank you Robert, I’ll bring this to the attention of the local authorities. I’ve already emailed low lying friends. I saw the video of this and it was narrated by a fellow who could not believe what he was looking at. Something to take serious, I’d say.
LikeLike
YKD
/ February 29, 2016According to this the normal CO ppm is 0.2.
Link: http://carbon-monoxide-survivor.com/carbon-monoxide-levels-in-the-air.html
LikeLike
YKD
/ February 29, 2016EPA data: http://www3.epa.gov/airtrends/carbon.html
LikeLike
robertscribbler
/ February 29, 2016Thanks. Will add as update.
LikeLike
frank brunelle
/ February 29, 2016another approach to GHG emissions mitigation. Carbon Tax or Biomass. Co2, and its more dangerous cousin,methane, both impact our biosphere, and hence are on their way tocausing disastrous, if not extinction level problems. First of all,the Republican party has got to acknowledge these scientific factsand to propose remedies. However, the Republican party has beenco-opted by the evil twins Evangelical Christianity which proposesthat mankind cannot affect climate because God created man in hisimage (or whatever specious argument) and false propaganda, or shallwe say, false prophets who fill their bank accounts with cash, inexchange for a declaration of climate denial. Part of this problem is the fact thatthe fossil fuel industry has both a financial incentive to keepproviding fossil fuels for the continuation of civilization as weknow it, which is a real issue, and because without fossil fuels wewill all die anyway and so why give up the profits for a tragic andfatal outcome. And so, any belief no matter how bizarre, is betterthan putting all of our cars in the garage and twiddling our thumbswhile the earth regenerates, and humankind starves to death. But there may be a way out of it. Asimplified version of this way it a more genial form of a carbon taxand one orchestrated by a global organization such as the UnitedNations, but one organized for the specific purpose of amelioratinggreenhouse gas emissions while we reorganize the way in which weinhabit the planet. The general idea is to look at theproblem in terms of the biomass of humanity vs. the biomass of theplanet. Since 1958 we have been measuring CO2 at Mauna LoaObservatory based on the work of one scientist who came up with thebasic concept of how to measure CO2. Since that time, if we look atthe statistics, the increase of CO2 has been steadily rising intandem with humanity. The overall increase has gone up steadily, andthe rate of increase has also gone up and continues to rise steadily.All of the solar, wind, dietary changes, and fuss have not made animpact other than perhaps to slow somewhat the increase in GHGemissions, and the steadily climbing and more important, rate ofincrease. If we look at the population of theUnited States and consider the population in terms of an organismwhich is humanity, then we can observe our species in the same way wemight observe algae or any other species – by its mass. Since 1960the mass of humanity in the United States for example, has doubled inquantity. The population has gone from 175 million to 350 million, aneat and tidy figure to work with. However, at the same time thepopulation of the US through better and more food has increased inweight such that the biomass has not doubled, but risen at the rateof 2.37 times. Likewise, the projected globalpopulation is expected to keep on rising, and another neat and tidycalculation is that within the next 15 years the world populationwill increase by 1 billion people, or about the same amount of thetotal population of the planet in 1800. But again, if we look at thebiomass of this population increase it is not as though the peoplewithin this group are the same biomass as they were in 1800. Peopleare larger now than they were then. We are taller. And so we cannotcompare the biomass directly. Coupled with this increase in heightthe population in question will mainly be Muslim peoples whose diethas traditionally not been heavy in meat and dairy and the projectionis that this diet will change, and that they will be consumingroughly 5 times the amount of meat and dairy what the previousgeneration did within this demographic. And so, again, we have a rateof increase of biomass which is increasing both in absolute numbers,but in the relative strength of those numbers. Now if we look at the planetary supportfor the increases in world population we see several thingshappening. We are cutting down our forests, which have beenabsorbents of GHG emissions. We are using up minerals, all of whichare in finite supply, and some are running out faster than others.Simply put, the idea is this. We need to balance the needs ofhumanity with the needs of the planet which supports us. And so, aglobal organization devoted not only to reforestation andconservation, but in coming to terms with the damage we have done tothe planet and using a global organization to mandate planting,dietary changes, healthier ways of transportation including walkingand bicycling and so on. Simply put, a global watch-guard on theplanet with the influence, support, and power to attempt to balancethe biomass with humanity, with the biomass of the planet whichsupports it. An organization akin to the United Nations, and perhapsan offshoot of it that all nations will agree to follow.
From: robertscribbler To: frankbrunelle@yahoo.com Sent: Sunday, February 28, 2016 11:39 PM Subject: [New post] Carbon Monoxide Spikes to 34,000 Parts Per Billion over California on February 26 — What the Heck is Going On? #yiv2996780487 a:hover {color:red;}#yiv2996780487 a {text-decoration:none;color:#0088cc;}#yiv2996780487 a.yiv2996780487primaryactionlink:link, #yiv2996780487 a.yiv2996780487primaryactionlink:visited {background-color:#2585B2;color:#fff;}#yiv2996780487 a.yiv2996780487primaryactionlink:hover, #yiv2996780487 a.yiv2996780487primaryactionlink:active {background-color:#11729E;color:#fff;}#yiv2996780487 WordPress.com | robertscribbler posted: “On February 26, The Global Forecast System model recorded an intense and wide-ranging carbon monoxide (CO) spike over the US West Coast. A region stretching from British Columbia, through Washington and Oregon, and on over most of California experienced C” | |
LikeLike
nigel64
/ February 29, 2016What I’ll never understand with evangelicals is how little they seem to know their fundamental text – after all, while according to said text God created Earth and then man, this was quickly followed by the Fall and the Flood – surely the mother of all climate change events! after all it was the first time rain was recorded at all: Genesis 2:5 and Gen 7:4 (But I’m hardly a Biblical scholar). At this point perfection is removed from the equation ergo man IS able to alter the Earth (forgive my cod philosophy, but that’s the way I see it, in their terms).
The way in which the wRong wing has always cozied up to Evangelical has always seemed poisonous to me. I was an active Christian for quite some time. When I became an ecologist and read the Bible in that light I became aware of how humanity was told to steward and care for the Earth, and yet I’ve only heard two sermons on actually doing this – and a lot of anti-planet rhetoric. There’s a real unwillingness to view ourselves as a sentient animal (with responsibilities), but instead something above nature and Creation.
There are glimmers of hope (e.g. evangelical Enviro Network and Jesus Radicals) – but little apparently within the traditonal right (which at least in the US has definitely taken an odd path).
On human population growth – I think peak Phosphate will sort that problem out, a nice little Malthusian solution.
LikeLike
Patricia
/ February 29, 2016Nigel, you’ve read Pope Francis’ encyclical on climate change, Laudato Si’?
http://w2.vatican.va/content/francesco/en/encyclicals/documents/papa-francesco_20150524_enciclica-laudato-si.html
“[The Earth] now cries out to us because of the harm we have inflicted on her by our irresponsible use and abuse of the goods with which God has endowed her. We have come to see ourselves as her lords and masters, entitled to plunder her at will. The violence present in our hearts, wounded by sin, is also reflected in the symptoms of sickness evident in the soil, in the water, in the air and in all forms of life. This is why the earth herself, burdened and laid waste, is among the most abandoned and maltreated of our poor; she “groans in travail” (Rom 8:22). We have forgotten that we ourselves are dust of the earth (cf. Gen 2:7); our very bodies are made up of her elements, we breathe her air and we receive life and refreshment from her waters.”
LikeLike
robertscribbler
/ February 29, 2016Population growth is not the root cause of climate change. Fossil fuel companies would love you to believe this, but it doesn’t have much truth in it. The root cause of climate change is a growing number of people using more and more fossil fuels and emitting more and more greenhouse gasses. If we all emitted as much as the subsistence farmers in Africa, then the Earth wouldn’t be under threat. The problem is that economic growth has been saddled to fossil fuels and rising ‘prospects’ for individuals in developing countries are directly tied to increases in fossil fuel use and related carbon emissions. It’s this link between expanding consumerism to 7 billion people and carbon emissions that’s the killer.
If everyone emitted, per capita, as much as US Citizens, then we’d be in huge trouble. And if the world population emitted as much as Donald Trump, then we’d need about 10,000 Earths every century just to keep going. And that’s what business as usual means. It means a world where ‘expanding prosperity’ means setting up this lethal tie between growth and fossil fuels. And that’s the link that needs to be broken. You can’t grow the world economy with fossil fuels and not completely and utterly wreck everything.
LikeLike
dtlange
/ February 29, 2016– Way to go, Mike, MlParrish, WeHappyFew – Robert.
LikeLike
mlparrish
/ February 29, 2016Thanks, DT. I am honored to have a second Robert Hat Tip, though it was Jeremy who put in the first post on the CO explosion.
As many have noted, Robert’s blog is invaluable, and we are lucky to have him. He is even patient when my ignorance begins to show. . .
LikeLike
Jeremy
/ March 1, 2016Cheers ml.
I’m fully with RS, but he thinks I’m trouble maker or something.
Oh well.
LikeLike
Mblanc
/ March 1, 2016I’m not impressed by some of your previous contributions either, Jeremy, but lets move on in a respectful and collegiate manner.
Greetings from the UK!
LikeLike
dtlange
/ February 29, 2016– Possible earthquakes – groundwater depletion re California.
(Cumulative undermining invites a quake or rock structure failure?)
– Groundwater depletion behind Nepal earthquake?
Extensive groundwater extraction in the Indo-Gangetic Plain over the last five decades has significantly contributed to the killer April 25, 2015, Nepal temblor and “probably all earthquakes” in the region beneath the Himalayan arc, Indian scientists claim.
Researchers at NIT Rourkela; CSIR-National Geophysical Research Institute, Hyderabad; and National Centre for Seismology (NCS), Ministry of Earth Sciences, New Delhi, have gathered evidence of the far-reaching consequences of human actions: how groundwater depletion can “advance the clock” of temblors occurring in the Main Himalayan Thrust (MHT), under the Himalayan arc where earthquakes originate.
-thehindu.com/todays-paper/tp-in-school/groundwater-depletion-
LikeLike
dtlange
/ February 29, 2016… “Plate tectonics is the prime driving force behind earthquakes but in the past decade there is a new trend of research. The focus is also on surface and sub-surface activities such as underground mining, fluid injection and reservoir construction due to hydropower projects as possible contributing factors to seismic activity,” Bhaskar Kundu of the Department of Earth and Atmospheric Sciences, NIT Rourkela, told IANS.
Earlier it was considered that small magnitude earthquakes are influenced by the seasonal loading and unloading (removal process of groundwater) of the Indo-Gangetic Plain in summer and winter, said NCS director Vineet Gahalaut, one of the authors of the study.
“We have shown that great and major Himalayan earthquakes are influenced by the anthropogenic groundwater unloading process in the Indo-Gangetic Plain, which is probably the most intensely irrigated region in Southeast Asia,” Gahalaut said.
http://www.thehindu.com/todays-paper/tp-in-school/groundwater-depletion-behind-nepal-earthquake/article8293133.ece
LikeLike
dtlange
/ February 29, 2016Groundwater depletion leading to more earthquakes along San Andreas fault
Removing the water’s weight is causing the Earth’s crust to rise.
May 16, 2014
…
The dry but agriculturally productive San Joaquin Valley is a poster child for groundwater depletion. As groundwater levels have dropped, so has the ground surface. Groundwater between grains of sediment actually provides pressure that counteracts some of the overlying weight. Remove the water, and the sediment will compact, lowering the elevation of the surface. Between 1926 and 1970, the land surface in the valley subsided by as much as 30 feet.
But that’s not the only impact of drawing down groundwater levels. A new study led by Western Washington University’s Colin Amos focuses on the solid rock beneath all that sediment to see how it is responding to being relieved of the burden of that huge weight of water.
http://arstechnica.com/science/2014/05/groundwater-depletion-leading-to-more-earthquakes-along-san-andreas-fault/
LikeLike
dtlange
/ February 29, 2016…
“The groundwater lost from the San Joaquin Valley isn’t just an issue of agricultural sustainability. While the valley floor is sinking, the Earth’s crust is actually rising—including, it seems, in the Sierra Nevada mountains to the east. The groundwater loss is even affecting earthquakes on the San Andreas fault.”
LikeLike
dtlange
/ February 29, 2016-“water vapour”
Singh said observation by other researchers of a sudden increase in water vapour in the atmosphere and changes in the ionosphere a few days prior to the Gujarat earthquake all seem to be connected.
-natureasia.com/en/nindia/article/10.1038
LikeLike
dtlange
/ February 29, 2016-Methane & CO
…
“Methane emissions are found to have the most important effect on the future atmospheric CO budget. High methane emissions cause significant depletion of tropospheric OH,
increase of CO concentrations, and lengthening of lifetimes of many chemical species including CO and CH4.
….This study also indicates that climate variations, especially those causing changes in H2O concentrations, can influence atmospheric trends of carbon monoxide.
-Impact of Emissions, Chemistry, and Climate on Atmospheric Carbon Monoxide:
100-year Predictions from a Global Chemistry-Climate Model
Chien Wang and Ronald G. Prinn
Abstract
Click to access MITJPSPGC_Rpt35.pdf
LikeLike
Alexander Ač
/ February 29, 2016And, if there are no enough problems already, the “runway climate change” CO2 treshold is much lower than thought previously, at 1520 ppm CO2 and in the worst case not much more than 1100 ppm, not impossible in the next century!
http://bit.ly/1n426hq
Alex
LikeLike
Abel Adamski
/ February 29, 2016Relevence to last post also, plus I did read an article some years ago relating to magnetic disturbances being noted by the Russians along the Pakistan, Indian , Himalayan fault line prior to some major quakes along that sector
http://www.livescience.com/38488-earthquakes-trigger-methane-release.html
LikeLike
redskylite
/ February 29, 2016All credit to the forum for the early observation and warning of this anomaly and to RS for excellent elaborating and narration. I sincerely hope it is not a precursor to any Earth event, just watch with caution and hope. CO does seem to interact and has climate change effects, and the news is not good. Just wonder how much CO is down there.
“Although carbon monoxide is only a weak greenhouse gas, its influence on climate goes beyond its own direct effects. Its presence affects concentrations of other greenhouse gases including methane, tropospheric ozone and carbon dioxide.
Carbon monoxide readily reacts with the hydroxyl radical (OH) forming a much stronger, greenhouse gas–carbon dioxide. This, in turn, increases concentrations of methane, another strong greenhouse gas, because the most common way methane is removed from the atmosphere is when it reacts with OH. So, the formation of carbon dioxide leaves fewer OH for methane to react with,thus increasing methane’s concentration. A NASA report indicates that carbon monoxide is responsible for a 13% reduction in hydroxyl concentrations and through other reactions, a 9% drop in sulfate concentrations. Sulfates are credited for offsetting some of the global warming due to greenhouse gases by reflecting incident solar radiation back to space.”
http://esseacourses.strategies.org/module.php?module_id=170
LikeLike
RobB
/ February 29, 2016Mysterious, indeed. Hopefully there’s going to be some reactions from geologists to clarify this ASAP because the study mentioned by Robert opens up horrible possibilities during the next days. Stay safe Californians!
LikeLike
Kevin Jones
/ February 29, 2016Very curious story, Robert and commentators. Yet further indication of how Earths’ spheres are interconnected. Atmosphere, hydrosphere, lithosphere….. the sphere of human activities.
LikeLike
F.Sandstrom
/ February 29, 2016Yes, this goes for everything in this universe, everything from the smallest to the biggest is connected. Our sun is an organism just like earth. The galaxy’s stays together because the galaxy want to be a galaxy even though everything in the universe seems to be speeding up and therefor it should fly apart.
It’s time we start caring for this planet and the rest of the universe we live in.
LikeLike
Abel Adamski
/ February 29, 2016Maybe a good time for some scribblers and lurkers to take a holiday and that trip they have been considering along with family and pets, that methane spike in conjunction is an interesting combination.
Not the big one but a cautionary warning of the interconnectedness of ice, water, land and ocean, mass balance and distribution on a rotating spheroid
LikeLike
Kevin Jones
/ February 29, 2016I’m wholly out of my league, here, but looked at ESRL GMD CO for Walnut Grove, California. A large carbon monoxide spike in June 2008. Chino Hills 5.5 quake that July.
LikeLike
Jeremy
/ February 29, 2016“Dr. Peter Gleick of the Pacific Institute of California recently warned, “What is happening in the Arctic now is unprecedented and possibly catastrophic,” Ian Johnston, Arctic Warming: Rapidly Increasing Temperatures are Possibly Catastrophic for Planet, Climate Scientist Warns, Independent, February 25, 2016. “The evidence is very clear that rapid and unprecedented changes are happening in the Arctic.”
http://www.counterpunch.org/2016/02/29/the-arctic-turns-ugly/
LikeLike
wolfhheinl
/ February 29, 2016I think these elevated CO levels may be tied into the Porter Ranch fiasco.
LikeLike
mlparrish
/ February 29, 2016Wolfhheinl,
I dearly hope you are right, given the possible alternative. These hot spots, though diminished (CO @ 40N is now 2239 ppb) are at both ends of the San Andreas fault. If related to Porter Ranch, then the CO must be leaking along the fault.
LikeLike
Caroline
/ February 29, 2016Fascinating (albeit very worrisome) news Robert et al.
You would think there would be more research on this (link between release of CO and earthquakes). Great comments—as always—as well. I learn so much here!
Re: the link by Alexander Ac;
It is well written piece by Tim Radford that exemplifies why I go through the roof when people’s response to climate change is: “the earth will be just fine without us”.
That flippant remark drives me crazy (apologies if I’ve ranted about this before here!). If humans destroy all the requirements for us to survive on this planet due to our stupidity, greed, egocentric behaviors we will most likely take all of the biosphere down with us. It disregards
the other life forms and the level of destructiveness that we are capable of . . . .
On a final note, I came across a quote from Naomi Oreskes that I wanted to share:
“It’s a cliché to say that knowledge is power. It’s not true actually. Knowledge is knowledge. In our society, knowledge resides in one place, and for the most part, power resides somewhere else. And that disconnect is really the crux of the challenge we face right now.”
link:
http://news.mongabay.com/2016/02/naomi-oreskes-on-climate-change-weve-blown-it-but-pessimism-is-not-acceptable/
LikeLike
robertscribbler
/ February 29, 2016The Earth would be fine. Human beings and life on Earth would take a HEAT round.
LikeLike
Marcel Guldemond (@marcel_g)
/ February 29, 2016Nice find Caroline, the quote about the separation of knowledge and power is a refreshing way to look at it, that really drives home the idea that we don’t live in a world governed by powerful actors, it’s really much more like Idiocracy.
LikeLike
climatehawk1
/ March 1, 2016Thanks, scheduling tweet on this.
LikeLike
Caroline
/ February 29, 2016Hi Robert,
I have new email address—–hope you put me through! Thanks for all the time you take to make this a denier free zone.
Caroline
LikeLike
wehappyfew
/ February 29, 2016Thanks for the quick alert, Robert.
My vote is for some kind of sensor or processing glitch. All three Nullschool “Chem” readings are elevated. Starting 2016-2-26-0000 UTC for CO and SO2; while CO2 readings are offset by 1.5 hours, so 2016-2-25 2230 UTC is the first CO2 anomaly.
Compare CO levels on 2016-2-25-2100 UTC to 3 hours later:
http://earth.nullschool.net/#2016/02/25/2230Z/chem/surface/level/overlay=cosc/orthographic=-118.23,39.62,1500/loc=-119.540,37.520
http://earth.nullschool.net/#2016/02/26/0000Z/chem/surface/level/overlay=cosc/orthographic=-118.23,39.62,1500/loc=-119.540,37.520
The stripes of suddenly elevated CO are exactly parallel to latitude lines. This can’t be natural – latitude is an arbitrary human construct with no geologic significance.
The same artificial looking lines appear on the SO2 and CO2 charts.
………….
The puzzling thing is that after appearing so suddenly, then intensifying up to 46,000 ppbv, the CO, CO2, and SO2 anomalies start to disperse and dissipate – exactly along the wind flow lines as if they are real, physical blobs of gas being pushed around by the wind.
So they appear suddenly in a strange pattern that might indicate they are artifacts of the sensor or data processing, but then they behave exactly like real, physical masses over the next few days.
…………
I don’t see how this can be related to the Porter Ranch natural gas leak. That leak has been spewing for weeks prior to the sudden onset of these anomalies. Plus it would show up as a single point, not a broad band from Baja to Vancouver.
LikeLike
Thomas Simon
/ February 29, 2016A caution on data from Earth Null School ” To bring the GEOS-5 results closer to contemporary numbers, I have added a uniform offset of +32 ppmv, increasing the global mean to 400 ppmv. This is not scientifically valid, but it does allow the visualization to become illustrative of the discussion occurring today around atmospheric CO2. Without question, I would welcome a more rigorous approach or an explanation why the GEOS-5 model produces the data that it does.
LikeLike
robertscribbler
/ February 29, 2016Good points, Thomas.
LikeLike
wehappyfew
/ February 29, 2016Arrghh… forgot about the 1 link limit, lost a reply…
Trying again… I think this is a sensor or post-processing glitch. The anomalies in CO, CO2 and SO2 all appear suddenly over a wide area, in straight lines following latitude. That can’t be natural.
This is the nullschool picture before the anomaly appears:
http://earth.nullschool.net/#2016/02/25/2100Z/chem/surface/level/overlay=cosc/orthographic=-118.23,39.62,1500/loc=-119.540,37.520
Step through the time with the small arrow to three hours later… 2016-2-26-0000 UTC
LikeLike
wehappyfew
/ February 29, 2016Continuing…
The anomaly appears suddenly:
http://earth.nullschool.net/#2016/02/26/0000Z/chem/surface/level/overlay=cosc/orthographic=-118.23,39.62,1500/loc=-119.540,37.520
It intensifies… I found 46,000 ppbv for the max a few hours later, then it dissipates.
The puzzling thing is… it dissipates exactly like a real mass of physical gas would. It follows the wind, expands, and no longer appears in artificial-looking straight lines of latitude.
So is it real, or an artifact?
It can’t be related to the Porter Ranch methane release…. not a point source, and the timing doesn’t match at all.
LikeLike
robertscribbler
/ February 29, 2016Good thoughts, WHF. The shape and drift don’t look too artifactish to me. Sudden appearance and some features do look a bit odd, though. I wouldn’t rule out a glitch. But the back end fade and dispersal does look natural.
LikeLike
Andy in SD
/ February 29, 2016The appearance of a glitch could be fouling sensors, or the calcs do not factor in such a trend change. Glitch is not out of the question, but it may also be due to sensor / calcs responding to either the amplitude of the spike (railed the sensor) or the trend changes (velocity / acceleration).
LikeLike
todaysguestis
/ February 29, 2016Study: More hazardous tropical cyclones to hit Philippines
http://www.philstar.com/headlines/2016/02/27/1557353/study-more-hazardous-tropical-cyclones-hit-philippines
LikeLike
Cate
/ February 29, 2016Drawing this to your attention, Robert, delete as you see fit. See especially the comments from the helpful fishoutofwater—who mentions “smoke from Canadian fires”. Um, say what? As far as I know, and I could be wrong, there are no fires happening right now in north-western Canada, where winter still has a pretty firm grip on the land.
http://www.dailykos.com/story/2016/2/29/1493107/–There-is-a-Major-Carbon-Monoxide-Explosion-on-the-West-Coast
LikeLike
robertscribbler
/ February 29, 2016No. Fish brings up good points that are well worth following up on. I did an analysis of fire data and didn’t find too many active wildfires in the initial pulse region. There were a few in Canada.
The region does tend to be subject to inversions. And we do have a stagnant set of highs over the area. So mass burning of orchards, which has also been reported, may be the initial cause.
Writing an update now.
LikeLike
Cate
/ February 29, 2016Curious to know where the Canada fire info can be found? I checked here—maybe this is just wildfires If there were active wildfires (vs planned/controlled burning) anywhere in Canada in February, well—that would be another post for you. 😀
http://cwfis.cfs.nrcan.gc.ca/interactive-map
LikeLike
robertscribbler
/ February 29, 2016The fire intensity for Canada this winter has been above average. In recent days, there appears to be some indication of fire activity within British Columbia (now linked in the article above). These fires would have been low intensity and resulted in no major fire alerts. We do have hotspot activity all throughout Western and Southeastern Canada. It’s an indication that fire season for the coming year will probably be quite intense. In my opinion, we could see major fires start to break as early as mid to late March, with April being a rather high risk for this year (considering the way high amplitude waves in the Jet and warmth have tended to set up over this region).
But it’s worth noting that any fire activity in Canada over the past week has been mostly hotspot based, small, and self-extinguishing and has not included any major wildfires.
LikeLike
Cate
/ February 29, 2016Ah, there we go, got the update. Thanks!
LikeLike
robertscribbler
/ February 29, 2016It’s worth noting that the big agency to look at for Canada is the Canada Interagency Fire Center —
http://www.ciffc.ca/firewire/current.php
They tend to put out sitreps only when the fire situation hits a noteworthy intensity. We haven’t had a sitrep from them since late September.
That doesn’t mean we haven’t had active fires or hotspots. It’s just that the recent fires have been at low intensity.
LikeLike
Cate
/ February 29, 2016Re the coming fire season in Canada–yes, a dry winter and spring can very well mean early forest fires, which can be quite bad before the woods leaf out. That’s exactly what folk in my area are saying about this snowless winter.
LikeLike
robertscribbler
/ February 29, 2016So from the weather prediction standpoint, dry winters are often a precursor to severe drought, heatwave, and wildfire events. Seems like folk lore of the locals matches up well with a scientific basis for trends prediction in this case.
Thanks for the local observations on the ground, Cate.
LikeLike
robertscribbler
/ February 29, 2016In any case, I think Fish needs to tone down the breathless commentary a bit. We’re trying to nail this down as best we can and I don’t happen to have a red phone line to his house for calls on expert geological commentary at 1 AM EST. 😉
LikeLike
wili
/ February 29, 2016Wouldn’t everyone in the region have had to decided to light up their orchards not just on the same exact day, but pretty much all on the same hour to give this kind of signal? Wehappyfew’s images show the area going from essentially no CO over land, to having 100x above normal readings in just three hours (the minimum interval available at nullschool, apparently).
LikeLike
robertscribbler
/ February 29, 2016Exactly, Wili. Not only do we have this very large excession and plume. But it happens pretty much all at once. If it’s orchard fires, it’s like everyone on the West Coast decided to pour the most polluting form of gasoline on a ridiculously massive pile of dead orchard trees and, as if coordinated in flash-mob fashion, decided to light them off all at once.
The large initial pulse and very rapid ramp up make this a suspect event.
LikeLike
Greg D
/ February 29, 2016Thanks for your article. Before this I had no idea that anything else besides wind was available on earth.nullschol.net!
So for I haven’t found much detail about these plots though. Where can we find a legend for the colors used in these illustrations on eart.nullschool.net??
LikeLike
Bryan
/ February 29, 2016Click on the “Earth” button at the bottom left of the screen and a screen will pop up showing a color scale and a bunch of different options for displaying data as well as advancing back and forth in time. It also reveals the data sources.
LikeLike
coopgeek
/ February 29, 2016I’d like to offer a less-exciting alternate explanation based on observations on the ground. I spent last Thursday and Friday (2/25-26) driving around the center of that high reading patch that I’m seeing on the first map (a farm survey in Glenn County, about 100 miles NNE of San Francisco). There was a conspicuous abundance of fires all over the valley, many of which were creating towering black plumes of smoke visible for many miles. Really nasty black plumes in some cases. A couple of the fires looked like a refinery or something way off over the horizon.
For those unfamiliar with the somewhat disturbed rhythms of Sacramento Valley agriculture, whenever an orchard loses productivity, they often just cut down the trees, bulldoze the whole thing into a mountainous pile, wait for the right stretch of dry weather (but not too dry!) followed by some nice light breeze and uplift to get most of the smoke aloft, and light er’ up. I would assume that accelerants are usually involved. There’s an unusual amount of orchard retirement tied up in the drought (younger trees take less water and stressed older trees are less productive) and we just had a dry month, so it makes sense that there might be an unusual amount of burning. Incidentally I usually work in an office with a panoramic view, and we don’t often see these kinds of plumes.
Don’t get me wrong, it’s still apocalyptic out there, but this seems like a much better explanation than possible upcoming earthquakes. The CO readings roughly correspond with the Central Valley and northward, which makes sense considering ag patterns and the prevailing winds.
LikeLike
wili
/ February 29, 2016Thanks for input from direct observation. It would be a bit surprising if people all up and down the west coast decided to all light up their orchards on exactly the same day, but what do I know!??
LikeLike
coopgeek
/ February 29, 2016You’re welcome. I suspect the convergence of burning was just that a lot of farmers are tearing out orchards this winter, and we just had several relatively dry weeks (with rain forecast to make a big comeback this week and maybe persist in March – hooray!). So if I had a giant pile of old almond trees to burn, I’d sure do it now, rather than wait since the later you go, the more likely it is for the valley air to stagnate (which means no burning). In any case, my experience (as a lifelong resident who notices stuff) was to wonder “what the hell is up with all the fires?” Interestingly, my wife and I are both experiencing metallic tastes in our mouths, which is a symptom of CO poisoning.
LikeLike
wili
/ February 29, 2016For major fires, folks need permits, and they are, apparently told by authorities exactly when it is safe to burn. This could account for wide spread burning at about the same time.
But if this also corresponded with a major inversion, it would also suggest that some authorities didn’t exactly pick the best moment to allow such a widespread burn (if that is indeed part of what we’re dealing with).
LikeLike
robertscribbler
/ February 29, 2016Thanks for the thoughts, Coopgeek. Included in the update. Perhaps the New Yorker will need to do a follow-up?
Do you have any footage of the burning? It may be useful to the overall conversation.
Best
R
LikeLike
coopgeek
/ March 1, 2016You bet. For some reason I did not film the burning. I didn’t get close enough to see the actual flames on any of them. Bummer, since I usually try to capture that sort of stuff.
There wasn’t an inversion, and I think the authorities picked a pretty good time to allow the burns (assuming they are allowed, which is another story). The smoke was generally rising up nicely, although there was a patch near the hills on Fri afternoon where there was a lot of irritating smoke at ground level over maybe a few dozen square miles.
PS. Cancel that CO-poisoning alert. My wife is not at all convinced and in any case what I’ve got is probably mostly a lung bug.
LikeLike
dtlange
/ February 29, 2016– Anyone experiencing undue air pollution, smells. acrid tastes, or whatever should refer to local air monitoring for possible data.
– PDX DEQ had a zero reading for CO during period of above posted nullschool data.
– CA: California Local Air District Directory
This page last reviewed February 29, 2016
http://www.arb.ca.gov/capcoa/roster.htm
LikeLike
dtlange
/ February 29, 2016– USA EPA AirNow
https://airnow.gov/index.cfm?action=airnow.main
LikeLike
dtlange
/ February 29, 2016– SO Cal Ozone 0229

LikeLike
dtlange
/ February 29, 2016– Ozone Index @ 100
LikeLike
dtlange
/ February 29, 2016– San Diego, CA PM 2.5 code orange @ 118 index (0-500)

LikeLike
dtlange
/ February 29, 2016Ps- If not satisfied with agency data results — complain, loudly.
Their primary duty (usually) is the free floe of commerce — believe it. i see it time and time again.
OUT
LikeLike
nigel64
/ March 1, 2016Black plumes suggest rubbish being illegally burnt too under ‘cover’ of all the other smoke – certainly that’s what happens here; people often light up the really nasty stuff on foggy days – clean green NZ it is not.
LikeLike
Mike
/ February 29, 2016Found this related study. Seems that CO releases do not always proceed an earthquake,. http://www.nat-hazards-earth-syst-sci.net/13/2513/2013/nhess-13-2513-2013.pdf
LikeLike
wili
/ February 29, 2016Not _always_, yes. But I don’t recall anyone claiming that increased CO concentrations _always_ precede earthquakes. If they did, it probably would have been figured out long ago.
Your study does show that there was such a connection in a number of cases. So thanks for the link.
LikeLike
robertscribbler
/ February 29, 2016This looks like a glitch given that local air quality warnings did not start to show up as confirmation to the GOE5 sensor data.
LikeLike
wili
/ February 29, 2016But would air quality alerts kick in at these levels. Though much higher than background, they are still far from toxic levels, iirc.
50 ppm: No adverse effects with 8 hours of exposure.
200 ppm: Mild headache after 2-3 hours of exposure.
400 ppm: Headache and nausea after 1-2 hours of exposure.
800 ppm: Headache, nausea, and dizziness after 45 minutes; collapse and unconsciousness after 1 hour of exposure.
(Data from http://www.nfpa.org/safety-information/for-consumers/fire-and-safety-equipment/carbon-monoxide/symptoms-of-co-poisoning)
(these thanks to solartim at neven’s site.)
LikeLike
robertscribbler
/ February 29, 2016Take a look at the historical data for San Bernandino Valley as an example:
http://www3.aqmd.gov/webappl/aqdetail/AirQualityParameterData.aspx?Stationid=70820&AreaNumber=3&res=1680
LikeLike
Planet In Distress
/ February 29, 2016This — THIS — is exactly why the RobertScribbler blog should be a first read for serious people. Here is an important topic — potentially a hugely important topic — approached carefully and without alarmism, and then parsed and dissected by legion of equally careful and well-informed readers.
In my opinion what Robert has created is the equivalent to a carefully tended garden where serious discussion can grow and blossom and produce fruit. And it is a garden that pretty much takes a full-time gardener. Thanks, Robert, for what you do.
LikeLike
Mblanc
/ March 1, 2016+1
LikeLike
Ryan in New England
/ March 1, 2016Well said! I totally agree!
LikeLike
todaysguestis
/ February 29, 2016If Climate Change Doesn’t Sink Alexandria, Egypt’s Official Incompetence Will
http://www.takepart.com/feature/2016/02/26/sea-level-rise-alexandria?cmpid=organic-share-twitter
LikeLike
Marcel Guldemond (@marcel_g)
/ February 29, 2016Wow, at the same point that mild sea level rise will cause the Nile Delta to become useless for food production (saw an article recently), Alexandria will start to be abandoned, which would seriously threaten Egypt’s stability. And US coastal and Miami real estate prices will collapse at the same time, when everyone realizes that it will all have to be abandoned in the near future, causing a serious financial crisis all by itself. The ride’s going to get rough.
LikeLike
Ryan in New England
/ March 1, 2016Thanks for the link todaysguest. That was a good article.
LikeLike
Cate
/ February 29, 2016Oh btw….going off-topic for a sec—-
Grabbed this off Arctic Sea Ice Forum, “What’s New in Greenland” thread, post #138 dated today by AbruptSLR. It’s a link to a paper that “documents positive feedback mechanism between Arctic sea-ice loss and increased surface melting of the GIS”.
So, sea-ice loss means ice sheet loss. Whew.
http://journals.ametsoc.org/doi/abs/10.1175/JCLI-D-15-0391.1
LikeLike
Marcel Guldemond (@marcel_g)
/ February 29, 2016That’s related to that Paul Beckwith video someone posted here recently isn’t it? Basically, the arctic sea ice is like the ice cube in a glass of water on a sunny day. That water stays at 0C until all the ice is gone, and then the temp goes up at 80x the rate. So once the Arctic starts to get blue sea summers for longer than a few weeks, the climate there heats up dramatically (more than it already has), and the northern part of the Greenland Ice Sheet could very suddenly accelerate its ice loss. Add that on top of the idea that the West Antarctic Ice Sheet is doomed, and large parts of it could plausibly collapse within several decades, and I find the remaining estimates of sea level rise of 1-1.2m by 2100 to be really overly optimistic. Frightening really.
LikeLike
Cate
/ February 29, 2016Marcel, yes, that was the gist of the video. This paper seems to explain how the effect might work on a very large scale—how the loss of sea ice changes the weather/climate, in essence, so as to accelerate ice sheet melt. I am quite concerned about the effects of Greenland ice sheet melt in particular, since here in Newfoundland we live pretty much right in the way of both the cold fresh water and the giant bergs coming down from there.
Dunno if you saw my comment on the last post—I love your paintings! 😀
LikeLike
Marcel Guldemond (@marcel_g)
/ March 1, 2016I know it’s not much consolation Cate, but I just saw something about the counter intuitive distribution of sea level rise: the ice sheets, with their mass, exert a gravitational pull on the sea water, so as they melt, sea level around them will go down, and this effect extends for 3000 km. Which means that Greenland’s melting will affect Newfoundland and Europe only moderately.
The West Antarctic Ice Sheet, on the other hand, is a real threat, since it’ll distribute more of its sea level rise to the northern hemisphere by that logic, and it looks like it’s going to collapse first.
Also, thanks very much about the paintings! 🙂 I keep wanting to do more climate based art, but that’s a harder sell than what I’m doing, and it’s already a tough business to make money in.
LikeLike
Colorado Bob
/ February 29, 2016How Often Climate Change Has Caused Floods, City by City
Between 1955 and 1964, there were six total days of flooding in Seattle. Between 2005 and 2014, there were 29 total days. The major difference between then and now, of course, is that the world’s average temperatures are warmer due to human activities like cattle farming and the burning of fossil fuels. In fact, between 2005 and 2014, 26 days of flooding in Seattle were attributable to anthropogenic climate change, according to a new analysis. Only three were natural and would have occurred without global warming.
The analysis calculated the number of climate change-caused minor flood days for 27 American cities. You can check out the results below. Maybe your hometown is represented too. (Mine’s Seattle.)
http://www.psmag.com/nature-and-technology/climate-change-floods-by-city
LikeLike
Colorado Bob
/ February 29, 2016The interactive map is pretty amazing, and the one for Key West is an eye popper.
LikeLike
jimbenison
/ February 29, 2016Being in San Diego only a few meters above sea level I was a bit freaked out when I first saw this. However, it appears to be an artifact. Based on ground measurements no CO spike happened.
Use this link and check out the “Historical Data” tab.
http://www3.aqmd.gov/webappl/aqdetail/AirQualityParameterData.aspx?Stationid=70820&AreaNumber=3&res=1680
LikeLike
robertscribbler
/ February 29, 2016Thanks, Jim. Update in.
LikeLike
Colorado Bob
/ February 29, 2016Some good news –
It was a big week for two hardship cases in the animal kingdom — manatees and monarch butterflies. Both are on the rebound.
On Friday, the U.S. Fish and Wildlife Service announced that monarch butterfly populations were up an estimated 255 percent in a reserve Mexico created for their protection. That good news followed Thursday’s release of a count that showed Florida’s endangered West Indian manatee population rocketed upward for a second year straight.
https://www.washingtonpost.com/news/animalia/wp/2016/02/29/monarch-butterflies-and-manatees-oh-my-these-two-animals-had-major-rebounds/
LikeLike
dtlange
/ March 1, 2016– Re West Coast Monarch Butterfly Winter Population
– Xerces Society
More monarchs reported in Northern California this year, but monarchs are not yet recovered
… Although more monarchs were counted, the average number of monarchs per site is not significantly different than last year’s count, and this year’s population estimate represents a 39% decline from the long term average. The number of monarchs counted this year is but a fraction of the 1.2 million monarchs recorded in the late 90s.
Less positive is that in southern California, the majority of the sites surveyed had fewer monarchs than last year.

– [Likely due to climate change’s latitudinal warming. Monarchs need the cool moist coastal areas.]
LikeLike
dtlange
/ March 1, 2016http://www.xerces.org/2016/02/04/assessment-of-western-monarch-butterfly-winter-population-completed/
LikeLike
eleggua
/ February 29, 2016https://global.oup.com/academic/product/waking-the-giant-9780199592265?cc=us&lang=en&#
‘Waking the Giant: How a changing climate triggers earthquakes, tsunamis, and volcanoes’
by Bill McGuire (Professor of Geophysical and Climate Hazards at UCL)
– Draws together research from different areas, introducing a growing area of research
– Looks back at the Earth’s past to consider what our future might hold
– Demonstrates how the various systems of the Earth interact, showing that the scale and range of hazards from climate change may be greater than we have appreciated
“Twenty thousand years ago our planet was an icehouse. Temperatures were down six degrees; ice sheets kilometres thick buried much of Europe and North America and sea levels were 130m lower. The following 15 millennia saw an astonishing transformation as our planet metamorphosed into the temperate world upon which our civilisation has grown and thrived. One of the most dynamic periods in Earth history saw rocketing temperatures melt the great ice sheets like butter on a hot summer’s day; feeding torrents of freshwater into ocean basins that rapidly filled to present levels. The removal of the enormous weight of ice at high latitudes caused the crust to bounce back triggering earthquakes in Europe and North America and provoking an unprecedented volcanic outburst in Iceland. A giant submarine landslide off the coast of Norway sent a tsunami crashing onto the Scottish coast while around the margins of the continents the massive load exerted on the crust by soaring sea levels encouraged a widespread seismic and volcanic rejoinder.
In many ways, this post-glacial world mirrors that projected to arise as a consequence of unmitigated climate change driven by human activities. Already there are signs that the effects of climbing global temperatures are causing the sleeping giant to stir once again. Could it be that we are on track to bequeath to our children and their children not only a far hotter world, but also a more geologically fractious one?”
LikeLike
Kevin Jones
/ February 29, 2016Thanks, eleggua. I’ve wondered along these lines. Next book on my list.
LikeLike
Montysano
/ February 29, 2016I’m halfway through an hour long lecture by Bill McGuire, and it’s fascinating stuff. You have to think that, while humans certainly affect the climate and that there are things we couild and should do, the modern world really exists on the good graces of a momentarily (in geologic time) temperate world, and how razor-thin and fragile that balance is.
LikeLike
robertscribbler
/ February 29, 2016The people who are pushing us to mess up our comfortable climate state are just nuts. Those people would be the fossil fuel corps and national oil companies.
LikeLike
Mblanc
/ March 1, 2016Ahh… wondered if Bill McGuire would pop up on this thread. The book is great, and a little calmer than the title implies to the casual observer, which is a good thing.
Prof McGuire is prepared to stick his neck out in this area, and take the heat which comes with it, which is why I like him. I think the emeritus bit helps!
I’ve been reading his stuff for donkeys.
http://rsta.royalsocietypublishing.org/content/368/1919
Many of the references in ‘Waking the Giant’ come from the conference (2009), and the above (2010) publication.
Interestingly McGuire’s is a good mates with (former pupil?) and sometime collaborator Dr Ian Stewart. You may have seen some of his most excellent TV work, as the UK’s highest profile geologist, and is also highly recommended by myself. 🙂
PS It isn’t necessarily going to be these geological elements that will give us the most problems going forward, and McGuire certainly isn’t saying that. But they could make a hellish backdrop, and be a complicating and costly factor, in our already jeopardised future.
LikeLike
wehappyfew
/ February 29, 2016Let’s look in more detail at the idea that orchard or forest fires are responsible versus earthquake precursor…
After markfromOZ and pekapekapones mentioned NZ quakes and CO levels near Christchurch, I looked back through nullschool pictures of OZ, NZ, and Tasmania looking for anomalies.
I found some…
2016-02-14 03:00 UTC
43.76° S, 171.86° E ✕
90° @ 18 km/h
265 ppbv
This is about 5-6 times above normal South Pacific levels of 40-50 ppbv.
This is 10.75 hours before, and directly downwind from, the largest quake in NZ in the last 30 days:
M5.8 … 17km ENE of Christchurch, New Zealand
2016-02-14 00:13:43 UTC 8.2 km
I looked at NASA Worldview for any sign of major fires…. nothing.
………..
On the other hand, forest fires CAN cause big spikes in CO… I found one in Tasmania:
41.23° S, 145.46° E ✕
280° @ 25 km/h
1336 ppbv
Date | 2016-02-13 03:00 UTC
The smoke from the corresponding major fire is very visible on NASA Worldview:
https://worldview.earthdata.nasa.gov/?p=geographic&l=MODIS_Aqua_CorrectedReflectance_TrueColor(opacity=0.97),MODIS_Terra_CorrectedReflectance_TrueColor,Coastlines,Reference_Labels(hidden),Reference_Features(hidden)&t=2016-02-12&v=138.9990234375,-46.0282184495488,155.8740234375,-37.6346637620488
So this fire in Tasmania is big enough to spike CO levels to 30 times background, and is easily seen on Worldview, yet the entire West Coast was 10-30 times higher still, with no major smoke plumes visible on Worldview.
Also, Worldview has a MODIS “Fires and Thermal Anomalies” layer… nothing visible along the entire West Coast except a few small fires in central Oregon and eastern CA (out in the desert).
……….
Local observation datum…
Bruce Steele over on Neven’s blog says that last week was the first day controlled burns were allowed in S. B. county in a long while, so maybe this was true throughout CA, and the pent-up demand for trash burning caused the massive spike without triggering the MODIS thermal imaging, and people burned their trash cleanly enough to prevent a massive smoke plume like an uncontrolled forest fire would.
Since the counties in CA often follow latitude lines, this may explain the artificial looking pattern to the initial outbreak – a few counties maybe did not approve outdoor burning so they show up as linear east-west gaps in the pattern.
I’m liking this explanation the best…. but seriously … 46 ppm just from trash burning??? Maybe those Californians need to take it easy on the accumulation and sudden incineration of so much trash!
A Tragedy of the HyperConsumerist Commons.
LikeLike
wehappyfew
/ February 29, 2016Link failure on the Worldview map…
Go to Tasmania on Feb 12-14 to see the smoke from that fire.
LikeLike
wili
/ February 29, 2016Nice link between county lines and the apparently rectilinear patterns we saw.
What do you think of the idea that, besides these fires, an inversion was holding the emissions from these fires low to the ground and so further concentrating them?
Do you think there is still a possibility that it was a glitch in the system?
LikeLike
wehappyfew
/ March 1, 2016I’m open to a glitch that magnified the actual levels far above reality. Not sure how that would work though. China has CO levels in 1000’s ppbv routinely. Their emissions are from million, if not hundreds of millions of very small sources. The haze blocks the sun, and is easily visible from space.
Did CA’s central Valley have hundreds of large orchard and agricultural fires, as reported here, that rose up to an inversion layer, but produced little visible smoke? Did the processing algorithm that works for China fail here, due to some peculiar atmosphere conditions? I’m kind of at a loss to see a specific mechanism for how that could happen, especially without expertise in how these data are acquired.
Maybe it’s time to email the keeper of the nullschool website and ask directly…
LikeLike
JPL
/ March 1, 2016Also, does the trash/orchard burning scenario explain British Columbia CO levels?
LikeLike
Mblanc
/ March 1, 2016I’d be interested in DT’s take on the local air pollution effects of epic burning. I guess the local mortality rate will have spiked significantly, if those levels are correct
LikeLike
Mblanc
/ March 1, 2016Actually, looking above I see he is well ahead of the game on this, as usual.
LikeLike
Ryan in New England
/ March 1, 2016Great analysis, wehappyfew. The trash burning hypothesis can explain a lot. A question still lingering for me is, does Canada participate in this practice? Because as Robert pointed out, this extends up into British Columbia.
If it is agriculturally based fires, it’s pretty shocking how much CO is released. Maybe it’s a testament to how dire the drought is. I imagine lots of farmers were banking on a wet Winter, knowing that in the past El Nino has typically delivered lots of precipitation to the west coast. In recent years lots of farmers have had to downsize their orchards due to the drought, and when they do they tear up the old trees and just burn them. Maybe another failed rainy season was the final nail in the coffin, and those hoping for a drought-buster had to cut their losses? And the moment permits were issued thousands of piles of dead trees were all lit at the same time?
LikeLike
Nicky Sundt
/ February 29, 2016Maybe this sheds some light on the elevated CO levels: Tropical fires fuel elevated ozone levels over western Pacific Ocean, http://www.eurekalert.org/pub_releases/2016-02/nsfc-tff022416.php, Press Release from NASA Goddard, 24 Feb 2016.
LikeLike
Colorado Bob
/ February 29, 2016Warmest winter for 300 years but records show it was also second wettest EVER as floods ravaged UK
http://www.mirror.co.uk/news/uk-news/warmest-winter-300-years-records-7465442
LikeLike
Colorado Bob
/ February 29, 2016It has also been the second wettest winter on record for the UK, with average total rainfall across the country at 515mm (20.2 inches), second only to the record wet winter of 2013/2014, which saw widespread storms and flooding
LikeLike
robertscribbler
/ February 29, 2016We knew it was going to be bad. Sad to say it but they’re in for more of the same.
As for the current article, I hate to admit a little bit of impish glee getting ahead of a very low information media stream and attempting to inject a little sanity. Should have done the same with Zika.
LikeLike
Syd Bridges
/ March 1, 2016But the UK will be fine, because we have David Cameron. Clearly, if you cut money for flood defences, then the floods won’t happen. And it’s not affected any of the rich Tory areas this time, so who cares?
This CO spike is something new to me. I suppose hot steam and carbon in the crust may produce CO and H2 by the water gas reaction. Although it is an endothermic reaction, heat from deep in the Earth could drive it. I certainly hope that it is not a precursor to an earthquake, though the pumping will probably make one more likely.
Whether it is a flash in the pan, or the precursor to something else, it has certainly been a very interesting article. It would be very useful if such a release enables better early warning for quakes.
LikeLike
robertscribbler
/ March 1, 2016Thanks Syd. The geology bits are a little outside my bailiwick. However, this particular theory seems very unproven. It might be a case that some earthquakes exhibit this tendency. But it does make sense at a geophysical level — hydrolic heat and stress along the fault lines related to magma movements and crustal stress could well produce these kinds of gasses. Similar precursor gasses are often an indicator of volcanic eruptions. It’s just that there doesn’t appear to be a high certainty yet for an earthquake indicator. USGS is pretty adamant about there being no way to accuratedly forecast earthquakes at this time.
LikeLike
mtflis
/ February 29, 2016GEOS-5 data anomaly likely
LikeLike
dtlange
/ February 29, 2016– I’ve been hoping this subject would get illumination it surely deserves.
– Not only the anxiety of facing up to climate disruption — but the mental, or cognitive, dysfunctions that allow us to destroy the atmosphere — our sole means of survival.
Climate change is wreaking havoc on our mental health, experts say
Climate change is causing chaos in the environment and beyond; experts are warning we’re “not even close to being prepared” for the damage it does to our mental health.
As a provincial coroner and past palliative care physician, Dr. David Ouchterlony has seen suffering and death up close, experiences that have occasionally led to brief moments of sadness. But Ouchterlony describes such emotions as “trivial” compared to the dread he feels when thoughts about climate change linger, as they often do. He worries almost obsessively about a future he won’t see. How will younger generations be affected? Why are we failing to act on the threat?
“I was completely blind to it, and then five years ago it just hit me,” Ouchterlony, 74, said. “I went through this stage of losing sleep, thinking about my grandchild, wondering what I could do.”
http://www.thestar.com/news/world/2016/02/28/climate-change-is-wreaking-havoc-on-our-mental-health-experts.html
LikeLike
dtlange
/ February 29, 2016– “pre-traumatic” stress
… He described the feeling as an “absence of hope” characterized by despair and, at times, exhausting guilt. Some researchers have called it a “pre-traumatic” stress disorder that, in some, is feeding anxiety and depressive thoughts.
LikeLike
robertscribbler
/ February 29, 2016Except for the despair part. I’ve been taught to fight, even when the situation seems hopeless. So I guess I’m immune to that kind of despair.
LikeLike
dtlange
/ February 29, 2016– Maybe, it’s not so much as ‘despair’ — but the feeling of being overwhelmed.
LikeLike
Ryan in New England
/ March 1, 2016Thanks for that link, dt. I can relate to the pre-traumatic stress feelings. I actually just left a comment below about feeling discouraged lately. If it wasn’t for Robert and all my friends here I would really feel alone over the climate change issue.
LikeLike
robertscribbler
/ February 29, 2016I hear him loud and clear. It’s a window into my world.
LikeLike
dtlange
/ February 29, 2016– I tend to feel the despair — then come out the other ready for action.
Mostly, I worry about the innocent — the children, the wildlife, etc.
🙂
LikeLike
robertscribbler
/ February 29, 2016That shows your heart is still alive.
LikeLike
dtlange
/ February 29, 2016… “We may not currently be thinking about how heavy the toll on our psyche will be, but, before long, we will know only too well,” warned a 2012 report from the U.S. National Wildlife Federation.
LikeLike
robertscribbler
/ February 29, 2016I think it’s already had a toll. Would Trump even have been a serious candidate in 2012? Climate change denial is just the flip side of despair. And the madness with which the fossil fuel companies and related investors like Buffet and the Kochs keep pushing their deadly products is yet one more side to the insanity.
We live under the darkening clouds of a climate change that could well be described as a result of sickness of the human heart and mind. But there are many, many innocent humans too who would never have contributed to this if they had had the choice and so many more innocent creatures of this world who will suffer if we can’t do what basically amounts to turning on a dime.
It’s a rough time. It seems we are entering what could be considered the bite of history.
LikeLike
Mblanc
/ March 1, 2016Sometimes, when storm clouds gather, you can physically feel it in the air.
I feel a bit like that, but psychologically, this year more than ever.
LikeLike
Ryan in New England
/ February 29, 2016Off topic…I want to apologize to all my friends here if my mood and outlook has been pessimistic as of late. I usually have hope and optimism on par with Robert, and try and pick out the few rays of sunshine from what has become a perpetually cloudy day. However, I must admit that I’m currently feeling discouraged by the apathy and indifference that the majority of Americans have towards climate change. What’s most horrifying is the ignorance and anti-intellectualism that is so proudly embraced in America. It makes me feel like we are fighting an impossible battle. And this morning I heard probably the most ignorant comment ever about climate change. I never realized a person could be so incredibly uninformed.
I was just reading comments on Robert’s last post, and Steven Blaisdel’s (Sorry if I misspelled that Steven) comment struck a chord with me. He pointed out how we have become so obsessed with more and more consumption we have forgotten everything about the natural world. Well that sentence was perfect after the segment I saw on CBS news this morning. Today is February 29th, and they consulted Michio Kaku, a physicist, to explain the reason for leap year. I thought to myself, why do they need a physicist to explain something so basic and simple I think I learned about it when I learned to use a big-boy toilet? How can any grown person not know that it takes the Earth 365 1/4 days to complete one revolution around the sun?
So they went to the street and asked adults why we have leap year. I’m sure they edited the footage heavily, but not a single person knew!! What’s worse, one girl answered El Nino while another wondered if climate change was the reason we have leap year! That’s as dumb as thinking we have nighttime because the sun gets tired. And they all laughed it off. Proud to be absolutely clueless about something so fundamental. They probably don’t know why we have seasons, or think that the Sun orbits the Earth. Do they even know the Earth is round? In an age when you can answer literally any question you may have, and have access to basically all human knowledge, why are Americans less knowledgeable than a peasant from the Dark Ages?
I may be “young”, but I can rant like I’m twice my age 😉
LikeLike
robertscribbler
/ March 1, 2016Good rant, Ryan. I hear ya. I go through dark times too. Mainly it’s when I’m just too tired to try to keep up with the craziness of a mad world. In the proud tradition of Colorado Bob:
What they are doing is so, so fundamentally wrong. And we simply must not let them win.
But I have this suspicion that the stupidity of Americans is a false meme that only serves to reduce our faith in each other. Perhaps I’m wrong. But no-one I know, even climate change deniers, don’t know why we have leap year for crying out loud. That’s my anecdotal evidence. Perhaps rendered incorrect by the quality of the company that I keep.
In any case, I’d take a billion people not knowing the meaning of leap year any day over a million fossil fuel company executives and investors so stupid they can’t keep running the world toward mass extinction full speed ahead.
LikeLike
Mblanc
/ March 1, 2016Imho the American people have been the victims of one of the most comprehensive misinformation campaigns in history, so I’m not sure it is fair to call them stupid.
It’s been a real trench war here in the UK over CC (which still continues), but what I have seen from the US suggests the deniers campaign seems better organised, more sustained, more deceitful and consequently, more successful.
It is perhaps presumptious to say that from over the water, but that is the honest impression I get.
LikeLike
climatehawk1 (@climatehawk1)
/ March 1, 2016Correct on the disinformation campaign. Details are spelled out in Jane Mayer’s “Dark Money,” which I’m currently reading. If anyone would like a sample of the info, she’s featured in a number of YouTube videos discussing the book. Stopping climate action is just one of the items on the right-wing billionaires’ agenda, but of course it is the most important for everyone else on the planet.
LikeLike
Cate
/ March 1, 2016Ryan, keep ranting. Never stop. 🙂
LikeLike
dtlange
/ March 1, 2016– Interesting that this comes from the National Wildlife Federation.
– pdf
The Psychological Effects of Global Warming on the United States:
And Why the U.S. Mental Health Care System Is Not Adequately Prepared
Click to access Psych_Effects_Climate_Change_Full_3_23.pdf
LikeLike
dtlange
/ March 1, 2016– WORST STORM OF THE WINTER SEASON BLAST HOKKAIDO
Northern Japan has been blasted by one of the more potent storms of this winter season.
LikeLike
dtlange
/ March 1, 2016http://www.westernpacificweather.com/2016/02/29/worst-storm-of-the-winter-season-blast-hokkaido/
LikeLike
Ryan in New England
/ March 1, 2016It looks like Arctic ice has grown a little bit, but not enough to get out of record low territory.
https://nsidc.org/arcticseaicenews/
LikeLike
robertscribbler
/ March 1, 2016Good catch Ryan. At this time it appears to me that the only thing that can still strengthen the circumpolar winds is the warming of the mid latitudes with springtime.
LikeLike
dnem
/ March 1, 2016I’d have to imagine any ice forming this late will be pretty thin and vulnerable once the sun angle increases.
LikeLike
Marcel Guldemond (@marcel_g)
/ March 1, 2016If I remember what I’ve read on the Arctic Sea Ice Forum correctly, most of the uptick is from the Sea of Okhotsk, which is a peripheral sea that will be one of the first to melt out, and since it’s not connected to the Arctic Ocean, it almost doesn’t count as far as sea ice health goes. Apparently there was also recently a lot of export of older ice through the Fram Straight, so the Atlantic side is looking especially vulnerable this year. Last year too there was a large area of thick multi year ice in the Beaufort that acted as a buttress to the melting, but that’s not there this year, so if weather conditions line up, this melting season could be a doozy.
LikeLike
Colorado Bob
/ March 1, 2016Winston’s Damage Highest in South Pacific History; Extreme February Warmth in Eurasia
Dr. Masters
LikeLike
Colorado Bob
/ March 1, 2016L.A. recorded its hottest February on record
It was supposed to be one of the wettest Februaries on record. Instead, by one measure at least, it became the hottest on record.
With an average high temperature of 77.5, February was almost two degrees hotter than the previous record set in 1954, according to a Times analysis.
http://www.latimes.com/local/lanow/la-me-ln-la-recorded-its-hottest-february-on-record-20160229-story.html
LikeLike
Colorado Bob
/ March 1, 2016Central western Queensland towns swelter amid record breaking weekend heat
Julia Creek in the north-west recorded its hottest February day ever at 45.6 degrees.
Longreach also sweltered, reaching 44.4 degrees, its hottest February day since 1960.
Forecaster Kev Hutchins from the Bureau of Meteorology said residents in Winton would have also been feeling the heat.
“It reached 45.5 yesterday,” he said.
“Now that’s the hottest since records have been kept in Winton and that’s going back to 1884 at the Winton Post Office.
http://www.abc.net.au/news/2016-02-29/outback-qld-towns-swelter-amid-record-breaking-heat/7207110
LikeLike
roxannesumners
/ March 1, 2016Smells like a big truck running nearby, occasional rotten eggs. I’ve looked (suspiciously) at my dogs… Packing now
LikeLike
dtlange
/ March 1, 2016(Snip)
LikeLike
robertscribbler
/ March 1, 2016All readings coming from the same model … No confirmation coming from the ground reporting stations. Not a peep out of NASA or the earthquake monitors. I’m not comfortable with spreading conspiracy theories.
If we can come up with outside confirmation, outside the ChristChurch example (which is admittedly worth considering), I’ll support a link on this. Otherwise, no dice.
LikeLike
dtlange
/ March 1, 2016– Gothcha. Makes sense — what you say. Same sensor & minus confirmation.
Thanks
– So many feedback loops, a very fluid situation, atmospheric chemistry and ratios changing…
The un-forseen always lurking.
– Always on the lookout for a ‘wildcard’ or two.
Keep up your sound reasoning.
OUT
LikeLike
robertscribbler
/ March 1, 2016This one has me worried a bit. The GEO 5 signature is quite compelling. But the station monitoring data does not confirm. So the unanswered question is — why this signature. We keep an eye out for earthquake swarms now.
The thing with PBs presentation is it would have been fine sans the inaccurate assertion that these readings came from different sources (they were all from GEOS 5) and included the explanation that fault lines in this region produce frequent small quakes. I tend to distrust the source anyway due to political affiliations with an organization that has tended to come across as rather biased and disruptive in my view (esp regarding COP 21). So this fudge just adds to my frustration.
If we can find any other sensor confirmation or if we get a whiff of earthquake swarms, then the story changes. Regardless, of how this progresses, I won’t forget how this one source mis characterized initial data.
LikeLike
Nick in Humboldt
/ March 1, 2016http://earth.nullschool.net/#current/chem/surface/level/overlay=cosc/orthographic=-124.65,40.85,3000
Spiking again on the southern Cascadia subduction zone off Eureka (where I live). There’s no reason COsc should be this concentrated here, a sparsely populated area surrounded by national parks and wilderness. I hope this is just a sensor error
LikeLike
YKD
/ March 1, 2016The carbon monoxide pulse is not an instrumentation glitch. 3 separate senors (snip…)
LikeLike
robertscribbler
/ March 1, 2016Wrong. All readings for SO2, CO, and CO2 are coming from the same model data — the GEOS 5. It’s dishonest of this source to state otherwise. I’d like to hear that word from NASA you mentioned. Otherwise, I’ll be treating these links as spam. They and the people posting them are making a false assertion.
Look. It’s possible (but less and less likely) that GEOS 5 may be correct. But we don’t have outside confirmation and implying that three separate readings from the same model is coming from different sources is just plain untrue. In addition, the ground reporting stations are producing a contradictory reading to what the GEOS 5 is producing. Furthermore, these two fault lines produce low intensity quakes quite frequently. What we would be looking for is an earthquake swarm. If such a thing were happening, USGS would produce a report and a public statement. So far, it’s crickets.
It’s basically mis characterizing the situation. I’ve had the same problem with this source before. And now he’s at it again.
LikeLike
Kevin Jones
/ March 1, 2016I recall a Kurt Vonnegut [cautionary] tale about a Royal Astronomer who makes increasingly troublesome observations. Finally he must report his discovery to the King. “The stars, one by one are going out!” The truth, it turns out, is he’s going blind.
LikeLike
Jeremy
/ March 1, 2016Interesting interview with Chomsky.
Says we’re heading for climate change extinction if Trump becomes Pres.
http://sputniknews.com/radio_loud_and_clear/20160229/1035517407/noam-chomsky-trump-presidency.html
LikeLike
Jeremy
/ March 1, 2016Oops, sorry about double post.
LikeLike
Jeremy
/ March 1, 2016West coast ocean die-off continues.
http://enenews.com/la-times-ongoing-fish-famine-along-west-coast-dearth-food-across-ocean-severe-fishery-implosion-govt-expert-looks-very-grim-hard-watch
This is just tragic. I used to catch king salmon off the Sonoma coast when I lived in CA.
I wouldn’t want to pull fish out of those waters now 😦
Fishing in the UK is crap.
LikeLike
dtlange
/ March 1, 2016Iraqi PM and US issue warnings over threat of Mosul dam collapse
US embassy advises any citizens in Tigris flood plain to leave, and Baghdad government urges Mosul residents to move away from river
The Iraqi government and the US embassy in Baghdad have both issued urgent warnings about the possibility of the Mosul dam collapsing and sending a 20-metre-high flash flood coursing down the river Tigris, putting more than a million people at risk.
The embassy on Monday issued a call for people to evacuate the Tigris flood plain, saying “proper preparation could save many lives”. The embassy had earlier described the threat of collapse as “serious and unprecedented”.
…
http://www.theguardian.com/world/2016/feb/29/iraq-us-issue-warnings-threat-of-mosul-dam-collapse
LikeLike
dtlange
/ March 1, 2016Iraq’s prime minister, Haider al-Abadi, issued a statement on Sunday night urging residents of Mosul, Iraq’s second biggest city, 25 miles south of the dam, to move at least 3.5 miles away from the river…
The cities of Tikrit, Samarra and Baghdad itself also lie in the path of a potential flood wave.
The dam, the largest in Iraq, has had structural problems since its construction in the 1980s. The Saddam Hussein regime pressed on with it in the face of warnings from geologists that it was being built on weak, water-soluble rock such as gypsum and anhydrite.
A report by a panel of Iraqi and Swedish geologists and engineers last year described it as “the most dangerous dam in the world”…
LikeLike
dtlange
/ March 1, 2016– PNW El Nino etc.Weather hitting PNW and avoiding So Cal
LikeLike
JPL
/ March 1, 2016You’re not kidding…
Seattle just slogged through it’s wettest winter (Dec – Feb) on record. When I was a kid it used to snow regularly here in the winter. Now snow days are a thing of the past.
http://komonews.com/weather/scotts-weather-blog/congratulations-seattle-youve-made-it-through-the-wettest-winter-on-record
John
LikeLike
Abel Adamski
/ March 1, 2016Watch the birds and the animals, they are more in tune with the earth
LikeLike
dtlange
/ March 1, 2016– So Cal Coast – Santa Barbara – El Nino – SLR – Locales I’ve shared.
– Science in video worth a look.
Special Report: Mapping El Nino Underway by UC Santa Barbara Researchers
Equipment on the beach measures sea level rise and coastal impacts during current winter surges
SANTA BARBARA COUNTY, Calif. –
Winter weather has not delivered violent storms to the Santa Barbara County coastline, but the impact of the waves has been more powerful than many expected. Researchers are emersed in the weather pattern using new technology to map the impacts and plan for the future.
UC Santa Barbara graduate student Paul Alessio with the Earth Sciences department is on the front line.
“This is the best place you could possibly be to measure coastal erosion,” said Alessio.
He has already seen areas where the sea level is up a foot, and some of the coastal spots the public may feel safe with but he says, the soils are failing.
http://www.keyt.com/news/special-report-mapping-el-nino-underway-by-uc-santa-barbara-researchers/38262558
LikeLike
dtlange
/ March 1, 2016Ps The waves indicated were likely generated by storms much farther north up the coast and out to sea.
LikeLike
dtlange
/ March 1, 2016LikeLike
Ryan in New England
/ March 1, 2016West Virginia votes against science curriculum because it will actually teach science, and every good Republican knows that science and facts are just a liberal scam.
http://thinkprogress.org/climate/2016/02/29/3754731/west-virginia-house-halts-science-standards-over-climate/
LikeLike
Kevin Jones
/ March 1, 2016NSIDC & Rutgers Snow Lab showing Northern Hemisphere snow cover near (or at?) record low for week 9 of year.
LikeLike
Leland Palmer
/ March 1, 2016Wow, if it was a glitch, it is darn convincing.
Over the next few days, Earthnullschool shows the CO signal gradually spreading, then dissipating. Totally bizarre. I haven’t had time to see if the wind patterns are realistic. NASA Worldview doesn’t seem to see anything similar, at first glance.
Could the spectrometers be confusing radon with carbon monoxide?
LikeLike
mlparrish
/ March 2, 2016I’m in agreement, Leland. That a glitch could look so convincing is downright scary. I watched the plume spread westward across the US and today a tail seemed to hit NC with CO readings of 354, which were 174 on 2/25. GMAO did state today, 3/1/16, that “GMAO is working to correct this problem”, so perhaps subtle sensitivity to usual wind patterns is still persisting. Must be a very delicate glitch, whatever it is. It has caused real havoc.
LikeLike
robertscribbler
/ March 2, 2016It was the intensity of the anomaly that made it suspect. That and we didn’t have any confirmation. Two clear warning signs. Single model or sensor hyper-focus can lead to erroneous conclusions.
LikeLike
Leland Palmer
/ March 2, 2016Hi Robert-
Earth nullschool does have a prediction capability, that allows it to project data into the future. Not only can you trace the plume up until now, you can also trace it several days into the future. 🙂
I wonder if the site has multiple problems – such that it will take a single image containing a high reading and convincingly predict the dissipation of those high readings into the future, then store that convincing simulation of the plume dissipating, and “like” the glitch better than the real readings?
It’s almost like the site displays the highest value for each pixel, whether it is a predicted value or a real value.
Dunno. I still like the site. But to really screw up requires a computer…
LikeLike
robertscribbler
/ March 2, 2016I haven’t used the gasses model on Nullschool very often. But the GFS wind and temperature overlays as well as wave prediction series have been both very accurate and useful in my research. It’s probably an issue that will be refined and improved over time. But I’d defend the model’s overall usefulness. We know a lot more about the climate and Earth System because of the fantastic work done putting this excellent tool together.
LikeLike
Leland Palmer
/ March 2, 2016I’ve used Earth Nullschool informally but frequently, and have used the carbon monoxide tool to look at forest fires quite a lot, especially the huge ones last summer over Siberia, Alaska, and the Pacific Northwest.. I noticed that the carbon monoxide tool can predict plumes into the future using it back then. I’ve never seen it predict something implausible before, though. The fires back then were quite evident on NASA Worldview, and nothing like those seems to be evident this time.
I love the Earth Nullschool site, don’t get me wrong. I do remember puzzling over the way the CO plumes dissipated back then, but I came to no conclusion about it.
If the high reading was a glitch, though, then there must be a error in the computer code generating this realistic plume dissipation behavior, I think So the developers of this really great site should take a look at that. The real data should take precedence when it is available over the projections. But due to cloud cover and satellite tracks that leave blank spaces, especially over the poles, the real data is not always available. So, I think somewhere in the code that massages the data into a single version of past, present, and future, a mistake was made, maybe.
Maybe the code averages the actual and predicted data, dunno.
Maybe the site developers cut off the data source after the glitch, and the dissipating plume is the result of the predicted data being the only data?
LikeLike
Leland Palmer
/ March 2, 2016Here’s what GMAO (NASA’s Global Modeling and Assimilation Office) is saying as of yesterday:
“Erroneous CO emissions over California cause unrealistic CO concentration in GEOS-5 model
March 1, 2016
IMPORTANT NOTICE: Elevated carbon monoxide (CO) concentrations over California in the GEOS-5 products since February 25, 2016, are incorrect. They are a consequence of unrealistic emissions derived from satellite observations of fires, which led to elevated concentrations of atmospheric CO (as well as other species).
NASA’s EOS-Terra spacecraft entered safe mode on February 18, 2016, during an inclination adjustment maneuver. This caused the MODIS instrument to enter safe mode, with the nadir and space-view doors closed. When the Terra MODIS transitioned back to science mode on February 24, 2016, the operating temperatures for the SWIR and LWIR (Short-wave Infrared and Longwave infrared) focal planes have not yet stabilized. As a consequence, some data products have been severely degraded. This includes the “Fire Radiative Power” fields that are used by GEOS-5 to compute emissions of CO, CO2, and carbonaceous aerosols by biomass burning.
GMAO is working to correct this problem. The GEOS-5 analyses will be re-run from February 24, 2016, using only the EOS-Aqua MODIS data, in order to exclude the unrealistic CO emissions. EOS-Terra observations will be re-introduced once the instrument has stabilized”
So, it looks like the errors were further upstream, from NASA. The realistic plume dissipation problem, persisting for several days when incorrect data is entered into the system, is something NASA will likely fix, I guess.
LikeLike
Greg
/ March 1, 2016Reached out to my brother who works at Goddard. He’s reached out formally to obtain the data team contacts on the Geo5. Will update when I hear back.
LikeLike
Greg
/ March 1, 2016I heard back from a NASA contact who gave me all the links to GEO-5 which isn’t a suite of sensors or a given satellite, but a model that incorporates data from various sensors. The carbon monoxide sensor would likely be feeding data from the MOPITT instrument on Terra for the GEO-5 modeling. Does this sound right as the source for the carbon monoxide data or did I go down the wrong road? If correct, I will proceed along that line to reach out to contacts for that satellite.
LikeLike
Greg
/ March 1, 2016While carbon monoxide (CO) is not itself a greenhouse gas, CO is chemically linked with methane, ozone, and carbon dioxide, and therefore impacts both climate and air quality. Primary sources of CO include fossil-fuel burning, biomass burning and methane oxidation. MOPITT measurements of CO concentrations in the troposphere are based on observations made with a suite of gas correlation radiometers operating in two CO-sensitive spectral bands. MOPITT CO products are used to study the movement of pollution in the atmosphere, to quantify CO emissions and to support air quality forecasts.
LikeLike
robertscribbler
/ March 1, 2016Thanks for this, Greg. Much appreciated. That sounds right to me.
LikeLike
Bryan
/ March 1, 2016I spent last night looking into this more carefully. The best I can tell, the apparent gas spikes are due to the Terra satellite malfunctioning last week. When it began recording data again on Feb 25, the operating temperature of the satellite’s instruments were still equilibrating. I’ve posted more details here:
http://oftechandlearning.com/bad-data-carbon-monoxide-eruption-not-real/
LikeLike
dtlange
/ March 1, 2016– Right:
– nullschool disclaimer: “GEOS-5 data (covering all Chem and Particulates layers) comes with the following disclaimer: Forecasts using the GEOS system are experimental and are produced for research purposes only. Use of these forecasts for purposes other than research is not recommended.”
LikeLike
dtlange
/ March 1, 2016LikeLike
Greg
/ March 1, 2016“It’s pure coincidence that at MOPITT resumed data collection over western North America while its operating temperature was still stabilizing. Had the instrument’s temperature remained unstable for a few days, it would have looked like the whole globe was erupting gas. If MOPITT has started collecting data over the south pole, open ocean, or some other obscure location, I doubt anyone would have noticed and made a big fuss.
MOPITT uses light collected in the infrared part of the spectrum. Based on Terra’s system status, the CO, CO2 and SO2 data collected by MOPITT on the 25th and 26th of February should be highly suspect.
On the Earth map, the CO, CO2, and SO2 levels spike sometime between 1pm and 4pm Pacific time on Feb. 25th, which is between 2100 UTC on the 25th and 0000 UTC on the 26th. This is precisely during the time window when MOPITT’s operating temperature is still unstable.”
LikeLike
robertscribbler
/ March 1, 2016Fantastic work, Greg!!
LikeLike
Bryan
/ March 1, 2016Brilliant. Thanks!
LikeLike
Greg
/ March 1, 2016Bryan, you got there first. For future reference NCAR in Colorado invaluable. They even posted telephone numbers and researchers picked up the phone on first call.
LikeLike
robertscribbler
/ March 1, 2016Thanks for this, Greg. Great job by you and Bryan both. Will definitely keep NCAR in mind in future cases. I’m sure we’ll get similar instances again.
LikeLike
Bryan
/ March 1, 2016Good to know, Greg. Thanks!
LikeLike
robertscribbler
/ March 1, 2016Well done on an excellent article, Bryan. Fanastic job. I’ve linked you and added in a hat tip.
LikeLike
Bryan
/ March 1, 2016Thanks Robert. Minor note, but the quote credited to Nullschool, is actually from my blog.
LikeLike
robertscribbler
/ March 1, 2016Fix in.
LikeLike
Kevin Jones
/ March 1, 2016Thank you ALL! Great detective work. You’ve got something rich going on here, Robert. Pursuit of truth is Always messy…..
LikeLike
robertscribbler
/ March 1, 2016This was actually kind of liberating and vindicating. More than anything, threat analysis is about dealing with uncertainty. So you have to be adaptive and open to changing the analysis based on new data. You can’t really be too attached to outcomes — being correct or incorrect. It’s also important to have a good filter. Which given the static on the internet can be a bit challenging.
LikeLike
dtlange
/ March 1, 2016Brett Walton @waltonwater 1h1 hour ago
February was hot — mean temperature was 3-10 degrees F above the 30-yr average for much of the American West
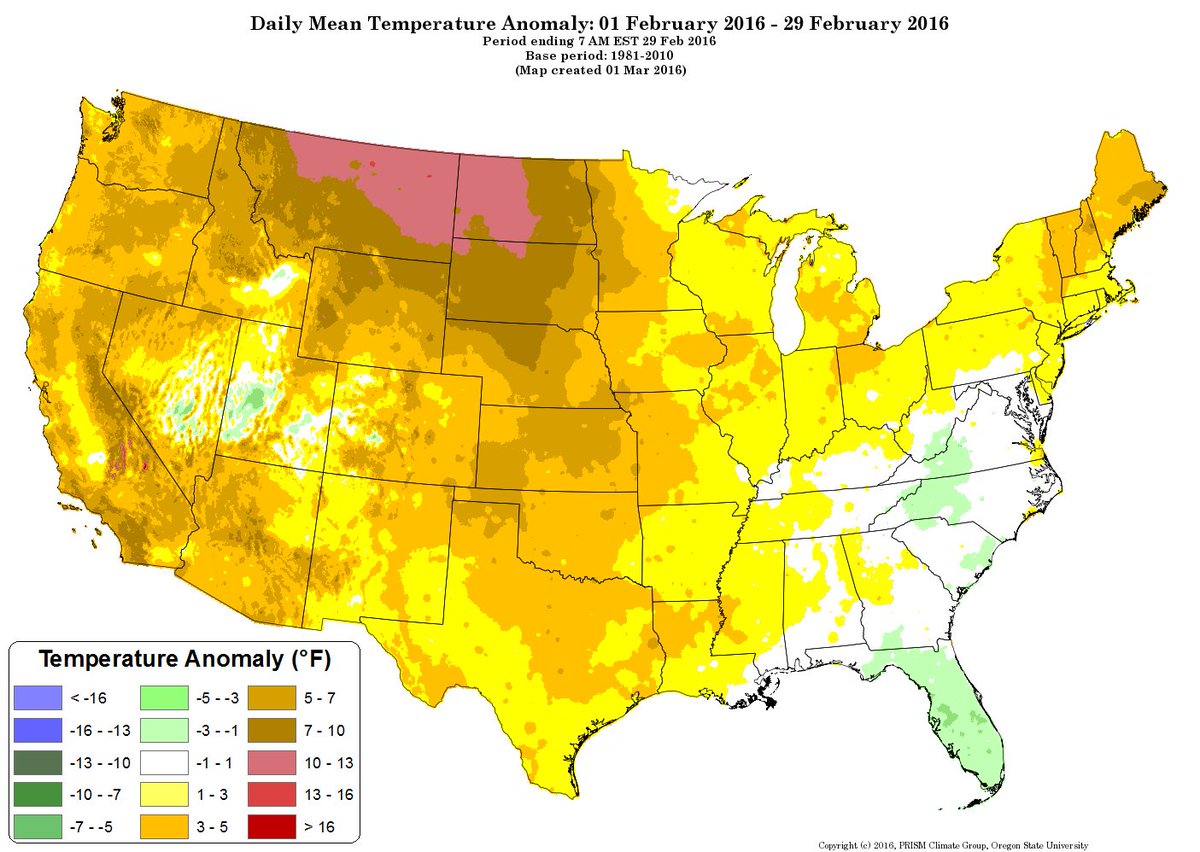
LikeLike
robertscribbler
/ March 1, 2016I don’t want to see any more links from PB. This most recent episode has confirmed to me that he is not an honest observer.
LikeLike
dtlange
/ March 1, 2016– Roger that.
OUT
LikeLike
12volt dan
/ March 1, 2016off topic but on our Canadian home front our new PM is trying to get a national carbon tax started.
http://www.cbc.ca/news/politics/first-ministers-climate-change-1.3469667
It looks like a uphill battle so far but at least some one is trying. Not like our previous PM
LikeLike
Marcel Guldemond (@marcel_g)
/ March 1, 2016True Dan, our previous PM made a deliberate smoke screen of pretending they were going to do something while at the same time as pushing pipelines as hard as possible, and letting fossil fuel companies write legislation. I’m still a bit skeptical about it until I see some concrete action from the Libs, but it looks like they are staking actual political capital on this, so it’s a complete 180 degree turn for us. Which I’m very glad to see.
LikeLike
robertscribbler
/ March 1, 2016I’d call this very good news.
LikeLike
Cate
/ March 1, 2016Fingers crossed here.
LikeLike
Greg
/ March 1, 2016Bill Nye keeping it real. 2016 is a turning point (vote well!):
“We have to address climate change deniers in the same way we build wind mills. We have to work all those problems at once:
After the ad:
http://www.techinsider.io/bill-nye-climate-change-deniers-2016-2#ooid=1rNDgzMTE6DyM7x_OLBbDQUY78-pXUgK
LikeLike
robertscribbler
/ March 1, 2016I’m reading his book — Unstoppable — now and finding it quite well done.
LikeLike
Colorado Bob
/ March 1, 2016The Scottish rainfall records are just nuts –
Scotland endures wettest winter on record after highest rainfall in more than a century
THIS winter has been the wettest on record in Scotland.
Met Office statistics show an average of 756mm of rain fell across the country during December, January and February – the highest on records stretching back to 1910.
The downpours brought severe flooding and led to hundreds of people being evacuated from their homes.
Argyllshire was the wettest area in Scotland, recording 1055.7mm of rain from December to February 24 – almost double the average of 697.5mm.
Kirkcudbrightshire also saw almost double the average rainfall, with 1025.6mm compared to 645.1mm.
Two of the last three years have brought record-breaking levels of winter rain, with this year beating the previous record set in 2013/14 of 744mm of rain.
Storms in December led to the national rainfall reaching 351.4mm, more than double the usual total for the month.
Read more at http://www.dailyrecord.co.uk/news/scottish-news/scotland-endures-wettest-winter-record-7471747#6zi3IfsdWTzrKOt3.99
LikeLike
Mblanc
/ March 1, 2016The rainfall trends in Scotland are particularly worrying. It’s my impression, from pretty much the centre of England in Leicester, that it is Scotland, the Republic of Ireland, Northern Ireland and the North of England really took the brunt of this winters deluge. Roughly,he further north and west you go, the wetter you got. Now that has always been the case in the UK, but that difference seems somewhat magnified, to me.
This means that the UK’s rainfall totals, as a whole, don’t fully communicate how bad it has been in the worst hit areas. So this Scottish perspective is more useful.
I’ve been aware that the trends in Scottish rainfall are not good, for a number of years. A good graph is this one.
http://www.environment.scotland.gov.uk/climate_trends_handbook/Chapter02/2_01.html
LikeLike
Kat
/ March 1, 2016I contacted Lucy Jones, USGS.GOV. “There’s no known correlation between gases and earthquakes. Also, I can’t find any independent corroboration of the gas reading. I see no reason to treat this as anything but nonsense.”
LikeLike
robertscribbler
/ March 1, 2016First, there’s a glitch in the sensor data. Second, the original science that these speculations were based on is unconfirmed. I’d definitely listen to USGS.
LikeLike
Wharf Rat
/ March 1, 2016OT…Make Donald Drumpf Again
LikeLike
dtlange
/ March 1, 2016– Climate Trends Canada
…
John Pomeroy, a Canada research chair in water resources at the University of Saskatchewan, points out the amount of water that falls as snow has already declined by 50% on the Prairies. The number of multi-day rains has increased by the same amount.
…
Milder winters allow mountain pine beetles to survive and infect forests in Alberta and Saskatchewan, killing trees and turning parched and overheated forests into tinder boxes.
Aspens, the most common leafy tree in the boreal forest, are dying at twice their historic norm, “part of a larger-scale pattern of climate-related dieback episodes,” says Natural Resources Canada.
By 2050, look for big parts of the boreal forest’s southern fringe to be brand-new prairie.
“Drought-prone spruce will be lost first, followed by pines and then aspen, to be replaced by some form of prairie grassland,” said a 2009 report from the Canadian Council of Forest Ministers.
Glaciers, an important source of water for western cities during low-snow years, are on their way out, said Mike Demuth of the Geological Survey of Canada.
http://www.fortmcmurraytoday.com/2016/02/29/droughts-floods-dying-forests-new-climate-extremes-for-canada-in-2050
LikeLike
dtlange
/ March 1, 2016NWS Alaska Region @NWSAlaska 3h3 hours ago
#Alaska Winter trend: Warmest Dec, Jan, Feb of record: Barrow, King Salmon. #AKwx #climate (1/3)

LikeLike
dtlange
/ March 1, 2016NWS Alaska Region @NWSAlaska 3h3 hours ago
2nd warmest Dec, Jan, Feb: #Anchorage, Kotzebue. 3rd warmest: Talkeetna. #AKwx #Alaska #winter #Climate (2/3)

LikeLike
dtlange
/ March 1, 2016NWS Alaska Region @NWSAlaska 3h3 hours ago
Driest Dec, Jan, Feb of record: #Fairbanks. 2nd driest #Anchorage #AKwx #Alaska #climate (3/3)

LikeLike
dtlange
/ March 1, 2016NASA Finds Drought in Eastern Mediterranean Worst of Past 900 Years
A new NASA study finds that the recent drought that began in 1998 in the eastern Mediterranean Levant region, which comprises Cyprus, Israel, Jordan, Lebanon, Palestine, Syria, and Turkey, is likely the worst drought of the past nine centuries
– For January 2012, brown shades show the decrease in water storage from the 2002-2015 average in the Mediterranean region. Units in centimeters. The data is from the Gravity Recovery and Climate Experiment, or GRACE, satellites, a joint mission of NASA and the German space agency.

Credits: NASA/ Goddard Scientific Visualization Studio
LikeLike
dtlange
/ March 1, 2016http://www.nasa.gov/feature/goddard/2016/nasa-finds-drought-in-eastern-mediterranean-worst-of-past-900-years
LikeLike
robertscribbler
/ March 1, 2016Ouch. Thanks for this, DT.
LikeLike
dtlange
/ March 2, 2016– Additional link w focus on Mediterranean:
– Earth Institute, Columbia University
Climate, Natural Disasters
Syria’s Drought Likely Its Most Severe in More than 900 Years
– A new study looks at recent droughts across the Mediterranean in the context of the past 900 years. The charts highlight dry years (brown) and wet years (blue) in three regions. The map, from the Old World Drought Atlas, shows the period from 1980 to 2012. From Cook, et al., 2016.

LikeLike
dtlange
/ March 2, 2016“We can now say with some degree of confidence that what we’re seeing in that part of the Mediterranean is likely separable from natural variability,” Cook said. “If climate change is having an impact and is making droughts worse, then we should see this in the record over several centuries—and we do.”
http://blogs.ei.columbia.edu/2016/03/01/syrias-drought-likely-its-most-severe-in-more-than-900-years/
LikeLike
Griffin
/ March 1, 2016Best blog on the Internet. Hands down and it is not even close. This was amazing to watch unfold.
LikeLike
robertscribbler
/ March 1, 2016I’m flat out exhausted.
LikeLike
Griffin
/ March 1, 2016You should be! I do have to say, thank you for writing this post. The data is out there for the viewing public, but the knowledge of what they are really looking at is not. This blog just went through the entire process of wondering, all the way to finding out. i found it all to be an incredible learning experience. After all, we have grown accustomed to looking at internet data as the window to our greater world. If there is an anomaly, it would be great to see the scientific community grow more accustomed to open discussion. Glitches happen. Not every radar return is a thunderstorm, sometimes simple ground clutter can look ominous. But we have great meteorologists that will openly let us know when these things happen and that it is just part of relying on modern technology. I understand that not every piece of information is something that should be seized upon for discussion. The ongoing super-discussions that surround every run of individual models in an ensemble can get rather ridiculous. But this was not a forecast. The Nullschool readings were observations and therefore carried a little more concern for the layperson. If the data is out there, collected by taxpayer funded satellites, then we should be able to see a little more discussion on the data that they provide. Especially given the population density that was affected by this glitch.
Thankfully, this blog, the readers and Roberts tireless efforts at updating the information, provided more knowledge and comfort than I could find anywhere else. Thank you all who contributed.
LikeLike
robertscribbler
/ March 1, 2016This makes me feel a lot better, Griff. I think the big problem was that an information vacuum surrounded this particular bit of data for a number of days. The usual suspects jumped into the gap and started making some pretty radical proclamations. I think it’s always better to start with a question when dealing with something that looks quite anomalous unless you’re pretty darn certain. Even then, proceed with caution. Those who come barging in with a fistful of proclamations are most often the ones likely to be incorrect. Although, in hindsight, I think I got wagged a bit by this. It’s annoying. I should have called NCAR from jump before getting pulled into the social media stream. I feel like I need to sharpen up a bit. But I suppose my engagement here has value in that I’ve, perhaps, helped generate a cathartic clearing of the mud for a few. At least I hope that’s the case.
LikeLike
Griffin
/ March 2, 2016Well, you said from the beginning that it may be a glitch and we needed more data. For myself, I made a note to follow along and see what more info came in. What was awesome was the amount and quality of the updates. Nobody is perfect, nothing in science ever is. What made this post so special for me was the constant refinement. I just thought it was great to see the whole thing unfold.
LikeLike
robertscribbler
/ March 2, 2016And that’s the beauty of the scientific process — constant refinement.
LikeLike
robertscribbler
/ March 2, 2016Hah. My usual trolls are telling me to give up. Pretty clear indication that I’m doing the right thing.
LikeLike
robertscribbler
/ March 2, 2016Not directed at you, Griffin. Just a general statement.
One thing I do want to say is that Paul Beckwith’s approach to this entire event was completely irresponsible. He didn’t act like a scientist at all. In fact, the process this blog underwent was far more scientific than the bull-headed nonsense he put out.
I have a huge list of what I am now calling spammers who continue to attempt to link his various belligerent claims and commentaries to this and other threads. I will not be supporting them in this forum. The troll push to get him visibility here is just one more indicator that he is probably not a helpful or honest agent.
I’ll take Michael Mann, Gavin Schmidt, James Hansen, Bill Nye, and Jennifer Francis over him any day. I am very sorry to have to call him out like this. But over the past few days his full court press on nonsense has been decidedly unhelpful and misinforming.
LikeLike
todaysguestis
/ March 1, 2016Have people seen this Snopes post?
Carbon Monox-Lies
A fear mongering article attempted to link an alleged “carbon monoxide spike” with an earthquake prediction.
http://www.snopes.com/carbon-monoxide-spike-earthquake/
LikeLike
robertscribbler
/ March 1, 2016Glad to see Snopes is on this. Not familiar with this source site, but good to keep in mind in the event of future shenanigans.
OT: I seem to recall you posting a study linking sea ice loss to Greenland melt acceleration, but I can’t seem to find it. Do you happen to recall the source?
LikeLike
climatehawk1 (@climatehawk1)
/ March 2, 2016I happen to have an item on this handy: http://journals.ametsoc.org/doi/abs/10.1175/JCLI-D-15-0391.1?af=R&utm_source=Daily+Carbon+Briefing&utm_campaign=1876b1bbd0-cb_daily&utm_medium=email&utm_term=0_876aab4fd7-1876b1bbd0-303452469
LikeLike
roxannesumners
/ March 2, 2016I can’t even imagine how exhausted you are! I’m just one person, 65, in So Cal, bought food, a tent, and I don’t even like camping any more – Ha ha. Thank you SO much for covering this! A great lesson for me, and many (maybe thousands) of us searching for truth but vulnerable to… More than we know. ANYWAY, Thank you for continuing to stay ON IT!!!!!! I owe you – flowers, vino, contribution? 💃🌴❤️🌴
LikeLike
robertscribbler
/ March 2, 2016Thank the scientists who honestly work to get the best information possible available to the public. Support NASA, NOAA, the USGS. That’s the best thanks, Roxanne.
LikeLike
Wharf Rat
/ March 2, 2016Climate Denial Crock of the Week
Even Denier’s Favorite Graph Showing Big Temp Spike
=
Spencer adds this:
In addition to the expected tropical warmth, scattered regional warmth outside the tropics led to a record warm value for extratropical Northern Hemispheric land areas, with a whopping +1.46 C anomaly in February…fully 0.5 deg. C above any previous monthly anomaly (!)
http://climatecrocks.com/2016/03/01/even-deniers-favorite-graph-showing-big-temp-spike/
LikeLike
robertscribbler
/ March 2, 2016I saw this. Good for Peter.
LikeLike
Griffin
/ March 2, 2016Good quick video from NASA.
LEAD: A new NASA visualization shows the 2015 El Niño unfolding in the Pacific Ocean. The sea surface temperatures presented different patterns than seen in the 1997-1998 El Niño.
1. This visualization shows how the 1997 event started from colder-than-average sea surface temperatures – but the 2015 event started with warmer-than-average temperatures.
2. The water temperature variations also occur below the surface. And these variations were also different in 2015, compared to 1997. The red in this vizualization indicates warmer than normal temperatres and the blue is cooler.
TAG: In the past, very strong El Niño events typically transition to neutral conditions and then a La Niña event. This current El Niño has been different so it will be interesting to see what happens in the next forecast and the coming months.
https://svs.gsfc.nasa.gov/cgi-bin/details.cgi?aid=12162
LikeLike
robertscribbler
/ March 2, 2016The manner in which this is progressing is a bit odd. We do still have the CFSv2 models showing a, somewhat moderate, mid Ocean El Nino by Fall. That would tend to worsen rates of global temperature increase for this decade. We’d be looking at near El Nino in 2014, El Nino in 2015, El Nino in 2016 and possible extension of El Nino into 2017.
IRI/CPC models show shift to La Nina. Which would be somewhat more favorable for a cooler decade. But given the big jump we just experienced, it’s kinda relative.
LikeLike
Mblanc
/ March 2, 2016Not sure about the source, but check this out.
‘Using unofficial data and adjusting for different base-line temperatures, it appears that February 2016 was likely somewhere between 1.15 and 1.4 degrees warmer than the long-term average, and about 0.2 degrees above last month—good enough for the most above-average month ever measured. (Since the globe had already warmed by about +0.45 degrees above pre-industrial levels during the 1981-2010 base-line meteorologists commonly use, that amount has been added to the data released today.)’
http://www.slate.com/blogs/future_tense/2016/03/01/february_2016_s_shocking_global_warming_temperature_record.html?
LikeLike
Mblanc
/ March 2, 2016Correction, source looks pretty solid to me.
LikeLike
robertscribbler
/ March 2, 2016The end of February was certainly very warm. The month appears at least to be in the running with December and January — which were pretty extreme.
LikeLike
Ryan in New England
/ March 2, 2016Christopher Burt has a great analysis of the current state of California’s drought, and a good breakdown of past El Nino years versus this one. It looks like it wasn’t the drought-buster everyone had hoped for. The bulk of west coast storms were diverted north to Washington and Oregon, leaving central California in severe drought. Seattle set precipitation records, while further south it was a different story.
http://www.wunderground.com/blog/weatherhistorian/california-drought-update-march-1st
LikeLike
robertscribbler
/ March 2, 2016Well done by Dr. Burt.
LikeLike
Colorado Bob
/ March 2, 2016Climate change institute shut down
Finnegan Schick Mar 01, 2016
After a University decision to cut all its funding, Yale’s Climate & Energy Institute will close by the end of June.
http://yaledailynews.com/blog/2016/03/01/climate-change-institute-shut-down/
LikeLike
robertscribbler
/ March 2, 2016Wow. I’d call this a pretty bad move. Big leap backward for the University.
LikeLike
Abel Adamski
/ March 2, 2016What concerns me if that is thecase is that Peter Sinclair doesmuch of his work in conjunction with that organisation. He hasdonesome pretty effective videos recently that have been rather expose’s on the Political chicanery i relation to Climate Research. IMO Smacks of Political and or ideological mtyivation
LikeLike
Abel Adamski
/ March 2, 2016Sorry about the poor typing, getting used to a new fangled tablet and thee print is so small for my ageing eyes
LikeLike
dtlange
/ March 2, 2016– I liken this CO episode to a surprise FIRE DRILL or response test. Strengths and weaknesses were give quite a workout. Much was learned by me.
A great effort by all – especially Robert.
Thanks.
LikeLike
robertscribbler
/ March 2, 2016Excellent analogy, DT. Complete systems check, including lessons learned. You guys were fantastic information gathering support. A few new faces as well.
LikeLike
Leland Palmer
/ March 3, 2016So, the dissipating carbon monoxide plume from the “event” abruptly disappeared at 1600 local time on 2016-03-02 from Earth Nullschool, and reasonable values appear to be restored, for current and future projections.
The huge plume is still there for the past, though. Will NASA go back and retroactively correct those images? I think they should, myself. Have they done so already, but this is not being displayed by Earth Nullschool (yet?)?
I wonder if the dissipating plume was the result of the data from EOS Terra being abruptly cut off, so that the data in error was not subsequently overridden by new real data? Maybe it would have been better just to let the system run, so that new real values could replace the predicted values?
LikeLike