
“Facts are stubborn things; and whatever may be our wishes, our inclinations, or the dictates of our passions, they cannot alter the state of facts and evidence.” — John Adams
*****
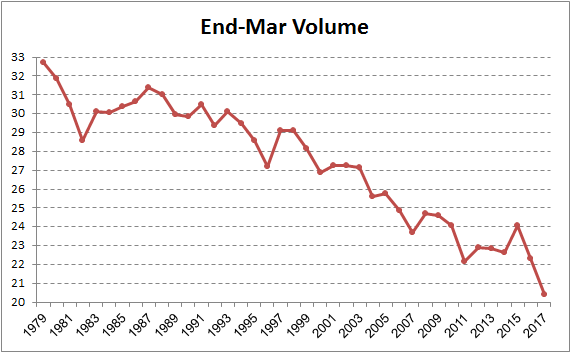
(March sea ice volume hit a new record low in the PIOMAS measure during 2017. Image source: Oren and the Arctic Sea Ice Blog.)
This week, measurements from PIOMAS indicate that Arctic sea ice volume for the month of March hit new, all-time record lows during 2017. March 2017 volume, according to the Polar Science Center, dropped about 1,800 cubic kilometers from the previous record low set during the same month in 2011. In total, more than a third of March sea ice volume has been lost since 1979.
The Polar Science Center notes:
Arctic sea ice volume through March 2017 continued substantially below prior years. March 2017 sea ice volume was 19,600 km3 , 1800 km3 below the previous record from March in 2011. This record is in part the result of anomalously high temperatures throughout the Arctic for November through January discussed here and here [and here]. February volume was 39% below the maximum March ice volume in 1979, 27% below the 1979-2016 mean, and more than 1.7 standard deviations below the long term trend line.
This increasingly thin ice cover should continue to grow a little more to reach a seasonal peak during the first or second week of April. And as you can see when looking at the graph below, the trend line following that peak does not paint a very optimistic picture for sea ice resiliency during the 2017 melt season.

(The rate of sea ice refreeze this year has been very slow. As a result, the trend line points toward the potential for a melt season that exceeds even the record low year of 2012. Image source: PIOMAS.)
Merely transposing the present gap between March 2017 and the last record low to the end of melt season in September would about split the difference between 2012’s record melt and a completely ice-free Arctic Ocean — leaving about 1,700 km3 sea ice remaining by September of 2017.
A more detailed meta-analysis of this rather ominous-looking trend line finds that after hitting a peak of around 20745 km3 of sea ice sometime this month, an average of 18270 km3 of this ice will tend to melt out during the spring and summer so long as the past 10 melt seasons are a reliable predictor of future results. If this happens, sea ice volume will hit a new record low of around 2,530 km3 by September — which would be about 1/3 smaller than the amount of ice remaining in the Arctic Ocean following the tremendous 2012 melt season. And a very strong melt season — similar to conditions seen in 2010 — could reduce the ice to less than 1,000 km3 which is well into the range of a near-ice-free state.

(The Arctic has never been so warm in winter as the number of freezing degree days hit a new record low during 2016-2017. For context, the less freezing degree days the Arctic Ocean sees, the closer it is to melting. Image source: Cryosphere Computing.)
Of course, April through June could see cooler conditions — which would tend to preserve more ice and tamp down the ultimate rate of loss. But the present record low sea ice volume and near record low extent sets up a situation where darker seas will absorb more sunlight and stack the odds in favor of warmer than typical conditions and higher overall rates of melt. Meanwhile, presently strong sea ice export through the Nares and Fram Straits appears to be continuing a trend of relative sea ice volume loss through early April.
(UPDATED)
Links:
Pair of Arctic Storms Sparked Severe Polar Warming, Sea Ice Melt For November of 2016
Hat tip to Ryan in New England
Hat tip to Cate
Hat tip to Yvan


climatehawk1
/ April 6, 2017Tweet scheduled.
LikeLike
Erik Frederiksen
/ April 6, 2017From PNAS in 2013. http://www.pnas.org/content/111/9/3322.abstract “Using satellite measurements, this analysis directly quantifies how much the Arctic as viewed from space has darkened in response to the recent sea ice retreat. We find that this decline has caused 6.4 ± 0.9 W/m2 of radiative heating since 1979, considerably larger than expectations from models and recent less direct estimates. Averaged globally, this albedo change is equivalent to 25% of the direct forcing from CO2 during the past 30 y.”
The reduction in snow cover in the North adds a similar warming as the sea ice melt.
The amplifying feedback of ice and melt, already quite large according to the above, will increase significantly as Arctic summer ice largely disappears by mid-century or earlier.
Ice melt and release of CO2 and methane by warming oceans and melting permafrost were amplifying feedbacks which caused ancient climate oscillations to be huge, despite the very weak orbital forcings operating on time scales of tens to hundreds of thousands of years.
And now we have a strong and rapid forcing and ice melting all over the planet and methane beginning to escape the permafrost.
LikeLike
Steven Blaisdell
/ April 8, 2017“…as Arctic summer ice largely disappears by mid-century or earlier. ”
Much earlier. Using the PIOMAS mean volume ice loss trend, summer ice is zero by 2034-2035. Using the one standard deviation below mean trend, it’s gone by 2029. Using the two SD below mean trend, it’s gone by 2024. I’m not sure there’s any reason to think we aren’t seeing a negative departure from the 1979-2016 trend, given all the positive feedbacks that are coming on line, with prejudice. So maybe sometime between 2024-2029 we have open ocean in the Arctic in September. The world becomes a different place when this happens.
LikeLike
Yvan Dutil
/ April 7, 2017Strictly speaking. 2500 km3 is about what Maslovski called a pratically ice free Arctic (80% less ice than the average)
LikeLike
robertscribbler
/ April 7, 2017Thanks, Yvan. There’s definitely a lot of conjecture RE near ice free states. But the point about Maslovski is helpful so I’ll edit accordingly.
LikeLike
climateplace
/ April 7, 2017A good visualization of the Arctic’s march to zero volume is here:

LikeLike
robertscribbler
/ April 7, 2017It’s a good one. I’ll try to post it once it’s updated to include the present year.
LikeLike
Dave Person
/ April 7, 2017Hi,
Robert, that quote about facts was spoken by John Adams, not Sam Adams and it was spoken at the trial of Capt Preston and his men accused of murder of Boston civilians, what we call the Boston Massacre. It was no massacre but was a publicity gold mine for Sam Adams and the Sons of Liberty. John Adams defended the British soldiers and won the case by introducing reliable testimony and facts.
dave
LikeLike
Andy_in_SD
/ April 7, 2017I see no problem with this though….
LikeLike
robertscribbler
/ April 7, 2017Something to keep an eye on — large warm up predicted for Greenland in the 15 day time-frame. 20 C + above average anomalies in some locations. If this is the start of a summer trend = one of those not-good things.
LikeLike
Sheri
/ April 7, 2017Thanksfor the history, Dave. I have always wondered how much of history I have read is a process of propaganda opportunities used at the time and buried facts. I wonder that about modern events as well….
LikeLike
Dave Person
/ April 7, 2017Hi Sheri,
Sam Adams was a mediocre brewer but he had a gift for propaganda. Revere, Adams, and Warren first called the shooting a “massacre”. Then they put newspapers publishing their account of the event on a fast ship to England so that the first news reaching the “mother” country was their account. They beat the official report by 3 weeks and had their version of events spread far and wide in England. They were good at the game.
dave
LikeLike
Bill Everett
/ April 8, 2017Sheri, I recently read a novel that you might find interesting: “Gate in the Fence of Time” by David Berry. “The Sinclair family slips back in time to Williamsburg Virginia in 1775. Seeking a way home, they are surprised to discover the real history of the American Revolution is not what we learn in school.” https://s2.netgalley.com/catalog/book/105105
LikeLike
robertscribbler
/ April 8, 2017Goodreads reviews here: https://www.goodreads.com/book/show/27967147-gate-in-the-fence-of-time
LikeLike
robertscribbler
/ April 7, 2017There is also a rather factually correct miniseries on John Adams that covers some of the activity by Samuel: https://en.wikipedia.org/wiki/John_Adams_(miniseries).
LikeLike
Exposing the Big Game
/ April 7, 2017Reblogged this on Exposing the Big Game.
LikeLike
wharf rat
/ April 7, 2017Colorado Bob:
I saw your post on the previous thread about Calif rains. It started raining again last night.
Rat
LikeLike
coloradobob
/ April 7, 2017the edge of the world
LikeLike
wharf rat
/ April 7, 2017Book review
The Shock of the Anthropocene review – a crisis centuries in the making
Scientific historians Christophe Bonneuil and Jean-Baptiste Fressoz show how our society has been ecologically dangerous for far longer than you might think
https://www.theguardian.com/books/2017/apr/05/the-shock-of-the-anthropocene-review
“The authors introduce new terms for our era: the Thermocene (for its rising CO2), the Thanatocene (for the effects of war), the Phagocene (consumption), the Agnotocene (closing one’s ears and eyes to the evidence)”
Rat suggests the We’refuckedocene.
LikeLike
Dave Person
/ April 7, 2017Hi CB,
I suspect that is what many Republicans believe when they see a ship go over the horizon and disappear.
dave
LikeLike
lesliegraham1
/ April 8, 2017Some of them are smart enough to figure it must be the top of a hill.
LikeLike
coloradobob
/ April 7, 2017Yep. another one is coming in . You will need every drop . What gift in a time of theft.
LikeLike
wharf rat
/ April 7, 2017Bay Area storm causes mudslides, power outages to more than 100,000
The National Weather Service recorded some staggering wind gusts in the region
A winterlike storm that brought heavy rains and wind gusts up to 83 mph to the Bay Area caused damage throughout the region, including a mudslide in Oakland that forced a handful of evacuations and several reports of downed trees and power lines, resulting in power outages for least 100,000 homes and businesses.
LikeLike
coloradobob
/ April 7, 2017To everyone I ever hurt , offended , or snubbed. here.
I am a fool . Like all of us.
LikeLike
coloradobob
/ April 7, 2017“To everyone I ever hurt , offended , or snubbed. here.”
This is the hardest thing we will ever do. And it all begins now.
LikeLike
coloradobob
/ April 7, 2017The great thing is my liver explodes, and you carry the loads.
LikeLike
coloradobob
/ April 7, 2017wharf rat
The ice cores record the Romans refining lead in Spain.
LikeLike
coloradobob
/ April 7, 2017What world, what a time. what a place. What a bankrupt time of grace.
LikeLike
coloradobob
/ April 7, 2017We all swim in the tears of the Earth. we are all too blind to see this is not the sea.
LikeLike
godfrey
/ April 7, 2017This is not an easy read.
Lester Brown in a lecture said that we were vulnerable to a crop failure such as happened in Russia in 2010 and that if that happened in USA the effect would be very hard to manage since USA produces much more than Russia. Does anyone have a view on this?
Is it true that the USA Naval research predict an ice free arctic in September 2016 +/- 3 years?
thank you
LikeLike
Mark in OZ
/ April 7, 2017Hi godfrey
Lot’s of info on this–here’s one news feed. I find myself more and more studying the older news reports on contemporary topics to gauge the ‘likelihood’ and ‘accuracy’ of the predictions. Many are like watching a dart board bullseye throw in reverse:board, air, hand. Unsurprisingly, those predictions ( if ventured) are usually based on painstaking and careful study of data, trend and inputs and usually reflect the beauty and incremental learning that the scientific method brings. Many have been taught that these details and precise evaluations are unimportant.
In today’s ‘screen’ world, events, discoveries and learning arrive like a vintage slide show-one after another- and hence, important continuity is easily lost. We exist in continuity and become confused without it.
We’ve also been overwhelmed by ‘market’ (business) people whose fact sets are entirely influenced by ‘market forces’ which of course IS an explanation, but no matter how hard the MBA’s and economists try, nobody (not even the CRAY 1 super computers) has any clue what the market is going to do. It’s a magnificent level of chaos but without this shroud, great profits and market share and dominance could not be attained.
I’m in my 6 decade now and lament the rise and rise of the loose talking, hoodwinking, truth-bending types who found such a welcoming reception in the ‘business’ world. Their willing ignorance and acceptance of imprecision annoyed me years ago as it does now and I wonder how they ever came to lord over our planet; ‘their very soul ( currency, profit, dividends)has no equivalent in nature and they have demonstrated beyond all doubt that they are devoid of any supervisory or leadership capability with respect to managing and protecting our natural systems.
I have no problem with commerce, but a big part of the reason we are discussing the ‘arctic’ and its demise, is that the ‘business’ types naturally found a way to dance around the now irrefutable facts that appeared years ago about what would likely happen and eventually did. Hopefully, the citizens of the ‘ship’ can soon agree that a new ‘management team’ must be installed as the current ‘managers’ have made a whopping mess and yes, we will hold them accountable. All Earth based systems have consequences from inputs. Pretending they don’t has gone on way too long and is just more dance.
https://www.theguardian.com/environment/earth-insight/2013/dec/09/us-navy-arctic-sea-ice-2016-melt
PS Imagine ‘Isaac Newton’ as a used car salesman on commission only.
LikeLike
robertscribbler
/ April 7, 2017Thanks for this discussion, Mark. All too important for the present day. Commerce and trade may well be the engine for economic and political systems — but it tends to make a very bad steering wheel as we saw in the gilded age and are seeing again now.
LikeLike
mlparrish
/ April 7, 2017I am not sure, but I have begun to wonder whether the US is in some kind of early food stress in spite of what I read are good or even high global stocks. Not from anything I see in the press, but from noticing that in the last couple of years food on the shelves here in a flourishing city is getting older and older. For example, flour with an expiration date of 1 1/2 years or more hence, having to throw away more and more old grains. Too old food will kill you, being a matter of time. Of course, there could be many other reasons, but the trend is not good no matter what.
LikeLike
Abel Adamski
/ April 7, 2017mlp
https://theconversation.com/farmers-can-profit-economically-and-politically-by-addressing-climate-change-73585
Hidden in there
The election of President Trump and Republican majorities in both houses of Congress eliminates the regulatory “bogeyman” that many farmers organized to reject in 2009. In our opposition, farmers rejected an opportunity to be paid for providing environmental services. Forgoing new sources of income might have made economic sense during the historic commodity boom between 2009 and 2013, but it no longer does.
Recently the farm economy has soured. After several years of historic profitability, 2017 looks to be the fourth straight year of declining income. American farmers face forecasts of stagnant to declining revenues.
No mention of the reasons, we can only surmise weather has been a factor
LikeLike
mlparrish
/ April 8, 2017Abel,
Thanks for the reference. “Declining income” is a pretty bland statement given the drop off a cliff in net farm income beginning about 2012. From 120B to 60B. I am not a farmer so I do not know how they can handle swings of that magnitude, not to mention forecasts of same. To crib from Hercule Poirot, mon estomac dearly hopes that line on the graph does not continue down.
LikeLike
robertscribbler
/ April 7, 2017For the first question — I hate to say that it’s not predictable. At least not in the sense that you can say how soon an event like that which struck Russia will occur in the U.S. There are, of course, factors of geography to consider — a large portion of Russian cropland sits on old peat bogs from thawed permafrost. This creates the productive soil but it also produces a land form that is vulnerable to burning when it thaws too much — which can amplify the effects of a long-term heatwave. So the potential for an extreme event producing an outlier effect is a bit greater in Russia.
That said, the U.S. breadbasket sits on a region that relies on a certain range of temperatures to remain productive. At the present 1.2 C warming there is the potential to see single events that collapse significant portions of that production (10-20 percent or more) during single or multiple years. La Nina (primarily strong La Nina periods) increase the risk of this kind of event (according to the general science on the matter) by moving the tendency for ridging in the Jet Stream toward the Central U.S.
We can probably say that we’re likely to experience a considerable disruption to U.S. agriculture in the Plains States due to warming about once in the next 10 years and perhaps as much as twice. Such events would probably be comparable to the 1988 and 2012 droughts — which notably occurred 24 years apart. Now, with warming over the next 10 years likely to produce 1.35 to 1.4 C global temperatures, the incidence of such events will tend to increase and the potential for a worse event than 2012 is now a considerable possibility on a 1-20 year time horizon.
But what we cannot accurately predict is how resilient present day farming methods, back-stocks, and related water security will be in such a situation. The Central U.S. drought during 2012 — which sporadically halted Mississippi River traffic — gives us a decent corollary for consideration. The drought was preceded by extremely severe rains and produced a notable disruption to U.S. agriculture. A large swath of the Central U.S. experienced more than 20 days of above 100 F temperatures during this time — creating a very rapid drying of soil and rivers.
Click to access CentralUSDroughtAssessment2012.pdf
The disruption to crops during this event was considerable — with about 200,000 acres failed or in which planting was prevented due to the heat and lack of water in Colorado alone.
The risk is that you will eventually get into a situation where you have bad years followed by worse years in the next two decade time horizon and that eventually, large subsets of the region become non-productive as it simply becomes to hot to grow traditional crops outdoors and as water stress worsens. The 2012 event is also a corollary in that we can tend to expect most of the moisture to come down in shorter, more intense bursts — so you get disruptions to agriculture on both sides of the hydrological scale as the tendency moves more toward flood then drought, drought, then flood. Recent events in California are a good example. But this tendency is now quite widespread.
LikeLike
robertscribbler
/ April 7, 2017For the second question — yes. A U.S. Navy model did predict an ice free Arctic in the 2013 to 2019 timeframe. My personal opinion is that a bad summer this year could do it if the weather stacked up in all the wrong ways. More likely is that we’ll see an ice free or near ice free year by or before 2022 and almost certainly before the early 2030s.
At around 1.5 to 2.5 C, the glaciers start to become more involved and you get ice berg and fresh water lens cooling of the ocean surface near the release points and in regions where ocean circulation is disrupted. This may produce a bit of a bounce-back for sea ice as sea level rise rates start to ramp up. So we’ll need to watch for that as well. When/if such events occur we should be very clear that this is due to heat exchange in a warming and destabilizing climate system — not due to cooling (which is what the deniers would argue).
LikeLike
Roger Boyd
/ April 7, 2017I do wonder about the balance between increased arctic albedo (if the increase in summer clouds assumed by the models continues not to happen) and the fresh water lens from the melting Greenland. Could make for a very violent North Atlantic/Greenland Coast/Arctic Ocean interface.
LikeLike
robertscribbler
/ April 7, 2017That’s a serious concern, Roger.
LikeLike
Suzanne
/ April 7, 2017Understanding Climate Change on Youtube…A lecture in March with Noam Chomsky…
“Racing To The Precipice”
LikeLike
todaysguestis
/ April 7, 2017Climate change is literally turning the Arctic ocean inside out
“This whole thing about the ocean’s role in sea ice retreat, it used to be minimal, but as sea ice retreats it’s one of those positive feedback mechanisms,” Carmack said. “And we’re talking a lot of heat in the Atlantic layer, it could melt all the ice in the Arctic if it were to pop up to the surface.”
https://www.washingtonpost.com/news/energy-environment/wp/2017/04/06/scientists-say-the-unique-arctic-ocean-is-being-transformed-before-our-eyes/
LikeLike
Cate
/ April 7, 2017Same story, different source, on the “Atlantification” of the Arctic.
http://www.sciencemag.org/news/2017/04/warm-atlantic-waters-wage-new-assault-arctic-ice-below
LikeLike
Jean Mcmahon
/ April 7, 2017Yikes
LikeLike
unnaturalfx
/ April 7, 2017The speed of the changes are eye popping . Even to us that have followed this for a long time . Just WOW !
LikeLike
robertscribbler
/ April 7, 2017During the 2012 melt event, there were a lot of people in the Arctic sea ice community who were mocking those of us who were concerned about warm water upwelling and its effect on sea ice. During the present melt event, the mocking has grown silent as the movement of this warm water layer and its effects on sea ice have become more evident.
LikeLike
unnaturalfx
/ April 7, 2017Other effects on nature, snow loss : http://www.bioone.org/doi/abs/10.1656/045.024.s707
Snowpack produces a thermal layer that protects soil from freezing and provides a pulse of nutrient-rich water in spring. Climate forecasts for Maine indicate 20–60% reduction in snowfall by 2050. In January 2015, we initiated a snow-removal experiment in Old Town, ME to investigate the impact of snow loss on forest soil conditions. Snow removal significantly lowered winter organic horizon temperatures by 2 °C on average. Soils in snow-removal plots were 25% wetter during the vernal transition because precipitation was not intercepted by snow. These rain-on-soil events caused the formation of concrete frost, delaying soil thaw in snow-removal plots. Our results provide evidence that snowpack loss increases soil frost and can also increase soil moisture, potentially altering biotic function within a coniferous forest type. Many interesting effects of altering our biosphere .
LikeLike
Andy Lee Robinson
/ April 7, 2017The difference between then and now is staggering – September is going to be interesting…
LikeLike
robertscribbler
/ April 7, 2017Staggering indeed. Thanks for posting, Andy.
LikeLiked by 1 person
climatehawk1 (@climatehawk1)
/ April 8, 2017Thanks, just RTd that one.
LikeLiked by 1 person
Andy Lee Robinson
/ April 8, 2017Thanks, just noticed my notifications light up as a new pulse of people are retweeting it. Glad to see the number of your followers has increased substantially over the last couple of years!
LikeLike
climatehawk1 (@climatehawk1)
/ April 8, 2017🙂 Thanks, have been working relentlessly on that.
LikeLike
June
/ April 7, 2017These indigenous communities always suffer while the well off politicians ignore them and hand over money to corporations and billionaires. The conditions in some of these small villages are horrible, e.g. raw sewage in the rivers where they keep their boats, and drinking water supplies threatened.
Climate change hits Alaska’s rural water and sewer systems
http://www.alaskapublic.org/2017/04/06/climate-change-hits-alaskas-rural-water-and-sewer-systems/
LikeLike
robertscribbler
/ April 7, 2017From start to finish, the story of climate change is inextricably meshed with the story of systemic harm caused by inequality. If wealthy fossil fuel corporations hadn’t tried to delay responses to climate change for so long, hadn’t attacked the renewable energy transition for so long, then climate change would not be as far along or as intense as it is today. And because we are so far along, the poor are the first to suffer. It is denial on top of denial — a kind of blind denial of the plight of the poor and, lately, the public, and denial of the problem of warming itself. The self delusion is as shocking in its complete and utter fixation among a certain class as it is an immoral atrocity. A civilization cannot function when inequality rises to such extremes. You swiftly end up in a state of tyranny and rebellion.
LikeLike
Cam
/ April 7, 2017DMI has it the same as last year. Who is more accurate?
LikeLike
robertscribbler
/ April 7, 2017Considering the fact that the Arctic has been considerably warmer, overall, than last year, I’d say PIOMAS. PIOMAS has a pretty good track record so far. But we should be clear that both of these are model assessments. DMI isn’t looking great in any case, as it’s showing near record lows in volume as well. So not a very pretty cherry.
LikeLike
Whachamacallit
/ April 7, 2017Hey Mr. Scribbler, could you explain how the Freezing Degree Days chart is supposed to be interpreted? While I intuitively know that there are more days above freezing, I’m not really sure what the y-axis really represents. The fact it has the Celsius symbol is honestly making me think that the Arctic reaches above 3,500 C over the spring, which of course it totally ridiculous.
LikeLike
robertscribbler
/ April 7, 2017What you’re seeing is the magnitude of freezing degree days in the chart. The measure is a function of how far below 0 C temperatures go on a given day then accumulated over the freezing period from September through May-June.
“Freezing degree-days (FDD) or thawing degree-days (TDD) are defined as departures of air temperature from 0oC. When temperatures fall below 0oC, it gives a positive value, whereas it becomes negative when temperatures rise above 0oC. This index is a measure of both duration and magnitude of below-freezing (or above-thawing) temperatures during a specified period. Therefore, the cumulative values of FDD or TDD for a given winter season or summer tell how cold or warm it has been for how long. As such, both FDD and TDD have been used to describe weather patterns and climate warming or cooling over time, as well as a proxy for the state of melting or freezing of arctic sea ice.”
In other words, a Freezing Degree Day measure with a value of zero shows an average of temperatures at the melt point over the period measured and if after 100 days, you get 3500 freezing degree days, then the average daily temperatures during that 100 day period were -35 C.
The freezing degree day measure is a good proxy for the health of sea ice because it captures the average cold season temperature for the entire Arctic — much of which includes the Arctic Ocean.
LikeLike
unnaturalfx
/ April 7, 2017A little off topic but worth an update : NOAA Coral Reef Watch’s (CRW) daily 5-km satellite coral bleaching heat stress monitoring products and Four-Month Coral Bleaching Outlook indicate that in the central equatorial Pacific, bleaching heat stress continues to build. The Austral Islands are now at Alert Level 2 bleaching stress (associated with widespread coral bleaching and significant mortality), and the Southern Cook Islands are at Alert Level 1 (associated with significant coral bleaching) – with an expected escalation to Alert Level 2 stress in the next 1-4 weeks. Alert Level 2 conditions are also expected in the Northern Cook Islands, the Samoas, Wallis & Futuna, Northern Tonga, Southern Tonga, the Tuamotu Archipelago, the Society Archipelago, the Pitcairne Islands, and Easter Island, Chile in the next 1-4 weeks. Alert Level 1 bleaching stress is anticipated in the Southern Line Islands, Tuvalu, and the Marquesas Islands in the next 5-8 weeks. https://coralreefwatch.noaa.gov/satellite/analyses_guidance/global_coral_bleaching_2014-17_status.php … The outlook doesn’t look good for several areas .
LikeLike
robertscribbler
/ April 7, 2017Thanks for the update, FX.
LikeLike
unnaturalfx
/ April 7, 2017For me, personally ,this is one of the toughest aspects to watch unfold . Such a vast array of life is affected. Just brutal .
LikeLike
robertscribbler
/ April 7, 2017Life adapts and evolves to survive in a certain range of climate thresholds. Change that, and you’re basically pushing many of these creatures out of the airlock. Some of the more versatile and mobile and hardy can survive these kinds of insults until they get more extreme. But many others cannot. And the corals are among the most sensitive.
LikeLike
Steven Blaisdell
/ April 8, 2017We have entered an era of much simpler and much less varied life forms. What we don’t exterminate with our hands we will exterminate, are exterminating through climate change, population pressure, environmental toxins, habitat destruction…. humans have been catastrophic for non-human species for at least 100,000 years, ever since we evolved modern brains. E.O. Wilson got it right; I just hope we can collectively see the wisdom of and implement his plan before it’s just us, roaches, and jellyfish.
LikeLike
robertscribbler
/ April 8, 2017Half of Earth for wilderness will certainly help. But it won’t matter a bit if we don’t stop burning fossil fuels and transition to renewables.
LikeLike
Christina MacPherson
/ April 7, 2017Reblogged this on nuclear-news.
LikeLike
Abel Adamski
/ April 7, 2017An excellent article about a promising project
https://dailyplanet.climate-kic.org/100-ways-reverse-global-warming/
100 ways to reverse global warming
Beginning the project, the team had their own assumptions about what the top solutions would be.
“They turned out to be completely wrong.” McCaffrey says.
“Everybody assumed maybe that concentrated solar power would be very powerful as a way of generating electricity. It turns out it is important, but the number one way to generate electricity is wind — land based wind.”
“Some of the top ones are actually things like girl’s education and family planning, reducing food waste, and moving to a vegetarian diet. Many of the solutions also relate to forestry practices and agricultural practice, so they’re not just looking at reduction of greenhouse gases, they’re also looking at ways to sequester carbon through agricultural practices, storing the carbon in soil and in tropical trees,” says McCaffrey.
The solutions are largely “no regrets” solutions, entailing actions that make sense to take regardless of their climate impact since they have intrinsic benefits to communities and economies. The initiatives improve lives, create jobs, restore the environment, enhance security, generate resilience, and advance human health.
“A lot of us have been historically focused on entrepreneurial projects that are more technology focused on the breakthrough energy technology. In some ways this is much less techno-utopian approach as it is about going back to the basics.”
Drawdown is the point at which natural processes can start to kick in and absorb the carbon in the atmosphere and sequester them naturally.
“We can do that before 2050, probably 2040-something” says McCaffrey, but “it’ll take an all of the above approach. I was excited to see that it really is possible for us to turn the corner and be able to prevent the worst case scenario. And not only that, actually getting to the point where we would be well within the theme of the Paris Agreement, keeping well below two degrees celsius.”
“To me this is very empowering to individuals. It doesn’t depend on fifth generation nuclear power to save the day, it depends on us all getting involved and contributing as appropriate in our daily lives”
“We all have the ability to contribute to and control the situation, it’s not just in the hands of the experts.”
LikeLike
wharf rat
/ April 7, 2017Did You Join The Women’s March? You Just Won An Awesome Award.
The march just won a “Freedom of Expression Courage” award.
http://www.huffingtonpost.com/entry/did-you-join-the-womens-march-you-just-won-an-awesome-award_us_58e64f54e4b0917d3477ced1
LikeLike
robertscribbler
/ April 7, 2017Nice. There were about half a million winners alone in DC and hundreds of thousands more around the world. Probably the largest coordinated march ever planned.
LikeLike
Suzanne
/ April 7, 2017Pretty darn cool. I have to say I did attend the D.C march..and it will go down as one of the most memorable days in my life. It was worth the 17 hours on a bus.. 🙂
LikeLike
robertscribbler
/ April 8, 2017Thanks for all you do, Suzanne.
LikeLike
Connecticut Gordon
/ April 7, 2017Hi Robert
Is there any site or graph that you are aware of that shows the volume in 3D or similar. In other words the depth would be the ‘Y’ axis and the coverage shown either as just an ‘X’ axis somehow, or able to be done as a pseudo ‘X’ and ‘Z’ axis? I presume the real thickness is where the multi-year ice is, but I’m unsure how to see where most of the volume is disappearing from. Is multi-year ice simply getting less thick, but covering the same surface area, or is it disappearing altogether therefore making any future re-freeze just single season?
LikeLike
robertscribbler
/ April 8, 2017No 3 C graph that I’m aware of. The closest you get are maps that show ice thickness.
LikeLike
Suzanne
/ April 7, 2017I just came across a lecture from 1990 given by climate scientist Dr. Stephen Schneider explaining Global Warming.
Just kills me that Climate Scientists are still fighting the battle to educate the public on CC…twenty seven years later. So much unnecessary lost time.
(Dr. Stephen Schneider a CC warrior and great communicator… very much missed)
LikeLike
robertscribbler
/ April 8, 2017They’ll never fully win so long as the media is so unregulated. Climate change denial statements need a warning label.
LikeLike
lesliegraham1
/ April 8, 2017It beggars belief that the people in Congress couldn’t even grasp the concept of a global average.
Or didn’t want to.
LikeLike
umbrios27
/ April 7, 2017off topic, but just adding to the weather anomalies count: yesterday, all the rain expected for April and a bit more fell dawn in 6h here in São Paulo. I was actually glad to see the rain at home, as we had an unusually dry March (no rain for almost 20 days… and March is supposed to be the grand end of raining season here), and I´m even more glad that I´ve negociated a home-office scheme, so I did not had to go to the city yesterday… as far as my colleagues said, the entrances of the building were all flooded.
http://g1.globo.com/sao-paulo/noticia/sp-teve-em-24-horas-a-maior-chuva-de-abril-em-74-anos-diz-inmet.ghtml
LikeLike
robertscribbler
/ April 8, 2017Thanks for the update, Umbrios. Is water security for the region mostly recovered — or still a bit touch and go?
LikeLike
umbrios27
/ April 9, 2017It’s mostly recovered (in São Paulo, Minas Gerais and Rio de Janeiro, the most populous states). The Cantareira system is at 95% of it’s limit, nearly full. There’s still drought in the Northeast region (specially in Ceará, Maranhão, Piauí, Paraíba, Pernambuco and Rio Grande do Norte), and critical reservoirs like Sobradinho, are using the “dead volume” of water. Water is being transported north by pipelines and trucks and thus far, the deadlier consequences of drought there have been avoided, though economic hits are severe.
LikeLike
Xbutter
/ April 8, 2017Reports of hundreds of icebergs in the North Atlantic when normally there might be only a few dozen have me wondering if this is the beginning of Heinrich event. None of the reports I’ve read even mention this possibility – they all seem to have a attitude about it as if it is a routine occurrence.
LikeLike