
Where does most of the heat trapped by human fossil fuel and other greenhouse gas emissions ultimately end up? Given our fixation on global surface temperatures, many people would say ‘the atmosphere.’ But this answer is incorrect. The vast majority ends up in the world ocean.

(Global change in ocean heat content through 2015. Image source: Skeptical Science and CMIP5.)
The world ocean system is the largest heat sink on our planet’s surface. This is due to the fact that liquid water contained in the oceans both has a far greater mass and overall heat capacity than the atmosphere. Just a fraction — less than 1/30th of the heat trapped by human-emitted greenhouse gasses ends up in the atmosphere. Similar portions end up getting soaked in by the land and by melting glaciers. The rest, about 90 percent, finds its way into the oceans.
The ocean is thus the best, most reliable global thermometer available. For good reason, most scientists wait for readings from this big, wet thermostat to get an idea where global temperatures are headed and how fast. And what some of the world’s top ocean researchers found this week was that during 2017 the top 6,000 feet of the world’s oceans experienced their hottest year ever recorded.
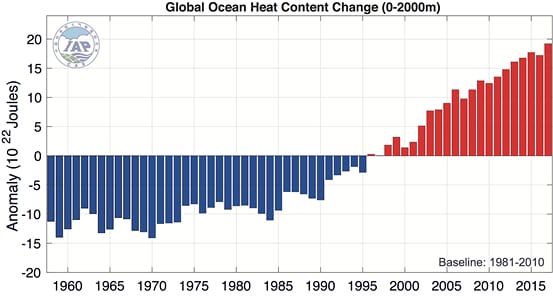
(Ocean heat content change since 1958. Illustration: Cheng and Zhu (2018), Advances in Atmospheric Sciences.)
Not only was 2017 the hottest ocean year on record, the heat gain from the previous hottest ocean year (2015) was quite considerable. In all 15,100,000,000,000,000,000,000 Joules of heat energy were added by the world ocean from 2015 to 2017. By comparison, 61,500,000,000,000 Joules were produced by the Hiroshima bomb. The world ocean is now taking in a similar amount of heat every 3-5 seconds.
In the atmosphere, we tend to focus on El Nino years as the hot ones in an ongoing upward trend. This is because warm surface waters spreading across the Equatorial Pacific belch a bit of that huge volume of stored ocean heat back into the atmosphere. But during La Nina years, cooler surface waters across wide regions of the Equator swallow up more of the atmospheric heat. It is during these years that oceans tend to warm the most swiftly even as atmospheric warming tends to take a break. 2017 saw a weak La Nina and a comparatively strong rate of related ocean heat gain. And though atmospheric temperatures were ‘only’ the second hottest ever recorded according to NASA, ocean temperatures tracked further into uncharted territory.
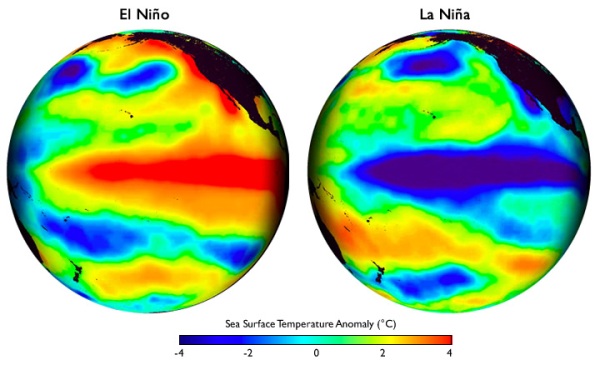
(During El Nino years [left], the global oceans transfer a portion of their vast store of warmth to the atmosphere. During La Nina years [right] the oceans draw in more of the atmosphere’s heat. Image source: Climate.gov.)
It’s worth noting that ocean heat gain is presently both quite rapid and rather steady. All of the past five years were each one of the five hottest ocean years ever recorded. Global temperature gain thus hasn’t slowed. And though atmospheric temperature gain has accelerated during recent years, the ocean measure hints that overall heat gain per year has been pretty steady since the mid 1990s. At least for the top 6,000 feet of the world’s surface waters (though other measures provide some hints at acceleration [see image at top of this post]). An observation that would seem to reinforce the present decadal rate of temperature increase in the range of 0.15 to 0.20 C every ten years or about 30 to 50 times faster than the warming that ended the last ice age.
To be clear, the primary driver of what is a very rapid warming in the geological context is human fossil fuel burning and related carbon emissions in the range of 11 billion tons per year. Halting fossil fuel burning is therefore critical to slowing down and ultimately stopping the present rate of warming and dangerous related atmospheric and ocean carbon addition.


Jim
/ January 26, 2018Robert,
The heat capacity of water is so great that it’s easy for people to not appreciate the significance of how much energy it takes to raise the temperature of the world’s oceans. Somewhere a couple of years ago a climate scientist did a calculation of how much air temperatures would have risen if the heat didn’t go into the oceans, but instead just heated the air. The result was something like 67 degrees F! I can’t find the source now, but it seems like something Gavin Schmidt would do, so I’ll dig through his older twitter feed.
~Jim
LikeLike
robertscribbler
/ January 26, 2018Good point here, Jim I recall the comparison as well. Would be a nice reference to dig up.
LikeLike
Spike
/ January 28, 2018“Due to its large mass and high heat capacity, the ocean absorbs a substantial amount of heat. It is estimated that the earth gained 274 ZJi of heat energy between 1971 and 2010,
of which around 90% was taken up by the ocean. According to one estimate, the top 2000 m of the ocean took up 240 ZJ of heat energy between 1955 and 2010, but only increased
in temperature by about 0.09°C due to its high heat capacity. If the lower 10 km of the atmosphere were able to absorb this same quantity of heat it would warm by 36°C.”
Click to access Ocean-heat-uptake—Grantham-BP-15.pdf
LikeLike
Syd Bridges
/ January 26, 2018Thank you for another interesting post, Robert. It strikes me that 1.5 x 10^23 joules will both add up to heavier rainstorms driven by more evaporation and thermal expansion of the oceans causing more rapid SLR. I expect more Harvey-on-Houston events as a result of this combination, with a little help from friends like meandering jetstreams.
“The Pause” was an obvious fiction of climate denialists, and it is interesting to see that there is no sign of it in this graph.
LikeLike
robertscribbler
/ January 26, 20181.5 x 10^22 for the gain from 2015. Overall gain in the link.
Yeah. All the added heat moves the ocean, glaciers, and the water cycle that much more.
LikeLike
rhymeswithgoalie
/ January 27, 2018[Link to “Skeptical Science and CMIP5” image actually goes to Wikipedia heat page.]
LikeLike
Andy_in_SD
/ January 26, 2018The difficulty for people the wrap their heads around this is that one doesn’t calculate what one doesn’t observe.
However, as we have seen (and have discussed for the past couple of years here) is the proxy tell of species migration and substitution.
It is a shame that the Koch’s et al have been successful in having the sensor arrays abandoned and left unmaintained. As they die off, our eyes into our own future are lost. I hope it was worth a few more bucks (today) for these billionaires to potentially kill their own grandchildren.
LikeLike
robertscribbler
/ January 26, 2018It’s not just satellites they’re shutting off. Ask the people of Puerto Rico.
LikeLike
Andy_in_SD
/ January 27, 2018True that!
LikeLike
Jim
/ January 26, 2018I keep getting distracted by Gavin’s Twitter entries, so I did a back of the envelope calculation using an unverified specific heat number of the earth’s atmosphere (first link below) of 5 x 10^21 J/C. Dividing by the 15 x 10^23 Joules of heat in our oceans gives 30 degrees C, or 54 F. Which would take the worlds average temperature of 59 F up to 113 F.
If we wanted to be a bit more rigorous in our thought experiment, we’d have to account for the specific heat of the earth’s curst, which is 1/4 to 1/5 that of water. So we’d be dealing with a surface temperature increase of 11 – 13F, still quite considerable and sufficient to make large parts of the world inhabitable. Thank god for the oceans, and especially for water’s high specific heat.
https://www2.ucar.edu/climate/faq/what-average-global-temperature-now
LikeLike
robertscribbler
/ January 26, 2018Thanks for the follow-up. Good stuff. Scary for me.
LikeLike
Entropic man
/ January 26, 2018Not a difficult calculation.
You quote an ocean heat content rise of 1.5*10^22J in three years, 5*10^21 J/year.
The mass of the atmosphere is 5.2*10^18 kg.
If all the heat went into the atmosphere you would have added1.5*10^22/5.2*10^18 =2.9*10^3 J/kg.
Specific heat of air is 10^3 J/kg/C.
The atmosphere would warm by 2.9*10^3/10^3 = 2.9C/year.
That is 29C/decade or 78.3C since 1990.
If you are American that is 5.2F/year, 52F/decade or 140F since 1990.
LikeLike
Jim
/ January 27, 2018Calculation was done with the 3 year heat increase (1.5 x 10^22), rather than the (5 x 10^21) annual ocean heat addition. No?
Re-calculated with the annual number leads to a still scary .96 C increase per year.
LikeLike
kenflood
/ January 26, 2018As always Mr. Scribbler, I appreciate the information and always reference/refer your blog.
I am surprised that you did not mention how the warmer oceans are stratifying which is slowing down the mixing with lower waters. I think that this will accelerate the warming.
LikeLike
Brian
/ January 27, 2018And also how the stratification can lead to Canfield Ocean effects, if I remember correctly. There are some excellent earlier blog posts that Robert has done that talk to this effect in detail.
LikeLike
eleggua
/ February 2, 2018You remember correctly.
https://robertscribbler.com/tag/canfield-ocean/
^^^All of the posts that are tagged ‘Canfield Ocean’.
LikeLike
Jim
/ January 27, 2018I try to stay apolitical, but I saw this article “The Animal Without a Brain That Is Taking Over the Ocean”, and honestly thought it would be something that Trump was doing to environmental regulations. It’s about Jellyfish…..
https://www.newsdeeply.com/oceans/articles/2017/11/02/the-animal-without-a-brain-that-is-taking-over-the-ocean
LikeLike
generativity
/ January 30, 2018Recalls recent news that jelly fish are indeed part of a complex food web, so “they” are not taking over the ocean, rather their novel population dynamics indicate ecosystems adapting to this rapid ocean warming, and we’d better catch up.
https://m.phys.org/news/2017-12-jellyfish-superpowers-dont-bad-reputation.html
LikeLike
Christina MacPherson
/ January 27, 2018Reblogged this on nuclear-news.
LikeLike
Andy_in_SD
/ January 27, 2018I do not know this calc, however as the ocean heats up quicker it should act as though it is narrowing the gap between it’s median temperature & the atmospheres. As that gap narrows, and the ocean becomes more reluctant to absorb more heat, the atmosphere may become more compelling as an alternative destination for this energy.
This may act as what we would view as an accelerator from an atmospheric position.
Not certain if this would be valid, anyone who understands such calcs better would be able to approach this with better informed knowledge.
LikeLike
bill h
/ January 27, 2018Andy, Remember that it is the ocean and land that that absorbs all the sun’s heat, and then radiates to the atmosphere at wavelengths that the atmosphere absorbs. The atmosphere is transparent to the sun’s rays, except at short wavelengths, where everything starts to absorb. With increasing GHG more of the radiated heat gets sent back by the atmosphere to the the land and oceans,so their net rate of heat loss decreases while the incoming radiation from the sun remains the same (barring the variations due to Milankovitch cycles and aerosols), so there’s no increased “reluctance” to absorb.
LikeLike
Andy_in_SD
/ January 28, 2018Thanks Bill! Very much appreciate the explanation.
LikeLike
bill h
/ January 29, 2018Andy, you’re very welcome. I’ve some experience with explaining the mechanism of GW from attempting to debate with deniers, who set up a straw man of “AGW theory claims that the atmosphere is warming the land and oceans”, and then mocking the idea that the tenuous atmosphere could do such a thing. Answer: it’s the sun that does the warming of land and ocean as it always does, while the atmosphere reduces the rate of energy flow back out again. The more the atmosphere does this job the warmer the ocean and land get.
LikeLike
Jim
/ January 27, 2018Part of what I find amazing is the rate at which we are adding CO2 to the atmosphere. Whether you pick 1750 or 1880 as the starting point, half of the CO2 has been added since 1988 (Carbon Majors report below), a mere 27 years. Nobody I’ve asked to guess where the halfway point lies has guessed beyond the mid 1950’s. There are two major inflection points in the graph (PDF page 7). The first is the 1950’s where EU, US, and Japan went through a period of rapid industrialization. The second inflection point of CO2 additions to the atmosphere is around 2000 where China, then India really ramped up the rate at which they industrialized.
And when you look at Robert’s report above we see that half of the oceans heat content has been added since 1997 – a mere 20 years. Already we’re seeing dramatic increases in coral reef bleaching, and dead zones, and ocean acidification.
This implies about a 10 year lag between carbon emission and meaningful impact on our environment. Previously this was thought to be on the order of 40 years, with a much longer time needed to see the full effect and reach equilibrium (see second link), but I sense there’s still a lot to be learned about how earth systems, both fast and slow, react to changes in energy imbalance. Robert, I’d be interested in your perspective on this….
https://b8f65cb373b1b7b15feb-c70d8ead6ced550b4d987d7c03fcdd1d.ssl.cf3.rackcdn.com/cms/reports/documents/000/002/327/original/Carbon-Majors-Report-2017.pdf?1499431371
http://iopscience.iop.org/article/10.1088/1748-9326/9/12/124002
LikeLike
Frank Speaking
/ January 27, 2018Actually a Murdoch Paper telling the truth (one article only)
http://www.adelaidenow.com.au/lifestyle/sa-weekend/when-will-global-warming-become-too-hot-for-humans-to-survuve/news-story/a4f1eb8e43e2c9fb6ea377ae1f2fc7ff
LikeLike
bearingwitness
/ January 28, 2018Ah, of course it’s behind a paywall… can you quote part of the article?
This local “newspaper” has been pushing pure climate denialism for years. I’m surprised this article got past the editors!
Today in Adelaide it was predicted to reach 42C (107F). Parts of the city are already sweltering at 44C (111F)!
Since last weekend’s heatwave, I’ve observed the majority of the ornamental London Plane trees (Platanus × hispanicas) shedding loads of GREEN leaves, shin-deep in some places. It’s staggering and heartbreaking to see living beings dying before one’s eyes.
LikeLike
Frank Speaking
/ January 30, 2018bw
Unfortunately there was only a brief window before it went behind the paywall, I am not a subscriber (Would mean giving the evil empire my money) – even if I subscribed, no point in making comments when allowed, as if the comment has too much verifiable data and information counter to the spin it wont be published and their mindless swarm of commentators just repeat the same old drivel, rinse and repeat
LikeLike
bearingwitness
/ January 31, 2018Ok… sometimes articles like that become accessible after some time has passed – will keep checking back. I refuse to give money to the Murdocracy whereever possible too!
Annoying that it’s behind a paywall – it should be considered in the “public interest” to inform people about the human health risks of climate change. Pigs might fly, I know, but still.
Keep up the good work.
LikeLike
Frank Speaking
/ January 27, 2018As the mountain ice melts artifacts up to 4,000 yrs old are being discovered.
https://www.sciencealert.com/climate-change-reveals-historical-relics-trapped-in-norways-glacier-ice
Climate Change Is Revealing Thousands of Historical Relics Trapped in Norway’s Glaciers
From arrows to skis, frozen in time.
One of the consequences of a warming planet is receding glaciers, and archaeologists working on ice sheets on highest peaks of Norway have discovered a treasure trove of artefacts dating back as far as 4000 BCE.
They include clothes, weaponry, and even ancient skis, and more than 2,000 relics have been recovered from the Jotunheimen area and the surrounding mountains in Oppland. Perfectly preserved packhorse skeletons have also been found.
LikeLike
Paul in WI
/ January 27, 2018Expanding on your post about melting glaciers, there’s a new article in Ars Technica referencing a couple of new studies about melting glaciers concerning glacial collapse (and associated massive landslides) in mountainous terrain and how nearly half of the world’s mountain glaciers have already passed “peak runoff” which reduces water supplies for countries and communities.
https://arstechnica.com/science/2018/01/many-glaciers-letting-rivers-run-low-others-are-falling-apart/
LikeLike
Paul in WI
/ January 27, 2018There’s a good article in Mental Floss about the shrinking glaciers in Glacier National Park and the cascading effects that the warming climate is having on the environment and wildlife in the park: “The Troubling Consequences of the Vanishing Ice at Glacier National Park”
An excerpt from the article:
The very name of Glacier National Park, a 1-million-acre expanse in northwest Montana on the Canadian border, comes from ice. But the name may need to change by 2030: Experts predict the formations could disappear by then.
According to the U.S. Geological Survey, the glaciers in Glacier National Park have shrunk by an average of 39 percent since 1966; some lost up to 85 percent of their ice. A 2014 study in Science attributes global loss in glacier mass to both anthropogenic (or human caused) and natural climate changes. The study blames human causes for about a quarter of the loss between 1851 and 2010, but that share increased steadily and accelerated to account for almost two-thirds of the loss between 1991 and 2010.
Glaciers are one of the main reasons 2.9 million people visited the eponymous national park in 2016. But the looming loss of these formations has many significant ramifications. Moreover, the changes at the park are representative of what’s happening globally—and visitors can see these changes for themselves.
http://mentalfloss.com/article/521379/troubling-consequences-vanishing-ice-glacier-national-park
LikeLike
Jim
/ January 28, 2018I vote for the park to change it’s name to “Stephen Harper National Monument to Carbon Pollution”.
LikeLike
Frank Speaking
/ January 27, 2018Another bomb being primed
https://www.ecowatch.com/peatland-carbon-storage-2528855923.html
Climate Change and Deforestation Threaten World’s Largest Tropical Peatland
Just over a year ago, scientists announced the discovery of the world’s largest intact tropical peatland in a remote part of the Congo’s vast swampy basin.
The Cuvette Centrale peatlands stretch across an area of central Africa that is larger than the size of England and stores as much as 30 billion tonnes of carbon.
Now, the same research team has published a new study finding that future climate change, along with deforestation, could threaten the peatlands’ ability to soak up and store large amounts of carbon.
If left unaddressed, these threats could cause the Congo peatlands to turn from a carbon sink into a carbon source, the study says. This means that the peatlands could contribute to climate change by releasing more carbon than they are able to absorb.
LikeLike
A Green Road Daily News
/ January 27, 2018Reblogged this on AGR Daily 60 Second News Bites.
LikeLike
wharf rat
/ January 27, 2018Eco Marine Power has announced plans to test their patented solar sails next year. These EnergySails would utilize solar and wind energy simultaneously.
https://futurism.com/new-ship-rigid-solar-sails-harnesses-power-sun-wind-same-time/
It may be a bit late, but there’s https://youtu.be/xivQkRx0S0A
LikeLike
wharf rat
/ January 27, 2018Arctic +4.5 C anomaly today
http://cci-reanalyzer.org/wx/DailySummary/#t2anom
LikeLike
wharf rat
/ January 27, 2018From peakoilbarrel…
There is a great video here by Ice Shieldz showing the Lincoln Sea in January. Up to this year this area was solid, multiyear ice, often fast. It all got smashed up and melted this summer and now is thin first year ice which is continually being exported out the Nares Strait, which no longer has a winter ice dam.
https://forum.arctic-sea-ice.net/index.php/topic,2141.700.html#lastPost
LikeLike
bill h
/ January 27, 2018Wharf,
Wow, that’s an amazing video clip of the ice passing through Nares. For information I’ll add that one needs to click on the link you provide and then scroll upwards to view the video. I remember that the excellent arctic ice blogger “Neven” described the North coasts of Greenland and the neighbouring islands of the Canadian Arctic archipelago as the “Fort Knox of Arctic Sea Ice”. Looks as if the door to Fort Knox isn’t very secure now.
LikeLike
eleggua
/ February 2, 2018“…an amazing video clip of the ice passing through Nares”
Here’s another, different animation.
Using images captured by the Copernicus Sentinel-1 mission between the beginning of October 2016 and mid-May 2017, the animation shows large chunks or ‘floes’ of old ice effectively being ‘flushed down the drain’ at a considerable rate. The animation also indicates sustained periods ice being transported north–eastward along the coast of Ellesmere Island, feeding thick old ice into the Lincoln Sea. This contributes to an overall reduction in the volume of Arctic sea ice and raises concerns about how Nares Strait exports ice in what is forecasted to be a record summer ice volume minimum. The summer minimum is reached in September.
LikeLike
Exposing the Big Game
/ January 27, 2018Reblogged this on The Extinction Chronicles.
LikeLike
bill h
/ January 27, 2018Wharf,
Wow, that’s an amazing video clip of the ice passing through Nares. For information I’ll add that one needs to click on the link you provide and then scroll upwards to view the video. I
remember that the excellent arctic ice blogger “Neven” described the North coasts of Greenland and the neighbouring islands of the Canadian Arctic archipelago as the “Fort Knox of Arctic Sea Ice”. Looks as if the door to Fort Knox isn’t very secure now.
LikeLike
eleggua
/ February 2, 2018Direct link to Ice Shieldz’ Lincoln Sea Nares Export gif post.
https://forum.arctic-sea-ice.net/index.php?topic=2141.msg139901#msg139901
LikeLike
wili
/ January 27, 2018Worth a read:
https://theconversation.com/why-climate-change-is-worsening-public-health-problems-86193
“Why climate change is worsening public health problems”
“…A 2017 commission of The Lancet, a leading health research journal, tracked the effects of climate change on health and found evidence of harms ‘far worse that previously understood’…”
LikeLike
mlp in nc
/ January 28, 2018Probably due to widespread antibiotic use rather than climate change (but who knows), a potentially disastrous finding that we can only hope peters out without harm. Whether anything comes of it or not, another example of microbial threats developing.
That is the serendipitous finding of a ninth type of botulinum toxin in Enterococcus isolated from cow feces on a South Carolina farm. Probably via a plasmid swap. Only one instance involved so far, and not obviously pathogenic, hence the hope it will be competed or stamped out of existence or that the toxin, which scarily is a full compliment, will not become pathogenic. Though it can be manipulated so in the lab. Enterococcus is widespread in the environment and in humans, and some of it is antibiotic resistant. A strain producing pathogenic botulinum toxin is a nightmare.
The finding is something of a marvel in itself. “Analyzing the newly sequenced E. faecium genome, the lab’s computer programs quickly spotted the genetic sequence for the novel botulinum toxin. “The way that we discovered this toxin using computational methods is different from how toxins used to be identified in the past, and may become a standard approach in biomonitoring” says Doxey.”
Sicai Zhang et al. Identification of a Botulinum Neurotoxin-like Toxin in a Commensal Strain of Enterococcus faecium. Cell Host and Microbe, 2018 DOI: 10.1016/j.chom.2017.12.018
https://www.sciencedaily.com/releases/2018/01/180126122856.htm
LikeLike
kassy
/ January 29, 2018We should really stop using antibiotics as growth enhancers in the meat industry. This is a breeding ground of resistant infections which are problematic of their own nevermind when some normally mundane bug acquires those traits and a more virulent plasmid then in the article above (or it starts of with a not so virulent plasmid but it circulates somewhere with little to no monitoring).
LikeLike
wili
/ January 29, 2018Or better yet, stop raising animals for slaughter! 🙂
LikeLike
kassy
/ January 31, 2018Yes please….although if we did that what would happen to the “industrial animals” ?
LikeLike
eleggua
/ February 2, 2018“We should really stop the meat industry”
As they say, ^^^fixed.
LikeLike
eleggua
/ February 2, 2018LikeLike
kassy
/ January 28, 2018HOW MUCH LONGER CAN COASTAL CITIES SURVIVE? ROBOTS SWIMMING UNDER ICE IN ANTARCTICA WILL DELIVER THE COUNTDOWN
…
In the coming days, researchers will be sending valuable equipment beneath ice shelves to collect data over the course of the year. The team will deploy three Seagliders and four ice floats; the nearly $2 million project was funded by Paul G. Allen Philanthropies. The ice shelves these bots will study don’t specifically cause sea level rise—rather, they act like a buttress for Antarctica’s ice sheets, which are filled with glaciers that are slipping into the sea. Despite the vast amount of what we do know about Antarctica, there is plenty we don’t know—partly because of how difficult it is to study.
“It’s very complicated and hazardous to navigate in and that’s been one of the impediments to sending robotic submarine missions that do not have autonomous navigation technology,” Knut Christianson, glaciologist on the project from the University of Washington, told Newsweek. “There’s no guarantee that you’ll get good data back—you might just lose whatever drone you send underneath there.”
Beneath the ice shelves is a cavernous, icy terrain, with channels, crevasses, and nooks that even the most advanced robots could get stuck in. The bots will investigate the underbelly of the Dotson ice shelf, which is slightly larger than Rhode Island. That underbelly is the scientists’ target point, as there is increasing evidence that ice is melting from the warmer oceans below. But, since much of ice observation has been from space using satellite data, the processes between ice and ocean aren’t extensively understood.
more on:
http://www.newsweek.com/how-much-longer-can-coastal-cities-survive-robots-under-melting-ice-antarctica-790088?piano_t=1
Let’s hope the drones don’t get stuck. I’m really curious about the outcome of this research.
LikeLike
Jeremy in Wales
/ January 28, 2018Research on this sector of Antartica is urgently needed as the Dotson Ice shelf is close to Thwaites and the Pine Island Glacier (PIG). The iceberg B44 broke off PIG last September following crevasses in the glacier, a new pattern of calving, and has since shattered possibly because of upwelling warm(er) water poloyna
https://www.bas.ac.uk/media-post/giant-west-antarctic-iceberg-disintegrates/
These glaciers threaten rapid disintergration and sea level rises. It may well be that it is already too late to prevent this disintergration but already a geo-engineering solution is being proposed, sand and boulder dams at the face of the glaciers to slow the ingress of warm water.
https://www.theatlantic.com/science/archive/2018/01/a-new-geo-engineering-proposal-to-stop-sea-level-rise/550214/
LikeLike
Jeremy in Wales
/ January 28, 2018A bit of research suggests that Thwaites and Pine Island Glacier should be treated as one system since they appear to be connected
https://www.theatlantic.com/science/archive/2018/01/a-new-geo-engineering-proposal-to-stop-sea-level-rise/550214/
LikeLike
Jeremy in Wales
/ January 29, 2018A piece of iceberg B44 has drifted back into the Pine Island Glacier ice shelf and knocked a further ice berg lose, some 5km X 1Km (guesswork)
https://go.nasa.gov/2FpCm9q
LikeLike
Jeremy in Wales
/ January 31, 2018Tweet confirming new berg suggesting near a new rift which may result in more calving soon.Gif showing calving and showing rift not visible on EOSDIS Worldview.
LikeLike
Keith Antonysen
/ January 28, 2018Carbon Brief provides an overview of 2017.
Quote:
“It was the warmest year on record for ocean heat content, which increased markedly between 2016 and 2017.
It was the second or third warmest year on record for surface temperature – depending on the dataset used – and the warmest year without the influence of an El Niño event.
It saw record lows in sea ice extent and volume in the Arctic both at the beginning and end of the year, though the minimum extent reached in September was only the eighth lowest on record.
It also saw record-low Antarctic sea ice for much of the year, though scientists are still working to determine the role of human activity in the region’s sea ice changes.”
https://www.carbonbrief.org/state-of-the-climate-how-the-world-warmed-in-2017
Munich Re, via Joe Room, places the financial costs incurred through the adverse climate:
https://thinkprogress.org/weather-disaster-record-cost-4948070d8e53/
LikeLike
Keith Antonysen
/ January 28, 2018Sorry, Joe Romm. I get caught out by spell check.
LikeLike
kassy
/ January 31, 2018Don’t worry. When i read “Joe Room” it just brought a big smile to my face. We all love autocorrect. 😉
LikeLike
eleggua
/ February 2, 2018LikeLike
Leland Palmer
/ January 29, 2018Norway is the seventh largest carbon producing country on earth due to Arctic oil and gas, according to The Guardian:
https://www.theguardian.com/environment/2017/aug/10/norways-push-for-arctic-oil-and-gas-threatens-paris-climate-goals-study
“But the authors say this misses the point because Norway exports 10 times more carbon than it emits, which makes this relatively small country the seventh biggest source of the climate pollutant.
“This is the first time we have seen how Norway’s exports affect other countries,” says Silje Lundberg of Friends of the Earth Norway.”
I’ve been wondering at some of the research output of CAGE, the Center for Arctic Gas hydrate, Environment, and Climate of the Arctic University of Norway. They seem awfully well funded and somewhat oil industry friendly. Methane hydrate, as always, remains a potentially vast source of fossil fuels.
LikeLike
miles h
/ January 29, 2018the methane question again – thawing permafrost in Alaska. https://www.npr.org/sections/goatsandsoda/2018/01/24/575220206/is-there-a-ticking-time-bomb-under-the-arctic?utm_source=EHN&utm_campaign=6e1afc3686-RSS_EMAIL_CAMPAIGN&utm_medium=email&utm_term=0_8573f35474-6e1afc3686-99050737
LikeLike
kassy
/ January 29, 2018They have a choice to make. Off course there are always vested interests including in the state itself usually.
It is a bit like our dutch gas dilemma but we have bonus earthquakes damaging houses and this forced them to pump up less gas…which was a good thing because if we had to wait for the involved to do the right thing with respect to climate change that would have taken a lot longer.
There has been minor quake damage for years. After many years the politicians finally decided to start an independent agency/company assessing the damage. Most experts in the “independent company” cane from NAM. This is the company exploiting the gasfields and it is basically Shell + Dutch state. They did not handle claims well basically just minimizing damage for NAM. Then we got a slightly bigger quake with more damage and they finally started doing things like extracting less gas and improving the handling of the claims.
But all this happened for only a relatively small amount of property damage not for the really good reason.
LikeLike
Greg
/ January 29, 2018This piece needs to be shared far and wide. It should shift views. We lost so much time focused on climate messaging regarding the atmosphere in which games have been played for decades by deniers using the variability in the data. The ocean temperature data is so much smoother and clearer. The numbers are clear and staggering. The energy of Hiroshima every 3-5 seconds needs to be repeated like a mantra.
LikeLike
Mblanc
/ January 30, 2018Funny day for me, can’t fathom why Elon is touting a flame thrower, seems a bit odd/pointless.
https://www.theguardian.com/technology/2018/jan/29/elon-musk-sells-21m-of-flamethrowers-in-a-day-plus-extinguishers
Not quite as odd as the VW ‘gas chamber’ (sorry if my use of this phrase offends) story, though. As they say these days, the optics could be better. I would think whoever was responsible will be looking for a new job already.
https://www.theguardian.com/business/2018/jan/29/vw-condemned-for-testing-diesel-fumes-on-humans-and-monkeys
LikeLike
Jim
/ January 30, 2018Mblanc,
Just caught up with this bit of news you referenced above. Testing diesel exhaust on java monkeys and people to “show that the pollution load of nitric oxides had decreased due to modern technology” makes absolutely no sense to me. You can measure NOX directly with a higher degree of accuracy than using blood samples from animals and people as a proxy. This was to measure the overall health effects of diesel which include some known strong carcinogens.
The article in the Guardian didn’t mention where the people came from that were part of the test. I’ll bet it wasn’t Germany.
Can’t make this crap up.
LikeLike
eleggua
/ February 2, 2018“…can’t fathom why Elon is touting a flame thrower…”
LikeLike
Andy_in_SD
/ January 30, 2018This is a bad sign.
LikeLike
entropicman
/ January 30, 2018Especially when you compare it with last year’s record conditions.
LikeLike
wharf rat
/ January 30, 2018LikeLike
entropicman
/ January 30, 2018And the Japanese data.
https://s3-us-west-1.amazonaws.com/www.moyhu.org/pages/latest/Ice/polview.html
LikeLike
kassy
/ January 30, 2018ow to reduce heat extremes by 2-3 degrees Celsius
How changing crops, moving to no till agriculture and lightening infrastructure can reduce extreme temperatures.
Date:
January 29, 2018
Source:
University of New South Wales
Summary:
New research shows how simple, proven geo-engineering measures can reduce the hottest days by 2-3 degrees C. Lightening buildings, roads and infrastructure in densely populated areas and changing crop types and using no till agricultural practices over farmland can all take the edge off the hottest days as climate change raises extreme temperatures.
…
“This research suggests that by taking a regional approach, at least in temperate zones, policy and investment decisions can be pragmatically and affordably focused on areas of greatest need.”
https://www.sciencedaily.com/releases/2018/01/180129181512.htm
LikeLike
nigel64
/ January 30, 2018And all these methods cost much less (than hard, high-tech etc), and won’t burden us with over investment in infrastructure.
LikeLike
Jeremy in Wales
/ January 30, 2018A report by Sandbag indicates that UK electricity usage declined by 2% last year
https://sandbag.org.uk/project/european-energy-transition-power-sector-2017/
https://www.theguardian.com/business/2018/jan/30/uk-electricity-use-falling-economy-weather
“The UK’s power consumption fell nearly 2% from 355 terawatt hours to 348 tWh, while it rose across the EU as a whole by 0.7% from 3,239 to 3,262 tWh.”
“Overall, electricity demand has fallen by 9% in the UK in the past seven years, the sharpest decline in the union. Meanwhile, Poland chalked up the biggest rise, at 9% over the same period.”
Does this indicate massive economic failings or an economic success since the Brexit referendum, that austerity of family wages is pushing down demand or that efficiency across business and households is increasingly bearing fruit. There seems to be no agreement as to the reasons for the reducing demand, some is caused by austerity, LED street lighting and household lights, more efficient household appliances. The biggest single user of electricity in the UK, Anglesey Aluminium (255MW) closed in 2009, a Murco refinery closed in Pembrokeshire in 2014 which processed 5.5 million tonnes of crude oil and the Redcar steelworks closed in 2015 both large energy users but it is not obvious that industrial failings are the real cause.
The report findings generalised are
” The UK increased its share of wind, solar and biomass by 20 percentage points from 8% in 2010 to 28% in 2017
Only being beaten by Denmark who achieved an incredible 42 percentage point increase from 32% to 74%.
Even Germany didn’t manage the same growth as the UK – they only expanded by 17 percentage points from 13% in 2010 to 30% in 2017. Although their penetration is still slightly higher at 30% versus the UK’s 28%.
Of the increase in renewable generation for EU28, the UK was responsible for 19% of the rise from 2011 to 2014, and 22% of the rise from 2014 to 2017.
Together Germany and the UK contributed 57% of the EU’s wind, solar and biomass growth from 2014 to 2017. Many other countries have seen anemic or even zero growth in this period.”
” The UK reduced its coal burn for electricity by 22 percentage points from 28% in 2010 to 7% in 2017, sharply reducing emissions. Note, gas generation also fell through this time, falling from 46% to 40% of the electricity mix.
Only beaten by Denmark who achieved a 23 percentage point fall from 44% to 21%.
The Germans performed badly, falling by just 5 percentage points from 42% in 2010 to 37% in 2017, leaving them still the 4th most coal-intensive electricity mix. This is not only due to phasing out nuclear, but also increasing electricity exports, and stubbornly high electricity demand.”
” The UK saw electricity demand fall by an estimated 2% in 2017, and was most likely the only country out of the entire EU28 to see a fall in 2017.
Since 2010, the UK has seen the largest fall in electricity demand of any EU country, of 9%, whilst the economy has continued to grow.
By comparison, Germany fell by 2% and France fell by 5%, and Poland was the biggest riser at 9% over 7 years.”
“Sandbag also found that for the first time across the EU, renewable sources of power, excluding hydro, overtook coal. Together, wind, solar and biomass accounted for 20.9% of the union’s electricity mix in 2017, up from 9.7% in 2010.”
“This is incredible progress, considering just five years ago, coal generation was more than twice that of wind, solar and biomass,” the report said. However on the downside it found that the EU28 CO2 emissions still rose by 1%.
LikeLike
mlp in nc
/ January 30, 2018FYI
Just finished The Ends of the World by Peter Brannen, pub. 2017, 289 pages covering all the major earth extinctions. Generally familiar to readers here, but all in one place and a fair amount of interesting detail being filled in from what much be a huge amount of scientific work. Not exactly an uplifting bedtime read.
LikeLike
nigel64
/ January 30, 2018I’m reading Ends of the World too, slowly with loads of Post-Its. Hard to sleep afterwards for sure, and hard-going unless you enjoy Marx, Husserl and Guatari with your climate change.
LikeLike
eleggua
/ February 3, 2018“…enjoy Marx, Husserl and Guatari with your climate change.”
Sounds like the wine list for a dinner pairing, put that way!
LikeLike
Andy_in_SD
/ January 31, 2018I’ll need to pick that up. The Sixth Extinction: An Unnatural History is a very good read as well.
LikeLike
eleggua
/ February 2, 2018Waiting on a copy of this one.
https://www.penguin.co.uk/books/289179/inheritors-of-the-earth/
Inheritors of the Earth
How Nature Is Thriving in an Age of Extinction
Chris D. Thomas
“It is accepted wisdom today that human beings have irrevocably damaged the natural world. Yet what if this narrative obscures a more hopeful truth?
In Inheritors of the Earth, renowned ecologist and environmentalist Chris D. Thomas overturns the accepted story, revealing how nature is fighting back.
Many animals and plants actually benefit from our presence, raising biological diversity in most parts of the world and increasing the rate at which new species are formed, perhaps to the highest level in Earth’s history. From Costa Rican tropical forests to the thoroughly transformed British landscape, nature is coping surprisingly well in the human epoch.
Chris Thomas takes us on a gripping round-the-world journey to meet the enterprising creatures that are thriving in the Anthropocene, from York’s ochre-coloured comma butterfly to hybrid bison in North America, scarlet-beaked pukekos in New Zealand, and Asian palms forming thickets in the European Alps. In so doing, he questions our irrational persecution of so-called ‘invasive species’, and shows us that we should not treat the Earth as a faded masterpiece that we need to restore. After all, if life can recover from the asteroid that killed off the dinosaurs, might it not be able to survive the onslaughts of a technological ape?
Combining a naturalist’s eye for wildlife with an ecologist’s wide lens, Chris Thomas forces us to re-examine humanity’s relationship with nature, and reminds us that the story of life is the story of change.”
LikeLike
mlp in nc
/ February 2, 2018Eleggua
A book I will have to have a look at. It is hard to get a fair idea of his point of view from a single article written by someone else and the meaning of quotes taken out of context. If, and if, I read correctly there seems to be an overall rosy take home related to species diversity.
Here in central NC I can’t find a rose of any kind. Several years ago, one of my co-workers, who lives in a rural area, said “All the wildlife have just disappeared”. That squares with my observation (I live in town) that wildlife carcasses have all but disappeared along the rural roads. Were pretty frequent before. “All the wildlife just disappeared” from someone who lives in the midst of them is not something one can put a good spin on. I put it this way because ‘catastrophic’ is a wet dish cloth of a word for the actual reality. Wildlife put many a meal on the table in the Great Depression.
LikeLike
eleggua
/ February 3, 2018Yes, I’m very sceptical of the thesis, based on my own experiences and observations.
From that review: “irrational persecution of so-called ‘invasive species’”
Invansive species reduce biodiversity. The American Bullfrog’s a prime example. When introduced (by humans, usually) into a new area, it consumes every other frog species, wiping them out locally. The tabpoles can overcome aquatic predatory insect larvae as well as the adult insects; the frog severely affects waterfowl, consuming hatchlings; the larvae also negatively impact beneficial algae. There’s nothing “so-called” about their invasiveness.
‘American Bullfrogs as Invasive Species: A Review of the Introduction, Subsequent Problems, Management Options, and Future Directions’ (2010)
https://naldc.nal.usda.gov/download/49725/PDF
“Both tadpoles and adult bullfrogs are voracious feeders and can consume benthic algae and the eggs or offspring of many species of native invertebrates and vertebrates including fishes, reptiles, amphibians, water birds, and even small mammals. It is also believed that bullfrogs, once established, can compete directly with native birds, reptiles, amphibians, and fishes for limited food resources. In some cases, they also may have significant effects on aquatic vegetation. For example, tadpoles feeding on nitrogen-fixing algae can greatly influence aquatic habitats by reducing algal biomass, thereby decreasing primary production and nutrient cycling ”
Coral reefs are an excellent example of the importance of biodiversity as a mitigator of climate change effects on local species.
‘Coral Reef Resilience through Biodiversity’
Caroline S. Rogers 18 October 2012
https://www.hindawi.com/journals/isrn/2013/739034/
“We used the Reef Life Survey’s global database of 4,556 standardized fish surveys to test the importance of biodiversity to fish production relative to 25 environmental drivers. Temperature, biodiversity, and human influence together explained 47% of the global variation in reef fish biomass among sites. Fish species richness and functional diversity were among the strongest predictors of fish biomass, particularly for the large-bodied species and carnivores preferred by fishers, and these biodiversity effects were robust to potentially confounding influences of sample abundance, scale, and environmental correlations. Warmer temperatures increased biomass directly, presumably by raising metabolism, and indirectly by increasing diversity, whereas temperature variability reduced biomass. Importantly, diversity and climate interact, with biomass of diverse communities less affected by rising and variable temperatures than species-poor communities. Biodiversity thus buffers global fish biomass from climate change, and conservation of marine biodiversity can stabilize fish production in a changing ocean….”
From that review:
“if life can recover from the asteroid that killed off the dinosaurs, might it not be able to survive the onslaughts of a technological ape?”
Life recovered post-Chicxulub, yes, but not all species; estimates put the loss at ~80% of all species. As most of here recognize, this species, the “technological ape”, is not likely to survive if the progress of climate change continues its current hockey-stick trajectory.
Interested to see what Thomas has to say, though.
LikeLike
eleggua
/ February 3, 2018Thanks for your mention of The Ends of the World, mlp. Waiting on a copy of that one now, too.
LikeLike
mlp in nc
/ February 4, 2018You are welcome. I really enjoyed it.
LikeLike
Greg
/ January 31, 2018The temperature in Siberia rose more than 100 degrees in two weeks. Recall the report of minus-88 (F) degree weather in the Siberian outpost of Oymyakon earlier this month, now: The temperature in a settlement just to its east is an astonishing 126 degrees warmer two weeks later. The mercury in Omolon, Russia, reached its highest January temperature ever recorded Monday above freezing, 38.4 degrees (F).Oymyakon has the reputation as being the coldest permanently occupied human settlement in the world.The mild weather can be traced to the development of an enormous, bulging zone of high pressure over eastern Russia. Mashable science editor Andrew Freedman called it “one heckuva monster” It will also result in continuing heat and drought in California and cold in the eastern United States.
https://www.washingtonpost.com/news/capital-weather-gang/wp/2018/01/30/the-temperature-in-siberia-rose-more-than-100-degrees-in-two-weeks/
LikeLike
Greg
/ January 31, 2018Bob Hanson notes it.
LikeLike
kassy
/ January 31, 2018Shall i go for “WOW” or “Quite a departure” ?
WOW it is.
LikeLike
bostonblorp
/ February 1, 2018126F swing.. wow. Whatever “average” comes out of that is meaningless.
LikeLike
nigel64
/ January 31, 2018Another very hot day in southern NZ, several fires burning including this one literally cross our (industrial) valley – http://www.radionz.co.nz/news/national/349361/dunedin-fire-2000-tonnes-of-dry-logs-up-in-flames – from our house it looks also to be on the edge of the landfill, it also burned several businesses and a forest block. Six choppers will ensure we don’t sleep tonight – house vibrating and occasional downwash.
Drove to Invercargill and back today, temp outside car was most unlike southland, metservice shows most places 4 C or more abovve longterm mean high for January, but IMO was much more than this in places like Pukerau which was probably 8 C as businesses had shut up for day which is unusual.
About to do all all change as a cyclonic remnant mixes things up with the 6 C warmer than ever for this time of year –
http://www.radionz.co.nz/news/national/349346/fires-and-flooding-as-storm-hits-parched-south-island. Currently 31 C, supposed to crash to 13 C tonight. This morning I experienced a temp change from 13 to 25 C in 30 minutes – that was in Gore
LikeLike
Frank Speaking
/ January 31, 2018A couple of interesting items
https://cosmosmagazine.com/geoscience/an-antarctic-volcano-caused-rapid-climate-change-at-the-end-of-the-last-ice-age
An Antarctic volcano caused rapid climate change at the end of the last ice age
Two centuries of massive volcanic eruptions in Antarctica blasted a hole in the ozone layer and set deglaciation in train across the southern hemisphere. Michael Lucy reports.
LikeLike
Frank Speaking
/ January 31, 2018And one that CB was interested in, the , the Dryas’s
https://cosmosmagazine.com/climate/1200-year-mini-ice-age-was-caused-by-global-warming
1200-year mini Ice Age was caused by global warming
Isotope analysis reveals detailed pattern of ancient weather event, and prompts warnings of a repeat. Richard A Lovett reports.
LikeLike
Frank Speaking
/ January 31, 20181816 – The year without a summer and it’s cause and consequences
A book. Tambora
https://cosmosmagazine.com/geoscience/tambora-volcano-shook-earth
If the name Tambora does not ring a bell, the “year without summer” may. The year in question was 1816 when global temperatures fell by nearly 1°C, bringing major food shortages across the Northern Hemisphere.
The cause was the combination of naturally occurring weather anomalies and the massive volcanic eruption of Mount Tambora on 11 April, 1815, on the Indonesian island of Sumbawa.
While Krakatoa, also in Indonesia, is better known, Tambora’s explosion was – and remains – one of the most violent the world has seen. It blasted 1,220 metres off the top of the peak, leaving a caldera up to seven kilometres wide.
The plume of ash fired into the atmosphere reflected the Sun’s rays and caused dramatic temperature drops, ruining crops from China to the United States and Europe. The apocalyptic weather formed the backdrop to Mary Shelley’s Frankenstein, written that year, and caused philosophers in Europe to ponder more gloomily on mankind’s fate.
English professor Wood is not the first to write of this cataclysm, but his book is one of the best written and most thought-provoking. It shows clearly how interconnected our world is and how geological and weather events can have profound effects on more than crops and global ecosystems.
Tambora had resounding geopolitical and financial implications. Food for thought as we face the coming decades of climate change upheavals.
LikeLike
Frank Speaking
/ January 31, 2018https://cosmosmagazine.com/climate/how-little-ice-age-shaped-civilisation
How a ‘little’ ice age shaped civilisation
Abrupt climate cooling, thanks to volcanic eruptions, accompanied widespread societal changes across Europe and Asia in the sixth and seventh centuries. Coincidence? Belinda Smith explains.
A cluster of volcanic explosions in the sixth century didn’t just shake up the climate – they also brought on massive societal upheaval across Asia and Europe, a study suggests, including the fall of the Sasanian Empire and spread of the Plague of Justinian which killed up to 50 million people.
Ulf Büntgen from the Swiss Federal Research Institute and colleagues found a period of dramatic cooling in the sixth and seventh centuries – dubbed the Late Antique Little Ice Age – that coincided with human migration, pandemics and political turmoil.
They reported their work in Nature Geoscience.
To determine the climate of the time, the team analysed growth rings from trees in the Austrian Alps and Russian Altai-Sayan Mountains.
A fresh ring grows each year during the summer months – June to August in the northern hemisphere. But in cooler summers, the ring is comparatively thin.
By counting the rings and measuring their width, the researchers pinpointed the cool period spanning 556 CE to around 660 CE.
This directly followed a bunch of volcanic eruptions in 536, 540 and 547 CE, which were determined using ice core data.
Volcanoes can cause climate cooling by spewing large volumes of small particles – sulfate aerosols – into the atmosphere, blocking sunlight.
And even though the Russian and Austrian sites were around 7,600 kilometres apart, their tree ring width patterns matched, showing the cool period extended all the way across Eurasia.
“This was the most dramatic cooling in the northern hemisphere in the past 2,000 years,” Büntgen says.
LikeLike
Apneaman
/ January 31, 2018In the science of geology an Age is millions of years long. No wonder the public is permanently confused.
https://en.wikipedia.org/wiki/Age_(geology)
Little age, ice or otherwise, is an oxymoron.
LikeLike
wili
/ January 31, 2018” they also brought on massive societal upheaval across Asia and Europe”
The problem is that it is rather hard to quantify such claims. If you pick pretty much any 100 year period there are going to be lots of ‘societal upheaval’ somewhere on the Eurasian continent. Many of the specifics in their timeline (like the Lombards invading Italy) are part of longer-term multi-century movements (Germanic conquest of most of Europe, in this case), which in fact were much more violent and wide spread in the previous century or so.
LikeLike
Frank Speaking
/ January 31, 2018Then of course we have the massive Indonesian Eruption in 1256 followed once again by a series of other eruptions leading to the LIA and the Maunder Minimum etc just continued the cool condition and the Laki (Iceland) eruption in the 1700’s which arguably brought on the French revolution due to loss of crops and livestock with starving populations
LikeLike
Frank Speaking
/ January 31, 2018However the factor that sets today apart from those times is the CO2e level will ensure a reasonably rapid return to warmer or hotter times
LikeLike
kassy
/ January 31, 2018The take away lesson is that each of these upheavals caused huge loss of lives.
We like to picture ourselves as in control of nature while we are not if we meet it at it’s most extreme.
If we swing towards the heating part of the equation the outcome will be worse. After the volcanic cooling temperatures swing back up but if we heat the north up too much the permafrost will melt (adding co2) while the last northern forests burn (adding co2). While a crap ton of other feedbacks happen (adding co2).
The potential tail of overshoot is many centuries.
And we are actually in control of the heat because we are causing it. There is a budget we just suck at housekeeping.
There should be some simple app visualizing these things:
The budget
-What we do
–What happens if we stay on that path. Which world will your children live in if they are the same age as you are now? And their children?
And then you can link further down: easiest things to do yourself, biggest sources in the country so you can engage your politicians about it etc.
LikeLike
Suzanne
/ January 31, 2018Every..single…day….the Evil Trump Regime does something else to destroy our planet..and our future:
https://www.washingtonpost.com/business/economy/white-house-seeks-72-percent-cut-to-clean-energy-research-underscoring-administrations-preference-for-fossil-fuelsv/2018/01/31/c2c69350-05f3-11e8-b48c-b07fea957bd5_story.html?hpid=hp_hp-top-table-main_doe-4pm%3Ahomepage%2Fstory&utm_term=.e9a337a3e0c5
The Trump administration is poised to ask Congress for deep budget cuts to the Energy Department’s renewable energy and energy efficiency programs, slashing them by 72 percent overall in fiscal 2019, according to draft budget documents obtained by The Washington Post.
__________________________________
VOTE OUT every possible Republican in 2018.
LikeLike
Jim
/ January 31, 2018And the renewable energy portion of the Department of Energy represents on 7% of it’s budget – the remainder going to nuclear weapons programs and the ever so slow cleanup of nuclear sites.
LikeLike
Robert E Prue
/ January 31, 2018Here in Kansas, close to the Texas and Oklahoma panhandlers, are in an extreme drought. No rain here since October. No fires yet. I fear a repeat of last year. Very dry and a bit warmer than normal. The local wheat crop is toast. Hopefully, it’ll rain or snow soon. Be interesting to see what the drought monitor looks like with tomorrow’s update
LikeLike
Frank Speaking
/ February 1, 2018Rob
Refer every one that has concerns to this site
LikeLike