Greenland Melt Extent Breaks 50% on July 4; 2 Standard Deviation Line Shattered Yet Again

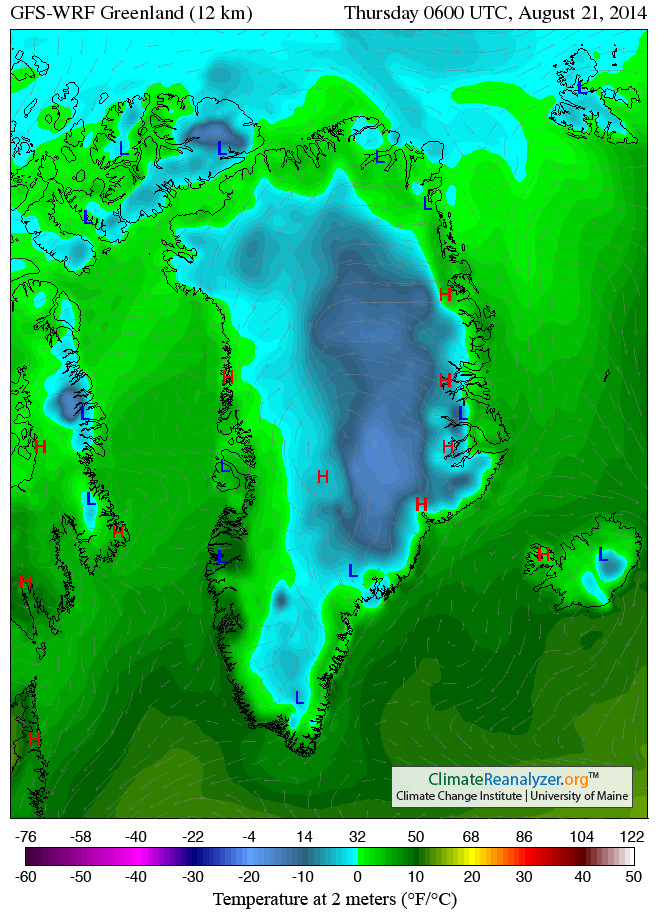
These days — in the age of the fossil-fueled hothouse — it’s never good news when a high pressure system forms over Greenland during Summer.

Human dumping of carbon into the atmosphere has forced warming over the last remaining great Northern Hemisphere ice sheet at a rate of about 0.5 degrees Celsius each decade. A constant rain of soot from human industry and from increasingly prevalent and intense Arctic wildfires has painted the ice sheet dark, lowering its ability to reflect 24 hours of incoming radiation from the Summer sun. And the result is that each Summer, when the skies clear and high pressure systems form over the ailing Greenland ice, you end up getting these huge surface melt spikes.

Greenland smoke

(Smoke from record Alaskan and Canadian wildfire outbreaks traverses Greenland and enters the North Atlantic on July 2 of 2015. Arctic wildfires are intensified by human-caused warming both through the mechanism of added heat and through the reintroduction of long sequestered carbon fuels through permafrost melt which aids in the initiation, intensification and extension of Arctic wildfire burn periods. In essence soil carbon in the form of thawed permafrost and related methane adds to boreal forest, tundra and bog as burn risks. Soot from these fires can then precipitates onto land and sea ice, reducing its ability to reflect the 24 hour Summer Arctic sun. Image source: LANCE MODIS.)

Generally a big melt spike can be defined as anything greater than 35 percent of Greenland ice surface area. And we’ve had quite a few of these abnormal events in recent years. The worst of which happened in mid Summer of 2012.

During late June and early July of that year, an extreme high amplitude Jet Stream wave generated very warm surface temperatures over the Greenland Ice Sheet. A very warm fog settled over the ice, eating away at it. By July 8th, more than 90 percent of the surface was melting — an event that hasn’t happened in Greenland for more than 100 years. June, July and August of 2013 and 2014 saw similar, though somewhat less intense, Greenland melt spikes. During those years the ice sheet experienced multiple days in which melt covered between 35 and 45 percent of its surface. And though these instances were not as intense as the unprecedented 2012 melting, they did traverse well beyond the 1981 to 2010 average line (an average that itself includes a rapid warming trend) to, in cases, exceed the upper 2 standard deviation margin.

Melting on Greenland surface 2014

(Record Greenland surface melt during 2012 compared to still strong surface melt years of 2013 and 2014. Image source: NSIDC.)

After record 2012 melt, surface melt for Greenland has remained abnormally high — indicating an increased likelihood that more near 100 percent surface melt summer days may not be too far off in the future. The post 2012 environment for Greenland has thus been a period of continued and heightened surface melt. One that appears to be in the process of building up to another big pulse.

50 Percent Melt Threshold Exceeded During July of 2015

The summer of 2015 marks a continuation and intensification of this ominous surface melt trend. After getting off to about an average melt start during April and May, June saw surface warmth build over the Greenland Ice Sheet with melt extents jumping to between 30 and 40 percent of surface area by mid-to-late month. Further warming coincided with massive Alaskan and Canadian wildfires injecting soot plumes into regional airspace and the building of a substantial high pressure ridge over Greenland. These factors helped enable further atmospheric and ice warming — shoving surface melt above the 50 percent line by July 4th.

Greenland melt extent 2015

(Major Greenland melt spike indicated on July 1-5 in the NSIDC surface melt extent graph. Image source: NSIDC.)

This puts 2015 Greenland surface melt in a range well above 2013 and 2014, with the first week of July already exceeding 2012 melt for that period.

Over the next seven days, models predict a larger warming of the overall Arctic environment even as a high pressure system and associated ridge remains entrenched across Greenland. This predicted weather pattern will tend to lock in significantly warmer than 20th Century average temperatures. That said, forecast highs do not yet indicate a substantial risk for a repeat of 2012’s near 100 percent surface melt. However, projected high temperatures do show some potential that melt percentages are likely to continue to range between 40 and 60 percent surface melt over coming days with the highest risk for melt spikes occurring on July 6th, 7th and 8th.

It is worth noting that we are now in the midst of a substantial Greenland melt spike, one that we’ll continue to monitor over coming days for further developments.

Links:

LANCE MODIS

NSIDC

Dark Snow

GFS Forecast Summary

Record Alaskan Wildfire Outbreak

Hat Tip to Wili

Hat Tip to Andy in San Diego

Hat Tip to Colorado Bob

Hat Tip to DT Lange

Greenland’s Late August Rain Over Melt Ponds is a Glacial Outburst Flood Hazard

Glacial melt ponding on steep ice faces. Above freezing temperatures for an extended period. Storms delivering rainfall to the glacier surface.

These three events are a bad combination and one that, until recently, we’ve never seen before for Greenland. It is a set of circumstances directly arising from a human-driven warming of the great ice sheet. And it is one that risks a highly violent and energetic event in which melt ponds over-top and glaciers are flushed and ripped apart by surges of water rushing for scores of miles over and through the ice sheet. Major melt pulse events called glacier outburst floods that can result in catastrophically large volumes of water and broken ice chunks issuing from the towering, melting glaciers of Greenland and Antarctica.

It’s a risk we face now, as the circumstances driving the risk of such an event are present today.

Rain over Ice on August 21, 2014

Over the past four days a high amplitude wave in the Jet Stream and coordinate domes of high pressure over Greenland have delivered well above average temperatures for the great Northern Hemisphere ice sheet. Near and just to the east of the Jakobshavn glacier on the West Coast of Greenland, temperatures have ranged between 5 and 10 degrees Celsius above average.

Greenland Temperatures August 21Rain over Greenland Melt Ponds on August 21, 2014

(GFS temperature and rainfall analysis for Greenland on August 21, 2014. Note the above freezing temperatures and rainfall over the region of the Jacobshavn Glacier for today. Image source: University of Maine’s Climate Reanalyzer.)

What this means is a persistence of average temperatures in the range of 34-40 degrees (F) over large sections of Greenland’s Jakobshavn glacier. Melt level readings over a region that has now experienced ongoing surface ponding for more than 60 days.

But these warm temperatures, providing yet more heat forcing to melt the ice, aren’t the only extreme weather factor for the Jakobshavn glacier today. For today has brought with it a warm, wet over-riding airmass emerging from Baffin Bay and the Atlantic Ocean to the south. The warm air, coming into contact with the cooler glacier air is condensing and disgorging a series of rainstorms, dumping above-freezing water into the Jakobshavn’s already swelling pools.

Some of these effects are directly visible in the LANCE MODIS satellite imagery provided by NASA.

Glacial melt ponds are indicated in the satellite shot below by light-to-dark blue splotches on the glacier surface. Shallow surface melt ponding and pooling is indicated by a thin skein of light blue. In the left frame below, you can see the extensive and large melt ponds in the region of the Jakobshavn Glacier on August 18, 2014. For reference, the largest of these ponds are between 2 and 4 kilometers across. Also note the pale blue color of the ice near the larger ponds, indicating extensive smaller ponds in the region.

In the right frame, we have today’s LANCE-MODIS satellite shot. You will note that the entire frame is covered by cloud but that you can still see the blue undertone of the melting glacier below the rain-bearing clouds.

Melt Ponds, Jakobshavn August 18Rain over Melt Ponds

(LANCE MODIS satellite shot of the Jakobshavn Glacier on August 18 [left frame] and August 20 [right frame]. Note the widespread melt ponds and blue ice indicating smaller ponds over the glacier structure. Image source: LANCE MODIS.)

Assessing Glacial Outburst Flood Risk

Some day, as Greenland continues to warm under the human heat forcing and as more hot air invasions ride up over the ice sheet, a period of warmth followed by rainstorms may well set off a major outburst flood event. The water content in melt ponds over the glacier may well be far greater than what we see now and a series of over topping events, starting higher on the ice sheet and magnifying toward the ice sheet base, would set of a chain of events leading to such a flood.

Risks for this kind of event today may well be moderate to low. The glaciers at this point are craggy and much of the flood waters shunt through holes in the ice to water pockets or to the glacier base. But eventually, as the glacier contains more water through subsequent years of melt, flooding and damming will be more prevalent throughout the ice sheet. And so risks will likely be on the rise.

Other than similar events occurring in the Himilayas, we don’t really have much of a context by which to judge risk for large Greenland outburst flood events. We do know that melt ponding is now quite extensive in this region and we do know that the glacier itself is rather unstable — moving with rapid speed toward the ocean and containing pockets of melted water from past melt pond formation over the last two decades.

For today, I’m pointing out the current rainfall over ice and melt ponding event as part of a larger and dangerous trend, one that is likely to play a primary role in the pace and violence of Greenland melt going forward.

zodiac on greenland melt pond

(Photograph of a zodiac on the surface of one of Greenland’s very large melt ponds. Image source: Earth Observatory.)

Links:

University of Maine’s Climate Reanalyzer

LANCE MODIS

The Glacial Megaflood