

(Upper ocean heat anomaly map for 2002 through 2011 shows extreme global heating of the upper ocean during the past decade. Image source: Quantifying Underestimates of Long-Term Upper Ocean Warming.)
2 Degrees Celsius. That’s the ‘safe limit’ for human warming now recommended by the IPCC. But under current human greenhouse gas heating of the atmosphere and oceans, 2 C is neither safe, nor the likely final upper limit of the warming we will probably eventually see.
In the push and pull between all the various political and scientific interests over setting these goals and limits, the glaring numbers really jump out at the wary analyst. One is the total heat forcing now being applied to the atmosphere by all the greenhouse gasses we’ve dumped into the air over the years and decades. That total, this year, rose to a stunning 481 parts per million CO2 equivalent. And if we look at paleoclimate temperature proxies, the last time the world’s atmosphere contained 481 parts per million CO2 was when temperatures were in the range of 3-4 degrees Celsius hotter than we see today.
It takes time for all that extra heat to settle in, though. Decades and centuries for ice to melt, oceans to warm and the Earth System to provide feedbacks. So what scientists are really concerned with when it comes to recommending policy is how much warming is likely to occur this century. And, for this measure, they’ve developed a broad science for determining what is called Equilibrium Climate Sensitivity (ECS).
ECS is sensitivity to a given heat forcing that does not include the so-called slow feedbacks of ice sheet and ocean responses. For this measure, 481 ppm CO2e gets us to around 1.8 degrees Celsius warming this Century — if the Earth System and related so-called slow feedbacks are as slow to respond as we hope they will be…
Earth System Warming Far Faster Than Expected
Earlier this week, a new study emerged showing that the world was indeed warming far faster than expected. The study, which aimed sensors at the top 700 meters of the World Ocean, found that waters had warmed to a far greater extent than our limited models, satellites, and sensors had captured. In particular, the Southern Ocean showed much greater warming than was previously anticipated.
Winds and a very active downwelling, likely driven by a combined freshening of water near Antarctica and an increased salinity due to warming near the equator, drove an extraordinary volume of heat into these waters. An extra heat in the oceans that was 24 to 58 percent higher than previous estimates. An extraordinary rate of uptake earlier measures had missed.
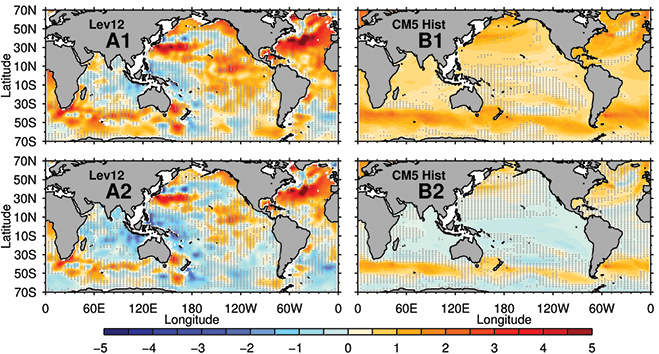
(Upper ocean heat content trends from 1970 to 2004. Note the extraordinary amount of heat being forced into the Southern Ocean near the 50 degrees South Latitude line. This heat forcing is likely due to increased storminess and ocean circulation-driven down-welling related to effects driven by human caused climate change such as increased glacial melt in Antarctica and increased sea surface salinity near the equator. Image source: Quantifying Underestimates of Long-Term Upper Ocean Warming.)
This observation led New Scientist to make the following rather blunt statement:
It’s worse than we thought. Scientists may have hugely underestimated the extent of global warming because temperature readings from southern hemisphere seas were inaccurate.
The implications of finding this extra heat are rather significant. For one, it upends current Equilibrium Climate Science. Gavin Schimdt — Chief NASA GISS scientist — over at RealClimate, noted that the study’s findings would increase ECS ranges from 1.1 to 4.1 C to 1.1 to 4.7 C (a 15% percent increase by Gavin’s calculation). This increase shows that the Earth System may well be both far more sensitive to current human heat forcing and may well be likely to warm far faster this century than scientists had previously hoped. For broader context, it’s worth noting that the scientific community generally considers ECS to be in the range of 1.5 to 4.5 C (3 C average). And any analysis of the new findings is likely to push sensitivity to the higher range of these scales.
Dr Wenju Cai from CSIRO in Australia added by noting that the results mean the world is warming far faster than we thought:
“The implication is that the energy imbalance – the net heating of the earth – would have to be bigger,” he says.
Higher rates of Earth Systems responses to human heat forcing this century and a larger net energy imbalance in the global system together spell very bad news. What this means is that there is both more heat forcing now than we at first expected and that that heat forcing is likely to bring about more extreme climate consequences far sooner than we had initially hoped.
These findings are new and will take some time to ring through the scientific community. And though this study provides a more complete picture of how rapidly the Earth is warming and where that heat is going, we are still missing another big part of the puzzle — what is happening to the deep ocean. Recent studies by Trenberth hint that that region of the climate system is also taking up extra heat very rapidly. So, hopefully, more exact measures of the total ocean system can give us an even better idea of how the Earth System is responding to our insults.
Yet again, we have another study showing clearly that conditions are today worse than we previously expected. How we can continue to do things like build coal plants and plan to burn oil and natural gas throughout the 21st Century is beyond imagining. But here we are…
Links:
Quantifying Underestimates of Long-Term Upper Ocean Warming
The World is Warming Faster Than We Thought
Different Depths Reveal Ocean Warming Trends
Climate Responses From Lewis and Curry
Hat Tip to Colorado Bob
Hat Tip to Bassman


rayduray
/ October 8, 2014Scientific American/ClimateWire has an article germane to this topic.
“Mystery of Ocean Heat Deepens as Climate Changes”
http://www.scientificamerican.com/article/mystery-of-ocean-heat-deepens-as-climate-changes/
***
OK, I’ll admit it. I’m thoroughly confused by all this speculation about where the heat is hiding (it’s now 15 degrees F. above normal here in Cent. Oregon, hiding in plain sight). Altogether, I’m just amazed at the band of warming water at 50 degrees south latitude. Whodathunkit? When I consider the different responses of the northern versus southern oceans, I’m feeling particularly bipolar.
LikeLike
robertscribbler
/ October 9, 2014In this case, the surface waters are colder, due to the effect if down-welling and the fresh water wedge. But if you take a slice of the ocean to 2,000 feet, you see the effect of that down welling — taking atmospheric heat and transferring it to the upper ocean. The heat transfer probably extends to the deeper ocean as well. And we have some evidence of that from the Trenberth papers.
This extra upper ocean warming is not good news.. A primary driver to the glacial melt we’ve seen. And certainly a danger to shallower ocean clathrates — where they do form at higher depth.
LikeLike
bassman
/ October 9, 2014Here is a good quote from rayduray’s Scientificamerican article echoing what Robert said in this post:
“Durack and his colleagues at LLNL found that the Southern Hemisphere’s oceans have warmed at a higher rate over the past 35 years than previously thought.
If that is true, the repercussions would be huge. It would mean that scientists have missed accounting for a portion of the heat resulting from human emissions. Scientists have calculated that a doubling of carbon dioxide concentrations would warm the planet by 1.5 to 4.5 degrees Celsius. Durack’s results would place the planet’s sensitivity to CO2 toward the higher end of this range.”
LikeLike
robertscribbler
/ October 9, 2014ESS is 5-6 C for a CO2 equivalent doubling. Eventually the models will figure that out once there’s a wide enough observational net cast.
I’ve talked to scientists on the issue of ESS and the paleoclimate proxy data on numerous occasions. The ESS guys get it. The paleoclimate guys get it. Many of the modelers just say that the error bars are too high in the proxy data. But the model data is incomplete.
LikeLike
mikkel
/ October 9, 2014Robert, I feel more and more strongly that ESS is completely justified (and also “ironically” happens to be the directly calculated CO2 greenhouse effect from basic physics) and focus on sensitivity is doing a disservice. I’m starting to wonder if the focus on the arbitrary date of 2100 is doing more harm than good, in the sense that it is still too far away for most in power to cognitively care, but the projected global effects don’t *sound* that bad. A few feet in SLR doesn’t sound catastrophic (regardless of the reality) but 40-60 feet sure does!
Is there any justification for the community to focus on transient sensitivity other than being ‘conservative?’
LikeLike
robertscribbler
/ October 9, 2014The state of the science from decades ago was such that we needed highly simplified models to show a forecast for warming. And those models have been quite accurate for establishing a rage of short term warming potentials. Where the simplified models are more fuzzy is in the middle to longer term picture, where the heat goes, what the carbon feedbacks look like, and how fast/slow the oceans and the ice sheets respond. Many of these measures are based on the identifiable physical elements that can be plugged into ECS based constructs. But the constructs are limited based on current observation.
I’d say the science is reticent and cautious and doesn’t want to over step or over state.
LikeLike
bassman
/ October 9, 2014Rayduray, not to distract from this great post by Robert but here is the perfect explanation to your question. Its worth the read:
http://scienceblogs.com/gregladen/2014/10/07/what-is-the-role-of-the-deep-ocean-in-global-warming-climate-science-deniers-get-this-wrong/
Robert, great post, thanks for the mention. Not sure if this was ever mentioned by anyone but it also has some great material (utterly clueless how this escaped by attention). Published by Trenberth, talks about seasonal changes with the PDO and la nina like conditions
It was published in Nature this september:
http://www.nature.com/nclimate/journal/v4/n10/full/nclimate2341.html
LikeLike
robertscribbler
/ October 9, 2014Interesting, so if this theory is correct, we should see the planetary wave patterns flattening out as the trades weaken and as PDO flips to positive?
Not seeing that now or last year as PDO edged further into positive territory.
LikeLike
rayduray
/ October 9, 2014Thanks for the link.
LikeLike
Jay M
/ October 9, 2014how do you create a planetary balance–carbons been sequestered long time as terrestrial life has progressed, based upon a lower profit (algae prototype?) Boosted proteins will still require recycling potassium and phosphorous through ambivalent regulatory regimes that recognize that the system is overwhelmed by the peak flow that may occur.
LikeLike
robertscribbler
/ October 9, 2014The stored carbon feedback varies based on the magnitude of the initial forcing.
LikeLike
marycheshier
/ October 9, 2014Thank you for the very insightful post!
LikeLike
utoutback
/ October 9, 2014I’m curious how the deep ocean heating and fresh water capping around Greenland and the Antarctic will effect the deep ocean conveyor currents. My suspicion is that we are in line to experience some significant climate disruptions. Not necessarily “the little ice age” but on that scale.
Any comments?
LikeLike
robertscribbler
/ October 9, 2014The currents will almost certainly experience severe disruption and the weather will probably be terrible cone mid century. Though the swings in weather will probably be strong, the human heat forcing is more than strong enough to enforce a continued net warming. Ice ages of any kind are a thing of the past.
LikeLike
james cole
/ October 9, 2014That is a point many forget. That Human Induced CO2 heat trapping has now loaded the climate to where a coming Ice Age will not be able to develop. If you think about that, in geologic times scales, it is mind blowing. That we humans have turned of the natural cycle back towards a high tide in the ongoing Ice Ages. If I am correct, we are in an Ice Age now, but it is just that the tide is out at the moment, and natural cycles would return the Ice Sheets in a short time scale in geologic terms? I am fascinated by the forces that drove earth to be in this repeating ice cycle, and that humans can short circuit it all, so to speak.
LikeLike
utoutback
/ October 9, 2014I did not mean to imply cooling, as much as diruption of predictable patterns.
LikeLike
robertscribbler
/ October 9, 2014The studies by Hansen in particular showed quite a bit of disruption along these lines.
LikeLike
Andy in San Diego
/ October 9, 2014Exporting our madness to China, and they’re loving it. China is diving in the deep end on fracking. And if you think we have side effects like ground water pollution, just wait to see what they can accomplish with zero oversight on this drilling, injecting, dumping activity.
They do have to scale back the coal usage, but they’re trading one monster for another. What is left of their ground water looks to get destroyed, and who knows what other festive side effects will arise from this.
http://climatedesk.org/2014/09/deep-inside-the-wild-world-of-chinas-fracking-boom/
LikeLike
Andy in San Diego
/ October 9, 2014After reading this article twice, I am left with a puzzling conundrum that I suspect has a nasty answer.
We are pumping our fracking effluent into old abandoned wells as we have globs of them. China does not, so where will their fracking waste go? Rivers & stream? Dumped on the ground?
With corruption and weak oversight this can get hazardous quickly, especially as they’re embracing and engaging in Fracking at “China speed”.
LikeLike
robertscribbler
/ October 9, 2014We have a bad methane leak problem here. You can probably multiply that by 2 or 3 for China once you consider the lack of oversight.
LikeLike
robertscribbler
/ October 9, 2014There’s more than enough nat gas out there to keep wrecking the climate system. Sure. It’s better than coal. But if you’re going to spend funds on a transition, you might as well just go all the way.
This is one point where I completely disagree with Obama.
LikeLike
Apneaman
/ October 9, 2014It’s like switching from heroin to opium and bragging about it.
LikeLike
robertscribbler
/ October 9, 2014We build these nat gas plants and we lock in their emissions for the next 40 years at least. In some cases, we will lock in emissions for nearly a century. We shouldn’t be locking in any new emissions at all. We should be curtailing the current fleet of fossil fuel emitting industry and not building new fossil fuel emitting sources.
It’s just a massive mistake.
LikeLike
Polina Karkina
/ October 9, 2014Why do you say that CO2 rose to 481 PPM when maximum was 401 in June this year? Is it a typo or I misunderstand something?
LikeLike
robertscribbler
/ October 9, 2014CO2 equivalent heat forcing. It’s the total greenhouse gas measure including methane, nitrous oxides and other greenhouse gasses on top of CO2.
So if you add the radiative forcing of all these gasses together with CO2, you get a 481 CO2e forcing at the top of the atmosphere.
It’s worth noting that though CO2 is the primary driver, these other gasses provide a pretty significant addition as well.
LikeLike
Polina Karkina
/ October 10, 2014Thank you for explanation, I should’ve guessed of course.
LikeLike
robertscribbler
/ October 10, 2014No worries 🙂
LikeLike
todaysguestis
/ October 9, 2014PIOMAS September 2014
– A reprieve?
http://neven1.typepad.com/blog/2014/10/piomas-october-2014.html
LikeLike
joni
/ October 9, 2014I don’t think so just yet because this ice is young and lacks the staying power of multi-year ice and it would be largely wiped out if melt conditions are comparable to those in 2007 or 2012 in either 2015 or 2016.
LikeLike
robertscribbler
/ October 9, 2014A calm before the next storm.
LikeLike
robertscribbler
/ October 9, 2014So PIOMAS has returned to the linear base line for the long term melt trend. And if you look at the ice, the only region showing real ‘recovery’ is the Central Arctic. Looks a bit like a final stand…
Between the linear and the exponential we are looking at 2017 to 2035. Into this equation we need to add the value of increasing fresh water outflows from Greenland and from swelling Arctic rivers.
The decline will probably be anything but clean and clear…
LikeLike
Nancy
/ October 9, 2014I wonder………at what point do the deniers start to worry? They cannot possibly read this information and continue to live in their la-la land of climate change denial. Even deniers have feelings for their children and grandchildren. Will it take a category 6 hurricane in their neighborhood to change their beliefs?
Thank you, Robert, for keeping us up-to-date on the science!
LikeLike
Andy in San Diego
/ October 9, 2014Nancy, you would be stunned at the denial bubble they surround themselves with. All you have to do is read the comments following an article, or grit your teeth and read a few pieces that they shove into the news sphere (google news->climate change). I do this a few times a week just to gauge what new straw they are clutching at.
Many times I thought about evidence that is irrefutable and assumed that people would accept what is obvious. I’ve been left disappointed every time.
ie: This years “mystery holes” in Siberia. They ejected material, thus something inside those holes left in a hurry. The methane concentration in those holes was over 10% (kills a person + flammable). It seems pretty logical what it is. So the denial-sphere declared these as simply “pingos” (frost heaves). Pingo’s don’t eject material, nor contain methane. These common sense facts are immaterial to them. If one ignores the methane, ejecta, missing mass then one can declare these as giant gopher holes or whatever.
Or take their never ending “no warming since 1997” schtick. They chose 1997 since was an extreme El Nino. Had they chosen any other year in the past 30 to 40 years, the bit doesn’t work. Also the hottest years are in the past decade, thus their original statement is still false.
Or, one of my fav’s. It has been colder & hotter in Earths past, thus humans don’t cause the warming. Using the same logic on can say “there were forest fires before humans, thus humans don’t cause forest fires”.
Another classic is “because al gore’s house is XXXX square feet, global warming is a scam”. I ponder how the house of one person controls the global climate. Last time I checked, the climate really doesn’t care where or how he or anyone lives. It simply responds to forcing (multiple).
You can’t reason with them. Reply to any of their bits on a comment thread with non-shrill, calm statements of facts, link to evidence and in return they instantly devolve into ad hominum attacks. They can’t discuss with facts, as the facts disagree with them.
They “want” it to “not be so” so bad, they are willing to ignore logic and the laws of physics. I wish they were right, however the laws of physics disagrees with them. And I will listen to / respect the laws of physics over any opinion, including mine.
LikeLike
robertscribbler
/ October 9, 2014The root causes of climate change denial:
1. Fox News 😉
2. Unwilling to deal with the problem.
3. Unwilling to accept some responsibility for the problem.
4. Unwilling to change behavior
5. Unwilling to accept that current lifestyle is harmful
6. Unwilling to accept the existence of a problem that requires collective action to solve
7. Unwilling to believe that humans could wreck the world and not God (my opinion is that God has been taking the blame for humans wrecking things for some time now).
8. Because their current level of wealth depends on not working to actually solve climate change.
9. Pure unadulterated ignorance (see 1).
10. Unwillingness to help poor people who are perceived to be the most immediately under threat by climate change.
11. Unwillingness to talk about issues that don’t provide some direct and immediate benefit (perceived or real) to them.
12. Skeptical and contrary to a fault.
13. Brainwashed right wing ideologue (see 1 and 9).
14. Holds religious beliefs that are incompatible with scientific fact.
15. Fossil fuel centric worldview (you can only run economies on oil, gas, and coal),
LikeLike
Neil Gundel
/ October 12, 2014I think most deniers fall in that category because they don’t want to believe that their party’s candidates are all lying to them. It’s the GOP (Grumpy Old Pollutocrats).
LikeLike
robertscribbler
/ October 9, 2014I think the deniers will look increasingly silly as time goes forward. Ironically, the luke warmers will probably end up in the same boat.
LikeLike
Apneaman
/ October 9, 2014The more prominent one’s, like dim watt, will be offered up as scapegoats by their masters. It’s standard procedure from the ruling class play book.
LikeLike
JPL
/ October 9, 2014It is largely irrelevant whether or not the ‘deniers’ ever come around. Only those with the intellectual curiosity (and capacity, frankly) to zoom out and connect the dots will be in a position move the ball forward on this issue. Its admirable that folks take the time to brave the vitriol and post science-based responses on the blogs you’re describing. Some readers will pay attention and leave with more information than they came with. Some will go back to rolling coal…
In contrast, you have this site: an oasis of scientific discovery and information, fearlessly moderated. For that I am most appreciative, Robert!
John
LikeLike
robertscribbler
/ October 9, 2014No equal time for nonsense here 😉
LikeLike
Apneaman
/ October 9, 2014“Even deniers have feelings for their children and grandchildren.”

That is very true, but so did most of the Nazi’s and it never made a dent in their ideology. In addition, the Germans were some of the most well educated people on the planet. It’s been clearly demonstrated that a high degree of intelligence simply makes one better at rationalizing any and all beliefs and behaviors. People think and act in a way that soothes their emotions in the here and now even when it’s contradictory to what they say and goes against their long term interests.
LikeLike
Andy (at work)
/ October 9, 2014Greenland melt extent is outside the +-2 std dev and looks like has been since approximately the beginning of the month. If you look at the 1981-2000 average line, it is melting at the average rate normally seen in mid/late August.
http://nsidc.org/greenland-today/
LikeLike
robertscribbler
/ October 9, 2014Been watching this. Strong Greenland heat at the moment.
LikeLike
Colorado Bob
/ October 9, 2014Acid damage to coral reefs could cost $1 trillion
Ocean acidification is set to cost us $1 trillion by 2100 as it eats away at our tropical coral reefs.
That’s the warning from a report released today by the United Nations Convention on Biological Diversity, which assesses the economic impacts the problem could have.
The ocean’s pH is now 8.0, down from 8.1 in the mid-18th century. Because the pH scale is logarithmic, this change means that, over the past 250 years, the world’s oceans have seen a 26 per cent increase in acidity – a result of the oceans absorbing about a quarter of our carbon dioxide emissions.
With ocean pH projected to dip to 7.9 by the end of the century, the oceans may soon be 170 per cent more acidic than they were before the industrial revolution – a change that is likely to affect not just our ecosystems, but our economies too.
http://www.newscientist.com/article/dn26344-acid-damage-to-coral-reefs-could-cost-1-trillion.html#.VDanTBaCe2c
LikeLike
Colorado Bob
/ October 9, 2014When sea levels rise, high tides will spill into communities far more often, study says
Daily flooding caused by high tides will occur in the District and Annapolis within three decades as sea levels continue to rise due to global warming, a new study says.
The study by the Union of Concerned Scientists predicts that by 2045 the nation’s capital and the capital of Maryland will experience about 400 floods per year, sometimes twice in a single day, and several other cities and towns on the Atlantic coast will have tidal flooding almost as bad.
Miami, Atlantic City, Cape May, N.J., and Lewisetta and Windmill Point, both on the Chesapeake Bay in Virginia, can expect at least 240 days of flooding by 2045.
http://www.washingtonpost.com/national/health-science/when-sea-levels-rise-high-tides-will-spill-into-communities-far-more-often-study-says/2014/10/07/57723596-4d8c-11e4-babe-e91da079cb8a_story.html
LikeLike
robertscribbler
/ October 9, 2014A rather stark prediction based on current and probably somewhat conservative predictions for SLR.
LikeLike
Colorado Bob
/ October 9, 2014Global warming impacts the Russian North’s ecosystem
The average temperature on the Kola Peninsula in the northwestern part of Russia increases every 10 years by 0.6 degrees. Meteorologists have been registering these changes for the last 40 years. Throughout 2014 the temperature was higher than the climatic norm. “We are now witnessing a stable climate warming, and on the Kola Peninsula its speed is a bit higher than in the rest of Russia,” said Yelena Siekkinen, a senior meteorologist at the Murmansk Hydro-meteorological Center. “Up north on the Spitsbergen Archipelago the warming is even more apparent. In February 2014 the temperature strayed from the norm by 12 degrees. We had never seen such an aberration.”
Source: Russia Beyond the Headlines – http://rbth.com/science_and_tech/2014/10/08/global_warming_impacts_the_russian_norths_ecosystem_40449.html)
LikeLike
RWood
/ October 9, 2014Re: deniers, pounding sand, something with a rope, and get the Lord’s (Parliamentary — but those titles do reverbrate) name!
http://www.desmog.uk/2014/10/02/time-teach-lord-leach-about-climate-science
LikeLike
robertscribbler
/ October 9, 2014Well, we can go through and debunk these one by one. But as is the case with most deniers, it’s lack facts or loosey goosey ‘facts’ all the way…
LikeLike
Marco
/ October 9, 20141.1 to 4.7, not 6.1
Published two days before you posted this blog. Makes quite an impact.
LikeLike
robertscribbler
/ October 9, 2014Got it, Marco. Thanks for the spot.
LikeLike
RWood
/ October 9, 2014If of interest:
Apply to:
“Join the CoCoRaHS Network” as there will be a webinar for members on “Atmospheric Rivers”
LikeLike
Andy in San Diego
/ October 9, 2014Very timely.
Have you seen the breakdown in the atmospheric rivers in the Amazon? The lack is a major source of the drought in southern Brazil.
LikeLike
RWood
/ October 9, 2014No, Andy, I haven’t seen a specific indication of these “drying rivers” but I’ve read of their loss and potential effects here. What is a good source?
LikeLike
Andy (at work)
/ October 9, 2014I’m at work atm, when I get home I’ll dig up a decent piece on it I found a week or 2 back. I’ll reply on this thread this evening.
LikeLike
Andy in San Diego
/ October 10, 2014RWood,
In Brazil it is called the “Sky River”. Here is a piece on the deforestation impact on it. A single tree contributes 1000 litres/day to this moisture. As the trees go, so does the sky river.
http://news.nationalgeographic.com/news/2009/12/091217-amazon-flying-rivers-climate/
LikeLike
robertscribbler
/ October 10, 2014And that’s how a forest becomes a desert…
LikeLike
Ouse M.D.
/ October 9, 2014I think it’s irrelevant if 4,7 C or 6,1 C.
Those are both extinction levels.
This October is so hot, I1ve never experienced anything like it- nights, as the gound gives away all that heat it’s accumulated over the sunny day- that You sweat and the car’s windscreen keeps constantly being bleaked with water vapor. And the MSM- controlled blinded masses are cheering for another “wonderful, sunny day”…
There’s gonna be 3-4 types of basic behaviors as full chaos will unload:
1) aggression (partly rightful) toward political and economic leaders
2) denial and further denial
3)hey it’s all over- let’s party then!
4)desperate attempts to fix everything in the last remaining moments
But it seems to me Prof. Dr. Guy McPherson had it right all along….
LikeLike
robertscribbler
/ October 9, 2014Guy is a decent fellow. At least he pushes for action even when he’s not sure it will help.
Where are you from?
LikeLike
Colorado Bob
/ October 9, 2014A new study of satellite data by scientists at NASA and University of Michigan One shows that one small “hot spot” in the American Southwest produces the greatest concentration of the greenhouse gas methane in the United States.
According to lead study author Eric Kort of the University of Michigan, Ann Arbor, the imaging predates the widespread use of fracking nearby. “This indicates the methane emissions should not be attributed to fracking but instead to leaks in natural gas production and processing equipment in New Mexico’s San Juan Basin, which is the most active coalbed methane production area in the country.”
The data shown by NASA satellites indicates that the levels of methane present there are more than triple the standard ground-based estimate.
http://boingboing.net/2014/10/09/this-one-u-s-hotspot-produces.html
LikeLike
robertscribbler
/ October 9, 2014“The imaging predates the use of widespread fracking..”
LikeLike
dtlange
/ October 10, 2014Yes, the NASA press release states: “… This indicates the methane emissions should not be attributed to fracking but …
Natural gas is 95-98 percent methane. Methane is colorless and odorless, making leaks hard to detect without scientific instruments.
“The results are indicative that emissions from established fossil fuel harvesting techniques are greater than inventoried,” Kort said. “There’s been so much attention on high-volume hydraulic fracturing, but we need to consider the industry as a whole.”
Coalbed methane is gas that lines pores and cracks within coal. In underground coal mines…”
“Fossil fuel harvesting techniques… consider the industry as a whole”, I like that descriptor.
LikeLike
robertscribbler
/ October 10, 2014Full cycle methane emissions from shale gas (fracking) vs conventional gas are 30 to 50 percent greater:
Click to access Howarth_2014_ESE_methane_emissions.pdf
This is 2012 data.
So are we using a 2005 anecdotal satellite photo to declare that the opposite is true?
The issue is not that infrastructure leaks. Of course it leaks. The issue is that shifting to shale gas fracking is no solution to climate change. And it wouldn’t be even if the infrastructure didn’t leak methane at all:
http://www.ucsusa.org/climate-risks-overreliance-natural-gas-electricity-2013#.VDgdohawTMw
We need to start thinking in terms of how we can shut down the entire fossil fuel based industrial chain. Starting with coal is good. But building in a new reliance on natural gas that will last at least 40 years is a terrible idea. We should be building renewable infrastructure as 100% replacement sources. Otherwise there is no way out of this climate nightmare we’re making worse with each passing day.
LikeLike
Colorado Bob
/ October 9, 2014Lot of fussing about the sea ice this year at the bottom of the world –
Just remember this paper from 6 weeks ago :
Rapid sea-level rise along the Antarctic margins in response to increased glacial discharge
The Antarctic shelf seas are a climatically and ecologically important region, and are at present receiving increasing amounts of freshwater from the melting of the Antarctic Ice Sheet and its fringing ice shelves1, 2, primarily around the Antarctic Peninsula and the Amudsen Sea. In response, the surface ocean salinity in this region has declined in past decades3, 4, 5, 6, 7, 8, 9. Here, we assess the effects of the freshwater input on regional sea level using satellite measurements of sea surface height (for months with no sea-ice cover) and a global ocean circulation model. We find that from 1992 to 2011, sea-level rise along the Antarctic coast is at least 2 ± 0.8 mm yr−1 greater than the regional mean for the Southern Ocean south of 50° S. On the basis of the model simulations, we conclude that this sea-level rise is almost entirely related to steric adjustment, rather than changes in local ocean mass, with a halosteric rise in the upper ocean and thermosteric contributions at depth. We estimate that an excess freshwater input of 430 ± 230 Gt yr−1 is required to explain the observed sea-level rise. We conclude that accelerating discharge from the Antarctic Ice Sheet has had a pronounced and widespread impact on the adjacent subpolar seas over the past two decades.
http://www.nature.com/ngeo/journal/v7/n10/full/ngeo2230.html
LikeLike
Colorado Bob
/ October 9, 2014A word about the acid ocean story today –
How do we know the oceans are getting more acidic ?
Foraminifera have raining down on the sea floor since the at least Cambrian, their shells (tests) are composed of calcium carbonate.
We understand them very well , just ask the oil companies.
When someone says the ocean was less acidic 150 years ago , there are ” foram” shells to compare to the modern ones of the same type.
And that chemistry does not lie.
By the way , there over 10,000 types of
Foraminifera, and only (1,837) are fossils, so they have seen pretty much everything. And all those changes are logged in their “tests” .
The limestone that makes up the pyramids of Egypt is composed almost entirely of nummulitic benthic Foraminifera.
LikeLike
Colorado Bob
/ October 9, 2014The limestone that makes up the pyramids of Egypt is composed almost entirely of nummulitic benthic Foraminifera.
We could sample the limestone in the Great pyramid and compare it to today’s forams. that are direct descendants.
When geologists speak of the rocks being pages in a book , Foraminifera are the words in the sentences on those pages.
LikeLike
robertscribbler
/ October 10, 2014Amazing record in the forams.
LikeLike
Colorado Bob
/ October 10, 2014There is a great deal of climate science based on these tiny creatures, and oil companies have found billions of barrels because of the science around them. Which means that the science is pretty much bullet proof.
Forams were the reason we moved into deep sea drilling. They are one of the most important clues in deep drilling . And they live in certain temperature ranges at the sea surface.
So when someone questions the acid and heat content of today’s oceans , instruct them about the study of forams . Because the oceans heat and acid has been recorded since Cambrian explosion in Foraminifera .
LikeLike
RWood
/ October 10, 2014I may not have much response — but that indication of highest US methane releases contains a map in the comments that shows 2005 global measures. And if anyone is still reading, the bluest area is …
Howcum?
LikeLike
Colorado Bob
/ October 10, 2014As a system nears it’s tipping points , it moves to it’s extremes .
Yesterday, the Dow had the largest gains of the year. Today, the largest loss of the year.
LikeLike
robertscribbler
/ October 10, 2014Coal stocks taking a series hit. Good news in my view.
LikeLike
dtlange
/ October 10, 2014Right, CB. As a system nears it’s tipping points , it moves to it’s extremes.”
This applies to nature too, and its “systems”. I’ve been watching with alarm how many natural cycles and rhythms no longer change, or move, in gradations — they’re either rapid to extremes, or turbid.
Anyways, great phrase, CB.
LikeLike
Neil Gundel
/ October 12, 2014I have seen this report, as well as another one saying that the deep ocean has warmed less than previous estimates had suggested. That other report stated that rising sea levels due to thermal expansion were consistent with existing estimates of aggregate ocean warming.
Do the results of this study contradict that conclusion, or is it possibly just adding evidence to the notion that the heat uptake is just staying closer to the surface?
LikeLike
robertscribbler
/ October 12, 2014Trenberth found more heat than expected in the upper half of the ocean at 700 meters and above. Levitus et all also found that the upper ocean continued to warm rapidly. The new Stark study found more heat than expected in the upper ocean by a margin of 24 to 55 percent — a much stronger upper ocean warming than expected.
We have a new NASA study that shows the ocean below 700 meters has taken up little to no heat, but the stronger pace of upper ocean warming more than makes up for that. To this point, there has been some confusion among the papers as some have included depths at 400 meters and below among the deep ocean values (which would show deep ocean warming by that standard).
We also have more rapid SLR in the Southern Ocean that is consistent with both a greater thermal expansion of the upper ocean and higher melt outflows from Antarctica.
LikeLike
robertscribbler
/ October 13, 2014More to the point of your initial question…
We have some new studies showing that the southern ocean is showing a greater thermal expansion than expected which is consistent with the article posted above.
For now, I think the race is still on to put all the pieces together but it’s fair to say we probably have a bit more SLR due extra upper ocean heating. Also, it appears that a substantial amount of heat energy is going toward melting ice. That factor hasn’t been fully assessed as yet and will probably help flair iffy the issue.
For uncertainties, we have–
1. Amount of ocean heat uptake.
2. Amount of energy going to heat ice.
3. Amount of aerosol negative feedback.
As the major issues we are trying to pin down RE ‘missing heat.’
Overall, if we look at paleoclimate, we see an ESS of 5-6 C for each doubling of CO2 equivalent forcing. For current climate, the polar carbon stores are likely to weigh heavily in this implied total.
One last point…
The climate change deniers have blown quite a lot of smoke RE the deep ocean piece while completely ignoring the new science RE the top 700 meters of the world ocean. To that point, they also completely ignore what the authors say about the deep ocean piece. Finally, it appears that they have again missed another hottest month on record…
LikeLike