Toasted — California’s 2017 Foreshadowing of the Monster Fires to Come

Part One: The Story of How Global Warming Turned California into Toast.

The Thomas Fire as seen by a webcam located atop Santa Ynez Peak, a 4300′ mountain 17 miles northwest of downtown Santa Barbara on December 10th.

*****

I want you to indulge me for a minute. I want you to put on your scientist hats with me and engage in a bit of an experiment.

Take a bagel. Cut it in half. Dip about 1/3 of it in water for a couple of seconds. Then put the bagel in the toaster oven for about 5-10 minutes. Remove and see the results.

What you’ll find is that the part of the bagel that hasn’t been dipped in water is, well, toast. The dipped part — significantly less so. If you continued to toast the bagel, eventually the heat from the oven will cause the undipped side to burn. Take even more time and the heat would overcome the moisture on the dipped side and cause it to burn as well.

Here was the result of my at-home experiment after about 10 minutes in the oven at 425 degrees. Can you guess which half was dipped in water?

The more heat, the faster both sides of the bagel burn. But the drier side always first. The wetter side always second.

It’s a simple fact that moisture — whether loaded into bagels or soaking into vegetation and the ground — adds more resiliency and resistance to fire. And this year, given the massive amount of moisture that fell across all of California during the winter and spring of 2016-2017 we didn’t really expect summer and fall to be all that bad of a fire season.

That famous Pineapple Express kept delivering storm after storm after storm. Dams were strained to bursting and over-spill. Roads were washed out. Water rescues were performed. And when all was said and done, California had experienced its wettest water-year in all of the last 122. Given such an obscene amount of water flooding the state, we certainly didn’t expect what happened next. All that moisture soaking into lands, soils, trees, vegetation told us a story. It told us a story that we thought we knew.

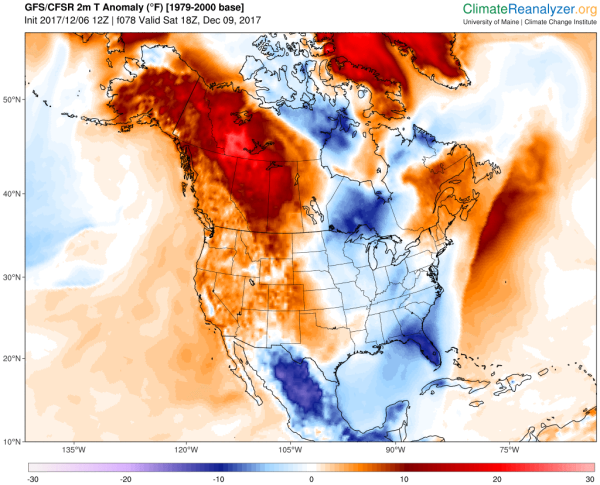
Accuweather’s California flood forecast from January 9, 2017 is easy to forget given the record fires we see today. But the temperature and moisture extremes experienced are an aspect of a warming climate. These floods inflicted more than 1.5 billion in damages. Source: Accuweather/Wikipedia.

What we didn’t count on was the oven-like heat that followed. Nor the simple fact that resiliency, no matter how strong at first, is not limitless.

Environmentally speaking, heat is the primary factor in fire hazard so long as fuels are present. Drought is also a factor, though a somewhat less certain one because eventually most fuels are consumed if drought sets in for long enough. As with the bagel, enough heat will eventually blast through any moisture loading so long as that moisture is not recharged to great risk of consuming and conflagrating the fuels that soaked up the moisture in the first place.

At its most basic level, this is why global warming promotes fire hazard. If you bake the forests, grasses and shrubs enough, they will burn.

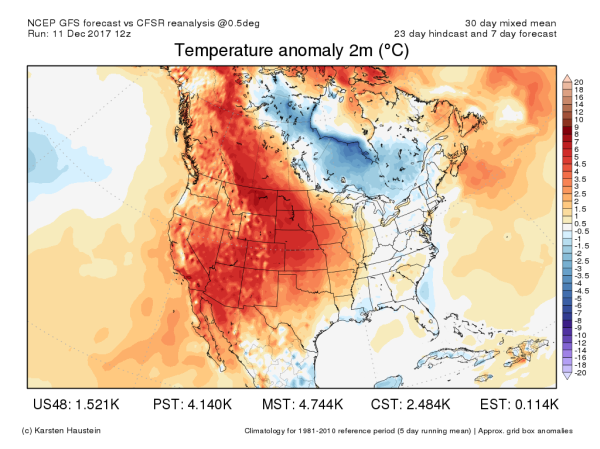
If there is one thing we know about climate change and weather it is that it promotes extremes. Particularly extreme swings between cooler+wet and record hot+dry as the water cycle is thrown through the atmospheric equivalent of a hyperloop. And the level of extremity California experienced from winter to summer ran a six month race from wettest to hottest. For following the early year deluge, 2017 rapidly rocketed into the hottest summer in California history. Temperatures in many places regularly soared to well above the scorching 100 degree mark. Records for all-time hottest days fell like trees before the wild hurricane.

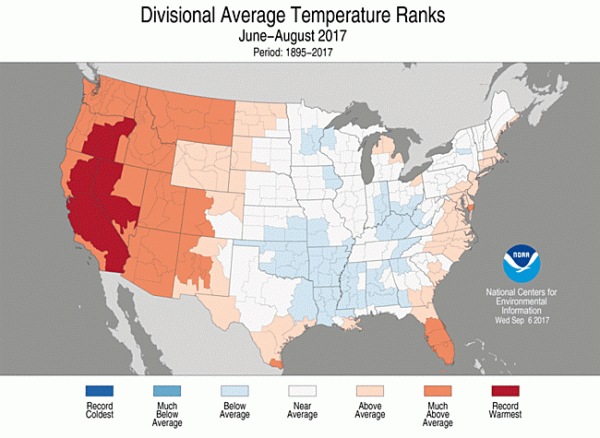
Large sections of the west, including California, experienced their hottest summer on record. Image source: NOAA.

And given so much excessive heat, it didn’t take long for the fires to arise even following a record wet winter.

We won’t go through all the exhaustive numbers of that grim tally of burning. But we will say that more than ten thousand homes and buildings burned. That many souls perished in the blazes. That billions in damages were inflicted. At times, ash and embers rained down across California as if from a volcanic eruption. The skies — marred by great pillars of smoke erupting from a blasted Earth. To say it was merely the worst fire year California has ever experienced would be to do the nightmare of it all an illiterate, unfeeling, lack-compassion injustice.

The summer fires that came with the heat burned mostly the north. The rains, that were so strong in winter took a bad turn once the heat blazed through the lands enough to dry out all that new forest and grass regrowth. Here we were witnessing, before our very eyes, the kind of new conditions 1.1 degrees Celsius worth of global warming was capable of producing.

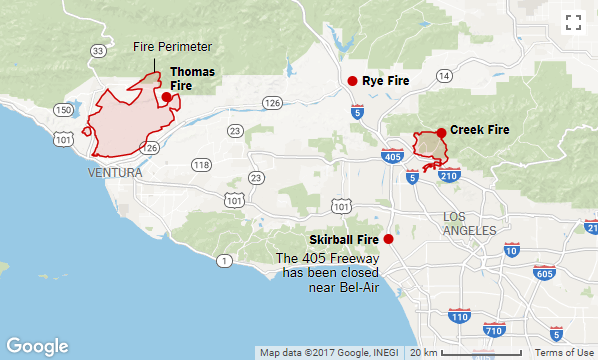
Firefighter battling the Thomas Fire, which is just 500 acres away from being the largest in California history. Image source: Campus Safety.

Because of that warming, we know now that fire season never really ends any more in California. A point that was driven viciously home as summer proceeded into fall and the fires still raged in October. By December, the heat and dryness had not relented. Not enough at least. The normally wet month had been transformed. And the carry over of that damage done by the furnaces of summer had prepped the land for more burning.

Howling winds from the longest burst of fire fanning winds ever seen for California fed into a new fire. A fire that is now within 500 acres of becoming the largest fire ever to burn in California history. In December. During what should be a wet, cool month. But one that is hotter and drier and fire blasted.

Toasted.

But if we don’t turn back from the warming that caused this, the worst is yet to come.

CREDITS:

Hat tip to Wharf Rat

Australia’s Hot Ocean Blob Fuels Record Heat, Extreme Weather, Risk to Coral Reefs

Between Australia and New Zealand there’s a kind of climate change fed thing on the prowl in the off-shore waters. It takes the form of an angry layer of far warmer than normal surface water. And it’s been lurking around since late November.

(A hot, angry blob of much warmer than normal ocean temperatures has erupted between Australia and New Zealand.)

We can see this disruptive beast pretty clearly in the sea surface temperature anomaly maps provided by Earth Nullschool. Today’s readings show temperatures in this new blob hitting between 3.5 and 4.2 degrees Celsius above average across a broad expanse of ocean.

That’s much, much warmer than normal for this region of water. A place where 2 degree above average sea surface readings would tend to be unusual. But with global temperatures now hitting between 1.1 and 1.2 C above 1880s averages, we’re starting to see the climate dice more loaded for these kinds of extreme events. To be clear, this is not the kind of extremity we’d experience in a world at 2 C warming, or 4 C warming, or 7 C warming. But we’ve moved up the scale and weather, temperature, and ocean environmental conditions are being harmfully impacted.

(The above graph shows how temperatures have shifted outside of 20th Century ranges. During 2014-2017, the world dramatically warmed — generating further rightward movement in the bell curve. Temperature has an impact on everything from drought, to the severity of thunderstorms, to the length and intensity of fire season, to the fuel available for the most powerful hurricanes, to algae blooms, to coral bleaching events. Image source: NASA GISS.)

Back on November 30th, the blob contributed to an extreme rainfall event impacting Southeast Australia. One that dumped upwards of 10 inches or more in a rather short period. Since that time, South Australia has been seeing continued instances of extreme weather. Over recent days, towering supercell storms rocked Victoria with lightning, flash floods, damaging winds, and golf-ball sized hail. In Melbourne, a flood washed away a 40 foot section of a foot path. Meanwhile western parts of Sydney Australia were sweltering under record-shattering heat — with temperatures hitting a never before seen high of 111 F (44 C) on Tuesday, December 19th. Other regions experienced over 113 F (45 C) temperatures.

(Hot ocean blob feeds record breaking heat across Australia on Tuesday. Image source: WindyTV.)

The off shore hot blob is laying its hot, moist tendrils of influence on these weather extremes in a number of ways. First the blob is belching an enormous amount of moisture into the atmosphere above the local ocean. This moisture is being cycled over SE Australia by the prevailing winds and is adding convective energy to thunderstorms. In addition, the blob is also contributing to a sprawling ridge of high pressure that sits squarely over top it. The ridge, in turn, is baking parts of Australia with record hot temperatures.

Hot ocean blobs like the thing off Australia are a feature of human-caused climate change in that ocean and atmospheric warming generates an environment in which these pools of excessive warmth are more likely to form. These are anomalous events that stretch or break the boundaries of past weather and climate patterns by adding unusual amounts of heat and moisture to local and region climate systems in the environments in which they form. A hot blob forming off the U.S. West Coast during 2014-2015 contributed to a number of climate change associated events like the severe California Drought, a ridiculously resilient ridge of high pressure, western wildfires, intense rains into Alaska and Canada and a number of mortality events among sea life that were triggered by heat, low oxygen content, or blooms of harmful microbes that thrive in warmer ocean environments.

Though short-lived in comparison to the Hot Blob that lurked off the U.S. West Coast for the better part of two years, the Australia-New Zealand blob is already having a variety of atmospheric and oceanic impacts. Notably, in addition to the wrenching influences on local and regional weather described above, the blob is also contributing to risks to Australia’s corals.

(NOAA’s Coral Reef Watch shows strong risk of coral stress continuing through March of 2018. The hot blob of ocean water off Australia is contributing to a situation where reefs like the GBR are again at risk. Image source: NOAA.)

Over the past two years, the Great Barrier Reef (GBR) experienced back to back bleaching events. These were the worst ever seen by the reef. And they were triggered by human-caused climate change. This year, in part due to the blob, risks to corals between Australia and New Zealand are again high. If the blob shifts north and west, then the GBR again falls under the gun. This time for a third year in a row. Notably coral reef stress warnings and alerts abound throughout the zone between Australia and New Zealand in NOAA’s Coral Reef Watch report at present.

Due to the potential to continue to contribute to various weather and ocean impacts, the present climate change influenced hot blob between Australia and New Zealand bears continued monitoring. It has, however, already generated a number of impacts. And it is likely that more will follow.

CREDITS:

Hat tip to Carolyn Copeland

Hat tip to Guy Walton

November of 2017 was the Third Hottest on Record Despite La Nina

According to NASA GISS, November of 2017 was the third hottest such month in the 137 year global climate record. This continues a trend of warming that began with fossil fuel burning at the start of the Industrial Revolution and that has recently hit new intensity during the 2014 – 2017 period.

NASA warming trend growing more extreme

(NASA color coded warming trend since 1901. Note the very extreme departures in the recent period since 2014. Image source: NASA GISS.)

Counting in November, 2017 is now solidly on track to be the second hottest year in the global climate record — trailing 2016 and edging out 2015. This new record was achieved despite the fact that La Nina emerged later in the year.

La Nina is a periodic cooling of Equatorial Pacific surface waters that also has a cooling influence over the Earth’s atmosphere when it emerges. The fact that we are on track to be experiencing the second hottest year on record, despite La Nina the cooling influence of La Nina which has been largely over-ridden, should be setting off at least a few warning lights.

Overall, temperatures for November were 0.87 C warmer than NASA’s 20th Century baseline and 1.09 C warmer than 1880s averages. Taking into account temperatures during early to middle December — which show a continuation of November ranges — it is likely that 2017 overall will average around 1.1 C warmer than 1880s averages once all the tallies are counted. Edging out 2015 by 0.01 to 0.03 C (see Dr Gavin Schmidt’s graph above).

By contrast, 2015 was a year in which the Pacific was ramping up toward a strong El Nino. So the La Nina signal for 2017 is important by comparison — validating numerous observations from climate scientists and climate observers that global temperatures have taken another step up (one of many due to human based heat forcing, primarily due to fossil fuel burning) without any indication of a step down.

(November 2017 sea surface temperature [SST] anomaly map at top shows evident La Nina pattern over the Equatorial Pacific. This should be creating a relative cooling signal. November 2015 SST anomaly map shows build up to El Nino type conditions. The fact that we will likely experience a warmer year in 2017 than in 2015 despite this contrast is a notable indicator for human-forced climate change and a continuing warming trend. Image source: NOAA.)

Regional analysis for November (see NASA map below) shows a very strong polar amplification signal with the highest Latitudes in the Northern Hemisphere displaying the most extreme temperature departures. Latitude 80-90 N showed the greatest zonal anomaly at around 5.5 C above average. While the global hot spot in NE Siberia hit an amazing 9.3 C above average for the month. Polar amplification was also more evident over Antarctica during the month with temperatures ranging from 1.5 to 2 C above average in the region of 75 to 80 S Latitude. This was significant given the fact that anomalous polar warming relative to past temperature trends tends to take a step back during late spring and summer months (it was late austral spring in November).

(Global anomalies map shows very extreme polar warming during November of 2017 with few regions of the globe experiencing below average temperatures. Image source: NASA GISS.)

It is worth noting that very few regions experienced temperatures below NASA’s 20th Century baseline. That regions experiencing temperatures below 1880s averages were even more scarce. And that the global cool spot at 4.1 C below average was less than half the amplitude of the most extreme warm departure (9.3 C).

The last time temperatures were globally below average during any month was in 1985. Which means that if you’re younger than 32, you’ve never experienced a below average month globally. Presently temperatures are so extreme now that globally below average single days are almost entirely a thing of the past. Warming has thus thrust us well outside the typical range of variability. And as a result, we are experiencing temperature, rainfall, fire, drought, snow, sea level, and storm conditions that are increasingly outside the norm, that are increasingly difficult to manage and adapt to. A trend that will continue so long as we keep burning fossil fuels. So long as the Earth keeps warming.

The National Security Threat that Inflicted 400 Billion in Damages This Year

Back in the 1990s, the U.S. Navy asked Congress to address the issue of rising sea levels at the Norfolk Naval Base. The Navy wanted to raise the piers, which were becoming vulnerable to flooding due to rising waters. For various reasons, including climate change denial, Congress has delayed funding for elevating the base’s 12 piers beyond the present and near term projected reach of ongoing sea level rise. Only four so far have been lifted.

According to former Norfolk Naval Base Commander Joe Bouchard, “Washington went bonkers” when it failed to recognize and address an obvious problem — sea level rise.

Up and down the U.S. coastline, the story is much the same. But it’s not just a case of Navy Base piers. It’s a case that every coastal city in the U.S. now faces rising seas threatening homes, real estate, infrastructure. And at the same time that seas are rising, the strongest storms are growing stronger and fire seasons that once ran through a few months of the year in places like California are now a year-round affair.

(A ribbon-thin rise of land separates the Norfolk Naval Base from flooding due to climate change driven sea level rise. Flooded bases not a national security threat? See related article by Vox. Image source: Wikipedia.)

This is the very definition of climate change as a threat to the security, not just to the world’s largest naval base, but to most if not all of the United States.

So how bonkers is Donald Trump and the climate change denying GOP now? How nuts is it that Trump yesterday made the anti-factual determination, in bald defiance of a plethora of U.S. military leaders, that “climate change is not a national security threat?”

Increasingly Destructive Hurricanes are Putting a Growing Number of People and Structures at Risk

This year, the U.S. has experienced not one, not two, not three, not four, but at least five major weather disasters that were made much worse by human-caused climate change. Three of them — hurricanes Maria, Irma, and Harvey all roared out of a warming ocean. They all formed in a hotter atmosphere loaded up with a higher level of moisture. These factors gave them more fuel to feed on. They unarguably increased their peak potential intensity. Scientific studies have found that Harvey alone was three times more likely to form due to human-caused climate change. That its rainfall was considerably enhanced in a warmer atmosphere.

The storms ran in to land on a higher ramp. Seas, like those at the Naval Base and in so many other places, have risen by a foot or more from the Gulf Coast to New England and on into the Caribbean because the Earth has, indeed, warmed. And this made storm surge impacts worse.

You could go on and on with the list of climate change related factors that compounded this year’s disasters. About the climate zones moving north. About hot blobs in the ocean and bigger blocks in the atmosphere. About enhanced convection and ice cliff instability. About ridiculously resilient ridges and persistent troughs. But it’s just a simple fact that the storms were worse than they would have been. That climate change made them more likely (in some cases far more likely) to occur in the first place. In total, and in large part due to the nefarious influence of fossil fuel burning on the world’s weather, these three storms alone have inflicted 368 billion dollars in damages.

That’s billion with a capital B. A level of harm often attributed to warfare but one that can instead be put at the feet of weather indiscriminately weaponized by fossil fuel burning. For the Atlantic Hurricane season this year, at a time when global temperatures are 1.1 to 1.2 C hotter than 1880s averages, was the most destructive ever recorded. These climate change enhanced storms left whole island nations and entire regions in ruins. In many cases it will take months, years, or even a decade or more to fully recover.

Wildfires are Increasing and Wildfire Season is Getting Longer in the Western U.S.

But in the grim tally of climate change related damages during 2017, we don’t stop at just hurricanes. For California, during 2017 experienced its worst fire season on record. One in which 11,306 structures have so far been damaged or destroyed. We say so far because what is likely to become the largest fire in California history — the Thomas Fire — is still burning.

11,306 structures would be enough to make a decent sized city. All gone due to a fire season that is now year round. Due to western heating, drying and temperature extremes that are increasingly forced to well outside the normal range. Total damages this year for California are presently estimated at more than 13 billion dollars. That’s nothing to shake a stick at. But this damage total is likely to continue to climb as the tally of losses is counted.

(Abnormally above average temperatures and below average precipitation contributed to fire danger in California during December. This odd heat and drought was driven, in no small part, by climate change. Image source: NOAA.)

As with hurricanes, the presently more intense fires are linked in numerous ways to a warming climate. Warmer temperatures increase the rate of evaporation and the intensity of precipitation in the most extreme events. Such variance increases the rate at which vegetation grows during wet season and the rate at which it dries during times when the rains depart. This adds more ready fuels for fires. In addition, northward movement of the Arctic sea ice contributes to an overall warmer and drier pattern for the U.S. West. This pattern, helps to produce stronger high pressure systems that, in turn, strengthen the fire-fanning Santa Ana winds.

This year, December, which is typically a wet month for the U.S. West, especially during La Nina (which we are presently experiencing) has been incredibly dry. This dryness helped to fuel the Thomas Fire. But the dryness didn’t happen in a vacuum. It was associated with a major climate change related influx of heat into the Arctic linked to climate change driven polar amplification.

Failure to Recognize Climate Change Leaves U.S. Citizens Vulnerable to Harm

Anyone following the increasingly clear evidence of how Trump campaign officials coordinated with Russia to disrupt the 2016 elections and how ardently Trump is attempting to cover the whole thing up could draw the reasonable conclusion that Trump cares more about his own personal advancement than the safety and security of the American people. Trump’s, and by extension, the GOP’s climate change denial, can be seen through the same morally relativistic lens. Wealthy fossil fuel donors have for a long time now held an unreasonable influence over persons in higher office. The denial of climate change for both the Republican Congress and the Presidency is, in other words, well-funded.

(GOP funding by fossil fuel donors just keeps going up and up in lockstep with GOP climate change denial and anti-environmental policy. Image source: InsideClimate News.)

Such denial may line the pocketbooks of republican politicians and wealthy oil, gas, and ailing coal companies. But it places the American people, their homes, their livelihoods, beneath the blade of a falling ax. So when Trump says climate change is a hoax, forces government websites to shut down, scrubs words related to climate change from government communications, opposes alternative clean energy, and tells the Department of Defense not to treat climate change as a national security threat, he is culpable and a contributor to a very clear, present, and growing danger.

Record Renewables Growth in 2017 as New Global Solar + Wind Installations are Projected to Hit Near 175 GW 

Last year, global growth in new solar energy installations hit a new record of 56 gigawatts (GW) in a single year. This year, growth could nearly double to 108 GW installed according to recent reports from IHS. Meanwhile wind appears on track to add another 68 GW of clean power generation. In other words, the age of the renewable energy revolution is in the process of overtaking us. None too soon considering the fact that we are now facing serious ramping harms due to fossil fuel burning and related human-forced climate change.

Rocketing Global Growth For Solar Despite Trump/Republican Efforts to Throw a Wet Blanket on a Key Industry

Such amazing growth comes on the back of rapidly ramping solar markets in China, India and around the world. A ramp that’s happening despite anti-solar policy by the Trump Administration feeding a trade case that has injected uncertainty and distortion into the U.S. market. And even as the same Administration is waging an Orwellian-styled war on the employees of the Environmental Protection Agency who are still doing their best, despite rising odds, to protect the health of U.S. citizens from polluting industries.

The upshot is that the U.S. will lag behind these two emerging solar energy leaders as republicans in power put energy policy in retrograde following years of rapid advancement and clean energy leadership under Obama and the democrats.

(U.S. sees shrinking pie of new solar additions under Trump. Image source: PV Magazine/IHS.)

But despite harmful policy stances by republicans and related nonsensical litigation, the U.S. market is still expected to see 10-12 GW of new solar added in 2017 — or the second highest levels of solar installation on record.

Solar’s resilience in both the U.S. and around the world is primarily due to low photovoltaic panel prices combined with broad popular support by states, cities, businesses, and individuals. These low prices are evidenced by numerous solar tenders and purchase agreements that now range below the 5.5 cent per kilowatt hour level, that can often hit below the 4 cent threshold and sometimes dip as low as 3 cents or less. A recent solar purchase agreement in Arizona, for example, sold for less than 3 cents per kilowatt hour or lower than half the price of nuclear for that region. As mentioned above, trade case uncertainty has since driven solar prices in the U.S. marginally higher. Despite this counter to the global trend, U.S. solar sales are still beating out every prior year except 2016.

(Policies like the Sun Shot Initiative under President Obama and major investments by countries like China helped to rapidly reduce the cost of photovoltaic solar panels globally. Recently, major cost reductions have also been realized in concentrated solar power (CSP). Image source: PlanetSave.)

Concentrated solar power (CSP), which has the inherent advantage of offering both clean, renewable energy and storage in a single application, is also seeing falling prices. For ACWA Power is building a 700 MW CSP facility in Dubai that will provide clean solar energy for just 7.3 cents per kwh. This compares to natural gas prices which range as high as 24 cents per kwh for the Gulf region. If such low prices can be widely duplicated globally, CSP, which employs reflectors to gather solar heat into an oil based medium that is used to boil water to spin a turbine, then this additional form of solar is also likely to see broader use.

Wind Continues Steady Gains

Even as solar energy rockets to record gains, wind energy is also expected to see considerable increases. Forecast International now predicts that 68 GW of new wind capacity will be added globally in 2017. Wind installations at this point are quite widely distributed around the world. However, increased growth in Asia is a major factor in the continued steadily rising rate of adoption.

(Globally, wind energy is projected to continue its steady growth trend of recent years. Image source: Forecast International.)

Prices for wind energy range from 3.1 to around 5.5 cents per kwh, according to Lazard. Unlike solar, the price for wind has been on a slower decline curve during recent years. This means that at this time prices for both wind and solar are presently comparable for most regions. It also means that in places like Alberta, where a recent 600 MW wind project is expected to cost an average of 3.7 cents per kwh, prices for wind are less than half that of nuclear and less than most existing coal or even many new gas projects.

Major Growth in Renewable Energy as Coal Stagnates

If IHS and Forecast International projections for new solar and wind growth bear out, then we’ll see about 176 GW of these forms of renewable energy installed in 2017. That’s a tremendous rate of add that will considerably outpace new coal and gas installations even as it helps to reduce overall demand for power from these polluting sources and major contributors to climate change, related sea level rise, and similarly related worsening extreme weather. We are already seeing these effects as the world’s largest coal terminal is seeking to diversify on lowering demand forecast and as GE — a major provider of turbines for the gas industry — is cutting its fossil fuel based equipment sector.

https://twitter.com/RoadThruParis/status/942424688004947968

One major aspect of the larger global shift can be seen in China. During past years, China rapidly added new coal and gas capacity. But non fossil fuel power generation additions were the major story for China in the first half of 2017. For by July China had added 24.4 GW of new solar capacity, 7.3 GW of new wind capacity, 6.69 GW of new hydro capacity, and 1.09 GW of new nuclear capacity. The total new add was 39.48 GW of non fossil fuel based electrical power generation vs 18.84 GW of new thermal capacity primarily coming from coal and gas. In other words, renewables outpaced fossil fuel generation in China by more than 2 to 1.

This comes as China is seeking to reduce coal use in an effort to clean up its air quality and fight climate change, as the price of coal burning rises to the point of producing losses in regions like Europe, and as predictions abound that the near term coal market is stagnating and long term future coal prospects, without the addition of costly carbon capture and storage, look bleak.

CREDITS:

Hat tip to Greg

Hat tip to Vic

Hat tip to Suzanne

Thomas Fire Likely to Become Largest in California History

Fanned by Santa Ana winds gusting up to 65 mph, the Thomas Fire swiftly expanded toward the Santa Barbara community of Monticeto on Saturday. The blaze rapidly grew by 8,500 acres forcing numerous evacuations and road closures, including the emptying of a zoo.

Tonight, winds are still fanning burning embers and lighting spot fires in the Monticeto area. This video shows a palm tree burning as sparks fly down a local street.

Montecito is one of Santa Barbara’s more affluent communities. But as of this report, all homes have so far been kept safe due to valiant firefighting efforts by the more than 8,000 personnel battling what has aptly been called a monster blaze. That said, night-time flare ups and spot fires continue to make this defensive effort extraordinarily difficult.

Totaling 267,500 acres by late Saturday, the fire was at the time the third largest in California history. That’s just 12,500 acres smaller than the Cedar Fire which burned through the San Diego area in 2003. Winds presently fanning the fire near Santa Barbara are expected to die down tonight through Sunday. However, Santa Ana gusts of up to 55 mph are expected to return to the Ventura side of the fire on Sunday — risking rapid expansion there.

The blaze is still just 40 percent contained. Its sprawling extent and predicted continued dry and windy weather conditions make it likely that the fire will ultimately exceed the size of the Cedar Fire over the coming days. Firefighters had hoped to get the fire under control by January 1, 2018. But conditions, which include the longest running red-flag warning on record, have made the fire very unruly and difficult to manage despite the amazing efforts of the largest fire fighting force ever assembled by California.

Conditions associated with human-forced climate change are clearly a compounding issue. Various climate studies indicated that persistent ridging, above average temperatures, rising drought prevalence in winter, and unusually strong Santa Ana winds would increase fire danger for California as the Earth warmed. And this is the general state of affairs we now witness.

It’s a trend we see now. Large fires have become more prevalent in California. Fire officials now note that the fire season has grown in lock-step with warming to become a year-round affair. And thirteen of the twenty largest fires on record for California have occurred since the year 2000.

Investors are Fleeing Fossil Fuels in Droves

When Bill McKibben and 350.org spear-headed a campaign to divest from fossil fuels and go 100 percent renewables as part of a multi-pronged strategy to confront ramping harms from global climate change in 2012, the big push-back was “divestment doesn’t work, it’s just feel-good, someone else will just buy the stocks when prices drop.”

The Green Mouse That Roared

As if where individuals, banks, investment firms and governments put their money doesn’t matter. As if monetary policy at all levels isn’t an enabler of energy and climate policy. As if the world were awash in an infinite flood of money. As if capital just magically grows on trees.

The detractors clearly didn’t get it. They’d already lost the argument. But the ultimate realization would take years to materialize.

The divestment movement wasn’t so much about the short-term, day to day, flux of money on the financial markets. It was instead aimed at triggering a long term mega-trend. The movement did this by shining a light on the intrinsic immorality of fossil fuel burning. By changing the terms of the environmental debate to include such objects as financial risk and stranded assets. By meeting investors on their own intellectual turf on a daily basis. And by revealing to them the very serious and real risk of loss they were exposed to by pumping money into an energy source that produces widespread, ramping and systemic harm.

A long game that is presently gaining some very significant traction. For it appears that Bill McKibben and the various proponents of the divestment movement have managed to outflank the fossil fuel industry on what was, hitherto, intellectual and financial ground under their unquestioned control. They became, all of us involved became, the green mouse that roared.

(The divestment movement helped to shine a light on the various glaring financial risks involved in continued fossil fuel burning. A primary issue being that due to damage caused by climate change, losses to the whole financial system would eventually greatly outweigh gains. At which point, sunk fossil fuel assets would become stranded due to investor flight. Image source: Carbon Tracker.)

From EcoWatch:

We used text analytics software to sift through 42,000 news articles about climate change between 2011 and 2015 and map the influence of the radical flank. In this analysis, we found that the divestment campaign expanded rapidly as a topic in worldwide media. In the process, it disrupted what had become a polarized debate and reframed the conflict by redrawing moral lines around acceptable behavior.

Our evidence suggests this shift enabled previously marginal policy ideas such as a carbon tax and carbon budget to gain greater traction in the debate. It also helped translate McKibben’s radical position into new issues like “stranded assets” and “unburnable carbon,” the idea that existing fossil fuel resources should remain in the ground.

Although these latter concepts are still radical in implication, they adopt the language of financial analysis and appeared in business journals like The EconomistFortune and Bloomberg, which makes them more legitimate within business circles.

Thus, the battle cry of divestment became a call for prudent attention to financial risk. By being addressed in these financial publications, the carriers of the message shifted from grassroots activists to investorsinsurance companies and even the Governor of the Bank of England.

Mass Divestment Underway as Climate Change Impacts Worsen

Today the world is starting to wake up, bleary eyed and hung over from tar sands smog, to the reality that climate change is poised to eat everyone’s lunch. The U.S. has been hammered by not one, not two, but three $100 billion dollar plus hurricanes. All of those storms were made worse by climate change and one — Harvey — was found to be three times more likely due to the heat trapping gasses fossil fuel based industry has collectively pumped into the world’s atmosphere. With the Thomas Fire threatening to burn down Santa Barbara in December, California is reeling from its worst fire season on record. And glaciers from Greenland to Antarctica are teetering at the brink — ready to inundate the world’s cities at rates far faster than previously expected with only just a bit more added fossil fuel trapped heat.

(How investments in fossil fuel based industry generate carbon emissions. Image source: Carbon Tracker.)

That’s with global temperatures at only 1.1 to 1.2 C above 1880s averages. Keep burning fossil fuels and we’ll hit 3 to 7 C or more by 2100. And folks already feeling the pain of lost financial stability, lost homes, or forced displacement are starting to cry uncle.

Some of the investors holding the fossil fuel industry’s purse strings appear to have had enough. AXA Equitable CEO Thomas Buberl this week stated: “A 4 C world is not insurable.” The major financial and insurance firm has pledged to invest 10.6 billion in environmentally friendly projects and to move 4 billion in funds out of fossil fuels by 2020.

But AXA isn’t the only one by far. Other banks, firms, and share holders are realizing in droves that investing in that 4 C world by throwing more money at fossil fuels isn’t worth a darn either. The World Bank just announced it will stop investing in upstream oil and gas projects by 2019. This after resisting appeals to divest for years. The 23 large regional investors of the International Development Finance Club, who hold 4 trillion in assets, have agreed to align their procurement with the goals of the Paris Climate Summit. Dutch ING bank has announced that it won’t fund any utility that relies on coal for more than 5 percent of its energy.

Meanwhile, an umbrella group managing 26.3 trillion dollars in assets is directly targeting the world’s top 100 carbon emitters. The group — called Climate Action 100 — comprises 225 pension funds and other investors. And it aims to get the world’s worst carbon emitters to curb their greenhouse gas pollution and to disclose their climate change related risks to share holders. Oil, gas, coal, cement, mining and major transportation players are all in Climate Action 100’s sights.

(Renewables possess superior economics in a number of key facets. 1. They have a positive learning curve — the more you build the less they cost. 2. They reduce healthcare costs to society and increase productivity. 3. They reduce ramping systemic harms from climate change by replacing fossil fuel burning. Image source: Union of Concerned Scientists.)

The shareholders from Climate Action 100 have effectively drawn a line in the sand. If these top emitters fail to act to reduce their carbon pollution, then the investors from the group will move their money elsewhere. Effectively, this action is directly from the divestment playbook. But it is now one that lives entirely in the realm of global finance. In other words, divestment is no longer just an environmentalist thing. Global finance, to a rising degree, is being infused with rational environmental thought to the point that it owns it.

Mindy Lubber, President and CEO of Ceres notes in an interview to Motherboard:

“These investors are the largest owners of companies and they see climate change as a serious threat to their investments and the global economy. They believe it is imperative these companies move away from high-carbon emitting activities. Such companies [top 100 emitters] are unlikely to have economic success [if they don’t adjust to the reality of climate change].

Strong Renewable Energy Economics Mean Investors are No Longer Captive to Dirty Energy

This push for divestment from fossil fuels and holding fossil fuel industry accountable by many of the world’s wealthiest banks and firms comes as renewable energy is making major gains. Solar and wind energy are now less expensive than coal or even gas in many markets. The price of electrical vehicles is falling even as these non-emitting forms of transportation are becoming more capable than traditional ICE vehicles. And the price of related battery storage is also plummeting. So it’s not as if there is no viable alternative to dirty and dangerous fossil fuels. In fact, the alternatives are much more attractive on their own merits. Investors have options at hand to confront climate change. So do the rest of us. And that whole divestment thing that was nonsensically poo-pooed by naysayers — it’s becoming as ubiquitous as oxygen.

CREDITS:

Hat tip to Bill McKibben

Hat tip to EcoWatch

Hat tip to Miles H

Worsening Weather to Feed Monstrous Thomas Fire Through Sunday

It shouldn’t be happening in typically wetter, cooler December. But, due to human-forced climate change, it is.

The Thomas Fire, at 242,000 acres, is now the fourth largest fire in California history. Alone, it has destroyed 900 structures — a decent town’s worth gone up in smoke. And today it threatens pretty much all of Santa Barbara’s 62,000 buildings. For future days promise conditions that could expand the monstrous blaze into the largest fire ever seen for the state.

(Persistent western ridge formation is an expected upshot of sea ice retreat in the Arctic. A feature that will result in a drier, warmer, more fire prone California if the trend toward sea ice melt and global warming continues.)

Firefighters battling the blaze have faced insane odds to manage a herculean feat — achieving 35 percent containment as blowtorch like Santa Ana winds consistently billowed through the region over the past two weeks. These winds have been both abnormally strong and persistent. And they’re run over dry lands through a season that is typically known for its more prevalent rainfall — not the expanding drought we see today.

Given these presently very abnormal conditions, fire officials don’t expect to achieve full 100 percent containment for three more weeks. And that’s with over 8,144 firefighters on the ground assisted by 1,004 fire engines and 27 helicopters.

(The 2012 to 2017 California drought was slaked by rains last winter. However, it appears to have returned in force with southern portions of the state again facing an extended dry period.)

Present weather conditions for California are extraordinary. A persistent ridge of high pressure has hovered over the region. And this high has helped to spike local temperatures, speed a re-emergence of drought, and drive very powerful Santa Ana winds through the region. The high formed as sea ice advance in the Chukchi and Bering Seas far to the north lagged. Open water that is usually ice covered at this time of year radiated more heat into the local atmosphere — providing a slot of warmer air that assisted this drought, heat, and wind-promoting high pressure ridge in forming.

The intensity of these highs, influenced by climate change, out west has consistently risen into the 1040+ hPa range. Highs that have been juxtapposed by a strong low further south near Mexico. And a steep pressure gradient between these two persistent weather systems has helped to drive the very strong, fire-fanning, Santa Ana winds through the region. As the Thomas Fire blossomed last week, fire conditions achieved extremes never before seen in state history as those hot, dry winds roared over hills and through valleys.

(GFS model runs show the fire fanning Santa Ana winds strengthening through Sunday. Hat tip to Dan Leonard.)

Unfortunately, weather models for the next few days show this Santa Ana wind producing pressure gradient either persisting or strengthening. Today, this gradient is producing winds with gusts of up to 55 mph. By Sunday, the high over the Pacific is predicted to face off against a low over Northwestern Mexico. And the gradient between these two systems may further intensify these fire fanning winds. Wind speed and fire hazard are not expected to be as extreme as last week. But the re-intensifying winds will do firefighters no favors.

In addition, and perhaps more importantly to the long range picture, there is not even a hint of rain in the forecast through at least the next week. Dry, warmer than normal weather is expected to remain in place at least through that period. And hope for wetter, cooler weather has only begun to emerge in the longer range, less certain forecast.

New Science Confirms that Harvey’s Record Rains Were Made Much Worse by Climate Change

Hurricane Harvey barreled into Texas on August 25th of 2017. Over the next six days, it dumped 52 inches of rain across parts of the state, resulted in 800,000 emergency calls for help, caused 80 souls to be lost, and inflicted over 190 billion dollars in damages.

Harvey was the most damaging storm ever to strike the U.S. It was more costly than Katrina and Sandy combined. And recent studies now show that this damage, in large part, was due to climate change’s influence over the storm.

(Harvey just prior to making landfall on the Southeast coast of Texas. Image source: NASA.)

According to base climatology, we can expect this kind of event to occur once every 9,000 years. But living in base climatology we are not. Due to fossil fuel burning, atmospheric CO2 levels are above 405 parts per million — levels not seen in at least the past 2.5 million years. Meanwhile, total greenhouse gas forcing (after you add in methane and other heat trapping gasses) is at levels not seen in around 15 million years. So we’re now in a world that’s pretty different from what we are used to. A more dangerous world.

How different and how much more dangerous is a measure of some debate. More to the point, the question of how much the presently serious alteration to the world’s climate impacts the world’s weather is a pretty hot topic. What we already know is that the weather is becoming more extreme, more damaging, and that the most intense storms and droughts are growing worse.

(Incidence of record breaking daily rainfall events are increasing as the Earth warms. New science is starting to attribute aspects of individual extreme events to human caused climate change. Image source: Increased Record Breaking Daily Rainfall Events Under Global Warming.)

But boiling it all down to a single storm like Harvey, how much can you blame on climate change? Well, that’s starting to become clearer thanks to a pair of new scientific studies.

According to a recent study in the Geophysical Research Letters, human-caused climate change increased Harvey’s devastating rainfall intensity by at least 19 percent and likely by around 38 percent. Enough of a human caused influence to tip the scales between a relatively rough event and an epic deluge for the history books. Meanwhile, another study led by World Weather Attribution, found that Harvey was also three times more likely to have formed in the present human-altered climate.

If these peer-reviewed studies are correct, their findings point toward a rather stunning conclusion — the storm was much more likely to form due to climate change and the storm was made much more intense after it formed due to climate change.

In essence, the new science finds that climate change’s finger prints are all over Harvey’s devastating impact. Folks around the world take note. Your severe weather has been hyper-charged.

CREDITS:

Hat tip to Eleggua

Tesla Semi is Racking up the Preorders

Tesla isn’t the only player in the electrical trucking field. It is, however, presenting one of the most attractive offerings for an electric truck in the present marketplace.

(Tesla is again producing best-in-class clean transport capabilities in its all electric Semi offering.)

Tesla’s Semi will have a range of 300 to 500 miles. Its rig will go from 0-60 in less time than many passenger vehicles. And its cost of fuel is so low that it will repay the 150,000 to 200,000 dollars initially invested in energy savings in just three to five years. With economics and performance parameters like these, the fact that the Semi will emit zero harmful greenhouse gas emissions in operation is a much needed layer of icing on the new energy vehicle cake.

All these features are quite attractive. And, as a result, Tesla has already received upwards of 300 pre-orders for what promises to be a truly revolutionary vehicle. Pepsi, Anheuser Busch, SYSCO, Loblaw, Wal-Mart, DHL and numerous others have all jumped onto the Tesla clean trucking bandwagon. Since Tesla requires a 20,000 dollar down payment to reserve a truck (up from 5,000 dollars when the semi was first announced), these pre-orders represent a major commitment by buyers. It also represents between 45 and 55 million in new revenue for Tesla.

(Tesla is already starting to make waves in the U.S. class 8 truck market — in which less than 200,000 units are generally sold each year. Image source: Statista.)

300 pre-orders may not sound like much when compared to Tesla’s massive Model 3 total of about 500,000. However, considering the fact that less than 200,000 class 8 trucks were sold in the U.S. during 2016, this initial wave of orders is far from a drop in the proverbial bucket. For one, interest by major shippers in Tesla will likely bring more interest as competitors race to gain access to that best-in-class efficiency, performance and related energy cost reduction. In addition, pre-orders are likely to be a smaller portion of total sales due to Tesla’s higher reservation asking price.

Such levels of demand may support in the range of 5,000 Semis sold per year in the U.S., according to recent clean-tech market analysis. And this would represent about 3 percent of the present U.S. market from a single automaker. But when considering the fact that big rig emissions are about 20 to 40 times that of a typical medium sized car over the course of a year, those projected 5,000 Semis could have an outsized impact in helping to reduce the amount of heat trapping gas hitting the atmosphere.

Not too shabby for a start and for a single automaker. And some people called the Semi a distraction. Pshaw.

NOAA’s 2017 Arctic Report Card Shows Transition Toward Not-Normal Polar Environment Continues

The Arctic shows no sign of returning to the reliably frozen region of recent past decades. — NOAA

Reading this [Arctic Report Card], I feel physically sick. I feel so anxious. I’m not sure how many more years or months I’m going to be able to work daily on climate change. — Eric Holthaus

*****

During 2017, the Arctic experienced much warmer than normal winter and fall temperatures. Meanwhile, according to NOAA’s 2017 Arctic Report Card, somewhat cool late spring and early summer temperatures did little to abate a larger ongoing warming trend.

NOAA notes:

The average surface air temperature for the year ending September 2017 is the 2nd warmest since 1900; however, cooler spring and summer temperatures contributed to a rebound in snow cover in the Eurasian Arctic, slower summer sea ice loss, and below-average melt extent for the Greenland ice sheet.

(NOAA’s Arctic Report Card shows a Polar environment experiencing serious and harmful changes.)

This warming trend was evidenced by continued systemic long term sea ice losses with NOAA stating that sea ice cover has continued to thin even as older, thicker ice comprised only 21 percent of Arctic Ocean coverage compared to 45 percent during 1985.  NOAA noted very slow Chukchi and Barents sea ice re-freeze during fall of 2017 — which was a feature of much warmer than typical sea surface temperatures during late August. Temperatures which ranged up to 4 C above average for this time of year and that created a kind of heat barrier to typical fall ice cover expansion.

Sea ice is a primary indicator of Arctic health. But losses over recent decades have been quite precipitious as indicated by the graph below:

Sea Ice Coverage Loss

(Arctic sea ice loss since 1978 during September [red] and March [black]. Image source: NOAA.)

NOAA also found evidence of ongoing increases in ocean productivity in the far north — which tends to be triggered by increasing temperature and rising ocean carbon uptake (also a driver of acidification).

Other observations of systemic warming came as permafrost temperatures hit record levels during 2016.  Decadal rates of permafrost warming as measured at Dead Horse along the North Slope of Alaska proceeded at a rate of 0.21 to 0.66 degrees Celsius every ten years.

(Changes in Arctic ground temperature [20 meter depth] at varying locations shows widespread movement toward permafrost thaw. Image source: NOAA.)

Tundra greening trends also continued over broad regions:

Long-term trends (1982-2016) show greening on the North Slope of Alaska, the southern Canadian tundra, and in the central Siberian tundra; tundra browning is found in western Alaska (Yukon-Kuskokwim Delta), the higher-Arctic Canadian Archipelago, and western Siberian tundra.

Rapid warming of the Arctic, loss of sea ice, permafrost thaw, greening tundra, changes in ocean productivity and other factors are all starting to seriously impact the people of the Arctic. Coastal towns have been forced to move inland due to erosion and sea level rise. And a number of communities have lost access to key food sources due to sea ice loss or migration of local species away from warming regions. Subsidence has generated harmful impacts to infrastructure. Meanwhile, the increased incidence of Arctic wildfires presents a rising hazard to Northern Communities:

High latitude fire regimes appear to be responding rapidly to environmental changes associated with a warming climate; although highly variable, area burned has increased over the past several decades in much of Boreal North America. Most acreage burned in high latitude systems occurs during sporadic periods when lightning ignitions coincide with warm and dry weather that cures vegetation and elevates fire danger. Under a range of climate change scenarios, analyses using multiple approaches project significant increases (up to four-fold) in area burned in high latitude ecosystems by the end of the 21st century.

Taken together this is tough news — a technical report written in the lingo of science but that, in broad brush, describes evidence of a world fundamentally changed. For those of us with sensitive hearts, it’s a rough thing to write about:

Overall, NOAA calls for increased efforts to adapt to climate change in the far north. In addition, the need for mitigating harms from climate change by speeding a transfer to renewable energy could help to preserve cryosystems and ecosystems that are now under increasingly severe threat.

Signs that the Model 3 Flood Gates are Starting to Open Abound

Tesla’s mission ‘to accelerate the world’s transition to sustainable energy’ appears to be surging forward after hitting a couple of road blocks this fall.

According to news reports, Tesla Model 3 distribution centers are now filling up with units of the highly desirable electrical vehicle. According to Elektrek, hundreds of Model 3s have been spotted at Freemont’s distribution Center. And a new distribution center in Los Angeles with a lot capable of holding 400 vehicles appears to also be full. Meanwhile, smaller centers and sales rooms around the country are reporting an influx of Model 3s.

(Sales lots for the Model 3 are starting to fill — indicating that higher production volumes have been reached)

This news comes after Tesla recently opened orders for a first batch of Tesla reservation holders. It also follows Panasonic’s announcement that battery production bottlenecks at Tesla’s Gigafactory had cleared.

According to reports from Inside EVs, a total of 712 Model 3s had sold through November. But with hundreds of Model 3s now flooding distribution centers and show-rooms, the rate of production appears to have started to take off. How much will be unclear until Tesla releases annual figures by early January of 2018. But it appears likely that Tesla is now producing north of 300 Model 3s per week — with this source pointing toward upward of 1,000 vehicles per week.

Exact numbers are all speculation and conjecture at this point. But clear evidence of swelling inventory is a sign that the steepening ramp of the S curve is upon us.

Tesla presently boasts approximately 500,000 reservation holders for its Model 3 electrical vehicle (EV). Many of these customers are willing to wait a year or more to receive a car. This is an unprecedented level of demand. But with the Model 3 featuring first in class acceleration, handling, EV range, recharging capability, and access to Tesla upgrades and widespread faster charging infrastructure, it’s little wonder that the car has so many admirers.

If Tesla is managing to ramp production as planned, the car-maker is likely to see record vehicle sales during December even as it climbs toward 250,000 to 300,000 approximate sales during 2018 (or up to triple projected 2017 sales). And due to the fact that the Model 3 eclipses the capabilities and features of tens of thousands of luxury and sport fossil fuel vehicles in the 30,000 to 50,000 dollar price range, it’s possible that Model 3 demand will continue to surge as the car becomes more widely available.

(Global EV sales are projected to hit above 1 million during 2017. With the Model 3 and other highly desirable, more affordable electrical vehicles hitting the market in 2018, total global sales are likely to challenge the 2 million mark. Image source: EVvolumes.)

Tesla’s leap forward coordinate with larger global EV adoption couldn’t come sooner. Harms from climate change are rapidly advancing. But the increased efficiency provided by electrical drive trains and their ability to be mated directly to renewable energy systems like wind and solar provide a major opportunity to cut harmful carbon emissions. So the faster global EV production ramps, the more competition that interest in Tesla’s leading-edge EVs spurs, the better it is for us all.

Record Warmth Blankets Alberta

Extreme warmth associated with a powerful western high pressure ridge and conditions related to climate change has broken temperature records across Western Canada during recent days.

On December 9, the southern Alberta cities of Lethbridge and Grand Prairie saw temperatures rising to record highs of 14 C or 57 degrees Fahrenheit. Meanwhile, Calgary experienced 15.4 C temperatures (60 degrees F) — which shattered the previous record of 14.4 C that had stood for 127 years. Four other cities in southern Alberta also saw record warm temperatures on Saturday.

For context, temperatures for this region typically range between -1 to -13 C this time of year.

(The first 11 days of December show far above average temperatures for most of Western North America and the Arctic. Image source: Global and Regional Climate Anomalies.)

The primary feature driving such extreme temperatures is a power high pressure ridge that has been anchored in place during November and December. The ridge has been drawing warm air north and generating unusually warm weather for regions from the U.S. West through central and western Canada and on up into the Northwest Territories and Alaska.

Very slow reformation of sea ice in the Chukchi and Bering Seas is a likely contributing factor to the ridge. A physical feature associated with human-caused climate change. La Nina is likely also enabling the synoptic transfer of heat into both the Arctic and the North American West through a very pronounced Rossby type wave pattern in the Jet Stream. But present Arctic warmth in the range of 3-5 C above climatological averages is well beyond 20th Century norms during La Nina years. It is instead primarily an upshot of polar amplification — where human-forced warming due to greenhouse gas emissions generates more warming at the poles than in the lower latitudes. So climate change related factors are also influencing this overall warmer than normal pattern.

(Above freezing temperatures aren’t typical for Alberta this time of year. But the region was blanketed by 40-60 degree [F] highs on Saturday. That’s 9 to 27 degrees [F] above average. Image source: Earth Nullschool.)

As a result, places like Calgary haven’t received any snowfall so far this year during December. A situation that is likely to continue for at least the next five days as warmer than normal conditions are expected to persist.

December is typically a rather snowy month for Calgary — receiving 8 days of snow during a normal year. But this year isn’t really that normal and the climate, with global temperatures exceeding 1 C above 1880s averages, isn’t normal anymore either.

CREDITS:

Hat tip to Dobby

After a Brief Respite, Climate Change Enhanced Drought is Returning to the U.S.

Unseasonable warmth across the American West and overall dry conditions across the South is causing drought to expand throughout many parts of the United States.

According to the U.S. Drought Monitor, most of the southern half of the United States is presently experiencing abnormally dry or drought conditions. Meanwhile, an intense drought that has remained in place over the Dakotas and Montana for multiple months continues to persist.

Severe drought conditions are now present in the south-central U.S. with exceptional and extreme drought expanding through Arkansas, Oklahoma, Texas, Louisiana and Missouri. Deepening drought in California and Texas are notable due to the fact that Southeast Texas recently experienced record rainfall due to Hurricane Harvey and California experienced a very wet winter and spring period from 2016 to 2017. Somewhat milder drought is also spreading through the Southeast.

Re-expanding Southern California drought is also enhancing record wildfire activity in that state.

Much Warmer than Normal Temperatures

A strengthening La Nina in the Equatorial Pacific is helping to generate a drought tendency for the Southern U.S. However, various climate change related features including above normal temperatures and a persistent high pressure ridge in the West are lending intensity to the rising drought regime.

(U.S. 30 day average shows much warmer than normal conditions for the lower 48 with extreme warmth prevalent over the American West. Image source: Global and Regional Climate Anomalies.)

Over the past 30 days, temperatures for the U.S. as a whole have been 1.52 C above average (see image above). Much of this excess heat has been concentrated over the West, with mountain and Pacific regions seeing between 4 and 5 C above average temperatures.

Excess heat of this kind helps to speed the drying of soils and vegetation by increasing the rate of evaporation. A condition that can lead to flash drought — whose incidence has been expanding in lock-step with the human-forced warming of the globe.

A Ridiculous Ridge

Linked to the western heat and drought is a strong and persistent high pressure ridge. One that has hit a very intense 1041 hPa pressure as of Monday afternoon over the U.S. Mountain West.

(Very intense high pressure ridge over the U.S. west is presently locking in both warmer than normal and drier than normal conditions. Image source: Earth Nullschool.)

Persistent ridging of this kind was a key feature of the recent 2012 through 2017 California drought. Some climate studies have identified a tendency of these kinds of strong western ridges to form as Arctic sea ice recedes. And during the past decade, strong high pressure ridges have been a rather consistent and significant climate feature for the U.S. West. It is also notable that formation of more powerful ridging features during the fall and winter help to strengthen the Santa Ana winds — which fan California wildfires.

Present drought is nowhere near as intense as it has been during recent years. Especially in California which during 2017 has experienced a bit of a respite. However, with La Nina gaining traction in the Pacific, with global temperatures now in a range between 1.1 and 1.2 C above 1880s averages, and with persistent ridging again taking hold over the U.S. West, the risk of a return to intense drought — especially for the Southwest — is increasing.

Southern California Fires Expand to Over 255,000 Acres as Conditions Worsen

On Sunday, driven by above normal temperatures and fanned by warm winds, the Thomas Fire in Ventura County, California rapidly expanded. This resulted in a loss of containment as the blaze jumped fire breaks — placing parts of Santa Barbara under seige.

(Smoke plumes from the Thomas fire as seen by a webcam located atop Santa Ynez Peak, a 4300′ mountain 17 miles northwest of downtown Santa Barbara.)

This single fire, as of Monday morning, covered 230,000 acres. At that time, it was the fifth largest fire in California history. It was burning in December. And, at the time, the fire was continuing to swiftly grow.

Five other fires burning in Southern California together cover an additional 25,000+ acres. As a result, approximately 255,000 acres are now burning in this region of the state.

The 6,000 firefighters now engaged in battling these blazes had hoped that predicted milder Santa Ana winds would afford them a chance to gain an advantage over these fires this weekend. But this didn’t happen. The western high pressure ridge strengthened. Local temperatures increased to well above the seasonal average. And though winds subsided somewhat, very dry conditions dominated.

https://twitter.com/gvitty/status/939981486685437952

Due to the worsening situation, 25,000 structures are now threatened by the fires — up from 20,000 earlier this week. More than 790 structures have been burned or destroyed. More than 95,000 people remain under evacuation orders. And more than 85,000 people are without power. Tragically, the fires have now claimed their first human life as well.

Unfortunately, warmer than normal, dry and windy conditions are expected to continue through at least Friday, December 15th. Resulting in a long running period of heightened fire danger. These climate change related features are driven by a very persistent high pressure ridge over the North American west. A feature that has been linked to loss of sea ice and a warming Arctic in some climate studies.

Overall, climate change is worsening fire danger out west. During summer, hotter and drier conditions are intensifying the California fire season. And during fall through winter, the climate change associated warming, drying and strengthening of the Santa Ana winds is enabling the eruption of very large city-threatening fires during the winter months.

(UPDATED)

CREDITS:

Hat tip to Colorado Bob

Hat tip to Eric Holthaus

Hat tip to Wili

Hat tip to Titania Baildon

As Climate Emergencies Rise — A Call For Action

With climate change enhanced wildfires raging across California during December, now is exactly the time to redouble our resolve to fight against the causes of such widespread destruction. To enact policies aimed at reducing the force of a rising crisis that continues to impact so many of our people with increasing intensity.

In California today, there is a move afoot to set a deadline for banning the very fossil fuel based vehicles that have fanned the fires of climate change across the state. To resolve, by 2040, to take gas powered cars off the road.

Phil Ting, a San Francisco Democrat and sponsor of this legislative drive, notes that for the State to meet its greenhouse gas reduction targets, it’s going to have to transition away from fossil fuel based vehicles. Such vehicles represent more than 1/3 of all state carbon emissions. And the state can’t effectively address the carbon dioxide emissions that drive climate change disasters without also directly targeting the number of fossil fuel based vehicles in operation.

(According to California’s Air Resources Board, nearly 38 percent of the state’s carbon emissions are due to transportation.)

New electrical vehicle (EV) technology is enabling just such a move. According to Ting:

“The market is moving this way. The entire world is moving this way. At some point you need to set a goal and put a line in the sand.”

If California sets a policy to ban fossil fuel based vehicles by 2040, it will join a growing number of cities and states that have already set similar goals. These include France, the United Kingdom, India, Germany, and Norway. Meanwhile, China is pursuing very aggressive incentives to increase the number of EVs as a means of combating terrible local air pollution and climate change.

Movement by cities and states to ban fossil fuel vehicles and incentivize EVs has an out-sized impact. It signals automakers that EV preference by government is becoming widespread. And because manufacturers have limited capital to spend on new vehicles, this drives a manufacturing preference as well.

(In this National Renewable Energy Laboratory study, the most rapid carbon emissions reductions were achieved in scenarios where large-scale EV deployment was combined with wholesale replacement of coal, oil, and gas fired electricity generation with renewable sources like wind and solar.)

Since EVs are more efficient that internal combustion engine based vehicles, they greatly reduce carbon emissions when tied to even traditional grids. But when linked to renewable power sources like wind and solar, EVs produce zero emissions in operation. This combination enables a far more rapid rate of carbon emission reduction.

In addition, the manufacturing base for EV batteries can also be used to build storage systems for intermittent wind and solar energy. This enables the removal of fossil fuel emitting coal and gas fired generators held in reserve for times when the wind doesn’t blow or the sun doesn’t shine even as the EVs themselves remove the need for oil based transporation. Such a manufacturing chain also opens up a new market for auto manufacturers — a fact that both Tesla and Hyundai have learned to their benefit.

https://twitter.com/alnoor31/status/939127052313149445

Because EVs are based on electronic technology that is closely tied to the information age, they can benefit both from synergistic related economies of scale and from various innovations and breakthroughs. This means that EVs already outperform fossil fuel based vehicles in a number of areas. A performance advantage that is increasing and will likely overcome most traditional vehicles by the early 2020s. Because of this advantage, EVs would probably ultimately win out over time. However, the present climate crisis lends urgency to speeding their rate of adoption and in accelerating the rate of harmful fossil fuel based vehicle replacement.

Rise of the Fimbul Fires: Climate Change Enhanced Jets of Flame Rage Across Southern California

Some say the world will end in fire. Some say in ice. From what I’ve tasted of desire. I hold with those who favor fire… — Robert Frost

I am Lorn Sparkfell, guardian of First Frost, without which the world will burn. — Luthiel’s Song, The Death of Winter

*****

Fimbul is an old icelandic word for mighty, giant, great. It is an archaic word that has fallen out of modern use. But considering the fact that the fires now ripping through Southern California are both out of the context of recent milder climates and have explosively expanded to gigantic proportion, it is perhaps time that we should re-introduce the term.

(Photograph of Southern California Fires taken from the International Space Station on December 7 of 2017.)

Sections of Southern California are now experiencing never-before-seen levels of fire hazard as winds gusting to near 80 mph across the region are fanning five out of control blazes. The fires are burning during what should be the cooler month of December. But cool conditions have eluded that part of the state. And the blow-torch like Santa Ana winds that are fanning the flames are being enhanced by conditions consistent with human-caused climate change.

Today, the fire index for Southern California is 296. The threshold for an extreme fire index is 165. And 296 is the highest fire index So Cal has ever experienced according to local firefighters. Fire index is a measure of fire risk. So, if these reports are correct, this region has never seen fire danger hit such an extreme intensity.

(Hurricane Force Winds Fuel Massive Wildfires in Southern California from ClimateState.)

Five fires now burning across Southern California have consumed upwards of 120,000 acres — or a region larger than Atlanta. The Thomas Fire in Ventura County is the largest at approximately 96,000 acres. The Rye Fire, Creek Fire, and Skirball fire all continue to burn. And a new fire — the Horizon Fire in Malibu — has recently ignited. None of these fires are more than 15 percent contained. So all are effectively still out of control.

In total, approximately 20,000 buildings are threatened by fire with more than 300 homes and businesses burned already. 200,000 people are under evacuation orders — enough to fill a relatively large city. Thankfully, there have been no reports of loss of human life so far. But animals, including these horses, haven’t been so lucky.

(Average temperatures across the U.S. West were around 4 C above normal for the entire past 30 day period. This is not at all typical. Image source: Global and Regional Climate Anomalies.)

Climate change skeptics and deniers will try to say that such events are normal for California. That fires always happen. That weather is variable. And tell you five or six or seven other kinds of hogwash.

But the fact is that these conditions are not normal. That California has just experienced its worst fire year on record. That the incidence of large fires in the West has risen fourfold since the mid 1980s. And that report after report after report are linking presently worsening fire conditions in the region to climate change.

Other politically motivated individuals will tell you that now is not the time to discuss climate change — by stating that responding to the disaster itself is more important that examining causes. This is also a red herring — as any effective disaster response will include a responsible review of causes.

To this point, if we are to be effective in both responding to this disaster and in reducing future harm, we should look seriously at the underlying causes that are making fires in places like California worse. And if we are exploring why these Fimbul Fires are happening now, then the big issue is climate change — writ large.

CREDITS:

Hat tip to Colorado Bob

Hat tip to Andy in San Diego

Hat tip to ClimateState

Winter is Supposedly Coming; So Why is California Burning?

As forecasters expect a warming climate will make Santa Ana winds more frequent and faster, that Santa Ana blowtorch is likely to do a lot more damage to the developed parts of the state. — One of the conclusions of a recent climate study.

You can only imagine the impact this weather is having. — Los Angeles Fire Chief.

*****

The popular refrain these days is that ‘winter is coming.’ But for California and the North American West, this is clearly not the case.

(Four large wildfires burn across Los Angeles in this December 5 satellite shot. Image source: NASA Worldview.)

Conditions across the West have been drier lately. Hotter lately. A lot less winter-like during the winter season lately. Add in the fact that climate change is expected to increase the strength of the wildfire-sparking Santa Ana winds and this trend of ebbing winter is a rather serious factor.

The very reason why we use the words — fire season — is due to the fact that fire is more prevalent when it is hotter, when it is drier, and when the dry winds blow more strongly. For California, fire season happens twice a year — once in early summer and again in autumn as the dry Santa Ana winds begin to howl.

(Consistent unseasonal heat and the development of powerful high pressure ridges over the North American West amplify the Santa Ana winds and set the stage for more severe wildfires. This week, a strong ridge and related abnormal warmth and drought helped to fan a historic Los Angeles outbreak. Image source: Climate Reanalyzer.)

The Santa Ana season lasts from October through April. It notable due to the fact that it tends to threaten more heavily populated areas. Its primary mitigating factor — cooler winter weather — is receding. And, according to this research, the same factors that are warming the U.S. West are also making the Santa Ana winds blow stronger. So we have good reason to believe that the effects of human-caused climate change are making California’s fall and winter fire season considerably worse.

Today is December 6, just a little more than two weeks before the Winter Solstice. Seasonally, we are at the gates of winter. Winter should be coming. But, instead, we have drought in Southern California. Instead we have had consistently warmer than normal weather over the past 30 days. Instead we have 70 mile per hour Santa Ana winds raging over withering peaks and through the drying valleys. These are conditions consistent with a fire season amplified by climate change. Not with normal winter.

And today, in Los Angeles alone, we have four fires raging simultaneously.

https://twitter.com/joepezz11/status/938449494223605760

The largest fire, the Ventura Fire, has now burned more than 65,000 acres. It threatens 12,000 buildings. And it is already estimated to have consumed at least 150 of these structures. The fire has cut off power to upwards of 250,000 people and has forced numerous closures and evacuations.

The Creek Fire, Rye Fire, and Skirball Fire have reportedly burned an additional 15,000 acres and forced more than 150,000 people to evacuate. The Skirball fire is threatening the Getty Museum even as it has forced the closure of a section of highway 405. This 150 acre fire is also encroaching upon a 28 million dollar home owned by right wing media mogul — Rupert Murdoch. Notably, Rupert has used his media empire to support the views of climate change deniers and has called rational concern over climate change related risks ‘nonsense.’ Today, one of his many homes may burn as a result of such ‘nonsense.’

(Present location and extent of Los Angeles wildfires. Image source: Google Maps.)

In total, more than 1,000 firefighters are presently battling these four fires around the Los Angeles region. And the risks to the city are now as high as they have ever been. For on Wednesday, weather forecasters are calling for Santa Ana winds to continue to gust as high as 70 miles per hour. With the strength of these powerful fire-inducing winds peaking on Thursday as gusts are predicted to hit as high as 80 miles per hour. The winds will loft sparks and burning material from the fires and drop it over the city — creating nightmare conditions for firefighters trying to contain the four blazes. Red flag warnings — indicating that conditions are ideal for fire combustion — are expected to remain in place over Southern California through Friday.

U.S. Electrical Vehicle Sales Rose by 30 Percent in November, Likely to Hit Near 200,000 by Year End

Good news continues in the U.S. on the renewable energy front where electrical vehicle sales increased by about 30 percent in November of 2017 vs November of 2016.

In all, 17,178 electrical vehicles sold on the U.S. market in November. This number compares to 13,327 sold during November of 2016. Top selling brands for the month were the Chevy Bolt EV, The Tesla Model X, the Chevy Volt, the Toyota Prius Prime, and the Tesla Model S. The Chevy Bolt topped the list of monthly best sellers with nearly 3,000 vehicles going to owners during the month. The top annual seller remains the Model S (at 22,085 estimated sales so far) — which the lower-priced Bolt is unlikely to surpass this year.

(Over the past few years, the performance of electrical vehicles has been steadily catching up to or outpacing that of conventional fossil fuel vehicles. The Tesla Roadster by 2019-2020 will have a 620 mile range, hyperfast charging, a top speed of 250 mph, and be able to go from 0-60 in 1.9 seconds. A combined set of specs that no gas guzzler could hope to match. By 2022, most EVs will cost less and perform better than their comparable fossil fuel counterparts. Image source: Tesla.)

Total electrical vehicle sales for the year so far has hit nearly 174,000 through November. This compares to 158,614 for all of 2016. Given that December is often a top sales month and that Model 3 production is continuing to ramp, it’s likely that final sales for 2017 will hit close to or exceed the 200,000 mark for the year in the U.S.

Model 3 Production Ramp Rate Still a Mystery

Model 3 sales will likely continue to ramp through December as Tesla works through scaling production. Considering the fact that there are more than 500,000 Model 3s on order, the big question is — how fast? For even if Tesla were able to produce 10,000 Model 3s per week, it would take more than a year to fill all the orders.

Production is presently considerably lower. But it more than doubled in November to an estimated 345. A similar rate of increase would result in 800 of the vehicles being sold in December. Meanwhile, the company plans to be making 5,000 Model 3s per week by Q1 of 2018.

There are some indications that Tesla is preparing for a start of mass market releases. It is filling an LA Model 3 distribution site even as it has opened up ordering to customers outside of employees. Meanwhile, Panasonic recently announced that battery production issues will soon clear. Which raises the possibility of a faster ramp going forward.

Updated Nissan Leaf Begins Mass Production

New developments also include the start to mass production of the 2018 Nissan Leaf in the U.S during December. The 2018 Leaf features longer range (150 miles), lower cost (700 dollars less) and higher performance (more horsepower) than the previous Leaf. And it will be followed on by a (higher-priced) 225 mile range version in 2019 which will put it in a distance capability class similar to that of the Bolt and the base line Model 3.

Electrical Vehicles — Key Aspect of the Renewable Energy Transition

In context, solar energy, wind, and battery storage are the triad of new renewable energy systems that have the serious potential to really start cutting down global carbon emissions as they replace fossil fuels.

All these energy systems are getting less expensive. All have what they call a positive learning curve. And all can work together in a synergistic fashion while leveraging technological advances. Economic advantages that fossil fuel based systems lack.

In addition, renewable energy sources help to drive efficiency, even as they clean up transportation, power generation, and manufacturing chains they are linked to by producing zero carbon emissions in use.

(By transitioning to renewable energy as the basis for economic systems, we can dramatically reduce global carbon emissions. In order to stave off very harmful impacts from climate change, this transition will have to be very rapid. In the best case, more rapid than the scenario depicted above. Video source: IRENA.)

On the battery storage side, electrical vehicles are a crucial link in the battery development chain. As electrical vehicles are mass produced, this process drives down the cost of batteries which can then be used to store electricity and to replace base-load fossil fuel power generators like coal and gas plants. Meanwhile, battery electrical vehicles are considerably more efficient than gas or diesel powered vehicles and those linked to wind and solar or other renewable energy sources emit zero carbon in use.

Both electrical vehicles and other renewable energy systems have a long way to grow before they provide the same level of energy produced by dirty fossil fuels today. This large gap represents a great opportunity to cut back on the volume of harmful gasses hitting our atmosphere in the near future.

Deadly California Wildfire Erupts in December, Forcing Thousands to Flee

Last night a 500 acre fire exploded to massive size — raging over the hills of Ventura County in Los Angeles. Fanned by strong Santa Anna winds, the fire ballooned to over 45,000 acres by Tuesday morning forcing the evacuation of several thousand homes.

Already there are reports of homes and structures destroyed as the fire rages in or near a number of populated areas. Late last night, power was cut off to upwards of 200,000 people as the fire crossed utility lines. And as of early this morning, the fire was reportedly advancing toward Ventura with 500 firefighters on the scene trying to beat the blaze back. Thankfully, as of yet, there are no reports of injury or loss of life.

Climate conditions on the ground have been very conducive to out-of-season wildfires. During the past month, temperatures across the region have trended between 2 and 4 degrees Celsius above average. Southern California is settling into drought. And over the past day, a strong high pressure system gathering to the north helped to send 40-60 mph Santa Ana winds rocketing over the hills and valleys around Los Angeles.

(Powerful high pressure ridge north of California sent strong Santa Ana winds over a region of California experiencing a warmer than normal fall and falling into drought. Image source: Earth Nullschool.)

Due to human-forced climate change and a related warming of the U.S. Southwest, the fire season for California now never really ends. Global temperatures have increased by 1.1 to 1.2 degrees Celsius since pre-industrial times, and climate zones are moving north. Both warmer temperatures and more extreme ranges of precipitation due to climate change aid wildfires in the west — first by allowing for rapid growth of vegetation during more intense wet periods and second by drying out these growths more swiftly as the climate regime switches to dry.

Since the 1980s, the number of large wildfires out west has quadrupled. But if fossil fuel burning continues, warming will also continue and the already difficult conditions we see will further worsen.

https://twitter.com/ngeiling/status/938063619065044992

We are entering a time when a region of the west from California all the way north to Alaska and Alberta are starting to see wildfires capable of threatening cities with increasing frequency. If we are to dampen this trend, we need a change to less harmful energy sources and fast.

CREDITS:

Hat tip to Andy in San Diego