Amidst Disasters Around the World, Top Scientists Declare Links Between Extreme Weather and Climate Change

Andy Lee Robinson said it all-too-well — “El Nino + Climate Change = El Diablo.”

And as the Washington Post so cogently notes — the world is now experiencing a rash of Freakish Weather from the North Pole to South America. It’s what appears to be happening as these two major record weather makers fire off simultaneously. A grim tally that includes the highest river levels ever seen in Missouri, the worst floods England has seen since the Middle Ages, the first time the North Pole has seen significantly above freezing temperatures during Winter in modern record keeping, city and region-crippling droughts spanning Central and South America, and seemingly everywhere, but especially in the North Atlantic where Greenland melt outflow has backed up the Gulf Stream, storms that seem to laugh in the face of our weather history.

Extreme weather on both sides of the Atlantic

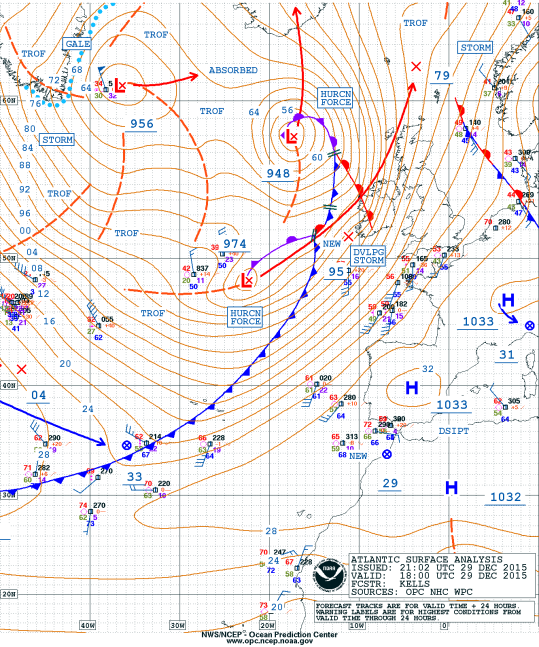
(Extreme weather on both sides of the North Atlantic on December 29, 2015. In upper right of frame, the daisy chain of lows named Frank bears down on Iceland and the UK. Meanwhile, a severe storm dumps flooding rains over the Central US. Image source: LANCE-MODIS.)

Dr. Jeff Masters, at Weather Underground, yesterday made this grim observation:

This isn’t the climate I grew up with. We didn’t see this kind of weather in the 20th century. It’s just a continuation of the crazy weather we’ve seen over the course of the 21st century so far.”

Attributing Single Extreme Weather Events to Climate Change

But Dr. Masters will be the first to tell you that it’s tough to scientifically prove that any one storm or weather system was altered by climate change. In essence, it’s like trying to prove that this home-run or that shut-out was caused by a baseball player taking steroids. We know that the steroids result in a changed performance by the athlete, just as we know that climate change alters the overall performance of weather. But it’s devilishly difficult for scientists to pin down the exact climate change mechanisms going into this or that monster storm or mega-drought. It doesn’t mean that climate change or steroids aren’t at work, because they are. It’s just hard to pin down exactly when.

It’s this gray area that climate change deniers and fossil fuel backers have exploited to generate doubt that climate change is happening at all. They’ve hyper-focused on this storm or that drought, rather than the larger extreme weather and temperature trend — which is clearly changing and worsening. It’s almost as if a group of baseball fans got together to defend the use of steroids in the sport and placed the burden of proof on whether or not an individual home run was caused by the stuff. A false analysis that puts both scientists and those concerned about the environment into the ridiculous position of having to prove the existence of climate change in one storm or a single drought. The ludicrous assumption being that, otherwise, climate change doesn’t exist at all.

But merchant of doubters didn’t count on one thing — the advancement of science.

For truth be told, we are now starting to tease out a few of the direct influences of climate change on extreme weather events. One particularly powerful element being what is known as the heat-moisture engine. It’s well known that temperature differentials and rates of evaporation can have a significant influence on weather. And climate change itself fundamentally alters these aspects of weather by 1 — changing the rate of evaporation and precipitation on a global basis and 2 — putting hot and cold air and water masses in places where they’ve never been before.

image

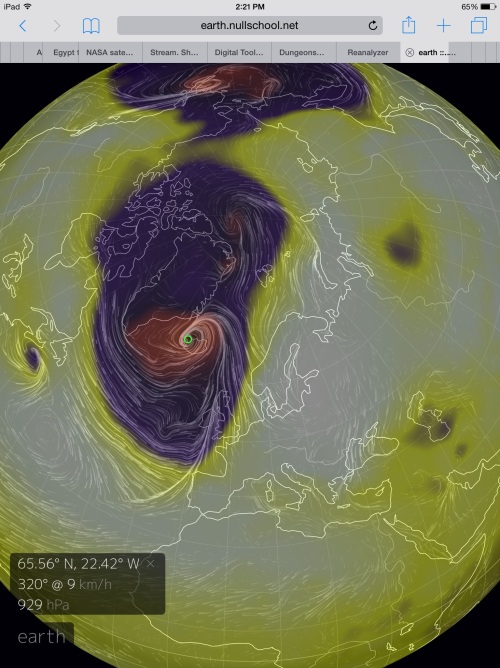
(Sea surface temperature anomalies in the North Atlantic are just going bonkers. From the blazing hot back-up of the Gulf Stream off the US East Coast to the freakish cool pool related to increasing glacial melt just south of Greenland to the abnormally warm and ice-free Barents, sea surface temperature patterns in the North Atlantic have been consistently and radically changed by factors related to human-caused climate change. It’s a fearsome engine of extreme weather that’s only recently emerged. One that may as well have the words ‘human-forced warming’ etched across it in bold script for all to see. Image source: Earth Nullschool.)

Scientific luminary Dr. Kevin Trenberth noted in the New York Times today:

In both the Atlantic and Pacific, the unusually warm ocean surface is throwing extra moisture into the air… Storms over land can draw moisture from as far as 2,000 miles away, he said, so the warm ocean is likely influencing such events as the heavy rain in the Southeast, as well as the record number of strong hurricanes and typhoons that occurred this year in the Pacific basin, with devastating consequences for island nations like Vanuatu. “The warmth means there is more fuel for these weather systems to feed upon,” Dr. Trenberth said. “This is the sort of thing we will see more as we go decades into the future.”

North Atlantic Bombs Going Off The Charts

But it is in the North Atlantic that the influences of human-forced climate change upon the weather are starting grow most starkly clear. There the impact of El Nino is far less obvious. During a typical strong El Nino year, storms tend to form more-so over Iceland. And we’ve seen that. But in the past, El Nino years have also tended to bring colder weather to Scandinavia as the Northern Hemisphere Jet Stream strengthened and locked cold air into the higher Latitudes. However, this year, as in recent years, the Barents Sea has been freakishly warm. This region, which during the 20th Century featured much more sea ice than today, is now mostly ice free. And this broad section of open water vents heat into the atmosphere, warming Scandinavia and providing a weakness in the Jet Stream for warm air invasions of the Arctic.

This week, the warm slot over the Barents provided the pathway for a daisy chain of low pressure systems — ranging from the UK to Iceland to the High Arctic — to pull above-freezing temperatures all the way to the North Pole. It was an unprecedented event and one far less likely to have been strongly influenced by El Nino than by human-forced climate change.

Another feature in the North Atlantic related to climate change is a cool pool of water south of Greenland. This pool is generated by increasing glacial melt outflows from the warming and thawing mountains of ice covering that frozen isle. In juxtaposition to the warming Barents, this cool pool creates what in weather terms is called a dipole. A region of cold facing off against a region of hot. Dipoles are notorious for their potential to generate extreme weather. And the Barents/North Atlantic anomaly dipole is something entirely new. A weather system that aims a more heavily moisture laden Atlantic storm track directly at the United Kingdom. An island nation that this year is sitting directly in the path of a northward moving warm wind. A warm air and moisture flow that has all too frequently embedded monster rainstorms never before seen in the isles’ history.

Extreme Storm Was 40 Percent More Likely Due to Climate Change

Myles R. Allen, a Climate Scientist at the University of Oxford, finds warnings by weather and climate experts that instances of extreme weather would emerge due to human-forced warming are now made real:

“As scientists, it’s a little humbling that we’ve kind of been saying this for 20 years now, and it’s not until people notice daffodils coming out in December that they start to say, ‘Maybe they’re right.’ ”

Dr. Allen was the lead of a cutting edge scientific study that, earlier this month, used model runs to find that the recent spate of record UK floods was made 40 percent more likely by human-forced climate change. The study was spurred by a storm that dropped 13 inches of rain on a Northern England town in just 24 hours. It’s worth noting that a 40 percent increase in extreme weather potential isn’t just a little nudge of the needle, it represents what in scientific terms is known as a state change. In other words, if heating of the world’s climate system has made extreme storms 40 percent more likely in your country, then your climate is now nothing like it was before.

image

(It’s not just daffodils blooming in England. All over the western world flowers have been blooming out of season during the freakishly warm weather of Winter 2015. Above, the iconic cherry blossom blooms in my hometown of Gaithersburg, MD on December 31 of 2015. Photo credit: Robertscribbler.)

After the study, the UK was hit time-after-time-after-time by similar record flooding rains. One being the same system that drove temperatures at the North Pole to above freezing in Winter, flung rains over Arctic sea ice during the depths of polar night, and whose rains and winds again spurred raging floodwaters in North England that destroyed a beloved 300-year-old bridge. This isn’t just one instance. What we’re looking at here is the likelihood that England will continue to experience these kinds of freak storms on-and-on until at least March and probably through to April. And that’s just this year. For the pattern is so altered now that England appears to be facing an age of storms the likes of which it has never seen before.

The Climatic Disruptions Have Now Begun

Today The New York Times is calling it Climate Chaos, The Washington Post — Freakish Weather. But what we are really seeing is the start of the extreme climate disruption experts and scientists have been warning us about all along. A disruption resulting from a severe warming of the globe’s atmosphere, oceans, and ice. One that some tried to deny was happening at all but that is now, as likely as not, wreaking havok in their own hometowns. Given the dismal state of affairs, one has to honestly ask the question — why didn’t we listen? Why didn’t we act early to stop this horrendous mess? And following this question, an assertion — we would be insane to not work as hard as we can to prevent this abysmal situation from further worsening.

Links:

Climate Chaos Across the Map

Freakish Weather From the North Pole to South America

Rivers Reach Never Before Seen Level in Missouri

Warm Storm Brings Rain Over Arctic Sea Ice in Winter

North Pole Hits Above Freezing Temperatures During Winter

Raging Floodwaters Destroy 300 Year Old Bridge in England

Weather Underground

LANCE-MODIS

Hat Tip to Andy Lee Robinson

Hat Tip to TodaysGuestIs

Hat Tip to Suzanne


NASA: Worst of El Nino Still to Come. With Climate Change in the Mix, 2015-2016 Event May Equal Most Devastating On Record

Like and not like.

When we look at the 2015-2016 El Nino and compare it with the 1997-1998 monster we find both similarities and differences.

First the differences. The 2015-2016 El Nino is firing off in a global atmosphere that is on the order of 0.25 C hotter than 1997-1998. It’s an event that’s spring-boarding off an unprecedented hot blob of water in the Northeastern Pacific. One that some studies have linked to human-forced climate change and that has been associated with a plethora of ills ranging from failing ocean health, to the California drought, to strange and troubling warm air and water invasions entering the Arctic. It’s an event that’s occurring in the context of yet another extreme warm air invasion of the Arctic now ongoing in the North Atlantic. And, likely, it’s an event that has, overall, been torqued and twisted by the ongoing pressure of atmospheric and ocean influences associated with human-forced climate change.

Now the similarity. Though a bit more widespread, the heat content of the current El Nino is about equal to that of the monster 1997-1998 El Nino. In other words, there’s an enormous punch of heat hitting the atmosphere from this thing. As a result, you’re bound to get some extraordinarily profound weather impacts. You can see this heat evidenced in the sea surface heights map provided by NASA yesterday below:

NASA TOPEX Sea Surface Heights

(Sea Surface Heights graphic by NASA shows a very intense El Nino currently ongoing in the Equatorial Pacific. Image source: NASA.)

These extreme and very widespread sea surface heights represent a massive load of heat energy steaming off of Equatorial Pacific waters. And what this means is that more severe weather due to the El Nino influence alone is likely in store.

NASA notes that A Still-Growing El Nino is Set to Bear Down on The US:

The current strong El Niño brewing in the Pacific Ocean shows no signs of waning, as seen in the latest satellite image from the U.S./European Ocean Surface Topography Mission (OSTM)/Jason-2 mission. El Niño 2015 has already created weather chaos around the world. Over the next few months, forecasters expect the United States to feel its impacts as well. The latest Jason-2 image bears a striking resemblance to one from December 1997, by Jason-2’s predecessor, the NASA/Centre National d’Etudes Spatiales (CNES) Topex/Poseidon mission, during the last large El Niño event.

El Nino May Hit New Peak Amidst Another Strong Westerly Wind Burst

NASA also hints that the current very strong El Nino may not have even reached peak yet. In evidence to NASA’s statement, this week another strong westerly wind burst (WWB) roared out across the Equatorial Pacific. The winds howled with near gale force intensity against the prevailing trades along a broad stretch of water between New Guinea and the Date Line. Such westerlies tend to increase the intensity of El Nino by generating strong down-welling Kelvin Waves that deliver yet more heat to the sea surface in the Eastern Equatorial Pacific. Heat that then pools out, radiating its energy load into the atmosphere to far-ranging weather impact.

image

(Another strong westerly wind burst runs against the trades on Tuesday, December 29th in the above Earth Nullschool/GFS graphic. Image source: Earth Nullschool.)

Long range models, though pointing toward a peak in December (which may be subject to revision given the intensity of the current WWB), also indicate a rather long lasting event. NOAA’s CFSv2 ensemble, for example, doesn’t show a transition to Nino neutral status until summer — possibly even late summer. As a result, El Nino effects will likely linger for quite a few more months at least while a second peak in intensity over the coming month would further extend and intensify El Nino-related impacts.

Severe Impacts On the Horizon

Regardless of peak intensity timing or overall duration, there’s rough weather expected in the pipe. Even though we’ve already seen instances of severe weather likely associated with El Nino such as the severe four season storm in the Central US, the Eastern US heatwave, droughts across Central America, India, the Carribean and Brazil, Australian heatwaves and a shift of the storm track toward Iceland in the North Atlantic among other impacts, many forecasters believe the worst is still to come.

As an example, Oxfam International recently warned:

“The El Niño weather system could leave tens of millions of people facing hunger, water shortages and disease next year if early action isn’t taken to prepare vulnerable people from its effects.”

But perhaps some of the most devastating impacts could come as storms finally roar into the US West Coast or even as heavy weather continues over the Central US and Northern England. The recent severe weather is expected this week to bring some of the highest Mississippi River levels on record. But if a new set of severe storms emerge, the floods could repeat or worsen — much as we’ve seen during the historic floods gripping North England this year. Floods that could continue hitting the UK through to April. For the West Coast, the heavy storms could come suddenly, unexpectedly and all at once.

NASA notes that recent strong El Ninos have delivered as much as twice the typical amount of rainfall to Southern California:

In 1982-83 and 1997-98, large El Niños delivered about twice the average amount of rainfall to Southern California, along with mudslides, floods, high winds, lightning strikes and high surf.

Although, historically, very extreme events have been capable of delivering quite a bit more. Something to consider when human-forced warming of the globe by about 1 C since the 1880s has amped up the rate of evaporation and precipitation by about 7-8 percent globally. And to this point, though NASA isn’t saying it directly at this time, it is all-too-possible that human forced climate change is adding more intensity to the El Nino related severe weather events we’ve already seen and are likely to see over the coming months. So when you hear it’s the worst flood ever or the worst drought ever or, especially, the hottest day ever, don’t just think El Nino. Think El Nino on climate change steroids.

Links:

A Still Growing El Nino to Bear Down on US

Sick of El Nino? You Ain’t Seen Nothing Yet.

Punishing Four Season Storm Grips US

UK Floods

Extreme Missouri Floods

Warm Arctic Storm Pushes North Pole Above Freezing

Earth Nullschool

Hat Tip to Colorado Bob

Hat Tip to Alex Vasquez

Hat Tip to DT Lange


Warm Storm Brings Rain Over Arctic Sea Ice in Winter

The Starks were wrong. Winter isn’t coming. It’s dying.

******

As The Atlantic so aptly notes, the hottest year in the global climate record is ending with a Storm that will Unfreeze the North Pole. A warm storm that is now predicted to bring never-before-seen above freezing temperatures in the range of 32 to 36 degrees Fahrenheit for the highest Latitude in the Northern Hemisphere by afternoon tomorrow. A storm expected to dump six inches of rain and bring 80 mile per hour winds to a Northern England already suffering the worst flooding events in all of its long history. A storm that will rage ashore in Iceland packing 90-100 mile per hour winds and hurl both heavy rains and snows across that volcanic isle.

Frank 4 lows

(Three of Frank’s multiple strong low pressure systems raging through the North Atlantic on Tuesday, December 29. At 956, 948, and 974 mb, two of these lows each pack the strength of a major hurricane — but with their energy spread out over a larger area. By late tonight two of these lows will have combined and tracked toward Iceland bombing out into a 920 mb class monster storm. Meanwhile, the far flung effects of these storms will have resulted in yet another round of high winds and very severe flooding for England. Image source: Ocean Prediction Center.)

It’s a storm with impacts stretching from just west of Spain and all the way to the North Pole itself. A sprawling monster of a thing covering the area the size of a small continent. The very precursor in fact of Dr. James Hansen’s ‘continent-sized frontal storms packing the strength of hurricanes.’ The dark beasts this visionary scientist feared might arise during an age in which the great glaciers of the world started to melt — the cool outflow of their waters conflicting with a raging human forced warming of the globe to radically destabilize the world’s weather (see Storms of My Grandchildren).

The impacts of this storm, which the UK Met Office is now calling Frank, could well be tremendous. Cumbria in Northern England may be set to experience yet another ‘worst flood on record’ — one of three occurring just this month. And the 920 mb range central low of this sprawling system is forecast to rip through the heart of Iceland itself. But the more visible risk of damages to England and Iceland may well pale in comparison to the quiet, yet drastic impacts taking place in the far north.

image

(Unprecedented doesn’t even begin to describe rain over Arctic sea ice above the 80 degree North Latitude line on the evening of Tuesday, December 29, 2015. It’s something we’d rarely see during summer time. But this rain is falling through the black of polar night during the coldest time of the year. Image source: Climate Reanalyzer.)

There, over the Arctic sea ice today, the rains began in winter time.

As the first front of warm air proceeded over the ice pack to the north of Svalbard, the rains fell through 35-40 degree (F) air temperatures. It splattered upon Arctic Ocean ice that rarely even sees rain during summer-time. Its soft pitter-patter a whisper that may well be the sound to mark the end of a geological age.

For we just don’t see rain over Arctic sea ice north of Greenland during Winter time. Or we used to not. But the warmth that liquid water falling through the black of what should be a bone-cold polar night represents something ominous. Something ushered to our world by human fossil fuel industry’s tremendous emission of heat trapping gasses. Gasses that in the range of 400 ppm CO2 and 485 ppm CO2e are now strong enough to begin to roll back the grip of Winter. Gasses, that if they keep being burned until we hit a range between 550-650 ppm CO2 (or equivalent) will likely be powerful enough to wipe out Winter as we know it entirely over the course of long and tumultuous years of painful transition.

What does the beginning of the end of Winter sound like? It’s the soft splash of rain over Arctic Ocean sea ice during what should be its coldest season.

Links:

The Storm That Will Unfreeze The North Pole

Warm Arctic Storm to Bring Above Freezing Temps to North Pole

Storm Frank to Bring More Flood Misery

Climate Reanalyzer

Storms of My Grandchildren

NOAA’s Ocean Prediction Center

Hat Tip to Neven’s Fantastic Arctic Sea Ice Blog

Hat Tip to DT Lange

Hat Tip to Spike

Hat Tip to Ryan in New England

Warm Arctic Storm To Hurl Hurricane Force Winds at UK and Iceland, Push Temps to 36-72+ Degrees (F) Above Normal at North Pole

We’ve probably never seen weather like what’s being predicted for a vast region stretching from the North Atlantic to the North Pole and on into the broader Arctic this coming week. But it’s all in the forecast — an Icelandic low that’s stronger than most hurricanes featuring a wind field stretching over hundreds and hundreds of miles. One that taps warm tropical air and hurls it all the way to the North Pole and beyond during Winter time. And it all just reeks of a human-forced warming of the Earth’s climate…

Freak North Atlantic Storm Featuring Extremely Low Pressures

Sunday afternoon, a powerful, hurricane force low pressure system was in the process of rounding the southern tip of Greenland. This burly 960 mb beast roared out of an increasingly unstable Baffin Bay on Christmas. As it rounded Greenland and entered the North Atlantic, it pulled behind it a thousand-mile-wide gale force wind field even as it lashed the tip of Greenland with Hurricane force gusts. To its east, the storm now links with three other lows. Lows that are, even now, drawing south-to-north winds up from a region just west of Gibraltar, on past the UK, up beyond Iceland, over Svalbard, and into the Arctic Ocean itself.

image

(GFS forecasts predict a storm bombing out between 920 and 930 mb over Iceland by Wednesday. It’s a storm that could rival some of the strongest such systems ever recorded for the North Atlantic. But this storm’s influence is unique in its potential to shove an unprecedented amount of warm air into the Arctic. A warm storm for the Arctic Winter time. Image source: Earth Nullschool.)

Over the next few days these three lows are predicted to combine into a storm the likes of which the far North Atlantic rarely ever sees. This storm is expected to center over Iceland. But it will have far-reaching impacts ranging from the UK and on north to the pole itself. As the lows combine, GFS predicts them to bomb out into an unprecedentedly deep low featuring 920 to 930 mb (and possibly lower) minimum central pressures by this coming Wednesday. These pressures are comparable to the very extreme storm systems that raged through the North Atlantic during the Winter of 2013. Systems that featured minimum pressures in the range of 928 to 930 mb.

It’s worth noting that the lowest pressure ever recorded for the North Atlantic occurred in the much further southward forming Hurricane Wilma at 882 mb. In the far north, a January 11 1993 storm between Iceland and Scotland featured 913-915 mb pressures. It’s also worth considering that the GFS model currently puts the predicted storm within striking distance of setting a new record for the far north. Meanwhile, ECMWF models predict a somewhat less extreme low in the range of 940 mb (updated: ECMWF now predicts a 920 mb class storm). By comparison, Hurricane Sandy bottomed out at around 940 mb as well.

Regardless of peak strength, the expected storm is predicted to be both very intense and wide-ranging as both model forecasts feature numerous lows linked in chain with a much deeper storm center near Iceland. Among these and further north, two more strong lows in the range of 965 to 975 mb will round out this daisy chain of what is now shaping up to be a truly extreme storm system. The Icelandic coast and near off-shore regions are expected to see heavy precipitation hurled over the island by 90 to 100 mile per hour or stronger winds raging out of 35-40 foot seas. Meanwhile, the UK will find itself in the grips of an extraordinarily strong southerly gale running over the backs of 30 foot swells.

Warm Winds to Force Above Freezing Temperatures For the North Pole

image

(By early Wednesday, temperatures at the North Pole are expected to exceed 1 degree Celsius readings. Such temperatures are in the range of more than 40 degrees Celsius (72 degrees Fahrenheit) above average. Image source: Earth Nullschool.)

All along the eastern side of this storm, powerful warm winds are expected to funnel northward. Originating along the 35 degree North Latitude line west of Spain, these winds will force a train of warm air and moisture pole-ward ahead of our storm. The winds will rush up over a very riled North Sea, they will howl into a far warmer than normal Barents, and they will roar on past Svalbard — finally turning as they pass beyond the North Pole.

These winds will bring with them extraordinarily warm temperatures for the High Arctic region during Winter time. By Wednesday, the North Pole is expected to see temperatures in the range of 1-2 degrees Celsius or 41-42 degrees C above Woods Hole and NASA baseline Winter-time temperatures (73-75 degrees Fahrenheit above the normal daily temperature of -40 F for a typical Winter day). Such an extreme departure would be like seeing a 120 degree (Fahrenheit) December day in my hometown of Gaithersburg, MD.

NCAR and reanalysis data for the North Pole at this time of year put daily averages in the range of -30 C (-22 F) and -20 C (-4 F) respectively. Taking all these measures into account, it appears that we’ll be seeing temperatures in the range of 36-72 degrees above normal North Pole readings for late December, depending on which baseline you use.

By any yardstick, these are extremely warm and likely record readings for the North Pole. Winter Temperatures have only approached the freezing mark on one previous occasion in the NCAR data record. And the predicted temperatures for Wednesday appear set to surpass this odd record. Needless to say, a 1-2 C reading at the North Pole during late December is about as odd as witnessing Hell freezing over. But, in this case, the latest wave of warmth issuing from a human-driven shift toward climatological hell appears to be on schedule to arrive at the North Pole by Wednesday.

From Slate on Tuesday, December 29:

“I contacted a team of climate scientists at the University of Washington who maintain a fleet of weather monitoring equipment near the North Pole. James Morison, the principal investigator of the North Pole Environmental Observatory, said he’s “never heard of” temperatures above freezing in the wintertime there. Looking closer at the weather data, it appears this event is in fact unprecedented during the time period from late December through late April”

Arctic temp anomaly +4 C

(The Arctic region as a whole is expected to experience a [frankly quite insane] temperature anomaly in the range of 4 degrees Celsius above average by January 3rd of 2016. Note the broad regions over Northern Canada, Siberia, and the Arctic Ocean that are predicted to experience temperatures in the range of 20 degrees Celsius above the already hotter than normal 1979 to 2000 baseline readings. For some areas — particularly in Northern Canada — this will mean near or even above freezing temperatures for tundra and permafrost zones in the depths of Winter. A set of conditions that has serious implications for permafrost thaw and related carbon store feedbacks. Image source: Climate Reanalyzer.)

New Freakish Weather Patterns Concordant With Human-Forced Climate Change

The deep, northward-driving synoptic pattern associated with both powerful high Latitude storms and warm winds is only something we’ve begun to see during recent years. The warming polar environment itself generates weaknesses in the Jet Stream which tends to allow these warm air invasions. In addition the warming oceans — which hold heat for longer than land masses — generate pathways for warm air invasions of the Arctic during Winter time. The Barents Sea, for example, has been particularly warm during recent years which has resulted in numerous warm wind invasion events issuing northward over Svalbard and regions eastward during recent years.

A final ingredient to this highly altered weather pattern appears to be a cooling of the sea surface in the North Atlantic just south of Greenland. This cooling has been set off by an increase in fresh water melt outflows from Greenland as glacial melt there has accelerated concordant with human-forced warming. The cool pool of glacial melt water south of Greenland has aided in the generation of a dipole featuring cool air to the west, warm air to the east. This year, warm air has tended to flow northward over Spain, the UK, and along a region between Iceland and Scandinavia. During the Winter of 2015-2016, this warm air slot has also been the breeding ground for very unstable weather and a number of powerful storm systems.

Polar Vortex Ripped in Half Late Dec 2015

(It’s an El Nino year. But despite a climate feature that would typically strengthen the Jet Stream, what we see is another Arctic warm air invasion reminiscent of the recent polar vortex collapse events of Winters 2012 through 2014-2015. Note that the region of coldest air, which would typically tend to center over the North Pole has been driven south toward Greenland and Baffin Bay. A pattern that we’d expect concordant with world ocean warming and Greenland melt as a result of human-forced climate change. Image source: ECMWF.)

Unfortunately, this larger overall pattern marks a progression away from typical North Atlantic weather and toward a much more stormy environment. It’s an environment that is all too likely to be marked by features of warm air invasions moving up through the Barents and into the High Arctic during Winter. Of the Northern Hemisphere storm circulation tending to wrap around Greenland as the center of cold air shifts from the North Pole to the last bastion of dense glacial ice. And of a very unstable storm generating cold water and surface air temperature zone deepening and gaining an ever-stronger hold within the North Atlantic.

These are influences we see now. Ones that are impacting both the current powerful storm over Iceland and the unprecedented surge of warm air that is now preparing to invade the High Arctic. And though El Nino likely also played a part in the shifting of the storm generation zone toward Iceland, the far northward propagation of warm air into the Barents and High Arctic along with the extreme strength of the predicted storm are both likely new features of an overall altered pattern. What we witness here are both climates and weather features changing before our eyes in the form of what to us may seem a freak event — but what is actually part of a dangerous transition period away from the stable climates of the Holocene.

UPDATE: ECMWF model runs now predict an extraordinarily strong 920 mb low striking Iceland by Wednesday. With GFS model runs coming into agreement, the certainty of this extreme forecast intensity increases. NOAA’s Ocean Prediction Center now has an updated forecast of 90 knot winds for the region in conjunction with this very impressive storm system.

Finally, as the Washington Post indicates in this excellent article, though some scientists are increasingly concerned that current powerful North Atlantic storms have a climate change influence, others remain unconvinced. For my own part, and based on continued observations of the weather data, model attribution studies, sea surface temperature, and glacial melt indicators, I believe there is a strengthening case for climate change attribution in the instance of more frequent, intense North Atlantic storms and especially in the recent very frequent Arctic warm air invasion events. In addition, it will unfortunately take years-to-decades for the institutions of modern science to come to a consensus on this and other climate change related issues. Given that events are now likely in play that will generate rapid changes to global and, in particular, North Atlantic weather patterns, it is impractical to wait for a scientific consensus to develop before reporting on these emerging issues. Waiting, at this time, would be irresponsible as it would result in a general lack of awareness of the overall threat.

To paraphrase Dr. Jennifer Francis — at this point it is not practical to wait for us to achieve perfect knowledge. And, in fact, we have more than enough indicators at this time to show that something is quite dreadfully wrong.

SECOND UPDATE TUESDAY, DECEMBER 29

THIRD UPDATE 12:36 AM EST, WEDNESDAY, DECEMBER 30:

As of early Wednesday morning temperatures at the North Pole had risen to 1.1 C or 34 degrees F representing the highest temperatures ever recorded at the North Pole for this time of year and the first time this region of the high Arctic has experienced temperatures substantially above freezing during Winter.

image

(1.1 C reading at the North Pole by Midnight, EST is a historic high temperature for the, what should be frigid, top of our world. It’s also yet one more bit of evidence showing that global weather is now in the process of going far off-kilter. Image source: Earth Nullschool.)

Links:

Earth Nullschool

ECMWF

Climate Reanalyzer

Very Low Minima of North Atlantic Cyclones During Winter of 2013

Warning From Scientists Age of Storms, Rapid Sea Level Rise is Coming Soon

Dr Jennifer Francis on Jet Stream Changes and Increasing Instances of Extreme Weather

NOAA Ocean Prediction Center Atlantic Analysis

NCAR North Pole Temperature Graphic

Slate on Extreme Weather (It’s worth noting that the storm causing extreme weather in the Central US is not the same one that’s bombing out over Iceland and driving this severe polar warming event, though these storms are certainly both part of the same odd overall weather pattern.)

Washington Post on Freak North Atlantic Storm

Hat Tip to DT Lange

Hat Tip to Colorado Bob (Remember — “Hot seeks Cold.”)

Hat Tip to TodaysGuestis

Special Mention to JDAllen and the Arctic Sea Ice Blog (I just became aware they began a discussion on the topic of unprecedented Arctic warming on December 26. ASIB deserves mention for their unfailing monitoring of the Northern Hemisphere sea ice and cryosphere as well as for their extraordinarily informative discussions.)

Record Hot Arctic: NOAA’s 2015 Report Card Shows Signs of Failing Climates

In NOAA’s most recent annual Arctic Report Card, the records just keep falling as the litany of global warming related events appearing throughout the far north continued to crop up with ever-more dizzying frequency…

(NOAA’s Arctic report is a stark expose of the state of the Arctic climate. What we view now is a system undergoing a rapid and dynamic transition from its previously stable state to something that is entirely new and alien to human civilization. Video source: NOAA.)

The 12 month period of October 2014 to September 2015 was the hottest one year time-frame since record keeping began for the Arctic back in 1900. As a result of these record warm temperatures, Arctic sea ice during the Winter hit its lowest maximum extent ever seen. Summer sea ice extent was likewise greatly reduced hitting its 4th lowest extent ever recorded. Old, thick sea ice which represented 20 percent of the ice pack in 1985, has precipitously declined to a mere 3 percent of the ice pack today. Snow cover also took a hit, declining to its second lowest extent on record during 2015 and striking a range of 50 percent below the typical average for the month.

Overall warming of the Arctic is at a much more rapid pace than the rest of the world. This accelerated pace of warming is due, in large part, to loss of snow and sea ice reflectivity during the Spring and Summer months. As a result, more heat is absorbed into dark land and ocean surfaces — a heat that is retained throughout the Arctic over longer and longer periods. And, though NOAA doesn’t report it in the above video, overall higher concentrations of greenhouse gasses like methane and CO2 in or near the Arctic region also contribute to a higher rate of warming (see NOAA’s ESRL figures). In a world that is now rapidly proceeding beyond the 400 ppm CO2 and 485 ppm CO2e threshold, this is exactly the kind of Northern Hemisphere polar amplification we would expect to see.

Warm Winds, Greenland Ice Sheet Melt, and Mass Migrations

NOAA notes a marked change in the distribution of life with mass migrations of all life forms well underway in and around the Arctic. Transitions and disruptions are most highly visible among marine mammals like walruses and polar bears — who are increasingly forced to live on land during the summer months. Meanwhile, an ever-broadening number of non-native fish are invading the Arctic from the south.

south-to-north-weather-pattern-alaska

(South to north weather patterns, like the one featured above, have increasingly drawn warm winds up and over Alaska. An anomalous new weather feature that has merited comment in NOAA’s recent annual Arctic report card. Image from “Arctic Heatwave to Rip Polar Vortex in Half”.)

NOAA also links the warm wind invasion events reported on widely here to the second worst wildfire season ever to strike Alaska in 2015. A dipole feature that displays teleconnections between Arctic snow and ice loss, the hot blob of water in the Northeastern Pacific, and the persistent trough that prevailed over the US East Coast during the Winter of 2014-2015.

Finally, Greenland Ice Sheet surface melt hit a maximum coverage above 50 percent for the first time since the extreme melt that occurred in 2012. NOAA notes that the amount of ice delivered to the ocean by glaciers also increased across Greenland even as recent studies continued to find an increasing prevalence of glacial destabilization and acceleration among Greenland’s ocean-terminating glaciers.

NOAA concludes: “Taken together, 2015 shows a continuing set of major changes in the Arctic.”

Links:

NOAA’s Arctic Report Card

Major Arctic Wildfire Outbreak

NOAA ESRL

Arctic Heatwave to Rip Polar Vortex in Half

El Nino, Polar Amplification or Both?

Hat Tip to Alexandr


Freak Wildfire Outbreak Strikes Northern Spain During Winter

Over the weekend an unexplained wildfire outbreak erupted across the Asturias and Cantabria regions of Northern Spain. In total, more than 100 blazes flared as 60 mile-per-hour winds and freakishly warm temperatures in the upper 60s to lower 70s (Fahrenheit — 15 to 20 degrees Celsius) spread across Spain’s northern coastal provinces.

(More than 140 active wildfires swept across Northern Spain over the weekend. Video Source.)

More than 200 firefighters responded to the strange outbreak — one all-too-certainly linked to record warm global temperatures in the range of 1.06 C above 1880s averages. Fortunately, there are currently no reports of injuries or loss of property or life. Just an odd and somewhat terrifying mass wildfire eruption occurring in typically damp North Spain at a time near the Winter Solstice.

Another Abnormal Winter Wildfire Event

Though the cause of these fires has yet to be officially determined, temperatures in the range of 9-18 degrees Fahrenheit (5-10 C) above average and very strong winds — gusting up to 60 miles per hour — likely contributed to this anomalous winter wildfire outbreak. This warm air flow was pulled northward along the eastern edge of a powerful Atlantic weather pattern that, through most of Fall and Winter, has been hurling strong storms into Iceland, coastal France, the United Kingdom, and Scandinavia. These warm winds gained extreme intensity on Saturday and Sunday and likely sparked and fanned the wildfires (in much the same manner that Santa Anna winds risk wildfires in California).

image

(On Saturday and Sunday, powerful southerly winds and abnormally warm temperatures swept over Northern Spain — setting the stage for a freak mass wildfire outbreak during winter time. Image source: Earth Nullschool.)

It is not usual at all for wildfires to occur during Winter anywhere in Spain, especially not along the northern coastal regions where cool, wet weather tends to prevail as December transitions into January. But this year the typical rainfall pattern has been interspersed with warm, windy periods and comes at the end of a long, much hotter than normal year. A heat that has almost certainly contributed to a fire year that, for Spain, has resulted in the burning of more acres during 2015 than for all of the previous two years combined.

As with other recent large Winter wildfire outbreaks, the influence of a human-forced warming of the global climate system is writ large. Winter wildfire outbreaks, especially in the Northern Hemisphere, are becoming more frequent — with some major winter wildfire outbreaks even extending to regions near or above the Arctic Circle. Fires that are upshots to an overall extension of the fire season combined with a much greater frequency of wildfire outbreak. It’s trend that comes both from a larger warming of the Earth’s climate system. And not only does the added heat itself fuel a higher frequency of wildfire outbreak, it also increases drought intensity and the speed of drought onset — which generates a compounding factor for increasing wildfire frequency.

Major news media sources reporting on these incidents have yet to make this all-too-obvious link. And, given continued sparse analysis on human forced climate change as a whole, it’s questionable that they ever will.

Links:

Forest Fires Sweep Across Northern Spain Despite Winter Rain

Spanish Firefighters Battle Over a Hundred Fires in Asturias

Fire in Spain: More than 140 Active Fires

Arctic Wildfires in Winter

2015 Hottest Climate Year on Record

Earth Nullschool

Hat Tip to Wharf Rat


1.06 C Above 1880: Climate Year 2015 Shatters All Previous Records For Hottest Ever

We knew it was going to be a record breaker. We knew that atmospheric greenhouse gasses in the range of 400 parts per million CO2 and 485 parts per million CO2e, when combined with one of the top three strongest El Ninos in the Pacific, would result in new all-time global record high temperatures. But what we didn’t know was how substantial the jump would ultimately be.

Today, the numbers were made public by NASA. And I hate to say it, but it’s a real doozy. Overall, according to NASA, Climate Year 2015 — the 12 month period from December of 2014 through November of 2015 — was 0.84 C hotter than NASA’s 20th Century Baseline. That’s 0.11 C hotter than previous hottest year 2014 and a full 0.21 C hotter than climate change deniers’ favorite cherry — 1998. In other words past record hot years are being left in the dust as the world is heating up to ever more dangerously warm global temperatures.


Global temperature increase

(NASA’s global temperature graph through end 2014. Climate year 2015, at 0.84 C above the NASA 20th Century baseline, is quite literally off the chart. Image source: NASA GISS.)

In any case, the current NASA Graph above is going to need some serious adjusting as the new global average for climate year 2015 is simply off the top of the chart. A new jump that gives lie to the increasingly obvious fake claim made by climate change deniers over the past two years that global warming somehow ‘paused.’

But aside from reality once again making the fossil fuel cheerleaders of the world (aka climate change deniers) look increasingly imbecilic, 2015’s new temperature increase is a visible sign of increasing climate danger. This year’s 0.84 C temperature departure above NASA’s 20th Century baseline is 1.06 C hotter than 1880s values. It’s a number just 0.44 C (or two more strong El Ninos) away from crossing the very dangerous 1.5 C threshold that nations of the world recently pledged to attempt to avoid at the Paris Climate Summit. It’s also a number more than halfway toward hitting the catastrophic 2 C warming threshold. Perhaps more ominously, Monthly temperature departures in October of 2015 hit a range of 1.06 C above the 20th Century baseline and 1.28 C above 1880s averages — shorter term ranges that are already coming close to testing the 1.5 C threshold.

Hard Work Ahead to Prevent the Most Dangerous Outcomes

Regardless of arguments about how possible or likely we are to avoid such dangerous and catastrophic warming in the future, we should recognize now that we’ve already locked in enough atmospheric and ocean heat to begin setting off dangerous geophysical changes. A world 1 C hotter than 1880 is a world of increasingly rapid sea level rise, a world of increasingly swiftly declining ocean health, a world where water security in many places is already at risk, a world of worsening droughts and deluges, a world in which the strongest storms are growing ever stronger. A world 1 C hotter than 1880 is a world that is starting to see the dangerous and damaging impacts of human-forced climate change. A place where the worst is still yet to come.

So let’s not mince words. It’s going to be bad and it’s going to get worse. How bad and how much worse depends on how rapidly the world weans itself off fossil fuels and hits net zero or net negative carbon emissions. At more than 50 billion tons of CO2e hitting the atmosphere each year now, we have a long way to go and fast. Let’s hope for everyone’s sake that we’re up to the challenge. It’s getting rough out there. Let’s not tempt nature to unleash upon us the worst of the world’s climate demons. Unfortunately, a few have already slipped the bonds. But there are many more waiting if we continue along this wretched path of burning.

Links:

NASA GISS: Global Temperature Analysis

NASA GISS

Paris Climate Conference ‘At the Limits of Suicide’

UPDATES TO FOLLOW

More Signs of Gulf Stream Slowdown as Floods Devastate Cumbria, England

Back in 2009 heavy rains fell over the Northern UK. The rains, abnormally intense, pushed river levels to heights never before measured. A wall of water built-up. Surging over banks, it inundated the town of Carlisle, Cumbria, England — forcing many to flee to higher ground.

At the time, weather forecasters and climatologists wondered if there might have been a global warming link to the freak Cumbria floods. There was certainly risk. Risk that the North Atlantic would become a mess of storms as the Gulf Stream slowed down and cold air masses collided with warm — developing a raging storm track to the west of the UK. A climate situation with the potential to draw in never-before-seen rivers of moisture and set off flooding the likes of which the UK has never known. Flood defenses were shored up. New commitments were made to shift the country away from carbon emissions.

But in just six short years many of those commitments have lagged. Funding for flood defenses was cut by conservatives in the UK parliament even as similar funds for wind and solar energy were targeted in favor of fracking the countryside for natural gas. The usual litany of climate change denial spewed out of the regular conservative mouthpieces in the politics and the media. It was the height of hubris and mismanagement. And again we have a ‘never before seen’ rainstorm roaring up out of a greatly troubled North Atlantic.

*****

Sands Center Carlisle River Level

(On December 6 of 2015 river levels at Sands Centre in Carlisle hit 8 meters above the typical range. The previous record highest level for this river gauge was 4.5 meters — a level the new flood defense systems were designed to contain. But this week’s rainfall simply overwhelmed both flood defenses and previous expectations for the upper limits of extreme weather. Image source: Shoothill Gauge Map.)

On Saturday and Sunday of December 5th and 6th, 2015, Cumbria flooded again. An even higher flood surge than before overwhelmed the new defenses and forced residents to yet again flee. Then, just three days later on Wednesday more than two months worth of rain fell over the Cumbria region. The amount at 341 mm in just 24 hours was a new UK record and compares to average total rainfall for the month of December at 146 mm. The county was again overwhelmed by water. Human chains were formed to help bring those stranded to safety. After the waters began to subside — devastation. More than 6,000 homes were found to have been flooded with perhaps as many as 20,000 people displaced.

This was the flood UK parliamentarians swore they would fight to keep from happening again. The one conservative politicians said would never again happen in our lifetime. A flood that was worse than the terrible event of 2009 happening just six years after the first. And one that was almost certainly made worse by the dreadful alterations wrought by human forced climate change on the environment of the North Atlantic.

The Gulf Stream Slowdown and The Great New Storms of the North Atlantic

One doesn’t have to be a climatologist to see that sea surface temperature patterns in the North Atlantic are all topsy-turvy. The region of ocean to the west of the UK is cooler than normal. It’s a great cool pool once predicted by climate scientists and now made real by a human-forced warming of the world’s airs and waters. The result of an ever-increasing glacial melt outflow coming from Greenland.

image

(Temperature anomaly deltas in the region of the Gulf Stream are in the range of -5 C below average in the northern, Greenland melt-related, cool pool, and +9 C above average in a hot ribbon off the US East Coast. This overall new 14 C temperature variance from south to north is generating new atmospheric instabilities that intensify storm systems firing off in the North Atlantic. Image source: Earth Nullschool.)

Climate scientists have known for a long time that just such a cool pool of fresh glacial melt could play havok with weather across the North Atlantic and on to far-flung regions of the globe. And it’s just such a weather disruptor that we see developing there now. One that was originally dramatized in the film The Day After Tomorrow. But one that will all-too-likely represent centuries of catastrophic weather terminating in a new, much hotter, far more toxic, and far less life-sustaining world — rather than simply a week-long hemisphere-sized superstorm abruptly halted by a nonsensical new ice age (Please see World Ocean Heartbeat Fading).

To the south of our cool pool and on off the US East Coast we find that sea surface temperatures are screaming hot. Hot as in the range of 5-9 degrees Celsius (9-16 degrees Fahrenheit) above normal. Both the cool pool to the north and the hot pool to the south taken together are an ominous sign that the Gulf Stream is slowing down. The cool, fresh water outflow from glaciers near Greenland is interrupting a heat and salt driven over-turning there. The over-turning, which drives the Gulf Stream current, slows down. As a result, heat that would be transported northward instead backs up off the US East Coast.

What results is a kind of dipole temperature pattern that aids in storm generation over the North Atlantic. The cool pool tends to pull cold air southward from Greenland. The hot ribbon off the US East Coast tends to draw warm, moist, tropical air into collision with the trough zone south and east of Greenland. The result is a high potential for storm bombification in the region west of the UK. These storms, in turn, pull rivers of moisture up from the tropical airs to the south and over England, Ireland and Scotland. This confluence of weather sets off unprecedented storms and heavy rainfall for the UK.

Both the new North Atlantic sea surface temperature pattern and the resulting storms are not normal. They are an upshot of only recently emerging weather patterns resulting from a human-forced climate change. And, sadly, we can expect to see them continue to worsen. This year, in particular, could see some extraordinary trans-Atlantic storms as the El Nino-driven tendency for trough development and tropical air injection over the US East Coast comes into play. But overall, El Nino or no, the new dipole temperature anomaly pattern in the North Atlantic fed by Greenland melt and a related Gulf Stream slowdown will tend to keep pushing the region into a stormier and stormier pattern for the foreseeable future. The UK and its politicians should be made well aware of the consequences of their actions. Continuing to plan to burn fossil fuels is simply adding more fuel to an already raging climate fire.

Links:

The Story of the 2009 Cumbria Floods

More Rain and Flooding Expected in Northwest England

Toxic Interests: In Lead-up to Paris Summit, Conservatives Around the World are Fighting to Kill Renewable Energy

The Devastation in Cumbria

Shoothill Gauge Map

Earth Nullschool

World Ocean Heartbeat Fading

Warning From Scientists – Halt Fossil Fuel Burning Fast or Age of Superstorms, 3-20 Foot Sea Level Rise is Coming Soon

Hat Tip to Dr. James Hansen

Hat Tip to Neven, Jeremy, and Miles

Monster El Nino Hurls 43+ Foot Waves at US West Coast

For NOAA, it looks like we’re well on the way toward seeing one of the most powerful El Ninos ever recorded. And already, there’s some brutal Fall and Winter weather events starting to emerge as a result. One event, in particular, is today roaring into the US West Coast like a Godzilla-hurled freight train.

It’s just one upshot of a Monster El Nino in a record warm world. A weather and climate event — one likely pumped up by an overall atmospheric warming of 1 C above 1880s levels — that will likely continue to have severe and worsening global impacts over the coming months.

image

(Ocean waves hit insane heights of 43 feet [13.2 meters] today as another powerful storm roars into the US West Coast. Image source: Earth Nullschool.)

One of the 3 Strongest El Ninos On Record

NOAA’s September, October, November ONI Index, the key zone for measuring El Nino strength, hit a +2.0 degree Celsius positive anomaly this week. That’s just 0.3 C shy of the most powerful El Nino ever recorded — 1997-1998 which peaked out at +2.3 C in the same monitor. With October, November and December likely to show even hotter overall readings for the Central Equatorial Pacific, it appears that the 2015-2016 El Nino will strike very close to this ONI high mark. Peak weekly sea surface temperature values already exceeded top 1997-1998 temperature levels for NOAA (+2.8 C for 1997-1998 vs + 3.1 C for 2015-2016). So we wait on the ONI three month measure for October, November and December to give broader confirmation.

The other major El Nino monitor — the Bureau of Meteorology (BOM) in Australia — has weekly sea surface temperatures peaking at +2.5 C in the same zone. This is 0.2 C short of peak 1997-1998 values. BOM notes that the current El Nino is near peak and that, according to its own measures, is unlikely to exceed 1997-1998 but will likely hit within the top 3 strongest events. According to BOM:

The 2015–16 El Niño is strong, and likely to rank in the top three events of the past 50 years. Presently, several key indicators fall short of their 1997–98 and 1982–83 values, both in the ocean (e.g. sub-surface temperatures, which have peaked around +8 °C this year, compared to +12 °C in 1997–98), and atmosphere (e.g. SOI, for which monthly values peaked around −20, while 1982–83 had several months at −30).

NOAA sea surface temperature anomalies

(NOAA Equatorial Pacific sea surface temperature [SST] anomaly tracking appears to indicate that the 2015-2016 El Nino may have hit peak during mid November. Though a second peak is possible in December, atmospheric and ocean trends will tend to push for gradual SST cooling over the coming months. Overall, the 2015 to 2016 El Nino is likely to be among the top 3 strongest on record. A climate event that in a world warmed by 1 C above 1880s values has the potential to set off some very extreme weather over the coming months. Image source: NOAA SST Anoms 5N to 5S.)

Based on a reading of these two analysis by expert agencies, we revise our previous statements to come into line with NOAA and BOM forecasting. Though it’s still possible that 2015-2016 may exceed peak 1997-1998 intensity, it is more likely that the current El Nino will fall into the range of the top three most intense such events. This is likely due to the fact that El Nino has probably already peaked and that though some indicators show 2015 as exceeding 1997-1998 in intensity (NOAA weekly SST values), the broader, long-term indicators still rank 1997-1998 as the most intense in the modern record.

Potentially Very Severe Weather on The Way

That’s not to say that related weather events won’t be quite extreme. In some respects, hottest ever atmospheric and ocean temperatures on a global basis provide even more available energy for storms, heavy rainfall, droughts, and wildfires. Globally, the Earth has warmed by between 0.2 and 0.3 C from peak 1997-1998 atmospheric temperature values to those we are likely to experience during 2015 and 2016. That means rates of evaporation and precipitation have increased by about 2 percent overall. In addition, new climate instabilities have tended to arise due to increased rates of glacial melt, polar amplification (especially in the Northern Hemisphere), and related ocean surface warming along with the weakening of some of the major oceanic heat conveying currents.

A top 3 strongest El Nino firing off in this global climate environment is, therefore, not entirely the same creature as a Monster El Nino firing off during the 1980s or even the 1997-1998 El Nino. In particular, the added atmospheric moisture loading, the slowing down of the Gulf Stream off the US East Coast and related back-up of warm water in that region, and the added rates of evaporation due to overall warming of the Earth-Ocean system present potentially more severe drought hazards for regions like Brazil and Australia, potentially more severe extreme storm hazards for the US West Coast as the storm track ramps up, and potentially more severe Winter oceanic and coastal storm hazards for the US East Coast, the North Atlantic and the United Kingdom.

Disaster Officials Worry, Make Calls For Readiness

Federal disaster officials are keenly aware of these risks and have been issuing warnings for regions of the US West Coast since October. NOAA and FEMA bulletins have urged people to keep extra food and water on hand and to prepare for extended periods of sheltering in place during heavy rainfall, landslide, snowfall or coastal flooding events. Statements today continue to urge preparedness for what is likely to be a very extreme Winter weather season. In San Jose Mercury News, FEMA emergency manager Bob Fenton expressed his extreme concern today after a disaster preparedness drill in Sacramento:

“It is critical that citizens take the risk seriously. If you hear a warning to evacuate, act accordingly. People often want to ‘wait and see’ — but, please, don’t wait. Everything can be replaced, but your life can’t.”

The US Southwest and South-Central California are especially vulnerable to severe flooding events during strong El Ninos in the December, January, February timeframe. Such events can deliver powerful rivers of tropical moisture to this region. Called Pineapple Express, these atmospheric rivers can develop along an arc running from the Equator, through Hawaii and then terminating over the US Southwest. The most extreme of these events have the potential to deliver 200, 500, or 1000 year deluges resulting in many feet of rainfall for the Central Valley region. A situation that some researchers have called an Ark-Storm and have linked to the (likely El Nino-related) Great Flood of 1862.

In today’s context, we have one of the top 3 strongest El Ninos firing off in an atmosphere that, due to human forced warming in the range of 1 C, sees an overall 7-8 percent increase in the rate of evaporation (vs 1880s contexts) and precipitation. So any river of moisture that does develop may likewise become further engorged than was previously typical, thus resulting in more severe rain storms and a related heightened flood risk. It’s a risk, that in any case, FEMA disaster managers are taking very seriously.

43 Foot Waves off US West Coast

As officials issued warnings and FEMA managers drilled in Southern California, another powerful storm packing 60-80 mile per hour winds, heavy rains, and 43+ foot waves roared into the US West Coast this week. The 960 mb storm kicked off coastal flood, gale and storm warnings from Northern California through Washington State.

West Coast Storm

(Another powerful storm roars into the US West Coast bringing with it flooding rains, heavy surf, coastal storm surges, and mountain snows. The currently very strong El Nino is likely deliver more severe storms of this kind over the coming months. Image source: NOAA GOES.)

Interior flood warnings were also issued as between 4 and 18 inches of rain fell over the past 3 days with 2-4 inches more expected today. The event had already spurred over 9 landslides even as, according to the Weather Channel, more than two dozen river gauges had topped flood stage across Washington and Oregon. It’s a heavy soaking that began in November and just keeps getting worse with each new storm.

These storms are fueled by a powerful flood of heat and moisture boiling off the Godzilla El Nino in the Pacific. A dynamic that’s generating an extraordinarily powerful Pacific storm tack. This week, models predict another extreme storm — one that is expected to bomb out as a 930 mb monster packing 75 kt winds and 52+ foot waves in the Bering Sea between Russia and Alaska. And given the way El Nino is charging up the atmosphere, these Pacific beasts are bound to keep roaring on in.


Links:

Climate Prediction Center — Cold and Warm Episodes by Season

Monster 2015 El Nino May Be Most Intense Ever Seen

Earth Nullschool

Pacific Northwest Storm Parade to Bring Rain, Wind and Snow

NOAA SST Anoms 5N to 5S

Federal Officials Warn Californians to Prepare for Onslaught

NOAA GOES

NOAA Ocean Prediction Center — Pacific

Hat tip to DT Lange


Paris Climate Conference ‘At the Limits of Suicide,’ Commitments Nowhere Near Enough to Miss 2 C

We have a serious global problem. If we continue burning fossil fuels as we are, and if the fossil fuel industry continues to grow along its projected path, the world will see a catastrophic rate of warming between 3 and 7 degrees Celsius above 1880s values by the end of this Century. So much warming would likely mean a very bad end. A bad end for much of global civilization as we know it. A bad end for many of the innocent living creatures who inhabit our world. And a bad end for many of our children — those now being born today who will face the climate troubles we are locking in.

As the Pope succinctly noted in a recent statement seen here in Rueters:

“I am not sure, but I can say to you ‘now or never.’ Every year the problems are getting worse. We are at the limits. If I may use a strong word I would say that we are at the limits of suicide.”

And suicide may seem a rather mild word compared to the reality we would face. So much warming would result in entire forests — tropical, temperate and Arctic lands — burned in great conflagrations, in the destruction of vast agricultural regions, in turning much of the world ocean into a great dead zone, in drowned cities, and in extreme weather related mass casualty events with the destructive ability to take down entire megalopolises. To call such warming simply catastrophic may well be a mild misnomer. Because the world on which we live — planet Earth — has never seen so much warming happen so rapidly. Not at any time. Not even during the great Permian Extinction event of 250 million years ago.

Whether we admit it or not, that’s what the world comes together to address at Paris’s COP 21 Climate Conference. We’re literally meeting to commit to saving the world or to ending it. And there is no sign, as yet, that we’re going to be doing anywhere near enough.

The Great Carbon Gap

The problem, as it stands, is a great failure to communicate the current severity of the global atmospheric heating crisis. Part of this failure involves an inability or unwillingness to translate current Earth System climate sensitivity findings into language relevant to present global policy and then report on it broadly. If global mainstream media were on the ball, they’d be reporting on the findings of UNEP’s annual Emissions Gap Report. They’d also be paying more attention to the recently related speeches and presentations by Dr. Kevin Anderson addressing this critical issue.

(Kevin Anderson’s excellent presentation showing why we’re not yet anywhere near up to the challenge of missing the dreaded 2 C warming mark before the end of this Century.)

If we, as a global community, were taking this matter seriously, we’d be pouring over this report, and taking in the very relevant related statements by Dr. Anderson.

We would also be taking a very serious look at climate sensitivity in the context of past global greenhouse gas concentrations and overall levels of warming. We’d be talking about it broadly and incessantly in the global media. And we’d be comparing our best understandings of past climate contexts with current model based climate sensitivity estimates for warming during the 21st Century (Equilibrium Climate Sensitivity or ECS).

If we did this, we would find that model ECS levels of warming estimated for this Century are about half the amount of warming that is locked in long term. And since the world has already warmed by about 1 C above 1880s levels — which puts us at halfway to hitting the UN’s 2 C level already — it appears that for purposes of considering warming beyond this Century, we’ve already emitted enough greenhouse gasses to easily break the 2 C limit (and possibly hit as high as 4 C) over the course of about 500 years.

Global greenhouse gasses are already in the range of 400 parts per million CO2 and 485 parts per million CO2e. These thresholds, if maintained, are enough (if our understanding of Pliocene climate is correct) to warm the world by 2-3 C long term in the case of CO2 alone and by 4 C, in the case of CO2e, over the same 500+ year period. If the slow feedbacks (rate of ice sheet response, carbon store response, ocean response etc) remain slow, then this level of greenhouse gasses translates to roughly 1.4 to 1.7 C warming this Century (Hansen climate sensitivity) if CO2 levels merely remain stable and about 2 C worth of warming this Century if all other atmospheric greenhouse gasses (methane, ozone, CFCs, nitrous oxides, etc) merely remain stable and do not continue to increase.

If this paleoclimate and ECS based hybrid context is correct, then commitments now need to be for a very rapid drop to zero and then net negative carbon emissions if we are to have any reasonable hope of missing the 2 C threshold this Century. We should also recognize that preventing a rise above the 2 C threshold long term is an even greater challenge.

UNEP provides a slightly more optimistic assessment of the situation. The authors of this report note that peaking global greenhouse gas emissions near current levels globally by 2020 and then reducing them to less than half of current levels through 2050 has about a 66 percent chance of limiting warming this Century to below 2 C (hitting around 1.8 C by 2100). But this assessment may be rather optimistic considering that we will still hit in the range of 450 ppm CO2 and 550 ppm CO2e by mid Century which would be enough, according to our understanding of paleoclimate sensitivities, to hit between 1.9 and 2.2 C from CO2 warming alone and between 2.5 and 3 C from the total warming effect of all CO2 equivalent gasses.

image

(According to UNEP’s most recent Emission’s Gap report, the world is currently on track to warm by a catastrophic 3-7 degrees Celsius above 1880s levels through 2100. The most aggressive current policy commitments on the books, if implemented, would drop that warming to a still catastrophic range of 3-4 C this Century. Clearly, we need to be far more aggressive if we want to have any hope of avoiding 2 C warming this Century. Image source: UNEP — Emissions Gap.)

Unfortunately, regardless of which climate sensitivity estimation ends up being correct, current carbon emission reduction commitments by countries around the globe (called INDCs for Intended Nationally Determined Contribution) will almost certainly result in overall increasing rates of carbon burning through at least 2030. According to UNEP, even the present most aggressive carbon burning reduction commitments will increase global CO2e emissions from the present level of 52.7 billion tons per year to between 54 and 59 billion tons per year by 2030. Such an emissions rate would result in atmospheric CO2 levels at around 435 parts per million by 2030 and 530 parts per million CO2e by the same time. This would, in the paleoclimate based sensitivity context we use, lock in 1.8 to 2.1 C warming by the end of this Century under CO2 forced warming alone. The CO2e levels by 2030 imply warming this Century in the range of 2.25 C.

What we read from this is that the currently most aggressive INDCs will almost certainly lock in a catastrophic rate of 2 C warming by the end of this Century as early as 2030. Through 2100, the UN’s own report is not at all sanguine:

Full implementation of unconditional INDC results in emission level estimates in 2030 that are most consistent with scenarios that limit global average temperature increase to below 3.5 °C until 2100 with a greater than 66 per cent chance. INDC estimates do, however, come with uncertainty ranges. When taking this into account the 3.5 °C value could decrease to 3 °C or increase towards 4 °C for the low and high unconditional INDC estimates, respectively. When including the full implementation of conditional INDCs, the emissions level estimates become most consistent with long-term scenarios that limit global average temperature increase to 3-3.5 °C by the end of the century with a greater than 66 per cent chance.

In other words, according to UNEP, we’re on a path to hitting around 600 to 750 ppm CO2e by 2100 even under the most aggressive current policies and an extraordinarily catastrophic 6-7 C+ long term warming of the global climate.

A Base Refusal to Respond Rapidly Enough

Why are global commitments falling so far short of what needs to be done? It’s true that the challenge is extraordinary. But considering the amazing danger involved it is absolutely amoral to fail to respond.

From the policy standpoint it boils down to the fact that we are still institutionally committed to burning fossil fuels and to using those fuels as a mechanism to increase rates of economic growth. It’s a failed assumption based on the fact that at some point fossil fuel driven growth implodes the planetary life support and kinder, gentler climate systems upon which all economies essentially rely. But since this old way of growing economies has worked for centuries, and since that old growth regime has generated a number of extraordinarily wealthy and well entrenched power bases, many policy makers are unable to look beyond what amounts a vastly amoral growth paradigm based on carbon emissions.

Many nations, including the most developed nations of the world still plan to build new coal, gas and diesel electric power plants. Many nations still favor fossil fuel based vehicular transportation over the more easily electrified and converted to renewable mass transit. Many nations have lackadaisical policies when it comes to transforming vehicular transportation to electricity and other non fossil fuels. And many nations are politically paralyzed due to a portion of their leadership being controlled or strongly influenced by fossil fuel based corporate interests.

It’s a crisis of leadership and one that’s manifest in the weakness of COP 21’s carbon emission reduction commitments. For though COP 21 will likely see some of the most aggressive greenhouse gas reduction policy measures ever put in place, as we have noted above, those policies will not be anywhere nearly aggressive enough to meet the global community’s stated goal of keeping warming under 2 degrees Celsius this Century.

As case in point to the essential disconnect, a comment submitted by dnem (a regular poster here) to the Diane Rehm show, which recently hosted Joe Romm of Climate Progress in a discussion focusing on the Paris Climate talks, raised this key question:

Call me cynical, but it appears that these talks have been ‘pre-engineered’ to achieve a very modest and in all likelihood inadequate accord. They will not collapse in failure like the previous meeting in Copenhagen, but they will not come close to achieving what needs to be done. As long as we remain addicted to economic growth as the world’s primary organizing principle, we will not be serious about addressing our essential problems.

According to dnem, Joe Romm’s response — “absolutely correct” — as well as the second sentence highlighted above fell to the cutting room floor before the show aired. However, the question of how we reconcile current understandings of economic growth with the absolute necessity of responding to climate change is an essential one. The question being, that we will need to all (especially the wealthiest among us) make sacrifices in order to reduce the impact of a disaster of global scale. One possibly never before seen on the face of the Earth. We may need to think, not in terms of wealth accumulation and traditional growth, but in terms of lives saved and quality of life preserved. And many of those among us who see the world through the context of only what goes up and down on the global stock markets appear to be amazingly ill-prepared to make this all-too-necessary cognitive leap.

The sacrifices, instead, are now not just being measured in dollars and cents, but in nations under threat of collapse, by an expanding number of people displaced or at risk of falling into poverty, in lives lost and species going extinct, in the future anguish and struggles of the still unborn and of those children now being born today. By those poor creatures who will be forced to attempt to survive in a world we’re in the process of ruining. And by those of us unfortunate enough to live beyond the next 1-2 decades and to start to see some of the worst effects of the horrific climate change we are now committing ourselves to.

Links:

UNEP — Emissions Gap

Pliocene Climate

Delivering on 2 C — Evolution or Revolution?

World Headed Toward Suicide Without Climate Agreement — Pope Francis

Climate Progress

Definition of INDC

Hat tip to dnem

Hat tip to Colorado Bob

Hat tip to DT Lange