Dozens of Massive Wildfires in Central Siberia Belch 1,200 Mile Smoke Plume Over Hot Tundra

1,200 mile smoke plume

(Dozens of monstrous fires belch a 1,200 mile plume of dark smoke over Central Siberia. Image source: LANCE MODIS.)

Let’s just cut to the chase, it’s been hot in Siberia.

This winter, temperatures throughout large swaths of this typically frigid land of tundra and boreal forest ranged between 5 and 7 degrees Celsius above average. For brief periods spikes in the very extreme range of 20 degrees Celsius warmer than normal were not uncommon.

The unusual heat continued into spring igniting a mass of anomalous wildfires in April, a time when most of Siberia remains frozen. By May, more than a million acres had burned, all well before the typical peak of fire season in July and early August. But that was mere prelude to peak fire season, which we are starting to enter now.

Siberian Heatwave Spurs Massive Fires

The record heat this winter was simply the continuation of a long warming trend fueled by human greenhouse gas emissions. Each decade now has seen Siberia warm at a pace double the global average — more than 0.5 degrees Celsius every ten years. And this extra heat is fueling a terrifying intensification of wildfires, a trend that is expected to show at least a doubling of the annual acres burned in this far northern region by the end of this century.

This year’s early start to fire season may be setting the stage for a record or near record burning this year. And today we have a massive flare up of fires in Central Siberia under a broad heat dome over the region.

Temperatures beneath the dome earlier today were in the upper 80s and lower 90s, departures between 5 and 15 degrees Celsius above average for this time of year. This heat spike hit already warmed and dried lands. Lands filled with the added fuel of thawing tundra and the organic carbon and methane pockets beneath. Lands whose shallow surface layer is a tinder bed for flash fires.

Siberian Heat Dome

(Heat dome over Central Siberia in the upper right hand corner of this GFS based-temperature and weather graphic. Image source: University of Maine. Data source: NOAA/GFS.)

The result was the massive wildfire eruption seen in the satellite shot at the top of the page. A very intense set of enormous fires with fronts ranging from 3 to 34 miles burning through boreal forest and tundra land. This set of blazes is even more intense than those seen at this time during the record 2012 Siberian fire season, although it is worth noting that those fires hit extraordinary strength and size by early July and continued in a series of episodes through mid August. The result was massive smoke plumes eventually encircling the Arctic.

Typically, the fires fill the air with particulate and the moisture loading under the heat dome grows ever more intense. Often, and sooner rather than later, a frontal storm accompanied with intense rains sweeps in, catching up the smoke in its cloud mass even as the towering storms douse the raging fires. A song of flood and flame that has become all too common throughout the very rapidly changing Arctic.

In years of very extreme burning, the smoke-laden clouds darken, losing their white, reflective tops. This further amplifies warming over fire-prone areas, setting the stage for more fires. On the ground, the fires plunge ever deeper into the thawing tundra, seeking more and more fuel. In some cases, the fires are reported to have burned the ground to a depth of 3 feet or more, turning both Earth and Tundra into blackened soot while pumping heightening volumes of CO2 into the atmosphere. The dark smoke aloft lifts away, eventually finding a resting place on sea ice or glaciers. There the heating feedback continues over ominously Dark Snow.

The whole terrible process continues until the globe at last tilts away from the summer sun, shutting the whole dreadful feedback down. But each year, we fuel it more through our burning of fossil fuels. Each year, the global greenhouse gas heat forcing ratchets higher and more and more tundra land thaws as the burn line creeps north, providing ever more fuel for the Arctic flames.

Links:

Support the Dark Snow Project

A Song of Flood And Fire

Support and defend our scientists at:

NASA/LANCE MODIS

The University of Maine

NOAA/GFS


Temperatures over Greenland Fast Approaching 400,000 Year High, Risk 15-19 Feet of Additional Sea Level Rise

It’s getting hot over Greenland. Not the kind of hot we think of as each summer rolls along. But the kind of hot that melts massive two-mile-high slabs of ice. How hot? Within a decade or two, Greenland temps could reach their highest levels in at least 400,000 years. And that’s a problem. A big fracking problem.

Why?

Because a mere 1 degree Celsius of warming separates Greenland from temperatures last seen during the warmest interglacial of the last million years. During that time, sea levels were 6-13 meters higher than today — a staggering 19-44 feet. Melt came from both West Antarctica and Greenland, but until this week we didn’t know what melt portion came from which glacier system. For a study published Wednesday in Nature has pinned down the extent of the Greenland ice sheet of 400,000 years ago. And this new knowledge gave researchers the ability to estimate Greenland’s contribution to the swelling seas of that time.

The study took sediment cores from regions surrounding Greenland and, in doing so, was able to establish that enough ice melted from Greenland during a time when ice sheet temperatures were just 1 degree Celsius warmer than today to raise sea levels by between 4.5 and 6 meters (15 to 19 feet).

Southern Tip of Greenland

(The southern tip of Greenland, as seen in this June 26, 2014 LANCE MODIS satellite shot, was ground zero for a major ice melt during a warm interglacial period 400,000 years ago when Greenland was just 1 degree C hotter than it is today. Melt likely first issued from the low-lying and ocean exposed glaciers along the west coast of Greenland adjacent to Baffin Bay. Today, this region hosts Greenland’s fastest glaciers as well as its most extensive proliferation of surface melt ponds.)

A large portion of this ice came from the very vulnerable southern tip of Greenland. According to the ice core measures, two mile high ice mountains flooded away under the Arctic heat of 400,000 years ago, retreating to a meager central dome separated from a northern ice sheet which was also greatly reduced. In total, about two thirds of the ice from greater Greenland was lost (total loss of the Greenland ice sheet would raise sea levels by 24 feet).

Study co-author Anders Carlson noted in a recent press release — “…the threshold for ice sheet collapse is pretty low. We could be nearing the tipping point.”

Staring Rapid Greenland Melt in the Face

One degree Celsius, that’s all that separates all of the southern Greenland ice and a portion of the rest from a likely irreversible slide into the world ocean. And that’s also a rather pressing problem. Because the Arctic is now warming faster than anywhere else on Earth, at least two times faster than the global average. But for Greenland the recent pace of warming has been even faster. For since 1979 the surface of the Greenland ice sheet has warmed by 1 degree Celsius every decade.

This gives us just one more decade under the current pace of Greenland warming before we hit a threshold in which 15 to 19 feet of additional sea level rise is locked in and added to the already locked-in losses of about 4 feet from West Antarctica and about 5 feet from the other permanently destabilized and irreversibly collapsing glaciers and ice caps around the world.

That may just be the start. For the current CO2e heat forcing of 481 ppm is sufficient, if maintained long-term, to melt enough ice to raise sea levels by at least 75 feet overall. Unfortunately, ghg levels aren’t anywhere near stabilizing, but are instead rising faster than ever before. The human emission is so rapid that we hit atmospheric forcing levels high enough to melt all ice on Earth (if maintained over the long term) within 23 years. It’s a vicious threat to the world’s coastal communities. One that is difficult to overstate.

Simply put, the longer high and rising global greenhouse gas levels are maintained the more ice sheets we are likely to see going into irreversible decline.

Links:

Nature: Southern Greenland Ice Sheet Collapse

LANCE MODIS

Greenland Ice Sheet May Face Tipping Point Sooner Than Expected

Greenland Ice Sheet Warmed by 1 C per Decade, Half Attributed to Climate Variability


Rains Failing Over India: Feeble 2014 Monsoon Heightens Concerns That Climate Change is Turning A Once-Green Land into Desert

El Nino has yet to be declared. Though signs of the Pacific Ocean warming event abound, they are still in the early stages. But for all the impact on the current Indian Monsoon — the rains this vast sub-continent depends on each year for a majority of its crops — the current pre-El Nino may as well be a monster event comparable to 1998.

For the rains that have come so far have been feeble. By June 18, precipitation totals were more than 50% below the typical amount by this time of year for northern and central India and 45% below average for the country as a whole. A stunted Monsoon that many are saying is about as weak as the devastatingly feeble 2009 summer rains. And with Pacific Ocean conditions continuing to trend toward El Nino, there is concern that this year’s already diminished rains will snuff out entirely by mid-to-late summer, leaving an already drought-wracked India with even less water than before.

Through June 25th, the trend of abnormally frail monsoonal rains continued unabated:

India Monsoon June 25, 2013India Monsoon June 25, 2014

(India cloud cover on June 25, 2013 [left frame] compared to India cloud cover on June 25 of 2014 [right frame]. Note the almost complete lack of storms over India for this year compared to 2013 when almost the entire country was blanketed by rains. Image source: LANCE-MODIS.)

India’s Rain Pattern Has Changed

It’s not just that 2014 is a bad year for India. It’s that the current weakened monsoon comes at the tail end of a long period in which the rains have increasingly failed. Where in the past it took a strong El Nino to stall the rains, ever-increasing human atmospheric and ocean warming have pushed the threshold for Monsoonal failure ever lower. Now even the hint of El Nino is enough to set off a dry spell. A growing trend of moisture loss that is bound to have more and more severe consequences.

A new study by Stanford University bears out these observations in stark detail. For the yearly monsoon that delivers fully 80 percent of India’s rains has fallen in intensity by more than 10% since 1951. And though a 10% loss may seem relatively minor, year on year, the effects are cumulative. Overall, the prevalence of dry years increased from 1981 to 2011 by 27% and the number of years experiencing 3 or more dry spells doubled.

Meanwhile, though a general drying trend has taken hold, rain that does occur happens in more intense bursts, with more rain falling over shorter periods. These newly intensified storms are more damaging to lands and homes, resulting in both increasing destruction of property while also greatly degrading the land through more intense erosion.

25 Percent of India’s Land is Turning to Desert

Loss of annual monsoonal rains is coming along with a dwindling of water flows from the melting Himalayan glaciers. These two climate change induced drying effects are already having stark impacts.

For according to the Indian Government’s Fifth National Report on Desertification, Land Degradation and Drought, a quarter of India’s land mass is now experiencing desertification even as 32 percent is suffering significant degradation due to heightening dryness and erosion. This amounts to more than 80 million hectares of land facing desertification while more than 100 million hectares are steadily degrading. The report also noted that areas vulnerable to drought had expanded to cover 68% of the Indian subcontinent.

From the report:

Desertification and loss of biological potential will restrict the transformation of dry lands into productive ecosystems. Climate change will further challenge the livelihood of those living in these sensitive ecosystems and may result in higher levels of resource scarcity.

Monsoonal Delay, Weakening Continues

India daily rainfall

(India daily rainfall as of June 26, 2014. Image source: India Monsoon.)

By today, June 26, the long disrupted and weakened monsoon continues to sputter. Moisture flow remains delayed by 1-2 weeks even as the overall volume of rainfall is greatly reduced. Though storms have exploded over some provinces, resulting in flash flooding, much of the country remained abnormally dry. Overall, preliminary negative rainfall departures remained at greater than 40% below average for most of the nation with only five provinces receiving normal rainfall and the remaining 31 receiving either deficient or scant totals.


Links:

LANCE-MODIS

National Drought Fears Loom as India Receives Deficient Rainfall

India’s Rain Pattern Has Changed: Researchers Warming of Future of Extreme Weather

A Quarter of India’s Land is Turning Into Desert

India Monsoon

Monsoon at Dead Halt

Hat Tip to Colorado Bob


Late June 2014: Arctic in Hot Water as Sea Ice Thins and Tundra Fires Erupt

Atmospheric warming due to human-caused climate change. It’s the general measure we’ve used to track a devastating and ongoing heat amplification due to a terrible greenhouse gas emission. But if we were to look for where the greatest amount of that heat has accumulated, it would be in the world’s oceans. For from its air-contacting surface to its depths thousands of meters below, the World Ocean has captured 93.4% of the total heat forcing humans have already unleashed. The remainder is almost evenly divided between the atmosphere, the continents, and the ice.

We rely on floats and deep-plunging sensors to keep track of total ocean heat content. But on any given day we can see well enough what is happening at the surface. And today ocean surface heat is screaming through the world’s satellite sensors. Overall global anomalies are spiking higher than +1 C above the 1979 to 2000 average. In the Equatorial Pacific, an El Nino that looks to be far stronger than the one that occurred in 2009-2010 is building, heating a massive wedge of the Eastern Equatorial Pacific to +2 to +4 C above average. And in the far north, we see extraordinary high surface water temperature departures exactly where we need them least — bordering Greenland and the remaining Arctic sea ice.

Arctic Sea surface temperature Anomaly on Jun 24

(Arctic sea surface temperature anomaly on June 24, 2014. Image source: NOAA/NWS.)

For encircling the Arctic from the West Coast of Greenland, to Iceland, to Svalbard, to the Barents and Kara Seas, to the Chukchi and on to the Beaufort we see surface water temperatures ranging from 2.25 to 4 C or more above average. And just west of Svalbard, we have water temperatures ranging in a zone exceeding a terrifying 8 C above average. When a sea surface temperature departure of 0.5 to 1 C above average is considered significant, these values represent extremes that are far outside what was once considered normal.

Melt Pressure to Ice Sheets

Such high surface water temperatures have numerous effects. The first is that adjacent submerged ice sheets, such as the calving faces of Greenland’s great glaciers plunging into the ocean, are faced with a far greater melt pressure than before. The glacial fronts in many cases expose 500 or more feet of ice directly to these much warmer waters. And on almost every side of Greenland, but especially in the west, along Baffin Bay, these great ice masses are confronting extraordinary warmth. The heating is without respite. It occurs at all hours of the day and since it is delivered by water, it is many times more energy intensive than a similar volume of equally heated air.

Widespread Sea Ice Thinning and Melt

In the sea ice edge zone, the warmth also provides added heat pressure to the vulnerable and already greatly thinned ice floes. This heating is especially apparent in areas where continental rivers disgorge their waters into the Arctic Ocean. Warmer than normal water temperatures have coincided with much warmer than normal land temperatures, particularly over tundra regions like Canada’s Northwest Territory and the Yakutia region of Russia. These warmer lands result in warmer river flows. And the hot rivers spill into an already hotter than usual Arctic Ocean.

The result, as we can see in today’s MODIS satellite shots are numerous zones of greatly thinned ice.

Beaufort Thin Ice

(Ice melt, thin ice and melt ponds in the Beaufort Sea on June 25 of 2014. Image source: LANCE MODIS.)

A Beaufort Sea confronted with warm water outflow from the Mackenzie River, sea surface temperatures in the range of +1 to +4.5 C above average, and a broad swath of above freezing air temperatures, is now starting to show major melt effects. The sea ice has already withdrawn by as much as 150 miles from a broad section of the Canadian and Alaskan coasts. The off-shore ice features numerous very large polynyas and leads. And, overall, the ice has taken on a bluish tint indicative of widespread melt pond formation.

Russian Arctic Ocean sea ice june 25

(Arctic Sea Ice over the Laptev and East Siberian Seas. Image source: LANCE MODIS.)

Meanwhile on the far side of the Arctic, effects appear to be even more widespread. Though sea surface temperature values are somewhat lower than those seen in the Beaufort, at +0.5 to +1.25 in most open water areas, the entire region is rife with 150-200 mile wide polynyas, shattered and broken floes, and thinning (blue in the satellite picture) ice covered in melt ponds. The ice in this region is so frail that even the mildest storms, featuring 15-20 mph winds, are enough to rip through and splinter previously contiguous ice. And the storms in the region this year have been quite mild, ranging from 990 to 1000 mb in strength.

Sea ice measures show current area and extent at between 3rd and 5th lowest on record. That said, observed ice response to even the mildest high and low pressure weather systems reveals a startling vulnerability with much warmer than normal sea surface temperatures surely a contributing factor.

Wildfire Eruptions From The Northwest Territory to Siberia

In net, much warmer water temperatures and retreating sea ice in the Northern Hemisphere trigger both Jet Stream erosion and increasing south to north air flow. Over the continents, where lands are far more susceptible to rapid warming, this can result in Arctic regions seeing summer time temperatures comparable to those in latitudes much further south.

Over the past week, temperatures in the upper 70s to upper 80s (Fahrenheit) covered a broad region of Canada’s Northwest Territory including Alberta and the Mackenzie Delta region along the Beaufort Sea. These temperatures, in the range of 20-25 F above average rapidly dried out the shallow topsoil zone over the frozen and thawing tundra. Such rapidly dried soil and newly liberated tundra is a volatile fuel for fires. The human-thawed tundra itself contains burnable organic material and hosts pockets of methane while the dry soil bed is suffused with tinder-like grasses and shrubs. Any ignition can set off extraordinary fires of almost unimaginable scope and intensity.

Great Slave Lake Fires NWT

(Massive fires rage near Great Slave Lake in Canada on June 24, 2014. Image source: LANCE MODIS.)

By June 24, four massive fires, each with a front ranging from 20-30 miles in breadth, raged along the shores of Great Slave Lake in Northwest Canada. Four smaller, though still significant fires also burned nearby. The fires are plainly visible as white, comet-like plumes of smoke in the satellite picture above. For reference, Great Slave Lake is more than 200 miles across at its widest point. Bottom edge of frame is about 300 miles.

To the south and east by about 250 miles lies the Fort McMurray tar sands operation. A smaller, though still intense, tundra fire raged within 20 kilometers of that sprawling site but did not yet encroach on one of the most powerful and dangerous means of carbon-to-atmosphere delivery on the planet.

On the other side of the Arctic in Siberian, Russia, the situation was, once again, more dire. There a region very vulnerable to mid summer wildfires during recent years erupted into numerous blazes belching smoke into a swirling cloud caught up in the heat dome overhead:

Lake Baikal Fires Re-Ignite

(Massive region of wildfires North of Lake Baikal, Russia. Image source: LANCE MODIS.)

These fires were sparked by temperatures that, during recent days, ranged in the 80s and even 90s. An extraordinary heat forcing for rapidly melting tundra regions that also saw far warmer than typical temperatures this past winter.

This area, about 800 miles to the north of Lake Baikal, Russia, is a region of rapidly thawing tundra that has burned again and again during recent summers. For scope, the satellite shot frame, above, is 750 miles on an edge. In the picture are about 50 fires with fronts ranging from 4-35 miles.

This spring, a broad area to the south of the current fire zone and just north of Lake Baikal saw massive fire activity prompting Russia to dispatch an army of hundreds of firefighters to the region. Such intense fire activity so early was unprecedented for Russia. But the real fire season typically peaks from mid July to August. And, in the above picture, we see what is likely the opening salvo for the summer fire season in earnest.

Smoke and soot from these massive fires are swept up in the circumpolar Jet Stream. There they are born aloft for hundreds of miles, often traveling northward to find a final resting place upon the sea ice or atop Greenland’s glaciers. This ultimate darkening of the snow further enhances glacial melt even as it completes the cycle of warmth, finishing a dance of heat that rises up from the oceans, assaults the ice, and heats the once frozen lands to erupt in flame.


Links:

Support the Dark Snow Project

Where is Global Warming Going?

NOAA/NWS

LANCE MODIS

When April is the New July: Siberia’s Epic Wildfires Come Far Too Early

Global Warming Pushing Canadian Wildfires to Spike


Human-Caused Climate Change and Desperately Drilling For Water: The Deepening Dust Bowlification of California

There is no relief for poor California.

To the west, a heat dome high pressure system sits its dry and desiccating watch, deflecting storm systems northward toward Canada, Alaska, and, recently, even the Arctic Ocean. It is a weather system that drinks deep of Northwestern Pacific waters heated to 2-4+ C above average by humankind’s extraordinary greenhouse gas overburden. A mountain of dense and far hotter than normal air that is shoving the storm-laden Jet Stream at a right angle away from the US west coast and on up into an Arctic Ocean unprepared for the delivery of such a high intensity heat and moisture flow.

image

(Not one, not two, but three high pressure centers stacking up on June 24, 2014 off the North American West Coast. The highs are indicated by the white, clockwise swirls on this GFS surface graphic. This triple barrel high pressure heat dome represents an impenetrable barrier to storms moving across the Pacific Ocean. You can see one of these storms, represented by the purple, counter-clockwise swirl approaching Alaska and the Aleutians. A second Pacific-originating storm is visible north of Barrow in the Beaufort Sea. Under a typical pattern, these storms would have funneled into the US west coast or skirted the Alaskan Coast before riding into Canada. Storms taking a sharp left turn through Alaska and the Bering Sea into the Arctic is an unprecedented and highly atypical weather pattern. Image source: Earth Nullschool. Data Source: NOAA/GFS.)

In the far north, today, at noon local time, in the Mackenzie Delta region of the extreme northwest section of Canada on the shores of the Arctic Ocean, temperatures rose to 80 degrees Fahrenheit, 2-3 degrees hotter than areas of South Dakota and Iowa hundreds of miles to the south. It is a temperature departure 20-25 degrees F above average for this time of year. Far to the south and east, yesterday saw a garden variety pop up thunderstorm turn into a record-shattering rain event for Savannah Georgia, one that dumped 4-10 inches of rain over the region, over-topped ponds, flooded streets, knocked out power and washed out rail lines. In some sections of the city, hourly rates of rainfall were on the order of 4-5 inches. One might expect such a rainfall rate from the most moisture dense and intense tropical storms or hurricanes. The Savannah event was a summer shower driven into a haywire extreme by a heat-facilitated over-loading of the atmosphere with moisture.

What do the west coast blocking pattern, the California Drought, the Mackenzie Delta Arctic heatwave and the Savannah summer shower turned monster storm have in common? Twelve words: hydrological cycle and jet stream patterns wrecked by human caused atmospheric warming.

Three Year Long Drought Intensifies

Californians, at this time, may well be hoping hard for a mutant summer shower like the one that hit Savannah yesterday. But they won’t be getting it anytime soon. The triple barrel high off the US west coast won’t move or let the rains in until something more powerful comes along to knock it out of the way. And the only hope for such an event might come in the form of a monster El Nino this winter. Then, Californians may beg for the rain to stop. But, for now, they’re digging in their heels to fight the most intense drought in at least a hundred years.

California Drought Map

(This week’s California Drought Map provided by the US Drought Monitor. Orange indicates severe drought, red indicates extreme drought, and that brick color spreading from the coast and into California’s Central Valley is what they call exceptional drought. Not a corner of the state is spared severe or higher drought levels, with fully 77% of the state suffering from extreme or exceptional drought.)

With no rain in sight, with the snows all gone from the Sierra Nevada mountains to the east, and with both federal and state reservoirs under increasingly more stringent water restrictions, what it means for Californians is incessant drilling. So far this year an estimated 450 million dollars has been spent statewide to plunge ever-deeper wells into the state’s rapidly-dwindling underground aquifers. In regions where a 200 foot well was once considered deep, 600, 800 or even 1000 foot wells are now common.

In total, about 75% of California’s lost water supply has been replaced by what essentially amounts to mining ground water. But the drought mitigating flow can only last for so long. And if the rains don’t come, those sources will first dwindle and then dry up. So California’s agriculture and a decent chunk of its other industry may well be living on borrowed time facilitated by unsustainable drilling for water.

Communities local to the Central Valley region are already facing imminent loss of water supplies. Tom Vanhoff a Chowchilla local noted to CBS in a recent interview:

“I’m in a community out there with about 20 homes. We’re on one deep well ourselves and we lost it two years ago. We were at 200 feet and now we are down to 400 but all these new guys are going down to six, 800 and 1000 feet; it’s going to suck us dry here again pretty soon.”

So for Central Valley residents it’s literally a race to the bottom in the form of who can dig the deepest well the fastest.

Above ground, a once lush landscape is now parched and brittle. Most natives, even the octogenarians, have never seen it this dry. More and more, the productive Central Valley is being described as a dust bowl. In this case, Dust-Bowlification, a term Joe Romm of Climate Progress coined to describe the likely desertification of many regions as a result of human-caused warming, is hitting a tragically high gear for California.

Sierra Nevada No Snow

(Sierra Nevada Mountains in right center frame shows near zero snow cover on June 24 of 2014. Typically, California relies on snow melt to stave off water shortages through dry summers. This year, with drought conditions extending into a third year, snow melt had dwindled to a trickle by mid June. Sattelite Imagery provided by NASA LANCE MODIS.)

Global Warming to Raise Food Prices

For years, scientific models had shown that the US Southwest was vulnerable to increased drought under human-caused warming. Scientists warned that increased community resiliency combined with rapid reductions in global carbon emissions would be necessary to preserve the productiveness of regions vital to the nation.

California is one such region. Its economy, even outside the greater US, is the 8th richest in the world. It is also the US’s largest producer of vegetables, most fruits, and nuts. Other major agricultural production for the state includes meat, fish, and dairy.

Though much of the current drought’s impacts have been mitigated through unsustainable drilling for ground water, US meat and produce prices are expected to rise by another 3-6% due to impacts from the ongoing and intensifying California drought. But so far, major impacts due to large-scale reductions in total acres planted have been avoided. Without the drilling, overall repercussions would have been devastating, as planted areas rapidly dwindled in size. But with wells running dry, time appears to be running out.

Links:

California Drought: Snowmelt’s Path Shows Impacts From Sierra to Pacific

California Drought Poised to Drive up Food Prices as It Worsens

California Drought Turning Central Valley into Dust Bowl

All-Time 24 Hour June Precipitation Record Broken in Savannah Georgia

NOAA/GFS

US Drought Monitor

NASA LANCE MODIS/

Earth Nullschool

Dust-Bowlification

Hat Tip to Colorado Bob


Nearly 9,000 More Homes Lost to Flooding as China’s 41-Day Deluge Continues

China Rains May 23China Rains June 23

(Side-by-side LANCE- MODIS satellite shots of China and Southeast Asia on May 23 (left frame) and June 23 (right frame) of 2014. Notice the massive swath of cloud and stormy weather covering much of the region? It’s been like this for 41 days, now.)

* * * * *

It rained for 40 days and 40 nights? In the case of China, it’s 41 days and 41 nights and counting. A litany of previously abnormal storm events that, for too many parts of the world, have now become all too common.

Tempest after tempest wracks the atmosphere over China as moisture flooding off a super-heated Pacific Ocean keeps becoming entrained in a south-to-north flow that collides with an intense and unstable upper level storm track running a thousands-mile gauntlet between sprawling heat domes. To the southwest, one of these high pressure domes continues to establish over India and Bangladesh, squeezing monsoonal moisture into its periphery over southern China. These three storm generating and moisture injection patterns have combined and persisted since May 12th. With the result being episode-after-episode of catastrophic rainfall for China.

In the middle of May, a massive rain event emerging from this destructive weather pattern capsized 25,000 homes and forced more than half a million to flee. Over the past four days, a re-intensification of these brutish storms over six provinces once again resulted in nearly half a million evacuated and, this time, destroyed nearly 9,000 homes while damaging more than 60,000 others.

Already saturated grounds gave way to the recent bout of heavy rains triggering numerous landslides. In Jiangxi, inundation set off a school building collapse. In total, these events resulted in the loss of more than 26 souls. Heavy rains and hail also caused widespread damage to crops. In Hunan province alone, more than 127,000 hectares were destroyed.

Traffic Signs Submerged along a River in Lanxi

(River flooding in Lanxi, China submerges street lights and traffic signs. View more images of China flooding here.)

The worse may be yet to come as the rainy pattern continues to persist over much of China.

Storms Build With Global Warming, El Nino

Though historically vulnerable to flooding, China’s multi-river region has been treated to more and more severe events in recent years. Warm ocean waters associated with El Nino and human-caused climate change have triggered weather alterations spurring ever more intense periods of heavy rainfall during summer over much of Eastern China. The worst of these episodes occurred in conjunction with the monster 1998 El Nino and then record atmospheric heating resulting in both massive structural damage and a terrible human toll. In total, more than 5,000 souls were lost in an extreme flooding episode along the Yangtze River during that major atmospheric disturbance.

For 2014, a potentially strong El Nino developing in the Pacific is combining with record high global temperatures to spike severe weather risks yet again. In the case of China, the potential is for summer-long rains punctuated by a continuation of extreme episodes as the current flood pattern remains locked in place and gorges on an amped-up heat and moisture flow off the blazing Pacific and Indian Oceans.

Links:

LANCE- MODIS

Storms Leave 26 People Dead in Landslides Across China

Rainstorms, Floods Affect Millions in China

Two Week Long Flood Destroys 25,000 Homes in China

Extreme Eastern Pacific Sea Surface Temperature Spike Looking A Lot Like El Nino

SST anomaly June 19

(Global Sea Surface Temperature Anomaly on June 19, 2014. Note the blossom of red and orange off the western coast of South and Central America. That’s very hot water in the Eastern Pacific. Image source: NOAA/ESRL)

The global weather altering event that is El Nino again took a step forward this week as temperatures in the Equatorial Pacific continued to rise, today hitting values of +0.78 C above the 1979 to 2000 average. An impressive climb adding to already warm readings which, since late May, have ranged between +0.6 and +0.68 C. It’s a strong rise that continues to show progress toward El Nino, increasing ocean-to-atmosphere heat transfer, and raising the likelihood that 2014 may break the all-time global high temperature records last set in 2010.

NASA Shows May Heat Record Shattered, Japan Meteorological Agency Records Hottest Spring

Already, even as the monster that is El Nino combined with human warming still struggled to emerge from Pacific waters, spring of 2014 set new global atmospheric heat records. According to NASA, this May was the hottest in the global measure, meanwhile, the Japanese Meteorological Agency marked the March-April period as the hottest spring in all of the past 130 years (NASA showed the same period was second hottest). Rising Pacific Ocean surface temperatures by themselves were enough, when combined with raging human greenhouse gas heat forcing, to nudge atmospheric temperatures into a new record range. But the emergence of full-blown El Nino will likely push current record readings even higher.

Wedge of Very Hot Water Stretching Out From South America

Now by mid-to-late June, a hot wedge of very warm water is flooding out from South America covering a large swath of ocean from the Ecuador coast and stretching all the way into the Central Pacific. Temperatures in this broad zone range from an impressively hot +1 C to an extraordinary +3 to +4 C in hot pools just off shore. This makes the Eastern Pacific a zone of hot water that now rivals and likely exceeds the extreme temperature departures in regions of anomalous warm water off the Pacific Northwest Coast and in the North Atlantic. A well of heat energy that is likely already extending an influence into global weather patterns, as seen in the continued delay and disruption of the Indian Monsoon over the past week.

Hot Pool off Ecuador

(Very hot pool of water off Ecuador showing sea surface temperature anomalies in the extraordinarily hot +2.25 to +4 C range with smaller pools of +4 C and hotter water visible in this NOAA/NWS graphic.)

During March, sub-sea temperature anomalies spiked to +5 to +6 C above average in the hottest zones. So it appears, now, that some of these sub-sea anomalies are hitting the surface, clogging up the Pacific’s ability to soak up atmospheric heat and allowing that heat to accumulate.

Trades Picked Up, Then Stalled Again

Last week, atmospheric feedback promoting El Nino had appeared to weaken. The east-to-west trade winds had picked up and few countervailing west winds running from Asia toward the Americas were observed. But by this week, the trades had again faded with west winds seen north of the Solomons, east of the Phillippines, and along a broad zone in the Eastern Pacific. A re-emergence of an atmospheric feedback necessary for El Nino’s continued development.

Overall, ongoing warming in the Eastern Pacific along with a renewed weakening of the trades shows devolopment toward the predicted El Nino and an ongoing enhanced likelihood that past global high temperature records will continue to fall during 2014.

Links:

NOAA/ESRL

NOAA/NWS

NASA Shows Global High Temperature Record Shattered

Climate Reanalyzer Daily Summary

Advance of the Southwest Monsoon 2014

Monster El Nino Emerging From the Depths

Jet Stream Tattered By Climate Change Brings New Bout of Worst Storms On Record For North-Central US

image

(Mangled Jet Stream on June 20th, 2014 together with cut-off upper air low threatens record-shattering storms and flood events across a multi-state region from the Dakotas to Minnesota to Iowa and Nebraska over the coming days. Image source: Earth Nullschool. Data source: NOAA.)

If you wanted an example of a Jet Stream mangled by human-caused climate change, you couldn’t find a better one than today’s tangle of upper level winds swirling over North America.

It’s a chaotic maelstrom of split flows, colliding storm tracks, blocking highs, and cut-off upper air lows. A barrel of snakes pattern that’s become ever-more-common since Arctic sea ice plummeted to staggering volume lows of nearly 80 percent less than 1979 levels at end summer of 2012. A loss that opened wide the gates for warm air to flood northward and confuse the hot-cold dividing line that drives this key weather governor.

Over the past week, we’ve seen what amounts to a mess of storms mostly locked in place. A Pacific Ocean flow squeezed between a blocking high off California and an upper level low south of Alaska drew a train of moisture trailing all the way across the Pacific into a hungry cut-off low that had stalled along the border between Canada and the US. Drifting slowly east to west, west to east, the low gorged on the synoptic moisture feed, dumping record rainfall after record rainfall over the Dakotas, Minnesota, Nebraska and Iowa.

100 Year Records Shattered

By the 16th of June, with just slightly more than half the month passed, Sioux Falls South Dakota had crushed its all-time record rainfall for any month by more than 2.5 inches. The previous record of 9.42 inches set in 1898 catapulting to a staggering 13.04 inches by early this week. And with the storm track writhing overhead the rains for the region just kept coming. By yesterday, the twin cities region in Minnesota had rocketed to its second wettest June on record amidst massive rainfall-driven landslides and region-wide preparations for Mississippi River flooding. At 10.33 inches measured rainfall so far, with storms still popping overhead, and with 11 days still remaining in the month, it appears the area may well be set to shatter the previous rainfall record of 11.67 inches set back in 1874.

(Record flooding along the Big Sioux River in Iowa and South Dakota as witnessed yesterday by Storm Chasers.)

All the massive rainfall has built up quite a pulse of flood water that is now moving down major river systems and threatens record flooding events throughout a multi-state region from the Dakotas to Minnesota to Iowa to Nebraska. Residents are being called to aid in sand bagging and other flood mitigation operations as rivers keep rising through numerous regions. According to a report today in the Christian Science Monitor:

“In Iowa, South Dakota, and Nebraska, officials are asking volunteers to build sandbag barriers and other fortifications in advance of the brunt of the storm – but politicians and emergency workers are conceding that their efforts, in some areas, may not be enough.

In South Dakota, workers have begun turning a major Interstate exchange bridge into a temporary levee. While officials there say that will mitigate the flood in many locales, Governor Dennis Daugaard (R) said he expects parts of North Sioux City, S.D., to be underwater by the end of the week.”

Storms Expected to Continue

Today a frontal boundary sweeping out from our upper air low is bringing rains to the Great Lakes and Central Plains region. Meanwhile, behind the front, instability and moisture flow beneath the low continue to result is a high risk for severe thunderstorms accompanied by strong winds, torrential downpours, hail and frequent lightning. Severe storm risks are most extreme for areas of southeastern Nebraska, western Iowa, northern and western Minnesota, and eastern North Dakota.

Already, satellite imagery shows strong storms and accompanying high cloud tops popping up over Nebraska with more likely to follow as afternoon and evening progresses.

Conditions in Context: How Climate Change Intensifies Droughts/Storms

Multiple news agencies are now gathering reports of record storm events throughout the affected multi-state region. Recording agencies and residents alike note a dramatic increase in both the frequency of record events and in their intensity.

Storm precipitation intensity is a measure of how much rain, snow, sleet or hail falls from a given storm over a given period. And what we have seen is an increasing number of record hourly rainfall events in which precipitation totals measure 1 to 2 inches or more within a 60 minute span. Such intense events rapidly overwhelm infrastructure, flood roads, and burst river banks, creating a dangerous situation that often results in numerous water rescues. And both local and national climate reports have marked a major increase in both precipitation and precipitation intensity over the past two decades for regions such as Iowa.

In the context of human-caused climate change, frequency of intense storm events is increased due to rising atmospheric moisture loading. Overall, for each 1 degree C increase in temperature, the hydrological cycle increases by about 7% in intensity. The current .8 C rise since 1880 has resulted in about a 6% increase in the rate of evaporation and of rainfall. So in regions where heat and dryness tend to take hold, the soils tend to dry out faster, tipping into drought conditions far more rapidly and seeing an overall intensification and lengthening of droughts. And in regions where storms do form, they tend to dump far more rainfall than they used to.

Thunderstorm

(Global warming intensifies thunderstorms by adding convective energy, increasing atmospheric moisture, and expanding the troposphere. As a result, thunderstorm cloud heights increase resulting in more intense rain and hail events. Image source: National Weather Service.)

Changes in the Jet Stream due to loss of sea ice in the Northern Hemisphere also tends to result in more persistent weather patterns. The Jet Stream tends to meander more, spinning off more cut off lows that linger over regions creating instability and rough weather for longer periods. High amplitude waves tend to also form as more warm air invades the higher Latitudes. In the ridges, powerful high pressures tend to dominate. And once these highs establish, they can be very difficult to move. Beneath these blocking highs, droughts proliferate due to the extreme length of dry periods and due to the intensified rate of evaporation. We see such an event now in the 15+ month long blocking high that has so greatly impacted California and the ongoing drought there.

Lastly, increasing convection and a thickening, hotter atmosphere tend to spike storm intensity. In areas where moisture and heat are both high, the explosive rate of evaporation tends to rapidly form storms with very high cloud tops. These cloud tops, now sometimes pushing 50,000 or 60,000 feet pack in more moisture and can generate very intense rainfall events over shorter periods than we are used to.

In these ways, climate change forms an ideal brew for perfect thunderstorms and perfect droughts. With temperatures expected to spike to +2 C or great anomalies over the coming century, we can look forward to extreme weather continuing to intensify with both record rainfalls and record droughts dominating with ever-increasing frequency.


Links:

Weather Underground: Record Rainfall in Sioux Falls South Dakota

Twin Cities: Flood Preparation Begins as Record Rainfall Sends Mississippi Rising

Global Warming to Spawn More Severe Thunderstorms

Warming Planet Could Spawn Bigger, Badder Thunderstorms

How Climate Change Wrecks the Jet Stream, Amps up the Hydrological Cycle and Spawns Severe Weather

Hat Tip to Colorado Bob

Hat Tip to TodaysGuestis


Worst Ocean Mortality Event Ever Seen: Pathogen + Human-Caused Warming Likely Culprit in Mass Starfish Die-off

“A warmer world would be a sicker world. Under warming conditions a lot of microorganisms do better. They grow faster. They replicate faster. Many of our hosts can actually be stressed by warm conditions. And so it kind of creates a perfect storm of sickness.” — Drew Havell, Marine Epidemiologist in a recent interview with PBS.

*    *    *    *

It first started in the tidal basins of Southern California during floods of warm water accompanying the El Nino of 1982-83. Laying dormant for more than two decades, it again surfaced during the super El Nino of 1997-98. A chronic wasting illness that obliterated whole sea star populations along the southwestern Pacific Coast, threatening numerous species. After each event, however, the starfish came back. But, today, recovery is not so certain.

By 2013 human-caused ocean warming had greatly advanced. With it came a flood of much hotter than usual water that crept up the US West Coast beneath the influence of a devilishly persistent blocking high pressure system. During the same year, wasting sickness again cropped up, this time first appearing in the far northerly region off the coasts of Washington. From there, it spread both south and north, wiping out millions of starfish along hundreds of miles of coastline from Alaska to California.

As of June of 2014, almost all the starfish along the California coast have been wiped out. Oregon and Washington’s impacts have also been severe with entire regions showing complete or near complete losses among the more than 20 species of affected starfish. Even typically cold water regions have been impacted with the San Juan Islands off Washington showing sea star losses on the order of 40% over recent weeks and with outbreaks of the pathogen cropping up as far north as the Alaskan coast.

The protective cold water pools in even these zones have been greatly eroded due to human-caused warming and this loss is what researchers believe has allowed the pathogen to become so virulent.

A Warming Ocean is a Deadly Ocean

The Earth’s deep past contains a vast record of extinctions locked in rocks deposited over millions of years. And plainly visible in this vast history are numerous episodes during which ocean warming resulted in mass extinctions of ocean species and, in the worst events, land species as well. While loss of oxygen in warming oceans, acidification, and production of deadly hydrogen sulfide gas are thought to be among the worst of the worst monsters waiting to emerge from hothouse seas. It is also well known that viral and bacterial pathogens thrive in warmer environments.

Many of these microbes arose during the warmer periods of the Earth’s deep past. So they do not so well abide the cold. Lower temperatures tend to reduce a pathogen’s ability to reproduce or often kills the microbe outright. On the other hand, raising ocean temperatures is like opening the floodgates to microbial life. And some of this life is bound to be lethal to current organisms.

It is thought that this is just what happened to the sea stars. The pathogen that attacked their bodies, causing their limbs to slump or crawl off on their own and eventually liquify in a process that seems to more fit a sci-fi horror movie from the 1950s than current reality, is believed to thrive in warmer seas. It lurked in the warmest corners of the world’s oceans, only coming into contact with the sea stars during the most extreme El Nino warming events. That is until recent human-caused warming catapulted it into what used to be the cold water zone off the US West Coast.

“Largest Mortality Event We’ve Seen”

Tragically, this recently unfettered pathogen is brutally efficient, threatening an entire family of marine species — the keystone predator starfish. Unchecked, it could well result in the worst ocean die-off in modern reckoning, perhaps rivaling the loss of land amphibians due to the human-caused spread of fungal pathogens.

(PBS documentary conducted this winter. Since the time of this video, the disease has continued to spread both within species and on to other species.)

At first, in August of 2013, the wasting illness only affected a single species. As of this winter about a dozen species were affected. With the advent of spring and early summer warming over 20 species of starfish, or about every starfish species in the affected region, were falling victim to the illness. And though the US West Coast is currently the most severely impacted, instances of starfish wasting have appeared in other locales along the US East Coast and around the world. So there is no guarantee that this outbreak will be contained to even its current very broad range (for an interactive map of sea star wasting sickness observations click here).

“It’s the largest mortality event for marine diseases we’ve seen,” said Drew Havell in a recent interview with PBS. “It affects over 20 species on our coast and it’s been causing catastrophic mortality.”

Links:

Sea Star Wasting Syndrome Map

University of Santa Cruz, Sea Star Wasting Page

Scientists Zero in On What’s Causing Sea Star Die-offs

Hat-tip to Colorado Bob (who called this six months ago)


2012 Record Challenged as 40% of Greenland Ice Sheet Surface Melts on June 17th

Yesterday, 40% of the surface of Greenland melted.

It was still mid-June, yet a month before melt values typically peak. But a persistent high pressure system over Greenland, a rapidly melting Baffin Bay and warm winds riding up the west coast were enough to spur a surface melting event that shoved melt coverage firmly above the two standard deviation threshold and into record range.

greenland_melt_area_plot_tmb

(Greenland Melt Extent as of June 17, 2014. Image source: NSIDC.)

Temperatures along the west coast of Greenland and on through the southern ice-covered tip ranged between 30 and 55 degrees Fahrenheit, while 30-43 degree readings surrounded much of the periphery. Warm winds and rain to mixed precipitation accompanied a moisture-laden storm emerging from Baffin Bay and passing over the western ice sheet to add further and extreme early season melt pressure.

The warm storm and rains compounded already rapid melt pond formation along Greenland’s southwestern coasts. Large blue ponds varying between .5 to 3 kilometers in width had already formed over southern and western sections of the ice sheet by June 16, before they were covered in clouds and squally wet weather on June 17th. By today, the clouds cleared as the passing storm moved on to reveal melt ponds further swelled by a combination of warmth and wet weather:

West Greenland Melt Ponds June 18

(Large expanse of melt ponds near the outlet to the Jacobshavn Glacier on June 18, 2014. The smallest blue dots represent glacial melt ponds of about 300 meters in width. The largest exceed 3 kilometers at the widest point. Image source: LANCE-MODIS.)

Melt ponds add heat amplification to the glacier surface by reducing albedo even as they provide melt drainage to the glacial base. Floods of water from melt ponds add to glacier speed and buoyancy by reducing friction at a moving glacier’s base and by flooding geographic low points beneath the glacier. Melt ponds also reduce overall ice sheet integrity by permeating the ice with holes and fractures.

The Jacobshavn Glacier in the satellite shot above is Greenland’s fastest. It is now involved in a very rapid rush toward the ocean at a rate of 46 meters per day. A rush that has been facilitated in recent years by a major proliferation of melt ponds during summer time.

During extreme events, melt ponds can combine and over-top or break ice dams in dangerous glacial outburst floods. It is worth noting that Greenland melt pond proliferation has not yet reached a threshold for high risk of such events. But the now decade-long proliferation of melt ponds over the ice sheet surface during summer time remains a troubling occurrence.

40% melt coverage in mid June is an extraordinarily high number. Last year, melt coverage peaked at 47% in late July with June values approaching the high 20s in late June. July of 2012 saw a 97% melt coverage — an event last seen about 120 years ago and one that is, unfortunately, likely to be repeated soon under current human heat forcing. It is worth noting, however, that the record year of 2012 saw Greenland melt coverages periodically exceeding 40% from mid-to-late June.

Greenland melt June 17 2014

(Greenland melt coverage on June 17 of 2014. Image source: NSIDC.)

Early melt and proliferation of melt ponds along with persistent high pressure systems over Greenland tend to have a compounding effect that amplifies over-all melt coverage. Low mists and clouds tend to form during such conditions, trapping heat near the ice surface even as albedo over the ice sheet falls due to wide-scale melt pond formation.

Though yesterday’s melt coverage is an early challenge to melt levels seen during 2012, current conditions would have to both persist and intensify for the broad extent of melt seen during late June and through July of 2012 to show a rough repeat. That said, a 40% melt coverage on this date is a record-challenging level that bears watching.

Links:

NSIDC

LANCE-MODIS

Greenland Undergoing Record 120 Year Melt

The Glacial Megaflood: Growing Glacial Outburst Flood Risk

Hat tip to Andy from San Diego

NASA Shows May Global High Temperature Record Shattered as Climate Policy Staggers Forward

Global climate policy.

It’s a simple truth that comprehensive national and international action on climate change, which appears to be just now groggily lurching forward, should have begun at least 20-30 years ago. Since that time, humans have dumped about 250 billion tons of carbon into the atmosphere. And through the end of 2013, a staggering pace of emission in excess of 10 billion tons each year continued to grow (36 billion tons of CO2 and nearly 50 billion tons of CO2e with other greenhouse gasses added in).

It is a pace of initial greenhouse gas forcing that is without precedent in even the most violent times of Earth’s deep past. A pace of release of the heat-trapping demons at least 6 times more rapid than at any time in Earth’s more than 4.5 billion year span. Over that broad period, life on Earth has suffered numerous devastating extinction events. Of the five worst episodes of mass loss of species, at least two were caused by Earth changes due to catastrophic increases in greenhouse gasses, devastating warming, and a world ocean that, when heated, becomes an acidic, low-oxygen killing machine producing deadly hydrogen sulfide gas. And the worst of the worst extinctions, the Permian, has the fingerprints of a greenhouse gas spurred hot-house event all over it.

Through our multi-decadal inaction, these are the dark fates we tempt. And our folly, thus far, has been without parallel.

Across the world, the global population of fossil fuel-burning automotive machines grew to exceed 1 billion even as emerging countries such as China and India produced hundreds upon hundreds of new, coal-burning power plants. These countries looked to the developed nations for leadership, aid and partnership in confronting the combined crisis of dangerous fossil fuel dependency and impending climate emergency. They were instead met with mixed signals, international gamesmanship, and an endless panoply of national climate and energy policies en-webbed by fossil fuel influence. Now, the fossil fuel addiction has spread. Chinese annual greenhouse gas emissions exceed that of the United States and India may soon follow.

So for at least the past three decades, progress toward solving the critical, growing, damaging and ever-more-likely to be deadly problem of human greenhouse gas emissions stalled.

Hottest May on Record

Today, in the wake of glimmers of a comprehensive, if far too slow, climate policy response from US and Chinese administrations, we are reminded of the terrible consequences of multi-decadal foot-dragging. For, according to NASA, May of 2014 is now the hottest in the climate record at .76 C above the 1951 to 1980 average and about .96 C above average temperatures during the 1880s when global record-keeping began.

For comparison, the temperature increase that catapulted the last ice age into the warm inter-glacial period that is the Holocene was about 3.7 degrees C. The difference between 1880 and now is about 1/4 the difference between an inter-glacial and an ice age, but on the side of hot.

More ominously, however, is the fact that the three months of March, April, and May were the second hottest ever recorded beating out the same 1998 El Nino period by nearly .1 C and only falling slightly behind a similar period during the El Nino year of 2010 by a slim 0.04 C. Though sea surface temperatures in the Pacific touched the low El Nino range during the last week of May, most of this three month period was characterized by ENSO neutral conditions and moderate, but spiking into May, ocean-to-atmosphere heat transfer. (To this point, it’s worth noting that Japan’s Meteorological Agency found the same March to May period to be the hottest ever recorded).

NASA temp May 2014

(Global temperature anomaly map for May of 2014 provided by NASA shows numerous regions displaying hotter than average temperatures with few areas showing below normal departures. Image source: NASA GISS.)

It is worth noting that overall ocean surface readings during May were extraordinarily high, with daily values peaking in the range of +1.25 C above the 1979 to 2000 average. The broad heating of the ocean surface, including but not limited to the Equatorial Pacific, likely greatly influenced this new global record.

Wide-spread heat, few cool spots

Regions of hot extremes in the range of +2 to +4 C positive anomaly sprawled across Alaska, Canada, and the Beaufort and Chukchi Seas and a vast expanse from Archangel on the Arctic Ocean to the Caspian and south into Iran and Afghanistan. The Yakutia region of Russia continued a multi-month period of record warmth with anomalies spiking to +2 to +4.2 C. An Australia baking under its second consecutive hottest year on record also saw +2 to +4 C above average readings. And Antarctica found itself experiencing extreme late austral fall polar amplification as positive anomaly values hit +5.2 C above normal over a section of the near Antarctic Southern Ocean and 2-4 C + throughout the interior.

Cooler than normal zones were confined to much smaller areas along the coast of Antarctica, off the South American capes, off the eastern coast of Japan, and in a stormy area of the North Atlantic east of Newfoundland and south of the tip of Greenland. Meanwhile, temperatures in the very warm range of +0.2 to +2 C above the 1950 to 1981 average were nearly ubiquitous, combining in a cloud of record warmth surrounding sparse and shrinking islands of cooler air.

zonal anomalies May 2014 NASA

(Temperature anomalies by Latitude. Image source: NASA GISS.)

Temperature anomalies by Latitudinal zone showed very strong polar heat amplification with the deep Antarctic below the 80 degree south Latitude line hitting a +2.7 C positive anomaly. Southern Ocean surface temperatures were the only noted cool zone at -0.1 C negative anomaly. As has been typical of recent early summer and late spring periods, the Arctic and near Arctic in the range of 60 to 70 North Latitude also showed strong positive anomalies with May’s readings between +1.7 to +1.8 C. Meanwhile, the high Arctic remained in the very warm range of +1.4 C above the 1951 to 1980 average.

No El Nino Yet Shows Global Warming Proceeding a Rapid Rate

Despite a very strong March Kelvin Wave which pushed upper ocean sub-sea temperatures in the Equatorial Pacific for the month to record values and despite Nino 3.4 readings hitting a +0.5 C positive anomaly value in late May, ENSO conditions throughout May remained at neutral status. So though ocean-to-atmosphere heat transfer ramped into positive during the past month, the amount of added heat forcing was less than what we would see during a full El Nino.

As a result, May touching record high temperature readings with ENSO at still-neutral status is a clear sign of a raging pace of Earth Systems warming. A clarion signal that the human forcing continues to very rapidly bend the world’s atmosphere, ocean, and ice to new heat extremes.

Current Climate Policy a Small First Step Inadequate to a Major Crisis

In this context, it also important to note that US commitments to cut its greenhouse gas emissions by 30% below 2005 levels by 2030 (15% below current levels) is an important but minor step forward. Globally, this commitment may shave about 1% off of predicted 2030 emissions, which are still projected to show dramatic increases from today. China’s own pledge to cap carbon emissions may also help to slow the bleeding somewhat. But it is important to take into account that China’s current carbon emissions are on the order of 3 billion tons each year (11 billion tons CO2e) or just shy of 30% of the global total. This is a massive emission that, by itself, is two times that seen during the worst events in the deep geological past and even if the Chinese achieve the pledged goal of peaking coal use and carbon emissions by around 2025 to 2030, China still remains on track for 10-14 billion tons of CO2e emissions (about 3-4 billion tons of carbon) per year through at least 2040.

Such action is slow and minor compared to the greatness of the ghg emissions threat. And failing to follow up on the new policy initiatives with far more aggressive moves practically ensures that the world shatters the so-called 2 C warming limit and at least challenges the 3 C level during this century.

Under current emissions, we hit enough CO2 equivalent forcing (without aerosols) to achieve a 2 C warming before the end of this century within about 3-5 years. To this point, the current CO2 equivalent forcing minus aerosols is a staggering 481 ppm. On the present emissions path, we reach 550 ppm CO2e and enough to warm the Earth by 3 C before the end of this century by 2037, or within less than 23 years.

Given these bleak prospects, global climate policy should be looking toward ways to completely eliminate greenhouse gas emissions over the next few decades. And though positive first steps, currently pledged carbon caps and minor reductions by major emitters should be seen as a start to comprehensive action and not as an end goal.

phpThumb_generated_thumbnailjpg

(Under current ghg emissions trends, assuming a moderate Earth Systems feedback response, global temperatures are projected to rise by between 3 and 4.6 C by the end of this century and by 6 and 9.2 C long-term. If all nations held to ghg emissions pledges, warming could be limited to 2.5 to 3.9 C by the end of this century and 5 to 7.8 C long-term. Either trend is enough to melt all the ice on Earth and risk an anoxic ocean and related greenhouse gas extinction event. Image source: Climate Action Tracker.)

Links:

NASA GISS

Climate Action Tracker

Chinese Carbon Cap Unlikely to Reduce Emissions

Climate Plan to Reduce Global Emissions by 1%

Ten Cubic Kilometers of Ice Lost From Jakobshavn Glacier in Less than One Month

How large is a cubic kilometer? Think of something the size of a mountain. Now multiply that by ten and you end up with a veritable mountain range. Think of it. An entire mountain range of ice. That’s a good rough comparison to the volume of ice lost from just a single Greenland glacier over the course of a mere 26 days from May 7 to June 1 of 2014.

Jakobshavn Ibrae Ice loss 2014

(Massive ice loss from Jakobsbavn glacier captured by Espen Olsen. Image source: The Arctic Ice Blog.)

For according to reports from expert sea ice observer Espen over at the scientist and ice researcher camp that is Neven’s Arctic Ice Blog, about 7.5 square kilometers over an ice face about 1,300 meters tall (when including the above and below sea level ice front) shoved off from the great Jakobshavn Ibrae glacier during the past month. It was a period of time well before peak Greenland warming and one that featured a collapse of ice into the heating ocean even larger than the epic event caught on film during the seminal documentary Chasing Ice.

The Fastest Glacier in Greenland

Flowing at a speed of 46 meters per day, Jakobshavn is currently Greenland’s fastest glacier. Containing enough ice to raise global sea levels by 1.5 feet all by itself, the glacier is one of many of the Earth’s ice giants currently in the throes of irreversible decline.

Human-warmed subtropical Atlantic waters are funneled by ocean currents to the great glacier’s base. There, the high heat capacity does serious harm to the its weak underbelly, resulting in what is now an unprecedented seaward surge.

Since the 1990s, Jakobshavn’s forward rate of motion has tripled. But according to recent scientific reports, the glacier may just be at the start of an exponential spike in velocity. For as the glacier retreats it falls into a deepening chasm that exposes its front to greater and greater volumes of the warming ocean’s waters. The warm waters deliver more heat over the glacial face as it deepens even as a multiplication of melt lakes on the surface of the inland ice provide added lubrication and buoyancy to the ice base flowing into the chasm.

Greenland Bedrock Map

(Greenland map showing location of the Jakobshavn Glacier with close view of a deep channel in the bedrock. This channel was likely carved by previous discharge and at its deepest point is now more than 1,000 meters below sea level. Image source: NASA’s Earth Observatory.)

Estimates of energy transfer from the warming ocean show that Jakobshavn could reach a speed ten times 1990s values over the coming years. Ominously, the past two month’s immense calving event has shoved a large section of glacier closer to what could best be described as a high velocity melt chamber.

Greenland — An Archipelago Covered in Ice

Unfortunately, Jakobshavn is just one of Greenland’s many giant glaciers fronting deep and long chasms stretching far into the ice interior. Recent research from NASA’s Ice Bridge project revealed numerous deep rifts plunging for scores of miles into the ice sheet. The overall picture portrayed by the new study was that of an archipelago island system locked in the grip of two mile high ice mountains and riddled with deep bedrock canyons that join in a low-lying interior basin. A geography in which there is almost nowhere for ice to hide from the severe melting stress of Earth’s human-warmed oceans.

Due to this uniquely vulnerable topography lead Ice Bridge researcher Mathieu Morlighem, a UC Irvine associate project scientist concluded that:

“The glaciers of Greenland are likely to retreat faster and farther inland than anticipated – and for much longer – according to this very different topography we’ve discovered beneath the ice. This has major implications, because the glacier melt will contribute much more to rising seas around the globe.”

Human Warming Holds Numerous Large Glacial Collapses in Store

Under the current regime of human-caused climate change, the past month’s massive glacial release is likely only to be one of many. A single event of immense scale that defies imagining. Just one in an ongoing series of violent outbursts we’ve already set lose on our world.

An event of smaller, though still enormous, size was captured on film here:

(Largest glacial calving event captured on film as excerpted from the ground-breaking documentary ‘Chasing Ice.’)

It is a film that gives us some small measure of understanding of what we’ve done and what we continue to to do. For Greenland’s entire ice edge, a region unlocking ice twenty times the volume of Jakobshavn, is now in the process of deformation and collapse all while the massive glaciers of West Antarctica are also falling into irreversible release.

Links:

(Hat-tip to Colorado Bob)

The Arctic Ice Blog

Chasing Ice

NASA’s Earth Observatory

Greenland Will Be Far Greater Contributor to Sea Level Rise Than Expected

Greenland’s Jakobshavn Glacier Revs-up With Climate Change

Nature: Human Warming Now Pushing Entire Greenland Ice Sheet into the Ocean

Grim News From NASA: West Antartica’s Entire Flank Collapsing into Southern Ocean

Monsoon At Dead Halt: Chances For Summer El Nino Jump to 70% as India Swelters

mon-prog

Current advance of the Indian Monsoon indicated by the green line vs typical historic advance indicated by the dashed red line. Image source: India Meteorological Department.

The Indian Monsoon arrived in Sri Lanka on June 2nd, 8 days late, with extreme force. Dumping excessive rainfall even for a typically powerful event, it forced 2,500 to flee and resulted in the loss of 22 souls. There it stalled, battening into a Bay of Bengal moisture flow that hasn’t budged since May 23rd.

*   *   *   *

By today, June 5th, powerful storms should be dumping rain over a wide swath including the entire southern tip of India, almost all of the waters between Myanmar and the Tamil Nadu and Andhra Pradesh coasts, and over most of Bangladesh. But in the satellite shot only scattered storms are visible where powerful, wall-to-wall squalls should now cover an impressive swath.

By this time last year, more than a third of India was obscured by cloud. Today, the skies of this nation of 1.25 billion people are ominously clear. The steely-gray aerial tint of coal ash smog is the most impressive feature in an otherwise open expanse from the northwest deserts to the southeast coast. A massive zone showing only sparse hint or hope of rain.

Even Sri Lanka seems mostly cloud-free. The monsoon and, more importantly, the crop-essential rains it brings are walled out, pushed into the margins by El Nino and some of the hottest global temperatures on record.

India monsoon stalled

Blazingly clear skies laced with ominous coal ash over India during a time when monsoonal storms usually advance. Image source: LANCE-MODIS.

Forecasts indicate that some of the long-delayed rain could arrive to the coast by tomorrow through Sunday. Sparse comfort to sweltering interior sections that may not now see the cooling monsoon until after July 1st.

Unrelenting Heat Risks Late Switch to Violent Storms

In the north, the heat and drought just builds and builds. Jaipur recorded its highest temperature in 33 years on Thursday at a scorching 46.3 degrees Celsius (115.3 F). Meanwhile, New Delhi hit a new record high for the day of 45 C (113 F). Forecasts for New Delhi on Saturday and Sunday show the potential for even more extreme heat with temperatures projected to climb to 116 F. Over the coming ten days, the coolest is expected to be Friday of next week at 109 F.

The continued delay of monsoonal rain combines with record heat throughout northern and western sections of India to enhance risks of drought and loss to crops. Heatwave conditions have already reduced Lychee fruit crop yields by 40%. But an extended stalling of the monsoon and ongoing heat could result in increased damage.

Atmospheric thickening that comes with such extreme heat can also spur intense rain and hail events causing another kind of damage to crops. So a flash switch from heat to heavy storms like those seen earlier this week in Sri Lanka may not be so much of a boon as a terrible jolt to affected lands.

Moderate to Strong El Nino Ever More Likely

This year’s monsoonal delay and related extreme weather were likely amplified by a combination of record atmospheric heat due to human-caused greenhouse gas forcing and a growing and strengthening El Nino. In April, global atmospheric temperatures hit new record highs of +.91 C above 1880s values even as El Nino rapidly gained ground in the Pacific through May.

Multivariate ESNO Index values catapulted to +0.93 in May hitting the seventh highest values on record for the month and pushing the current El Nino into Moderate-Strong range for this time of year. During previous years, similar high values resulted in strong El Ninos on 3 of 5 occasions in the climate record. So historical indicators point toward a 60% chance of a strong event emerging by later this year.

From to NOAA’s El Nino Discussion Page:

The long anticipated breakthrough to El Niño conditions in 2014 is clearly under way, leading to the next question of how big it will get. Of the 10 nearest-ranked April-May values, five had clearly come up to this level over the previous three months. Among those five, four continued at El Niño levels through the rest of the year, while one (1993) dropped back to borderline neutral conditions by the end of the year. One (2002) ended up as a weak-to-moderate event, while the other three (1957, 1987, and 1997) are classified as strong El Niño events in the MEI sense. In other words, the simple-minded odds for El Niño remain at or above 80% through the remainder of 2014, and are consistent with previous discussions on this website. The odds for a strong El Niño are perhaps slightly higher than before, somewhere around 60%.

Meanwhile, the official NOAA forecast is more cautious, with model interpretations pointing to a higher likelihood for a moderate El Nino during 2014.

Consensus El Nino Forecast

El Nino probability graph. Image source: CPC.

Overall, chances for evolution to full-blown El Nino rose significantly with today’s forecast now showing a 70% chance for El Nino development by this summer and nearly an 85% chance for El Nino development by Fall-Winter.

Regardless of El Nino strength, such an event is likely to have broad-ranging global impacts in the context of human-caused warming.

India’s Heightening El Nino + Climate Change Threat to Crops

For India, history shows numerous cases of severe monsoonal disruption during strong, moderate, and, recently, even weak El Nino events. In addition, record high atmospheric temperatures enhance extreme drought and flood potentials by amping up the hydrological cycle and thus increasing the rate of both evaporation and precipitation. Storms, where they do occur tend to be both tall and abnormally powerful under current human-warming related stresses even as droughts tend to develop with higher velocity and to persist for longer periods.

It is possible, due to both changes to the hydrological cycle and to atmospheric circulation, that the Indian monsoon has become even more sensitive to the El Nino pattern under current human-caused warming. This year’s monsoonal delay with El Nino just emerging shows an almost instant response to the forcing coming from increased temperatures in the Equatorial Pacific. As such, conditions of heightening threat for crop damage throughout a land where 1.25 billion people rely on the annual rains is a critical issue.

nepac_anomaly_ophi0

(Extraordinary sea surface temperature anomalies in the Northeast Pacific including numerous pools of +2.25 to +4 C or higher departures are indicative of both a strengthening El Nino pattern and a general warming of Ocean surface waters through human greenhouse gas heat forcing. Image source: NOAA Environmental Modeling.)

Overall, the forecast remains for continued monsoonal delay and disruption, continued heatwaves and a likelihood for extreme rainfall and storms in the regions where the monsoon finally arrives. With El Nino conditions in place over the Pacific now, with atmospheric temperatures rising into record range, and with an official El Nino status likely to be declared by summer, this forecast is lent yet more certainty and urgency.

Links:

India Meteorological Department

LANCE-MODIS

NOAA’s El Nino Discussion Page

CPC

North India Reels Under Heatwave

Monsoon Delayed Across India, Deadly Flooding in Sri Lanka

Weather Underground Ten Day Forecast for New Delhi

(Hat Tip to Timothy Chase)


Winds Interrupted — El Nino is Tearing a Hole Through the Trades

Trade winds. The east-to-west flow of airs across more than ten thousand miles of Pacific waters. Starting just off the coast of Ecuador, these winds typically blow in the range of 15 to 25 miles-per-hour uninterrupted across the vast Pacific before terminating in the South China Sea. The winds are a normal condition in the Equatorial Pacific. So constant that sailors relied on them as a kind of ocean conveyor during the days when sailing ships still ruled the waves. Year in, year out, the trade winds blow. Usually only subject to minor insults and brief interruptions from the massive and powerful weather phenomena that is El Nino.

But, starting yesterday, something rather odd began to happen. A six thousand mile stretch of the trades simply went dead.

image

(Pacific Ocean wind pattern as of 1 PM EST, June 4. The brighter the green, the higher the intensity, the deeper the blue, the weaker the winds. Direction of flow indicated by tapering lines. Note the large dead zone in the Pacific equatorial wind belt. Image source: Earth Nullschool. Data source: NOAA, GFS, MMAB, EMC, NCEP, OSCAR, UCAR.)

Draw a line due south of Kauai to the equator and there you will find a cyclone hovering just to its north.

Cyclones here usually have their wind fields dilated by the ongoing pressure of the east-to-west trade winds. As such, typical circular wind flow around a normal cyclone near the Pacific equator is distorted, turning instead into a kind of wind hump where the trades slow at the base and speed up at the top. West winds generally never completely wrap around these small storms.

But our cyclone is a bit unusual. For not only is it featuring a west wind flow of about 10 mph over about a 500 mile stretch of water, it also pushes ahead of it a trade wind killing frontal boundary. A sinking and rolling in the atmosphere that is acting like a kind of wall to the trades — keeping them from further progress.

The storm is the tip of a spear aimed at the heart of the trades and around it they bisect, shifting above the 10 degree North Latitude line in the north and below the 10 degree South Latitude line in the south. This wide gap features only weak and confused airflows. North-to-south they meander with the occasional weak east wind and numerous anomalous west winds filling in this rift. A broad, nearly 1,000 mile wide hole, that continues on west past the Solomons, past New Guinea, and on all the way to the Philippines.

To the East, a second 2,000 mile stretch of west winds running from south of California and on to the South American coast crowds out the trades. Together with the great wind gap to the west, these two patterns combine to cut off the trades from much of the Equator. What is left is only about 3,000 miles of uninterrupted flow. A mere 30% of the pattern’s typical range.

The El Nino Feedback

So why all the drama? What’s so important about trade winds anyway? Well, from the point of view of the developing monster weather event that is El Nino — almost everything.

For El Nino to grow and progress, in essence, for the massive pile of warm water that has accumulated in the Western Pacific to keep flowing east, the trade winds have to fail. They do this either through strong west wind events that open the gates to warm surface water flow eastward. Or they do it through a kind of trade wind collapse.

TS_anom_satellite2 jun 4

(Equatorial Pacific Ocean temperatures warmed to near +0.70 this week as global sea surface temperatures remained in an extraordinarily hot range near +1 C above the already hotter than normal 1979 to 2000 average. A rising El Nino combined with global warming pushed April of 2014 to its hottest temperatures on record and likely had the same effect on May. Any further intensification of El Nino is likely to push this dire trend into even more extreme territory. Image source: University of Maine. Data Source: GFS.)

It is this kind of event that climate experts call an El Nino feedback — an atmospheric condition that sets in place the features that allow Pacific Ocean surface warming to intensify along a strengthening El Nino path. As of yesterday, and continuing on through today, that feedback is readily visible in what appears to be a mass trade wind die-off. A great hole punched through the heart of equatorial air flow.

Such a condition, according to past weather observations, should give what is already a strengthening El Nino a boost. So it appears the potential for a monster El Nino today again ramped higher.

UPDATE: The most recent NOAA/CPC official forecast calls for  a 70% chance of El Niño by this summer with the overall intensity forecast to be moderate. However, CPC El Niño forecast discussion shows a rough historic potential of 60% for a strong El Niño and a 20% chance for a very strong event due to very rapid Pacific Equatorial warming during May.

Links:

University of Maine

GFS

Earth Nullschool

NOAA

GFS

MMAB

EMC

NCEP

OSCAR

UCAR


Arctic Sea Ice Loss Goes Vertical: Area the Size of Nevada Gone in One Day

The white, reflective barrier protecting our northern polar region from the heat-amplifying effects of human-caused warming took a severe blow today. The National Snow and Ice Data Center’s sea ice area measure essentially fell off a cliff as values plummeted by more than 286,000 square kilometers. That’s an area of ice the size of Nevada lost in a single 24 hour period. A state-sized region flipping from white, reflective, cooling ice, to dark, heat-absorptive water.

arcticice June 3

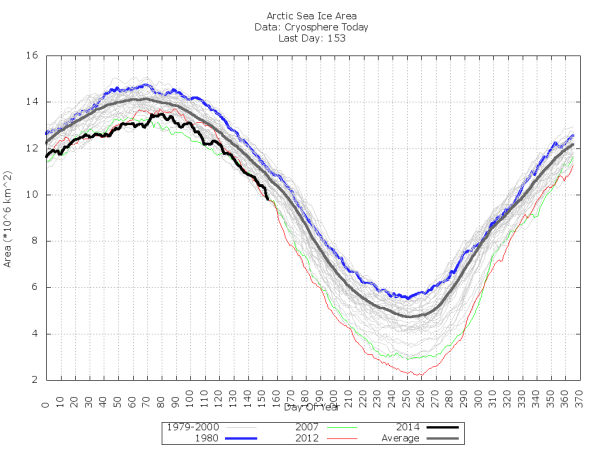
(Most recent day’s sea ice area measure shows vertical drop for June 2nd and a near vertical drop for June 3rd. Updated graph shows June 3, 2014 area measures tied with 2011 and 2012 for record low daily levels. Data source: Cryosphere Today/NSIDC. Image source: Pogoda i Klimat.)

Overall, the sprawl of sea ice fell to 9,984,000 square kilometers or a negative 907,000 square kilometer anomaly vs the already low 1979 to 2008 mean. The fall was rapid enough to bring sea ice area to within striking distance of new record lows for the date. Should the nose-dive continue for just one more day, the measure’s lower range will be shattered.

Arctic Still Warm as Extra Heat Goes to Work on Ice

Since May, weather conditions in the Arctic above the 66.5 degrees north Latitude line have remained somewhat warmer than usual. GFS averages have ranged from +1.5 to -0.3 C when compared to the, already warm, 1979 to 2000 average. And, in general, values have typically hovered in the +0.5 C range for the entire Arctic.

This temperature anomaly range is, however, a major fall from the extreme polar amplification we saw this winter on the order of +4 to +6 C above ‘normal’ temperatures during the months of January and February of 2014. It is the same relative winter-to-summer draw-down in anomalies we would expect come summer as the heat overburden goes to work doing the physical heavy lifting of ice melt rather than simply warming the air. In essence, as atmospheric and ocean temperatures approach the 28 F melt-freeze line of sea ice, energy, instead, is dumped more and more into ice melt. So though Summer is still quite a bit warmer than Winter in the Arctic, the pace of atmospheric warming in the winter is much greater so long as temperatures remain below ice-melt thresholds.

Heat Delivery Mechanisms: How Polar Amplification Melts Sea Ice

Extra dangerous and amplifying Arctic heat comes from many sources. Not only is the atmosphere over the Arctic more heavily burdened with heat-capturing gasses than the rest of the planet (currently at about 405.5 ppm CO2 and 1910 ppb methane as measured at NOAA’s Barrow Alaska station), high amplitude jet stream waves continue to deliver heat in the form of southerly warm wind invasions even as the ocean upon which the thinning ice rests draws ever more energy from an immense volume of warming water. Expanding holes in the ice, a darker, greener, Arctic environment, a rain of soot from massive wildfires burning at the Arctic’s gates — all contribute to overall warming in the Arctic system.

How this heat is delivered to the sea ice can take many forms. The first, and most obvious, is through direct solar heating of the ice itself. Such insolation heating requires both clear skies and warm air temperatures for greatest impact. In these ideal conditions, melt ponds can proliferate, greatly reducing sea ice albedo and further weakening ice for large melts later in the season. And recent studies suggest that widespread melt pond formation played a key role in both of the record melt seasons of 2007 and 2012.

Melt Ponds over Hudson Bay June 2 2014

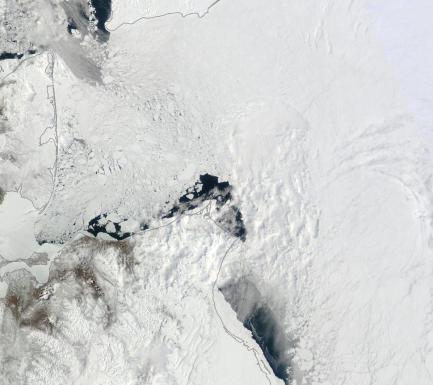
(Thin ice over Hudson Bay, Canada on June 2 takes on the characteristic blue tint indicative of melt pond formation. During late spring of 2014, melt pond formation was relegated to the ice edge, primarily due to widespread cloud formation over the Arctic Ocean. Image source: LANCE MODIS.)

But for 2014, melt pond formation has been relegated to the ice edge boundary along the fast ice near Russia, in regions of the Canadian Arctic Archipelago, and in Hudson Bay. Large areas of cloud cover have persisted throughout the Arctic preventing a much more widespread occurrence of melt ponds. This high degree of cloudiness is likely due to the changing Arctic itself where increasing encounters between hot and cold are veritable cloud and mist generating machines. Such changes bear out in paleoclimate observations where proxy values show a more ice free Arctic is a much cloudier Arctic.

So if clouds interrupt solar insolation in a melting Arctic, then what other mechanisms go to work to deliver heat to the ice?

Weather Systems, Warming Lands and Waters

‘Fate,’ as the saying goes, ‘is not without its sense of irony.’ For water in all forms, including the low-lying clouds which are fogs and mists, is likely to play an ever-increasing role in Arctic melt. These emerging heat delivery mechanisms can simply be summed up as follows: warm wet winds, warm water upwelling, and warm rivers.

Warm Wet Winds blow from south to north and increasingly invade the Arctic as tundra melts and sea ice retreats. As summer temperatures at the Arctic boundary increase due to human forcings and related amplifying feedbacks, these warm, southerly gusts bear with them an ever-increasing moisture content. And since water has 4 times the heat capacity of air, winds laden with higher volumes of moisture carry much more heat to melt ice than the drier, colder winds of yore. When such winds contact the ice, a form of condensation mist is wrung out of the air due to temperature differential. The mist directly contacts the ice and delivers its x4 heat capacity to the ice surface. It’s a phenomena that many coastal residents in the northeastern US are well familiar with — something they call snow-eating fog.

During late spring of 2014, warm, wet winds were particularly prevalent in the region of the Bering and Chukchi Seas. These winds weren’t much warmer than sea ice freezing temperatures — ranging from 28 to 40 degrees F. But they picked up moisture in a large south to north synoptic pattern, dredging up heat and water from the temperate Pacific to dump it on the Arctic sea ice. The result was great gusts of mists and fogs eating away at the ice edge week-after-week.

Warm Winds April 25 2014Warm Winds June 2 2014

In the above satellite image sequence (LANCE MODIS), we can see the drastic effects of prevalent warm winds. The top image is from April 25 of 2014, the bottom from June 2nd. In the top frame we can see the beginnings of mist and cloud formation at the ice edge along the path of persistent south to north wind flow. By June 2nd, this warm wind pattern has melted most of the Bering and Chukchi sea ice even as it intensified to a misty, cloudy maelstrom chewing away at the ice edge.

A more intense kind of a warm wind forcing can come in the form of a warm storm. These storms typically emerge from the south carrying with them a high degree of heat and moisture. A combination of rain, strong winds and increased wave action over sea ice can have a severe effect during a warm storm as was seen during the Great Arctic Cyclone of 2012. Such storms are likely to become more prevalent as the Arctic continues to heat up. And these systems can also generate a kind of warm water upwelling that eats away at the ice from below.

Warm Water Upwelling is an especially powerful force to melt ice that sits on a warming ocean, particularly when the ice is as thin, broken and mobile as we see in the Arctic today.

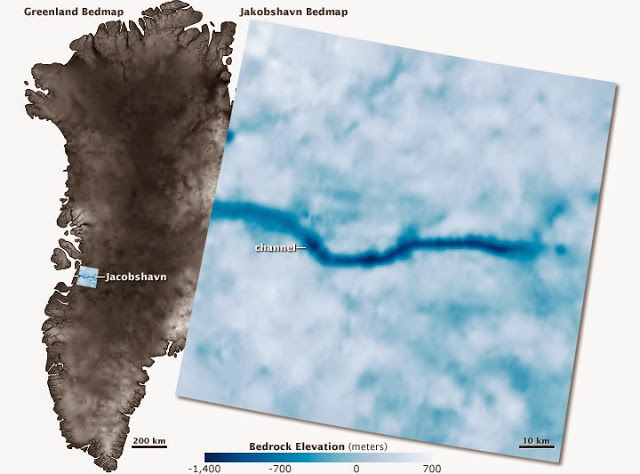
Impacts from warming and upwelling deep ocean waters have been both extraordinary and increasingly visible to major glacial systems in Greenland and West Antarctica where numerous ice sheets have begun an irreversible plunge toward the oceans.

In the Arctic, heat typically pools in deeper layers and at the near-shore below-surface boundary along the continental shelf. The ice rests in a zone of colder water at the surface. Atmospheric patterns such as persistent and strong high and low pressure systems can occasionally tap this deeper water heat through a mechanism known as Ekman pumping.

The way this works is that a large-scale swirl of air creates a kind of suction effect on the sea surface. In cyclonic storms, Ekman pumping causes upwelling to occur at the center of the storm and down-welling to occur at the edges. In high pressure systems, upwelling occurs along the edges while down-welling occurs at the center.

Ekman Transport

(Illustration of Ekman transport is cyclonic [storm] and anticyclonic [high pressure] systems. Image source: MIT.)

The effect this has on sea ice is that storms will tend to spread the ice out and thin it at their centers while high pressure systems will tend to pull the ice edge in and concentrate the ice. In addition, the upwelling at the edges of the anticyclone can add melt stress, especially in more shallow coastal basins, even as melt stress is added along storm paths in which warmer waters may have ventured closer to the ice bottom.

During the last week, a persistent high pressure system formed over the Beaufort Sea. It sat opposite a set of cyclones that formed near the Kara. The anticyclonic pattern of the high drew in ice from land-fast moorings in the East Siberian Sea even as warm upwelling and loss of albedo generated warmer surface temperatures in an expanding polynya zone — pumping out a burst of ice-eating mists. The anticyclone expanded into the Laptev where a similar edge draw and surface warming effect was visible even as the wind patterns between anticyclone and cyclone converged to amplify the northward retreat of ice.

Laptev and East Siberian Sea Ice May 15

Laptev and East Siberian Sea Ice June 3

In the top LANCE MODIS image frame we see East Siberian and Laptev seas already suffering ice loss and break-up due to a series of warm wind outbursts from the Asian continent on May 15 of this spring. In the bottom frame, we see today’s sea ice coverage dramatically reduced after a week of extreme ice damage due to anticyclonic recession and related edge upwelling.

As a result, both Laptev Sea ice and East Siberian Sea ice are well into record lowest ranges.

Warm Rivers also typically provide a strong pulse of heat to the Arctic through spring and into summer. As the Arctic lands thaw and the large continents warm, water flows from thawed rivers increase. In recent years, Jet Stream wave amplification has combined with warming temperatures in the region of 55 to 75 North Latitude to increase storminess and rainfall intensity. As a result, higher volumes of warmed waters flood north into what was once the ice sanctuary of the Arctic Basin. The pulse of water is generally enough to disintegrate land-fast ice and speed the ice melt further offshore.

Though large warm water pulses are not yet visible, regions to watch for 2014 will be the Mackenzie Delta and the mouths of the Kolyma, Lena, Yenisey, and Ob rivers. Major rainfall events in Siberia have been ongoing over the past week and will likely generate increased volumes of warm water flow for the Lena and Yenisey rivers particularly.

It is also worth noting that much warmer than average conditions have spread over the Mackenzie and Ob river basins.

Forecast Shows High Rate of Melt Likely

Today’s weather shows a continued building of the high pressure ridge over the Beaufort with GFS model forecasts predicting the ridge will remain in place over at least the next seven days. Persistence of this ridge pattern will continue to draw the ice in from the East Siberian and Laptev Seas even as warm winds over the Chukchi are reinforced. Sea ice totals may further be drawn down from rapid melt proceeding in both Hudson and Baffin Bay. Melt in these areas has lagged behind the larger Arctic somewhat, so current near record low totals are yet higher than they would otherwise be.

Melt soup

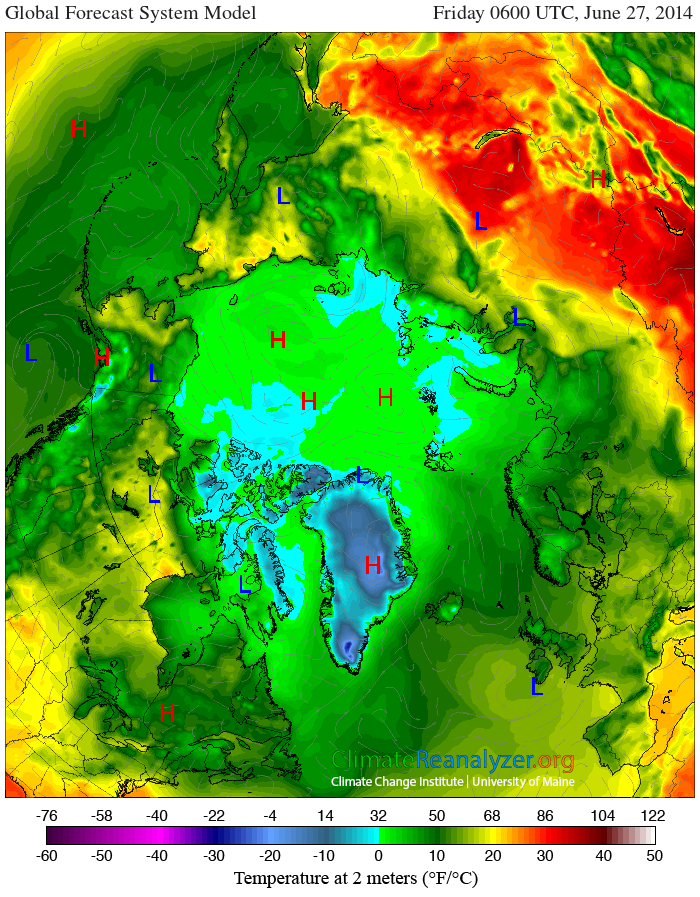
(107 hour GFS Model temperature forecast. Image source: University of Maine.)

Meanwhile, model runs show the Arctic steadily devolving into a kind of melt soup where atmospheric temperatures push into an above-freezing range for sea ice over the majority of the Arctic even as shore regions of Yakutia and the Mackenzie Delta are forecast to see temperatures in the mid 60s and 70s. These readings are in the daily range of +0.3 to +1.9 C above the 1979 to 2000 average for the entire area above the Arctic Circle and are predicted to hit local spikes from +4 to +18 C.

It should go without saying that a 70 degree reading in early June on the shores of the East Siberian Sea in the high Arctic is a clear sign of human-caused climate change gone nuts. And we are likely to see these and higher readings as spring proceeds into summer.

So though general cloudiness over the Arctic may continue to suppress melt pond formation, there likely remains enough heat baked-in to keep testing new record lows for sea ice. Even under cloud cover, dangers to the sea ice abound in the form of warm winds, warm storms, warm water upwelling, and a growing heat pulse from warming Arctic rivers. Amplifying heat and a growing number of ways in which that heat can be transferred to ice creates an ever-expanding risk for ice free conditions. Under such a regime, unexpected and extreme events are increasingly likely.

*    *    *    *

UPDATE: According to reports from NSIDC and Cryosphere Today, negative Arctic sea ice area anomaly for the date grew to 988,000 square kilometers below the average for June 3rd. This represents an additional loss of 179,000 square kilometers, which is larger than the combined land masses of the UK and Croatia (or roughly the size of the state of Missouri). This most recent plunge pushes 2014 sea ice into record low range as it essentially ties values for both 2011 and 2012 on this date. Any single day loss greater than 120,000 square kilometers for tomorrow will extend 2014 losses into all-time record low range.

In total, the plunge over June 2-3 represents 465,000 square kilometers or an area larger than the combined regions of California and Maryland. It is worth noting that weekly losses in the range of 500,000 square kilometers are considered extreme. We have instead witnessed a near 500,000 square kilometer loss in just two days.

arctic_AMSR2_nic

(Thin ice visible over broad stretches of the Arctic. Image source: Uni-Bremen.)

As an additional note, it’s worth sharing the observation that while high pressure systems and warm winds have placed extreme melt pressure and caused the ice edge to rapidly recede in the Chukchi, East Siberian and Laptev seas, ongoing cyclonic action in a rough triangle from the North Pole to Greenland to the Kara Sea has resulted in a great breaking, thinning and dispersal of ice in this region. The cyclones in the area, though weak, have generated enough force to greatly disperse the ice and, perhaps, to access warmer waters just below the ice in sections where ice has repeatedly expanded and retracted over recent months. Large patches of sea ice concentration of less than 75% in this zone make it very vulnerable to any additional heat and melt forcing.

So it appears the Arctic is split between weather forces — with cyclones dominating the sea ice between the North Pole, the Kara, and the coasts of Greenland and with high pressure systems dominating the Beaufort and the Laptev. Forecast higher temperatures injected into what is already a strong melt regime continue to generate high risk for rapid melt.

Links:

Cryosphere Today/NSIDC

Pogoda i Klimat

Arctic Ice Graphs

Arctic Sea Ice

LANCE MODIS

MIT

GFS Model

University of Maine

NSIDC MASIE plots


May Likely to Break Global High Temperature Record as El Nino Conditions Strengthen in Pacific

The human warming-riled monster weather event that is El Nino continued to advance over the Equatorial Pacific this week. Ocean surface temperatures throughout the basin from north and east of New Guinea and along a broad stretch of thousands of miles of ocean climbed. Sporadic west winds and an overall weakness in the trades extended the expansion of warm surface waters along the serpentine back of the El Nino pattern from west-to-east even as a high heat content Kelvin Wave kept conditions below surface much warmer than normal.

sstaanim

(Pacific Ocean sea surface temperature anomalies from 2 April to 28 May. Animation source: NOAA)

Large and growing regions of 1 to 2 C warmer than normal surface temperatures expanded in broad, 1,000 + mile stretches near the date line and ranged out from the west coast of South America. An impressive region of, very hot, 2-3 C positive anomalies grew through an ever-larger span from Santa Cruz Island to coastal Ecuador and Peru. Though the above graphic is not granular enough to catch it, daily anomalies in this hot pool exceeded extremely intense +3.5 to +4 C readings.

Readings in the range of +0.5 to +1 C invaded regions north to south, east to west, joining in an extraordinary zone stretching from the Philippines to South America, and from Baja to Hawaii to the Solomon Islands. A separate pool of very hot water north of New Guinea and near the Philippines is likely to play a further role in El Nino development throughout this year should weak trades and anomalous west winds persist. Then, a second and reinforcing pulse of warm water is predicted to push the entire Equatorial Pacific Basin well above a +1 C positive anomaly by late Summer through Fall.

Weekly Anomalies

(Sea surface temperature anomalies in the four key Nino regions all show continued warming through the end of May. Image source: NOAA.)

The tightening grip of El Nino is plainly visible with each of the four key Nino zones showing ongoing temperature increases in what is now a 3-4 month long event. Meanwhile, the key Nino 3.4 zone closed its 4th straight period above the +0.5 C Nino threshold even as it jumped to +0.6 C above average this week. Notably, the Nino 1+2 zone off South America hit a very warm +1.6 C average positive anomaly this week, showing additional warming from strong late April values.

Together, these values all show very solid continued progress toward El Nino.

image

(Map of geographical Niño zones provided by NOAA.)

Conditions in Context: May 2014 Likely Hottest on Record Amidst Ongoing Extreme Weather

Overall, Equatorial Pacific ocean surface temperatures continued their advancement from May 27 to June 2, rising from +0.59 to +0.68 C above the 1979 to 2000 average throughout the week. Global sea surface temperatures have remained in an exceptionally hot and likely global record range between +1 and +1.25 C above 1979 to 2000 averages throughout the month of May and into early June. These extraordinary readings likely combined with very high atmospheric values to put May of 2014 in the range of hottest on record. It is worth noting that, according to NOAA, April of 2014 was also the hottest in the 134 years since global temperature measurements began.

El Nino tends to spike atmospheric heat and, when combined with a brutal human greenhouse gas forcing, greatly increases the likelihood that a given year will reach new global heat extremes.

For 2014, El Nino and global warming related weather disruptions already appear to be taking hold with the Indian Monsoon appearing weak and delayed, a summer heat dome building over Europe and Western Russia, with Southeast China experiencing record floods even as northern and western China and Japan experience record heat. Ongoing droughts and crop disruptions in Brazil, building heat and drought in Indonesia, and Australia experiencing two back to back hottest years on record is also indicative of the screaming global heating that typically comes when El Nino gives human-caused warming an explosive boost.

Links:

NOAA

Indian Monsoon Disrupted

Monsoon Misses Date With India, Onset Delayed

Monster El Nino Emerging From the Depths