Earlier this month, Russia experienced a Song of Flood and Fire in which massive burning of Siberia’s tundra transitioned to the worst flood event in Russian history. Now, the still ongoing and worsening flood has become a haunting requiem for flooded cities as more than 100,000 homes have been devoured or damaged by the still-rising waters.
As of today, news reports indicate that flood waters have risen as high as 7.6 meters (about 24 feet) along the Amur River shattering a previous record of 6 meters and moving on toward a predicted high of an unprecedented 9 meters (30 feet). These record high water levels are the worst seen in the 120 years of record keeping along the Amur River, a rate of flooding and rainfall that numerous Russian scientists are now attributing to climate change.
The Amur floods come just one year after a record flash flood in Krymsk killed 171 people and resulted in 600 million dollars in damages. The current Amur floods are expected to reach nearly 1 billion dollars in losses, Russia’s most costly flood disaster in its history.
A brief break in the clouds over this heavily flooded region allowed for satellites to provide pictures of the heavily flooded Amur. What follows is nothing short of eye-opening as the Amur River appears to expand to the size of a large inland bay.
This shot shows an approximately 500 mile length of the Amur River running along the border between Russia and China. In this shot, we see the river ranging between 1-3 miles in width. By August 21, the situation is remarkably transformed:
In the above image, the Amur and its tributaries have swollen to between 5 and 20 miles in width devouring both forest lands and cities alike. The August 21 image was taken at a time when the Amur levels were about 7 meters, at another half meter in height and with more flooding on the way, even this remarkable picture is just a prelude to end flood levels.
Damages from flooding have resulted in the losses of about half a million hectacres of crops in the region, pushing food prices, on average, about 10% higher. Hungry brown bears displaced by the flood waters are increasingly encroaching on villages and towns in the region with Russian officials resorting to airlifting bears away from an at-risk human population.
Russian officials seem both stunned and taken aback by the rapacity and violence of these floods.
“I’m not going to read letters and telegrams that are coming from citizens in my address. We’ll discuss those at a separate meeting,” Putin said Thursday. “But I want to turn your attention to the fact that not everything is as smooth as we’d like to think.”
An increasing number of Russian meteorologists and scientists are linking these events to climate change, all while they lament a general lack of Russian government response.
“It is quite possible that such showers are indeed consequences of global warming. How else to explain this constant change in the climate?” Svetlana Ageyeva, head of the meteorological center in the Khabarovsk region, told RIA Novosti. “I would not laugh at those who say such things.”
Russian government has deep ties to its petroleum industry and preference goes to oil producing entities with little thought to the consequences of climate change. Most scientists in Russia expect little or no response from government unless the situation there continues to grow worse to the point where it begins to affect the profitability of government entrenched businesses.
Large, wet weather systems continue to converge over the Amur region as the Jet Stream delivers a stream of storms from the west and as Arctic storm systems ride down from the north along a deep trough. These converging rivers of air and moisture brought powerful storms, once again, to the already battered region today.
A similar Jet Stream pattern and moisture delivery system has been in place since late July, when evaporation spilling off the top of the Ocean Heat Dome near Shanghai dumped even more water vapor into an already overwhelming convergent flow. Since that time, a trough plunging down from the Arctic and a Jet Stream rushing across the continent have continued to link up over Amur, delivering storm after storm after storm. This is the kind of fixed, global warming-induced, weather pattern Dr. Jennifer Francis alluded to in her recent work at Rutgers and in her even more recent briefings to the US Congress.
Earlier this summer, I had a weather conversation with my mother. She was excited about a new business venture my sister had undertaken (Adventure Kayaks) and for an upcoming trip to Yosemite in August to celebrate her and my father’s 45th wedding anniversary. She wondered about the weather, hoping it would be a good summer for both the new business and the trip. Without thinking too much, I said:
‘Rain, cooler weather, and storms in the east, drought, heat and fires in the west.’
Immediately after saying this, I felt reticent. Perhaps I shouldn’t have spoken? Maybe I would scare my mom. What good would it do to ruin her enjoyment or her looking forward to both the trip and to my sister’s potential success?
It’s worth noting that, thankfully, the storms and cooler weather that did emerge with fury and flood in the east did not ruin my sister’s kayaking venture (although it did result in numerous interruptions both during spring and throughout summer). Should a tropical storm or hurricane make landfall on the US east coast this August, September or October, however, the devastation could be vast, perhaps exceeding a 1 billion dollar disaster event (more on this below).
But as my mother boarded her plane to California and a potential date with Yosemite yesterday morning, these were the satellite images I was looking at:
The vast Rim fire that had grown to consume over 192,000 acres as of today was steadily devouring the western border of Yosemite. You can see it on the above infrared satellite picture provided by NASA as a ring of bright white steadily inching into the indicated yellow border of Yosemite.
Jennifer Francis, Stu Ostro and How I Knew
Earlier this summer, my mother chided me on my ‘attempts to predict the weather.’ In a phone conversation last night, she asked ‘how did you know?’
It’s fair to say that in the overall prediction of more storms and rains in the US east, with more risk of flooding, and more heat and dryness out west, with more risks of fire, that I wasn’t entirely certain. However, I’d recently read the work of climatologist Jennifer Francis and had been listening to and following the statements of Stu Ostro. During early spring and summer, I observed a Jet Stream pattern setting up over the US that appeared to be settling into a ‘stuck position’ that would result in the high likelihood of the conditions I communicated with my mother. It’s worth noting that in looking at these Jet Stream patterns it’s not difficult to make such predictions because the patterns change slowly, they lumber and tend to remain stuck for long periods. Once a pattern settles into place, it’s a good bet that it will stick around for at least a few months these days, a fact that the models nail but which meteorologists, in general, have failed to communicate. In short, this is a climate change driven change in the weather.
In fact, some meteorologists and climatologists seem entirely reticent to accept this new weather pattern, despite the fact that it is a powerful tool for weather prediction and will tend to result in less surprises. The big troughs equal record floods sticking around for a long time and the big ridges equal record heat, drought, and probably fires sticking around for long periods of time.
It’s easy to understand why reticence still lives in the science. As I noted above, it’s understandable to feel reticent when being the bearer of bad news. No one wants to be the messenger that gets metaphorically ‘killed.’ But without making use of the clear understanding provided by Francis and Ostro, we will continue to be surprised by extreme floods, storms, fires, heatwaves and droughts that can be easily predicted by simply looking at how the Jet Stream sets up and where it gets stuck. Instead, ‘surprise’ after ‘surprise’ just keeps coming our way.
When Rossby Waves Get Stuck: Changing to a More Radical Jet Stream
Dr. Jennifer Francis has observed that loss of sea ice and snow cover in the Northern Hemisphere has resulted in a slowing of the Jet Stream in recent years. Sea ice volume, the measure of total ice in the Arctic Ocean, since 1979 had declined by as much as 80% when measured at its low during 2012 (this measure may rally back to around 75 to 78 percent lower than 1979 this year, but the overall trend remains a death spiral). Greenland melt is unprecedented at 500 gigatons per year and with Arctic heatwaves blasting the tundra both permafrost and snow cover are at record and near record lows. 80 to 90 degree temperatures now often advance to the shores of the Arctic Ocean, with the coldest air pushed back above the 80 degree north latitude line, confining it to a shrinking region that, increasingly, huddles closer to the remaining large ice sheets in Greenland. Overall rates of warming for much of the Arctic are about .5 degrees C temperature increase each decade, more than twice the global average.
A more quickly warming Arctic results in changes to the atmosphere’s heat balance. According to Francis, the height of the atmosphere over the Arctic is rising relative to atmospheric heights in the lower lattitudes, this loss of slope results in lower gradients from north to south and since temperature, atmospheric height and pressure gradient drive Jet Stream speed, the Jet Stream slows down. And as the Jet Stream slows, it tends to seek out the highest gradients it can find. The result is more northward invasions of the polar region of the Jet Stream ridges and more southward invasion of the Jet Stream troughs. This amplification creates a rather large and elongated sine wave called a Rossby wave pattern.
Jet Stream Pattern Change. Image source: NOAA.
In the sequence above, we see the progression of a flat Jet Stream to a Rossby wave ridge/trough configuration to, eventually, cut off lows and highs. In the past, such waves tended to set up for briefer periods, extending for days or weeks before returning to the usual, more flattened motion of the Jet. In more recent years, large Rossby type waves have been the typical pattern, one that transitions to cut off lows before it returns to a configuration more similar to (b) in the diagram, before setting up as a Rossby-type wave again.
Perhaps more importantly, this b, c, d progression has tended to occur again and again and again over the same geographical region for months and months on end. And, looking back at Jet Stream maps over the past months, this is exactly what we find.
Below is a progression of images I’m providing from this blog’s archive. It includes either direct temperature measures that indicate Jet Stream patterns or a mapping of air flow speed indicating the Jet Stream’s path.
In ‘For Central US, Climate Change and a Mangled Jet Stream Means Drought Follows Flood Follows Drought’ I described how the Jet Stream pattern had consistently switched from large trough to large ridge configurations over the past few years bringing either heatwaves and droughts or storms and floods. But the left hand portion of the image provides a good record of the Jet Stream configuration as of mid April this year. Following the temperatures, on the west coast we see a large, hot ridge and in the central and eastern US we see a deep, cool and stormy trough.
Wednesday July 3, Rossby wave still in effect over US.
Looking at the ECMWF image above we again see the highly exaggerated ridge/trough dichotomy setting up over the US with very hot, dry conditions out west and cooler, wet and stormy conditions in the east.
At this point, I want to tap Stu Ostro’s own observations to add to the Jennifer Francis mix. What Stu has found is that large, powerful high pressure systems have tended to develop more and more often. These extraordinarily dense systems seem to be exploding to new heights in a thickening atmosphere. Primarily, these monsters are driven by heat and so they tend to live in the massive ridges provided by our new, exaggerated and slowed, Jet Stream pattern. That said, these beasts can spring up almost anywhere there is a massive abundance of heat to tap, as one did over a super-heated region of ocean near Shanghai this summer sparking its own monstrous heat wave.
Since 1998, we have observed temperatures that are, on average, .8 degrees Celsius above those seen during the 1880s. What this means is that the hydrological cycle has amplified by 6% over this same time period. Because of this dynamic, droughts are more intense, but rainfall events are also more intense. Yet since the atmosphere is uneven we can expect this 6% amplification to manifest in somewhat more extreme fashion at the locations where more extreme Jet Stream patterns set up.
What goes up must come down. And that massive heat dome over the western US and Canada had been baking moisture out of the soil at unprecedented rates over an extended period from April to August. The moisture injected into the heat dome rose and rose, The high pressure system suppressed cloud formation so the moisture had no where to go but up and out. Eventually, this moisture found the edge of the massive high and spilled over into the storms riding along the Jet Stream trough rushing down from the Arctic Ocean and into eastern Canada and the US (hat tip to Colorado Bob).
A second pulse of moisture rode far south along this Jet Stream flow to dump massive amounts of rain over the southeastern US about a week after pummeling Missouri. This flow combined with a compromised tropical system to saturate the southeast, with some regions receiving as much as 300 percent their annual rainfall totals by late August.
One of the hardest hit areas is Lake Okeechobee. Water levels there as of mid August hit 16 feet at the Hoover Dike, a level that requires weekly monitoring for cracks or ruptures. The dike stretches over 140 miles along the perimeter of lake Okeechobee and was intended to keep the lake in check during major storms and hurricanes after large outburst events in the early 20th Century resulted in thousands of lives lost. The dike is 25 to 30 feet high and is as wide as a football field. The US Army Corps of Engineers has been working feverishly to shore up the dike in a project that will take years to complete.
As the threat of massive floods continued to increase in the east, the west was erupting with wildfires. Fire containment efforts went into high gear both exhausting the Forest Service Fire budget and briefly pushing the national fire alert level to 5. The Rim Fire, so close to my parents’ vacation site, expanded to 192,723 acres today making it the 6th worst in California history.
You can see this massive fire, now 23% contained, burning to the west of Yosemite in the Modis shot below. A more detailed report of this major wildfire is provided by WeatherUnderground here and here.
Mangled Jet Stream Temporarily Edges Eastward
My parents wanted to see Yosemite’s amazing waterfalls. A major source of my reticence in telling them the likely pattern for this summer was that the heat and drought out west would probably dry out many of those magnificent falls. And, sadly, this has happened. So even if they brave the smoke and fires to reach Yosemite, the one attraction my mom had been most excited to see will likely be somewhat less magnificent.
But a cloud has suddenly appeared in this wrinkle. For the Jet Stream had edged slightly east.
As of the middle of last week, reports of heatwave conditions had emerged throughout the US Midwest with North Dakota, South Dakota, Nebraska, Illinois, Wisconsin, Iowa, Minnesota and Missouri experiencing temperatures in the range of 20 degrees (Fahrenheit) above average. With heat index values hitting as high as 110 degrees, communities sweltered and school systems declared closings. In California, where temperatures had remained in the upper 90s to lower 100s for much of summer, the trough advanced, pushing temperatures back down to the 70s. An upper level low flirting with the west coast may even toss a few fog clouds and rain showers toward California. Such an event would be a welcome change for both my parents and for beleaguered fire fighters in the region.
In any case, the shift is expected to be short lived with ECMWF models showing the Jet Stream again backing up and reforming a hot and dry ridge pattern over the US west. So the Midwest can expect cooling and a return to more stormy, rainy conditions while the US west, after only a brief respite, continues to bake:
(Image source: ECMWF)
The September 7 ECMWF forecast again shows a large and powerful Rossby-type wave pattern with a very large and hot ridge setting up over the US and Canadian West with a deep trough digging down toward the US East Coast. It is the same pattern we’ve seen since at least April, a pattern that has delivered numerous rounds of heat and drought to the US west and an equally vicious and persistent pattern of storms and flooding from the central US to the east coast. The Jet Stream has, essentially, been stuck these past 5 months and there is no end in sight. For even if this configuration of the Jet were to move, it would likely simply re-distribute the locations of heatwaves and droughts and storms and floods.
If anything, this past summer has been yet one more validation in evidence of the work of Dr. Francis. And it is because of her work that I, a relatively untrained observer, can make the accurate prediction that a large region from the Mississippi west to California will continue to stay hot and dry and will continue to see risk for large fires, while the region to the east will remain cooler and stormier so long as the current Jet Stream configuration continues to persist. The western region will risk periods of record heat, continued drying of lands, rivers and aquifers, and fires of record size. The eastern region will continue to risk record floods and storm events. As summer proceeds to fall, shifts in these weather patterns have the potential to grow violent with the possibility of powerful nor-easters or hybrid storms developing near the US East Coast. Both the southeast and Florida remain very vulnerable to continued large rain events or tropical storms and hurricanes as time moves forward and in the event of pattern persistence. Meanwhile, long range model forecasts show this general pattern continuing to persist until at least early to mid September.
At this point, the current US Jet Stream pattern will have been in place for at least 6 months.
Some of you may have noted my absence. I’ve been nose-deep in completing the launch of a book that has been about 10 years in the making: Growth Shock. It developed both from my experience as an emerging threats expert for Jane’s Information Group and related consulting efforts, later from my connection to thousands of wonderful young people, many of them disadvantaged, through a 6 six year schools campaign, and finally through participation in the direct actions that were Occupy Wall Street and the 2012 Stop the Pipeline demonstration sponsored by 350.org in Washington, DC.
In support of these efforts, at least 60% of the book’s proceeds will go to 350.org (40%) and to direct funding for freedom from fossil fuels (FEFF) for individuals, localities and communities (20%). But I’m not stopping with these actions. An upcoming third speculative fiction novel in the Luthiel’s Song series will be re-named The Death of Winter and I will be organizing a campaign to raise energy transition funds for public schools around the sales campaign for this book (more on this later). Another publication effort examining the loss of glacial and sea ice and its consequences will direct funds to scientific research through the Dark Snow Project and to help support James Hansen’s continued work at Columbia University. A fourth and still unnamed publication will also be directed toward reinvigorating policy efforts to rationally and benevolently restrain human population with an ultimate goal to bringing it, along with consumption, back into balance with Earth Systems and to back out of our current and dangerous overshoot. These efforts will likely take years to complete. But they are now on the table.
Luthiel’s Song Book III to be re-named: The Death of Winter
This is not at all to denigrate the need for direct action, campaigning, and demonstration. When possible, I will continue to participate in these efforts. But my goal will be to organize my life and my means of life support to also support systems that re-invigorate, restore, renew, and enlighten. This is the basis for the kindness economics proposed in Growth Shock — that our life works re-weave humankind back into the web of life, that we stop breaking it, and that we develop human technologies and thought systems that support life, rather than harm it.
But we’re a long, long way from any of that. And, at this very late hour, some of us are only just beginning to respond as others still languish or remain trapped, captives to systems of harmful consumption and harmful action. Meanwhile, climate change, overpopulation, resource depletion and the institutionalized and greed re-inforced systems that lock the technologies, policies, cultures and thought-systems that cause such harm in place are now in a critical phase of crisis, a phase where harm from these four forces is ramping ever higher, causing great fractures through the structures of modern civilization. Like the metaphorical lemmings, we still run headlong toward the precipice. Sooner or later, we will go over.
Unless we stop. Unless we back away.
We haven’t done this yet. We haven’t even slowed down. And, for this reason, we are in deep, deep trouble.
What follows is an opener to the book Growth Shock. But for you, I’ll provide a bit of qualification. The situation is a shade or two worse than even what I describe in the intro. Though I still believe it is possible for us to stop, to turn around and to make the needed changes, the effort required will be so great that the difference between the death-fed and destruction-creating human world of now and the vital, healthy, sustainable, and reinvigorating the heartbeat of nature human world of our best future is a vast chasm. A great rift that may well be impossible to cross for individuals, communities, and nations. This does not diminish our need to try, to at least make a grand attempt before being overwhelmed by the darkness. To level all our intellect, creativity and tool making abilities toward effecting a positive change, toward reversing the terrible disaster we’ve now set in motion that has already been, for many of the innocent creatures of our world, a horrible apocalypse…
***
Excerpted from Growth Shock:
I have a confession to make. One that is not easy to vocalize. One that is equally difficult to listen to. My confession is not one of a personal nature. I am not revealing my own, petty, individual sins. Instead, I’m making a confession for us all. A revelation of the ongoing and maturing tragedy of our race. One we will each need to be made aware of soon if we are to effectively act. For the age of excess is rapidly coming to a close and we are now entering a difficult and hard to manage age of consequences.
My confession is simply this: we are in trouble. A kind of trouble that is both typical to all living creatures and beyond the scope of anything we humans have yet witnessed. A kind of trouble that is both born of the natural world and directly caused by us.
Our trouble is that over the course of the next century we will run head-long into a number of very difficult to manage shocks that are the result of our unsustainable growth. How we confront these shocks will determine whether or not human civilization survives to reach the 22nd, 23rd, or 24th centuries or whether we, at the very least, encounter a coming age of darkness and decline.
That we will encounter some trouble is now unavoidable. At this point, all we can do is seek to reduce the scale of that trouble and lessen the harm that is its inevitable result. A decade or two ago, if we had acted sooner and with due urgency, we might have prevented harm. But harm is already upon us, growing worse with each passing year. And though our trouble has already become apparent to many, we still languish, squandering the time and effort needed to manage the emerging shocks even as they grow more deadly and dangerous.
If we decide to confront these troubles, what lies before us are many decades or more of sustained effort to reduce the damage we have inflicted upon ourselves — efforts from which may arise a new golden age should we overcome these troubles. For pushing beyond our current limits through renewable energy systems, providing direct supports to heal the living world we depend on, establishing more kind and inclusive economic systems, and undergoing the general transition to sustainability necessary to deal with our current crisis results in an ever-expanding justice and prosperity. The potential for a true world without end.
If we do not act, a massive and rapid decline of human civilizations, a mass extinction in the oceans and on land, and a radical re-shaping of the Earth’s environment to a state far more hostile to humankind are all in the offing.
This is my confession. For it is the truth or our age. It is our dire tragedy, and our great hope. For we are living in the age of Growth Shock.
At the end of the last ice age as the climate warmed, glaciers began to thaw, and sea level began to rise, a troubling spike in the number of undersea landslides and related tsunami events occurred. In total, almost half of all the undersea landslides of the past 125,000 years occurred during this period of deglaciation occurring from 8,000 to 15,000 years ago. A rate many times that seen during either the glacial period or during the Holocene.
This large increase in subsea landslide events had long been observed in the science. But, up until this point, there has been little research to determine why so many landslides occurred. But this year, a team of scientists developed a model to investigate the cause of these continental shelf slope failures and large undersea landslides. The report, published in Geology, is available here: Sea-level–induced Seismicity and Submarine Landslide Occurrence.
The findings of this study and related model run were stark. According to results, rising sea waters spurred by climate change greatly increased the pressure on undersea slope and fault structures. This pressure, rising over 7,000 years to roughly equal that of a human bite over every inch of these undersea fault systems, was found to result in numerous catastrophic failures.
In a slope failure, a strain on an undersea fault in a debris, rock or sediment zone first begins to grow. The region of sediment already rests over a sloping undersea terrain and so the weight of the ocean above constantly pushes down on these structures. Over time, the stress increases due to slow structural change, seismic stresses, the passing of large waves and/or strong storms, and/or loss of slope integrity. If sea levels rise, the added weight of a deeper ocean overhead further increases stress. Eventually, the fault line catastrophically fails causing separation and rapid collapse of slope material toward the ocean bottom.
Slope collapse zones can stretch for miles and miles along seabed drop-off zones. A slope failure can release millions or billions of tons of material, displacing an equally high volume of water. Under the right circumstances, such large slope failures can result in very large tsunamis, similar to those caused by major ocean earthquakes.
More ominously, perhaps, is the fact that large slope failures can directly expose previously buried deposits of methane hydrates. If large stores of this substance are rapidly uncovered in a warming sea environment they can swiftly out-gas and greatly contribute to an already ongoing warming.
The most vulnerable regions for slope collapse include large, shallow continental shelves that have multiple or large fault zones and that border an ocean drop-off to deeper water. A particularly sensitive region is the shallow East Siberian Arctic Shelf which contains numerous fault zones and extends out into deeper Arctic waters as well as slope structures near the Gakkel Ridge. The ESAS also contains one of the Arctic’s largest stores of methane, estimated at 500 gigatons. Many structures in these regions are already emitting significant, but not catastrophic, volume of methane from undersea hydrate stores. A slope collapse of the kind mentioned in this report in any of these locations would have severe consequences for ESAS, Arctic and global methane release.
Rate of Sea Level Increase During the End of the Last Ice Age
Changes in Sea Level at the End of the Last Ice Age.
During the period of deglaciation at the last ice age’s end, a global temperature rise of about 5 degrees Celsius caused a 395 foot sea level rise over the course of 70 centuries. On average, sea level rise matched pace with temperature increase. Once ice sheet destabilization began, each .1 C temperature rise coincided with about a 6 foot rise in sea level, or a rate of slightly more than 5.5 feet per century.
Current glacier systems hold enough water to increase sea levels by about another 200 feet. Ocean thermal expansion will add its own increase to this potential sea level rise. At a .8 C temperature increase since the 1880s, current temperatures are near or just above the Holocene maximum, large ice sheet destabilization has begun, and rates of sea level rise are continuing to increase. With temperatures expected to rise between 4 and 7 degrees Celsius by the end of this century under business as usual fossil fuel emissions, a temperature increase roughly equivalent to one that took 7000 years to complete at the end of the last ice age, it is highly likely that a 5 foot per century rate of sea level increase will be matched or exceeded. Such a rapid rate of sea level rise would create stresses to sub-sea ocean slope systems that meet or exceed that seen during the end of the last ice age, greatly increasing the risk of catastrophic slope failure and resulting tsunamis and potential methane release scenarios.
Alarmist. It’s a term climate change deniers seem to bandy about often, these days, as if ‘alarm’ were some kind of bad word. As if alarm weren’t needed or necessary. As if climate change, a primary vehicle for a range of horrors ranging from mass extinctions to catastrophic Earth changes, were some kind of carnival ride or a happy walk in the park.
But what if alarm is entirely called for? What if, for example, you’re standing in or near a river and a massive glacial melt lake up-stream has suddenly released and an immense torrent is now rushing toward you (as happened to thousands in India this year). Would you want the person on the hill near shore who sees the onrushing water to say in a calm, steady voice:
“Hey, you might want to get out. That water could rise a little.”
Or, even worse, would you want them to say, as the deniers would:
“It’s all good. The water’s just fine for swimming.”
Is either of these responses appropriate?
How about just shouting:
“Megaflood on the way! Get the hell out!!”
The IPCC is version #1. The oil company dupes and lackeys are version #2. As for version #3 …
A Call For Climate Change Urgency
One fundamental point a rational observer of the ongoing catastrophe that is human-caused climate change should always keep in mind is that scientists are, by nature and as a group, very conservative. It’s one reason why science, in general, is not a very good indicator of alarm to an emerging crisis. Science is constantly checking itself, is rightfully uncertain about the nature of truth, is constantly challenging its own assumptions. This refinement is a needed part of the improvement of human knowledge. But this process, often, creates a marked underestimation of potentially large-scale events.
Take the cases of sea level rise, Arctic sea ice melt, human CO2 emissions, and ice sheet response over the last 30 years. The combined report of consensus science represented by the IPCC has consistently underestimated rates of loss or increase for all of the above. In short, the best description of past IPCC reports on climate change, and their related forecasts, could be that they were, overall, conservative, muted, and mild when compared to the changes that are being observed now.
The IPCC’s reports are so muted, in fact, that they tend to leave us very vulnerable to what can best be termed as catastrophic events that are ever-more likely as the vicious and violent pace of human greenhouse gas forcing continues to progress. In prognostication of these potential events, the IPCC is an abject failure. It does not take into account the very high likelihood that, if you push the world climate to warm faster than it ever has before, and if you hit temperature increases of 2, 4, 6 degrees Celsius within 30, 50, 100 years that set off Heinrich Events, large Earth system carbon responses (catastrophic CO2 and methane release), rapid sea level rise, and ocean anoxia (dead oceans) in the past, then you are likely to get at least some of these events coming into play over the next 100 years. Yet the IPCC does not issue a report on overall ocean anoxia, or the potential risk for catastrophic ice sheet collapse, or what might result from a massive methane and carbon release from a very rapidly thawing Arctic that is now liberating a massive carbon store to such violent processes as Arctic heatwaves, a raging pace of sea level rise, or a great and explosive outburst of wildfires.
Should the IPCC issue such reports, it might warrant the observation that it had sounded an alarm. But, then, it would be sounding a needed and necessary warning, one that was entirely outside the pejorative ‘Alarmist’ deniers so recklessly bandy at any hint of warning to an obvious and dangerous set of events. One entirely pertinent to the current age of rapid fossil fuel burning and rates of warming that are 30 times faster than at the end of the last ice age.
Sometimes, alarm is what is needed and absolutely called for.
In short, the scientists should be screaming at us to:
“Get the hell out!”
***
Related Reading:
NASA Scientist James Hansen:
“I suggest that a `scientific reticence’ is inhibiting the communication of a threat of a potentially large sea level rise. Delay is dangerous because of system inertias that could create a situation with future sea level changes out of our control. I argue for calling together a panel of scientific leaders to hear evidence and issue a prompt plain-written report on current understanding of the sea level change issue.”
If anything, the upcoming book, Growth Shock, is a call for action.
Confronting the combined threat posed by a rapid depletion of renewable and nonrenewable resources, a human population that is still growing beyond the 7 billion number it passed such a short while ago, a rapidly escalating and terrifying climate crisis, and a vast failure to act due to the power of wealthy, greedy, and entrenched special interests who, at every turn, fight to profit from harm, will be impossible without powerful, creative, and coordinated effort. What this means is action on the part of individuals, communities, organizations and governments. What it also requires is leadership from all individuals both great and small.
And if leadership means being among the first to act while compelling others to do the same, then I choose to dedicate the publication of Growth Shock and a majority of the proceeds to undertaking such an effort.
My actions through Growth Shock will involve:
Providing direct charitable contributions to 350.org
In recognizing this imperative in the face of crisis, I’ve decided that the publication of Growth Shock will, in itself, be an action that pushes for effective change. I have identified one charitable organization — 350.org — which has been very effective in both its pursuit of the blocking of access to dangerous unconventional fuel sources (its stop the Keystone XL campaign) and in its direct targeting of the source of so much harm through its ongoing campaign of divestment in fossil fuels programs. 350.org’s other campaigns include an effort to stop all fossil fuel subsidies (globally) and to shift all power sources from fossil energy sources to first order renewables. 350.org is also aligned with a campaign supported by James Hansen to tax all fossil fuel use at the source and/or port of entry and then transfer the funds to the public who would then be incentivized to purchase non fossil energy sources and make more efficient use of energy. 350.org also identifies a probable ‘safe range’ of atmospheric CO2 levels at 350 parts per million and below. This range is based on the advice of climate scientist James Hansen who notes that it may be necessary to push CO2 levels below the 350 ppm limit that is the namesake of the organization.
My support of this noble and ongoing effort will involve the donation of fully 40% of the proceeds of Growth Shock to this charitable cause. If sales are small, and donations are low, then I can at least take a small part in this ongoing and effective campaign to remove fossil fuel exploitation and economic dependence. If sales are moderate to large, I hope to be able to provide seed money for new campaigns or expanding efforts under existing campaigns.
As part of this effort I also encourage other authors and bloggers to make funding pledges to 350.org or to similar charitable projects that help to confront the climate crisis through direct and coordinated political action and, when necessary, targeted acts of non violent civil disobedience.
Breaking the Bonds of Captive Consumerism and Providing Money for a Direct Transition Away From Fossil Fuels
Since political action may be stymied, blocked, and delayed by entrenched fossil fuel special interests, funding direct campaigns such as those conducted by 350.org may not be enough to address the larger problem inherent to an urgently needed energy transition. As individuals, we must increasingly take responsibility for our own energy use as well as the energy use of others. Such energy use and, what I perceive to be a market-enforced addiction to fossil fuels (by denial of economic alternatives), is a primary contributor to our current climate and economic problems.
My wife and I, like many who live in the western world, are among these captive consumers. Our electricity comes from a power company that generates only 20% of its energy from renewable sources. And though we live in a state — Maryland — that is progressive and actively pursues an increasing proportion of renewable energy, its current pace of transfer is not rapid enough for comfort. We also own a vehicle that, though having a fuel efficiency in excess of 35 mpg, is still entirely reliant on fossil energy. On the positive note, we are both vegan and, when possible, choose local food sources and so our food preferences have a very low climate impact while improving food availability for our fellows.
That said, there is much that could be done to further reduce our individual impacts — primarily investing in a solar energy system and a related solar garage for an electric vehicle. Having access to these resources would allow both myself and my wife to be freed from a majority of our captive fossil fuel consumerism and so this is also a goal inherent to the publication of Growth Shock.
Fully 20% of all proceeds from the book will go to a fossil energy freedom fund (FEFF) for our household. Once enough money is allayed for the provision of these alternative resources, we will undertake their installation as a completion of our own energy transition. But we won’t stop there.
Since we must also be held accountable for the energy use of our fellow human beings, once my wife and I achieve a high degree of fossil energy independence, these funds will shift to providing a similar gift, first to friends and family members and then to complete strangers. Should we achieve these aspirations, a role-out of FEFF contributions to others will be provided in more detail.
As with the 350.org donations, I will keep track of progress in a monthly report on this blog.
Unlikely Outrageous Success
Should Growth Shock be an unlikely outrageous success, the amount of funds going to charitable causes and active energy transitions will, necessarily, rise. In Growth Shock, I advocate highly progressive rates of taxation for individuals making more than 250,000 dollars per year and 1 million dollars per year respectively. In the highly unlikely event that Growth Shock should, even briefly, generate such a high level of revenue, then I will provide additional charitable contributions and charitable energy transition efforts equal to the difference between my base tax rate on the 40% of funds going to myself and my wife and the suggested rates given in Growth Shock for levels beyond 250,000 dollars. It is worth noting that, since 60% is already dedicated to transition or charity, additional amounts will push the giving level of ‘kindness economics’ far beyond that even suggested.
Since it is highly unlikely for Growth Shock to enjoy such a high level of public success, this additional pledge is probably a symbolic, but still important gesture.
An Open Call For Similar Action
I am also calling for others to act in a manner similar to that which I have described here. There are many important charity organizations like the Sierra club who are also involved in very effective campaigns to reduce reliance on and use of fossil fuels. In addition, individual pledges for private transitions away from fossil energy sources would be a very helpful addition to the broader, public campaigns. Greatly diminishing the power of the fossil fuel industry by reducing fossil fuel reliance will at least begin to point the nose of the ship of human civilization toward fairer weather, even though extraordinarily powerful storms may still await us on that, far less harmful, path of travel.
It is also worth noting that these actions only begin to address the problems outlined in Growth Shock. However, it is my view that removing fossil fuel reliance will begin to address some of the most immediate problems inherent in both resource depletion and in our current failure to provide effective mitigation to a rapidly worsening climate crisis. And even if mitigation is pursued it will continue to be imperative to provide aid for victims and the likely refugees that will inevitably result from a number of hard changes that are now unavoidable. So once the most important hurdle of mitigation is crossed, it is likely that we will then need to shift funds to helping victims, adaptation, and the invigoration of a kindness/living systems economy that works to revitalize the Earth life support structure through direct aid to and cooperation with our companion species here on Earth. An explanation of methods for weaving human systems back into living Earth systems will be provided in much greater depth and detail later. But such goals are outsets and worth mentioning.
Lastly, but not least importantly, It will probably also be necessary to support efforts and organizations that promote both kind and effective population restraint. Likely, another charity publication will be aimed at that effort.
Because dolphins sit at the top of most ocean food chains and due to their sensitivity to healthy or unhealthy ocean states, they have been called “the sentinels of ocean health” by oceanographers around the world. So, when East Coast dolphins are dying at their fastest rate in 26 years, and with scores of these majestic creatures washing up on beaches from Virginia Beach to New York, we should sit up and pay attention.
****
I remember the 1987 East Coast dolphin die-off well. Why? Because I can clearly recall paddling through the ugly, murky red-stained waters in my almost daily surfing quest for decent waves as a Virginia Beach teenager. It was early September and school was just beginning. The tropical Atlantic was unloading its guns, firing off the tropical storms and hurricanes that provided the lovely swells I hunted with so much passion.
But walking down the beach didn’t provide its usual pleasure. The air was chill and the ocean ugly. Plunging into the water, I noticed it was filled with what appeared to be a reddish mud. Even knee deep, I couldn’t see my feet. Paddling out through the dark, rust-red waters was strange, eerie, like entering a distant land or the seascape of another time. The water was cold and nutrient-rich from a large upwelling event as well as from the annual run-off from farms and lawns. Distantly, I knew these things from news reports and from the discussions of family members who were, even then, heavily involved in the Chesapeake Bay Foundation’s efforts to preserve the health of marine environments local to my area.
But paddling through those ugly waters, I was more concerned about what I couldn’t see. About what was concealed beneath all the darkness and murk. Where had the crystalline waves of my early youth gone? And what of the azure waters full of rich, white foam? Now turned to a kind of brownish scum.
The waves that day were large, dark, bullies filled with a biting ugliness. Angry brutes capped with rusty foam. One held me under for longer than I liked and I turned to paddle home. Settling in front of the TV glow with my family, I learned the news. “Largest Red Tide on Record. Massive East Coast Dolphin Deaths. Health Risk. Advised to Stay out of Red-Brown and/or Murky Water.”
My family kind of laughed it off. There’d been red tides before. But none like this one. That year the red tides were exceptionally strong and over a ten month period more than 700 dolphins died.
***
These events of long ago remain clear in my mind because they had ominous implications for my favorite sport — surfing — which in itself was rooted in a joy for the glory of nature. I had often felt that the great symphony of life and beauty I found in the ocean while surfing contained far more majesty and spirituality than any land-bound church. The great blue vault of heaven and the starry night that came behind contained all the awe and adoration, for me, that so many others associated with God. My worship was a dance across the beautiful face of nature, my only remaining contact with the human world — the opalescent surf board beneath my feet.
But with the red tides the beauty and the awe was ripped away, revealing a dark and ugly underbelly. A soulless place of lost life and beauty. I didn’t want to plunge myself into ugly and potentially harmful waters, nor did I find much appeal in those new, dark, blood colored waves. They had lost their grace, becoming rough, brutish things and the water I was paddling through was death. Along with the dolphins, fish, crabs, every sort of sea life suffered and perished. The catches of fishermen dwindled. It was a bad year, but only a shade of things to come.
***
Silence and an incapacity to communicate or understand what is wrong is often the most brutal form of suffering. During my middle-school and high school years, I suffered numerous bouts of bronchitis and general weakness. During late high school, I went through a six month period when I experienced terrifying episodes of shortness of breath, with no other symptoms. Doctors couldn’t discover anything wrong, so I continued on as I could. The summer after my senior year, I was sick with a fever of 100+ for a month straight. The doctors tested me for mono and found nothing. Shrugging their shoulders, they proclaimed it was a ‘mono-like-virus.’ Whatever had caused these symptoms left my organs inflamed and my doctors advised me to ‘avoid any kind of strenuous sport or heavy lifting’ lest it cause an organ rupture. For more than a year, I required 10 hours of sleep to maintain any level of energy. Eventually, though, the health troubles and symptoms faded.
***
Thunderstorm over Jane Island.
I come from a place that relies on the life of the ocean and the waterways that feed her. And my experiences have taught me to be sensitive and to pay attention to my surroundings. Often, the media cannot be relied upon to tell the whole story. Such was the case with the camping trip I took to Jane Island with my wife this summer.
The Jane Island campground is a thin strip of coastal pinewood carved into a cluster of sites for campers, RVers and wildlife enthusiasts. It is managed by the park service and sits adjacent to a sprawling wetland called Jane Island. The island is, itself, a testiment to the ravages of human caused climate change. More than a hundred years ago, the island hosted a fish cannery, and a number of farms. But the low lying land, like so many Chesapeake Bay Islands, has steadily been reclaimed by rising water. Now all that remains are a few copses of pine trees and a vast wetland filled with channels deep enough to kayak through. At high tide, the majority of the island is now submerged.
Kayaking Through the Wetlands of Jane Island (My Sister and Bro-in-Law in this Shot)
The nearby town of Crisfield had its own tale to tell. Dilapidated and abandoned houses lined the road leading into a town filled with closed store fronts covered in peeling or salt-stained paint. The architecture there appeared to have frozen sometime between the late 80s and late 90s. Everywhere could still be seen the icon of Crisfield — images and silhouettes of Chesapeake Bay blue crabs displayed everywhere from flags bearing school mascots (“Go Crisfield Crabs!”), to flags displayed outside dilapidated real estate offices, to paintings on the sides of buildings, to signs on the dwindling number of bay side restaurants. A ferry that transported tourists and sightseers to Tangier Island, which is also steadily being reclaimed by the Bay, lies roped off and idle, blocked by large orange traffic cones.
The scene is one of a town that is descending into a post apocalyptica, one more likely to be featured in a gritty novel or Hollywood movie than as a destination spot for vacation goers.
What had pushed Crisfield so far down the road to disintegration? One need look no further than their iconic blue crab. Crisfield is a town almost entirely supported by its crab and oyster fishing industries. But over the past 26 years, both crabs and oysters have suffered from a series of disasters. Red tides, algae blooms, anoxia, invasive species, and chemical dumps from industries along rivers feeding the bay all exacted their awful toll. The result was numerous deaths and high toxicity levels in these sensitive bottom dwelling animals that either made them unsellable or substantially reduced their populations for extended periods. And, in Crisfield, this devastation of ocean bottom dwelling life took a terrible and visible toll on human life there as well.
***
Why Context is So Important to Understanding Climate Change
In understanding the damage resulting from human caused climate change, context is everything. Because climate change is so large, we have to look at the big picture in order to understand it. All too often, we look at a long, thin, bushy, tufted thing, or a padded stump-like thing, or a spear-like protrusion of ivory and see only strange, isolated, and seeming in-congruent features. But when drawing back, what we find is an elephant.
And this is why I’m sharing with you my experience of the health of the waters surrounding the Chesapeake Bay, a set of waters I have had intimate contact with for most of my life, intimate enough to know that the life there is in severe crisis. So when scores of dolphins begin washing up dead on shores adjacent to the Chesapeake Bay and nearby ocean, one does not immediately jump to conclusions without investigating the larger context.
So, before we continue on a broader investigation, I’d like to call your attention once again to the satellite image at the top of this blog post and ask you to engage your senses. What do you see there? And does it look normal to you?
Morbillivirus or Failing Ocean Health?
Earlier this summer odd reports were emerging that Manatees were dying in unprecedented numbers along Florida waterways. Widespread red tides had expanded through Florida estuaries, coating the grasses Manatees consume in paralytic toxins. These toxins, when consumed in large enough amounts cause the Manatees muscles to seize up, making it impossible for the Manatees to reach the surface to breathe. From NPR as of March 28th:
More than 200 manatees have died in Florida’s waterways since January from an algae bloom called red tide, just as wildlife officials try to remove the marine mammal from the endangered species list.
In a separate incident during early June, reports had emerged that a large algae bloom was covering some East Coast beaches with an algal foam that is implicated in increasing ocean anoxia. From the Marine Institute as of May 27th:
The production of foam, and in some extreme cases anoxia, can result in marine organism mortalities. Fish mortalities caused by this particular species in previous Irish blooms have not been observed, as wild fish tend to avoid the bloom. This may explain the low catches reported by sea anglers on the east coast in recent weeks. Several fishermen have also reported clogging of nets in recent weeks, which may be caused by the decaying bloom sinking to the seafloor.
In yet one more incident, an estuary of the Chesapeake Bay called the Lafayette River in Hampton Roads experienced yet one more dangerous red tide event. The Chesapeake Bay foundation reported the event which is under investigation by the Virginia Institute of Marine Science.
The findings match visual evidence of wide-spread algae blooms that can be seen from satellite in this region of the East Coast. And algae blooms can have numerous and devastating effects to marine ecosystems. The organisms involved in algae blooms often produce toxins which are directly dangerous to fish and marine wildlife. They starve the waters by consuming oxygen, at which point the oxygen consuming algae die and micro-organisms that thrive on anoxic conditions multiply. These organisms produce and use hydrogen sulfide as a means of cellular respiration increasingly as anoxic conditions expand. Hydrogen sulfide is a fat-soluble gas that is toxic to all forms of oxygen dependent life. It may become concentrated in both fish, mollusks and crabs. In high concentrations in mammals hydrogen sulfide is implicated in high fever, pneumonia like symptoms, multiple organ systems stress (including liver and kidneys), and is a potent neuro-toxin — attacking both nerve and brain function. LD 50 levels (the dose which is lethal for half the population) for most mammals are around 5 grams per kilogram. Direct inhalation of extraordinarily high levels of hydrogen sulfide acts similarly to cyanide gas and is almost immediately lethal.
Both anoxia and high hydrogen sulfide levels have been implicated in numerous fish kills occurring around the world as both oceans and inland waterways warm and become more favorable to large algae blooms. Such a change in ocean and water states has been implicated in numerous mass extinction events in the oceans and, in worst cases, on land (see The Deadly Climb From Glaciation to Hothouse, Why the Permian Extinction is Pertinent to Human Warming).
Finally, it is important to note that of the now 200+ dolphins that have washed ashore dead, only 3 have tested positive for morbillivirus.
(Video embed code isn’t working, looking for alternate source. Until then, please follow link)
As the above video shows, oceanographers and marine scientists at the Virginia Institute of Marine Science aren’t buying the morbillivirus explanation.
Perhaps the most stark evidence for a non-virus related death source, an indication of fat soluble toxins of the kind produced by large algae blooms, is the fact that those individuals most vulnerable to toxins are the ones that are seen to be dying at the most rapid rate. According to Smithsonian Institution scientist, Charlie Potter:
“Males don’t have a mechanism for shedding contaminants. The females shed significant amounts of their lipid-soluble contaminants through lactation, so the calf gets a hell of a dose early on in life, and some of the most outrageous levels of contaminants we’ve seen have been in calves.”
Susan Barco, also a scientist with the Smithsonian, noted that dolphins were a key indicator of ocean health and that when dolphins are dying in large numbers, something is seriously wrong:
“Bottlenose dolphins are a higher-order predator. They’re often referred to as ‘ocean sentinels of health.’ So when our bottlenose dolphins are healthy, it would probably indicate that we have a fairly healthy ecosystem. When our bottlenose dolphins are not healthy, it may very well indicate that our ecosystem is not healthy,” she said.
***
The ongoing loss of ocean health is, to me, a defilement of the very spirit of our world. As a child and teen, I was part ocean creature, with so much salt water in my veins. My first memories of her include my father joyfully tossing me into the, then crystalline, waves and then swimming in after me, taking me to the depths to cup small black fish in his hands as a gift of experience to my two-year-old self.
The moment of the black fish, swimming in my father’s hands, me staring at it, it looking back at me, so small, even compared to me, is still with me. I remember being afraid for the fish cupped in the large hands of my father. I remember thinking it might be hurt. Yet I also remember the wonder of the moment we shared, and the joy I felt as my father released it back to the waters.
I realize now that the life of the fish and my own life are connected and that they were never separate. The fish depends on me and my human fellows to act responsibly, to work to restore a now terribly sick world, to give it back the more healthy ocean of my childhood. And we, both you and I, depend on the fish to live, to do its good work in doing its own part to keep the oceans well, a safe place for humans and ocean dwellers alike. For together we become a part of a vibrant and self-reinforcing web of life. And, in breaking that web, we come to die alone and with great suffering.
I do not like this mass death of the dolphins whom we now know to call to each other across the oceans by name and with voices that carry through miles and miles of the still living, but greatly threatened, waters. And I am growing deeply tired of a great number of humans who obstinately fail to see the bigger picture, who continue to push for the delivery of ever greater harm and yet deny its growing force and violence. If the dolphins have names for one another, I wonder if they also have a name for such creatures that live among us?
***
Destroyer of oceans, destroyer of life, destroyer of worlds…
(Hat tip to Peter Sinclair who thumbs his nose at the deniers stating, in reaction to this Fire Tornado: “sure, happens all the time.”)
The above is a film recorded on August 16th, 2013 of an explosive fire complex forming a massive fire and smoke tornado 3/4 of a mile across and towering thousands of feet into the air over a ridge line near Tetlin Junction Alaska. Close inspection of the video reveals trees and branches being sucked into the large fire ‘tornado’ caused by very strong inflow along the fire’s leading edge. Tim Whitesell, a firefighter at the scene noted:
“A picture probably is worth a thousand words, but there are indeed times when a picture just doesn’t do it justice. I’ve never seen anything like it until now.”
The terrain features in this region include boreal forest and soil that is mostly permafrost. The film shows both burning trees and ground along with a section involved in an episode of explosive outburst.
“This wildland fire footage was captured on August 16, 2013, on the southeast perimeter of the Tetlin Junction Ridge Fire (#414), burning east of Tok and Tetlin junctions, north of the Alaska Highway.
Fire behavior increased into the later part of the afternoon on August 16. At approximately 7:00 p.m., the Alaska Division of Forestry Aerial Supervision Module (consisting of Tim Whitesell and Doug Burts) reported the fire vortex to be about 3/4 of a mile wide; it lasted for about an hour. The extreme fire behavior uprooted trees, a scene that was captured by this footage- look for trees being blown around in the smoke column at the end of the clip.”
The blaze that sparked this massive fire tornado is arguably one of the smaller events to impact the Arctic this year, just a fraction of the size of larger infernos that have raged through areas of Canada and Russia since June. In ‘Russia Experiences Great Burning’ MODIS shots identified fire complexes and burn scars that covered 100 to 300 square miles or more (one fire burn scar measured a massive 30×70 miles). These events happened ‘off camera’ so there is no way to know if they also spawned very large fire tornadoes similar to the kind witnessed at Tetlin Ridge. What is clear from this fire and from fires across the Arctic this year and last is that the far north is burning like never before. As Russia’s eastern provinces experienced some of their worst flooding in 120 years, massive wildfires continued to burn even as the terrible rains and storm complexes advanced in an ominous Song of Flood and Fire. By now, the extent of Russian blazes has been somewhat lessened by these storms, although fire maps still show numerous active blazes.
A satellite picture of the blazing ridge-line on August 15 is given below. The fire is located in the center of the image and spans about 5×10 miles of the affected ridge line. You can also see the burn scars of previous wildfires in the lands surrounding the August 15-16 blaze.
Thawing permafrost, warming forests, Arctic heatwaves and more energetic storms combine to provide massive volumes of warming fuel and increasingly powerful ignition events in the Arctic. Not only can trees burn, but the organic carbon stored in permafrost and sometimes bottled up as methane beneath the surface also provides fuel. In many cases, fires have burned three feet deep into what was the permafrost bed below consuming roots, stumps and soil.
Very large and energetic fire outbreaks have been increasing throughout the Arctic with recent years seeing some of the worst fires on record.
Yesterday, tropical storm Trami churned through an abnormally hot Pacific Ocean toward an inevitable date with downpour over Taiwan and Southeastern China. There, a procession of tropical storms and monsoonal moisture had set off record floods which, by Tuesday, had resulted in the deaths of over 200 people. The now saturated region expects the arrival of Trami today, but not after the tropical monster, loaded with megatons of moisture, clashed with an already amped monsoonal flow to drench the Philippines as it emerged from a broiling Pacific Ocean.
Throughout the past month, an ocean heat dome had caused surface water temperatures to soar above 86 degrees Fahrenheit (30 degrees Celsius) over a vast swath of the Pacific Ocean just to the east of China and to the south of Japan and Korea. This powerful pool of latent Pacific heat was a major factor in the delivery of record heatwaves to China, Korea and Japan which resulted in thousands of hospitalizations and at least 100 lives lost. But yesterday, the heat and moisture rising off the Pacific would play its highly energetic part in an entirely different anomalous weather event — the inundation of the Philippine capital city of Manila.
Trami Collides with Monsoonal Flow to Produce Record Rainfall over Philippines
As Trami made her way over these hot and moisture rich waters, she grew in size until her cloud area covered a width of more than one thousand miles. Ocean temperatures soaring between 2 and 4 degrees (Fahrenheit) above average helped to pump its immense bulk full of moisture even as it became wrapped in a dense flow of monsoonal moisture proceeding from west to east off the continent.
By Monday, Trami was moving in from the east, lashing the Philippines with her dense, thunderstorm laden, spiral bands even as monsoonal storms came into collision with these bands from the west. The combination of a moisture rich tropical storm colliding with an equally rain dense monsoonal flow over a Philippines surrounded by anomalously hot water set off an extraordinarily intense rain event in which the capital of Manila was inundated by a powerful deluge.
Rainfall rates for this sprawling city hit a stunning 2 inches per hour and maintained that record shattering pace for almost twelve hours running. In total, more than 23.5 inches of rainfall was recorded at rain gauges across the capital. Many residents, whose homes were flooded in a rising rush of water, were forced to evacuate and initial reports indicate that at least 100,000 of Manila’s 12 million residents have now relocated to emergency shelters. So far, at least 8 deaths and millions of dollars in damages have been attributed to the storm. But with local levees and damns under threat of over-topping and collapse, the initial reports and estimates may just be the beginning.
Satellite and water vapor imagery taken on Tuesday showed rains continuing over the Philippines, albeit at a less intense rate, as Trami turned her great bulk of moisture northwestward toward the already soaked regions of Taiwan and southeastern China. Trami is expected to intensify into a category 1 Typhoon this afternoon and is likely to deliver severe rains and flooding to already soaked regions.
You can see Trami raking both Taiwan and the Philippines with massive and rain-dense cloud bands in the most recent NOAA water vapor imagery. In this image, the storm appears to intensify as it bears down on the already storm-soaked shores of China and Taiwan.
Conditions in Context
The Philippines is hit by a total of 20 tropical cyclones each year. So heavy rainfall and floods are a regular aspect of life there. However, the nearly 24 inches of rainfall during a 12 hour period experienced yesterday is unprecedented, breaking even a number of Manila’s very high record rainfall totals. The conditions that led to these records, just one year after another severe rainfall event, include anomalous heating of the Pacific Ocean under a powerful Ocean Heat Dome during late July and early August, a rather strong and thick monsoonal flow that has tended to meander a bit further north than is usual, and a very large tropical cyclone fed by both the anomalous heat and added moisture.
Climate research has shown that we can expect more intense rainfall events worldwide as the hydrological cycle increases by 6% with a .8 degree Celsius temperature rise. Similar research has found evidence of more frequent tropical cyclones as oceans warm and seasons in which hurricanes may develop continue to lengthen. This region of the Pacific Ocean, in particular, has shown an increasing number of cyclones as Earth has continued its human-driven warming trend, with temperatures increasing by .2 degrees Celsius per decade over the last 30 years. Since the vast Pacific Ocean forms a kind of moisture trap in this steamy region, it is likely the area will experience some of the worst flooding and storm effects coming down the pipe due to human-caused warming.
Trami’s expected delivery of powerful storms to China and Taiwan will also, unfortunately, probably not be the last for this season. Water temperatures are still stunningly high and moisture flows from both the Indian Ocean and the Pacific are likely to churn out many more storms before the tropical cyclone season ends months from now.
As a series of Arctic heatwaves baked large swaths of tundra to the point of wildfire eruption, the world entered its 341rst consecutive month of temperatures above the 20th Century average. According to reports from the National Climate Data Center, global average land and ocean temperatures were .61 degrees Celsius above 20th Century levels and about .81 degrees Celsius above the 1880s average. This temperature increase represents about 1/6th the difference between now and the last ice age, but on the side of hot.
NCDC analysis showed a majority of land and ocean surfaces experiencing hotter than average to much hotter than average conditions with numerous locations experiencing record warmest conditions. Only small and isolated regions experienced cooler than average conditions, with no areas experiencing record cold.
The near-record global heat occurred despite ENSO conditions in the Pacific Ocean remaining on the cool side of neutral with near-average sea surface temperatures across the central and east-central equatorial Pacific and below-average sea surface temperatures in the eastern equatorial Pacific. The cool water upwelling that continues over the eastern equatorial Pacific tends to depress global atmospheric temperatures by transferring heat content from the atmosphere to the sub-surface ocean. Such trends tend to dominate during negative phases of the Pacific Decadal Oscillation (PDO). These negative PDO periods are punctuated by numerous La Nina or cooler surface water conditions in the eastern equatorial Pacific. The Earth climate system has been in a negative PDO phase since the early 2000s, a phase which continues to this day. Despite the relative atmospheric cooling effects of this natural ocean circulation and temperature change, the decade of the 2000s was the hottest on record. Natural variability, which in this case would push for atmospheric cooling, had been overwhelmed by human-caused warming.
The dark side of a negative PDO is that it keeps the atmosphere relatively cooler at the expense of transferring more surface heat into the middle and deep oceans. Recent research conducted by Kevin Trenberth and others found just such a rapid heat transfer. The most ominous finding of the Trenberth study was that the deep ocean warmed the fastest over the most recent period of negative PDO, which showed that the ocean had a very effect means of rapidly transferring heat. A rapidly warming deep ocean is one more vulnerable to becoming stratified and anoxic — events that, in the past, have been implicated as causes for mass extinctions both in the ocean and on land.
We don’t currently know exactly when PDO will switch from a negative to a positive state. However, past PDO fluxes would indicate a switch is in the offing sometime during the next 2 to 17 years. Normal oscillations switch after remaining for periods of 15-30 years and the current negative phase has lasted for about 13 years. However, increasing atmospheric heat content may, ironically, drive the Pacific into an increasingly negative phase as it uptakes more and more of the atmospheric heat imbalance. Eventually, though, PDO will switch, dumping some of the excess heat back into the atmosphere. At that point, atmospheric warming rates will spike as more frequent La Ninas switch to more frequent El Ninos.
You can see the current state of ocean surface heat anomaly distribution with relatively cooler than average waters still dominating the region of the eastern equatorial Pacific in the map below:
ENSO has remained neutral since 2012 and is predicted to remain so as summer proceeds into fall. With human atmospheric GHG levels continuing to rise and to push atmospheric forcing levels higher and with Earth Systems starting to contribute larger volumes of CO2 and methane, especially from Arctic environments, it is possible that ENSO neutral years over the coming decade may experience record warmth. In any case, the next El Nino year will almost certainly break global records.
It is important to note that changes in PDO are not a negative or positive feedback human warming of the climate system. PDO is simply an element of natural variability. Unfortunately, most feedbacks, including albedo loss and Earth carbon feedbacks, under human warming will be positive. That said, a single powerful negative feedback may be in the offing over the medium to long term. And this involves large fresh water and iceberg releases from Greenland and West Antarctica. Called the iceberg cooling effect, this feedback response may hold some degree of human warming and Earth Systems feedback warming in check at the cost of a very rapid and destructive ice sheet destabilization and sea level rise occurring in conjunction with related extreme weather events (see Hansen paper below).
Overall, 2013 is the 6th hottest year on record for the January to July period, according to NCDC, despite somewhat cooler eastern Pacific waters continuing to uptake excess heat and dump it into the middle and deep oceans during this time-frame. A combined warmth at or near record ranges and ocean uptaking record volumes of atmospheric heat is not an indication of cooling or a global warming pause, as some climate change deniers have alleged. To the contrary, it is an indication of a planet warming at break-neck rates and beginning a very dangerous trend toward a number of damaging Earth changes. Mitigation, in the form of rapid GHG reduction, is sorely needed if we are to have much hope of blunting the force of these emerging changes.
It’s been yet one more summer of anomalous weather events resulting from human-caused warming. Massive floods have spanned the globe, shattering records that have stood for 50, 100, or even 500 years. In other regions, record droughts and heatwaves have resulted in thousands of heat injuries and hundreds of deaths with the southeast Asian heat dome alone reported to have hospitalized tens of thousands and resulted in at least 100 deaths in China, Japan and Korea. These droughts and heatwaves created hazardous water shortages putting communities from the American Southwest to Eastern China at risk of severe damage and loss of ability to supply growing water demands. They also sparked massive and freakish wildfire complexes that damaged or destroyed hundreds of buildings or left enormous burn scars over landscapes from tropical regions to the Arctic tundra — some of which have now born the excessive insults of major fires for ten years running. The term Arctic heatwave has become common parlance. And the combination of extreme weather has resulted in widespread damage to crops and related livestock industries.
All these extreme events, in concert, are visible proofs of a climate emergency that is just starting to ramp up. Few have received the attention they warrant in the mainstream press — either singly, or together as an overall dangerous alteration to the world’s climate and weather.
But of all these, rather ominous, events, one stands out as a warning of a new, out of context, threat — a set of freakish floods in the Himalayan highlands. Floods set off by a combination of high altitude rainfall and the collapse of damns formed around growing glacial melt lakes in a region undergoing very rapid melt and warming.
(Aftermath of Glacial Outburst Flood at Kedarnath, India)
Glacial Outburst Flooding in Kedarnath
Since the early 2000s, average temperatures in the Himalayan Mountains in northern India have increased by about 1 degree Celsius, around 4 times the global average. This steady temperature rise has resulted in a gradually increasing melt of the massive glaciers along this major mountain chain featuring the tallest peaks in the world.
Over the past decade, immense glaciers along this range have witnessed unprecedented melt with many glaciers losing up to 30% of their mass. Predictions show total melt for most glaciers likely to occur under current rates of warming and fossil fuel emission by around the end of this century. The massive and unprecedented rate of melt has fueled the formation of numerous very large and growing glacial melt lakes throughout the Himalayan region. So far, about 200 of these amazing 20,000 melt lakes have outburst in flood events that are a direct result of human caused warming and related glacial melt in the Himalayas.
One such melt lake developed and filled over the past few years in a region just 4 kilometers to the north of the Indian village of Kedarnath. It was just one of the hundreds of newly formed lakes that developed and steadily grew in size over the past five years. By June of 2013, the lake had filled to capacity. Its high altitude waters held back only by a thin damn of sediment pushed out by the now, mostly melted, glacier. Then came the rains.
In the days leading up to June 17, a massive rainfall event inundated the Kedarnath region, spilling waters into an already over-filled glacial melt lake north of Kedarnath. By June 17, a tipping point was reached and the sediment damn holding back the brimming glacial melt waters erupted, unleashing what amounted to a mountain tidal wave upon Kedarnath and a massive area stretching 40 miles downstream from the glacial outburst.
This immense flood swept away more than 6,000 people who are now presumed dead after one of the worst flood events in Indian history, an event that would almost certainly have never happened without human-caused warming.
“The Kedarnath floods may be only a small precursor to never-seen-before mega floods,” says Maharaj K. Pandit, director, Centre for Inter-disciplinary Studies of Mountain & Hill Environment, Delhi University. Scientists like him believe that the high precipitation on June 16 rapidly filled up Chorabari Tal, a glacial lake less than 4 km upstream from Kedarnath, and the continuing downpour the next morning caused the lake to overflow and possibly burst out from its loosely packed rim of moraines (glacial sediments).
Increasing Rainfall Over Himalayan Glaciers and Growing Risk of Megafloods
According to reports by Indian scientists, rainfall rates over the Himalayan mountain chain are increasing even as rates of snowfall events are falling. Overall, precipitation is increasing by 30 percent, but more and more of this greater volume of precipitation is coming down as rain. The rain provides a double stress to glaciers in that it delivers more heat to already rapidly melting ice masses and the added run-off creates large pulses that both erode ice sheets and sediment deposits that keep both ice and water locked in. Eventually, water erosion and heat stress is too great, melt rates are too high and sediment and ice damns can no longer hold. The result is a massive and very dangerous flood event called a Glacial Outburst Flood (GLOF).
The Himalayans have seen increasingly severe GLOFS since 1929 when the first major such event emerged. Overall, 200 GLOFS have inundated various regions surrounding the Himalayans with major resultant damage to infrastructure and loss of human life. But with hundreds of new lakes forming over the past five years and with rates of glacial melt spiking, the risk for increasingly catastrophic GLOFS is growing.
As noted above, there are currently 20,000 large melt lakes throughout the Himalayan chain and, with temperatures in the region expected to increase by another 1-2 degrees Celsius before 2050, the number and size of glacial melt lakes is bound to grow. More rainfall will occur at higher and higher elevations, pushing glacial melt lake levels higher and higher. In the end, millions of downstream residents are at increasing risk of Glacial Outburst Floods.
With human climate change pushing warming at such a rapid and unprecedented rate, it is only a matter of time before more of these amazingly dangerous events take place. Global carbon emissions hit a new high in 2012 and a start to global greenhouse gas reductions, without serious and immediate global policy measures, is years to decades away. So it is highly likely that risks for large GLOFS will continue to increase in India and in other nations bordering the Himalayan mountain chain.
Stark Implications for Greenland, West Antarctica
Anywhere in the world where major ice sheets and glaciers exist, the threat of large Glacial Outburst Floods is growing. Perhaps the starkest manifestation of this risk is visible upon the now, rapidly melting, ice sheet of Greenland.
But with very rapid melt starting to occur now, it is likely that we are already at the point of large-scale destabilization of the Greenland ice sheet even as we stare down the face of setting in place a total melt scenario over the next few decades (setting off a chain of chaotic events that would likely take centuries to complete). With temperatures continuing to rise over Greenland and with human greenhouse gas forcing and Earth System feedbacks also on the increase, it is highly likely that pace of ice sheet destabilization will continue to accelerate.
The problem with Greenland melt, however, is in many ways far worse than the melt of the massive, though comparatively smaller, Himalayan Glaciers. The Greenland ice sheet is entirely contiguous and has massive depth and a towering elevation of two miles at its center. Glacial Outburst Flood events from such a large source will, therefore, be far, far more catastrophic.
In the Greenland melt dynamic, multiple glacial melt lakes will increasingly form over the surface of the Greenland ice sheet. We can already see such events beginning during current summers. The above shot provided by NASA shows numerous melt lakes forming in the western border of the Greenland Ice Sheet on August 4 of 2013. These melt lakes are many times larger than those seen in the Himalayas with some of them stretching six kilometers in length. In the future, we can expect the size and number of the glacial melt lakes to greatly increase.
Risk of a Greenland Megaflood Arises
With such a large region of ice covered by numerous melt lakes, a kind of ominous tipping point may be reached. During warm summer months, weather systems may pull warmth and moisture over a large section of the Greenland Ice Sheet which is already covered with numerous melt ponds. Temperatures above freezing and a constant flow of moisture emerging from the southern latitudes through a locked in place Jet Stream pattern may ensure that the rain event over these Greenland melt lakes lasts for days or weeks.
Eventually, some of these melt lakes begin to over-top, spilling waters into the already filled lakes lower down on the ice sheet. These lakes then also over-top, contributing ever greater volumes of water to the growing flood.
Depending on how far melt lakes penetrate into the ice sheet, this chain reaction over-topping can proceed for tens or even hundreds of kilometers. By the time the massive flood has reached the lower ice sheet edge, perhaps a kilometer or more below the initial flood source, a massive glacier-originating wave has developed, one that is, perhaps, tens or hundreds of feet in height and with a front covering tens or even hundreds of miles.
Such a powerful outburst megaflood would contain both freezing water and large fragments of ice ripped from the ice sheet as the outburst wave proceeded down the ice sheet. And, like the Kedarnath megaflood, it will also likely contain boulders pulled from adjacent mountains and lands. But this particular event would be far, far worse than any Himalayan outburst flood. It would proceed for hundreds and, perhaps, thousands of miles from the outburst site, leaving a swath of destruction similar to that seen in the worst global ocean tsunami events of recent years.
Melt Lakes Forming Among Terrace-Like Structures on the Greenland Ice Sheet. Set up for Future Large Outburst Megaflood?
We see evidence of such events occurring at the end of the last ice age, with petrified trees imbedded in rock strata up to 500 feet above sea level in the cliffs and mountainsides of Pacific Islands bordering the Arctic. It is thought that these trees were carried by massive glacial outburst floods from the melting Laurentide Ice Sheet which, at the end of the last Ice Age, was thousands of miles away from this tree deposition. The trees found in these deposits are natives to Canada and Alaska and the character of their deposition is indicative of a catastrophic outburst flood event or series of events.
Glacial Outburst Megafloods are among the most dangerous risks posed by rapid Greenland and West Antarctic Ice Sheet melting, warming and destabilization. And Greenland is most likely to see its first manifestations, though Antarctica may follow soon after, over the course of years or decades. Such ice sheet decline will be both chaotic and destructive — with moments of almost unthinkable outburst events proceeding once certain tipping points are reached. Some of these events may already be locked in due to current human forcing and related natural feedbacks. Let us hope that it is possible to prevent their very worst manifestations.
Greenland Outburst Flood of 2012 to be Seen as Minor by Comparison
Should such events occur, a massive outflow of water near the Greenland Ice Sheet during 2012 that washed out a bridge and threatened a local airport will be seen as minor. For comparison, I’ve added the following video:
A major outburst flood issuing from a large section of the Greenland ice sheet would render miniscule even this, very energetic event.
Perhaps the most hotly debated topic among climate scientists, when they are not facing off with the ignorance of underhanded climate change deniers, is the potential rate of Earth Systems response to human caused climate change. In general, the low hanging fruit of climate research is a more easy to puzzle out pace of likely warming due to the direct forcing of human greenhouse gas and CO2 emissions and the more rapid climate feedback coming from increasing water vapor due to increased evaporation. But higher up the tree hang the critical fruits of pace of albedo change and pace of carbon response as the Earth System warms. Understanding these two will provide a much greater clarity to the question of a long term rate of warming given a doubling of atmospheric CO2.
Paleoclimate, Paleoclimate, and Paleoclimate
Perhaps the best way to test the accuracy of our long-term Earth Systems global warming and climate models is to use temperature proxy data from past ages in Earth’s history. And, based on these proxy measures, we find that the long term warming from each doubling of CO2 is at least 6 degrees Celsius. Though the proxies are not perfect, they are in general agreement on a range of potentials averaging near this figure. And these measurements can provide some confidence that the total long-term warming from a doubling of CO2 is at least twice that caused by a CO2 increase and the related water vapor rise alone.
More accurate measures closer to the current day are even less reassuring. Looking at the ice-age and interglacial transitions over the last 500,000 years, we find that a very small forcing provided by orbital changes, resulting in a global increase in solar insolation of about .5 Watts per meter squared combined with changes in the angle at which sunlight hits the Earth (Milankovitch Cycles), is enough to, over the long term, increase CO2 levels by 100 ppm (from 180 to about 280), increase methane levels by about 300 parts per billion (ppb) and (here’s the stunning kicker) raise world temperatures by a whopping 5 degrees Celsius globally and 13 degrees Celsius at the poles.
A Human Forcing Six Times Greater Than That Which Ended the Last Ice Age
It should be a serious concern to climate scientists that the initial forcing of just .5 Watts per meter squared resulted in a relatively moderate 100 ppm CO2 and 300 ppb methane response which then combined to force temperatures radically higher. By comparison, the current human emission of 120 ppm CO2 and 1100 ppb CH4 (methane) and rising, combine with other human greenhouse gasses such as Nitrous Oxide, Tropospheric Ozone (human emission), Clorofluorocarbons and Halons to provide an initial forcing of fully 3 Watts per meter squared or about 6 times the total forcing that resulted in the last ice age’s end and ultimately set in place feedbacks that pushed global temperatures 5 degrees hotter (Data source: Recent Greenhouse Gas Concentrations).
Earth’s Own Carbon Stocks are Vast
So why was so small an initial solar forcing enough to end an ice age and, ultimately warm the poles by 13 degrees (C) and the globe by 5 degrees C and what does this mean when the human forcing is now at least six times greater?
In short, the Earth holds vast stores of carbon in the form of CO2 in its oceans, organic carbon in its tundra and frozen beneath land ice, and in very large stores of methane hydrates on the sea bed. Any forcing that is large or occurs over a very long period of time will act continuously on these sources, pushing more and more of the carbon out until all of the stores newly exposed to that forcing are emitted, the feedback warming kicks in, Earth albedo changes as ice sheets respond (also a source of additional heat), and Earth gradually reaches a new energy equilibrium state.
In the current day, melting tundra (both land and ocean) in the Northern Hemisphere holds about 1,500 gigatons of carbon (NSIDC), the oceans contain between 2,000 and 14,000 gigatons of methane hydrate (USGS), and these same oceans hold about 1,000 gigatons of carbon (CO2) in solution near the surface and 38,000 gigatons of carbon near the sea floor (University of New Hampshire: Global Carbon Pools/Fluxes).
USGS Methane Hydrate
Melting tundra releases its carbon stores as CO2 in an aerobic/oxygen environment and as methane in an anaerobic and anoxic environment. Thawing methane hydrates release methane into the oceans of which some enters the atmosphere. And warming oceans eventually are unable to uptake a rising level of atmospheric CO2 and, in extreme cases, begin emitting CO2 back into the atmosphere.
When compared to the gentle, though long term, nudge to the Earth’s carbon stocks generated by orbital changes and a slight increase in solar insolation that ended the last ice age, the human forcing equates to a very great and rude shove. And if that much more gentle nudge was enough to liberate 100 ppm and 300 ppb of methane from the Earth system into the Earth’s atmosphere, then how much will the now much faster and harsher human forcing put at risk of liberation?
Methane Release Sources in the Arctic
That human greenhouse gas emissions are rapidly warming the Earth at a rate of about .2 degrees Celsius per decade and that carbon emissions from the Earth environment are likely to increasingly result from this rapid and rising rate of warming is a given. At issue is how fast and powerful an Earth systems response will be. And one critical issue in understanding the speed of this potential response is rate of methane release (CO2 release is another issue that will be explored in another blog).
Methane is a very powerful greenhouse gas. Over twenty years time, it estimated to produce about 105 times the forcing of a similar volume of CO2 (this value is estimated to be about 25 times a similar volume of CO2 over 100 years time). So large pulses of this gas could result in a doubling or more of the total greenhouse gas forcing already acting on the Earth system. Such catastrophic releases are hypothesized to have acted during other periods of rapid warming such as during the PETM and Permian hyperthermals.
The above, admittedly lengthy preamble, is needed to give context to this specific issue: potentially large methane releases as a result of Arctic warming and a number of related release mechanisms that may increasingly come into play. However, before we drill down to mechanisms, let’s look at the disposition of potential Arctic methane sources to give us a basis for our degree of concern.
Thawing Arctic Permafrost, as mentioned above, provides a source of 1,500 gigatons of carbon, some of which will be released as methane as it melts to liberate its carbon stores to surface, subterranean, and subsea environments. Some of this permafrost is land-based, some of it is submerged, as on the East Siberian Arctic shelf. As the permafrost thaws, decay and release of this carbon into the atmosphere is likely to gradually build, providing a growing pool of both methane and carbon emissions. That said, a climate change establishes a number of environmental mechanisms created that are likely to result in greater and greater volumes of this store being released over time. These mechanisms may push methane in a slow and gradual way. But, as we proceed down the dangerous path of rapid human-caused warming, there is increasing danger of large, sudden releases.
In addition, the same expanding set of environmental changes could result in a higher percentage of this vast store being emitted as methane.
Stable Sea Bed Clathrates represent an unknown portion that is likely a majority of the estimated 500-2,000 gigatons of methane hydrates in the Arctic environment. These clathrates compose methane locked in ice lattice structures that occur around 200 meters below the sea bed. Release of these clathrates requires a heat forcing to not only penetrate into the ocean waters, but for it to also reach the clathrates below hundreds of feet of rock and mud. Once the clathrates are disassociated, they must travel through cracks in the rocks and mud, and then through the water column to reach the ocean surface and the atmosphere. On the way, some of the liberated methane dissolves in sea water and another portion is taken in by methane eating organisms. If the pulse is strong enough, the ocean water saturated enough, and the methane eating organisms sparse enough, a greater portion of this released methane will reach the surface.
Ice Age Relics are clathrates that have formed as shallow as 20 meters beneath the sea floor. They are thought to have formed under the glacial cold that encased the Arctic over the last 2 million years and that occurred with particular intensity over the last 800,000 years. These ice age depositions are particularly vulnerable to more rapid release and their expansion during the last glacial period results in a set of carbon stocks that are very vulnerable to rapid emission. In this case, we find yet one more reason why a rapid rise out of a period of glaciation is a rather dangerous climate circumstance. The deposition of carbon stores are placed in regions more vulnerable to thaw and release once warming is underway.
In sum, these three represent a majority of potential methane release sources.
Rumors of Fire: The East Siberian Arctic Shelf Emission
(Please ignore the cheesy intro music and proceed on to the interview)
During the 1990s, researchers noticed a methane overburden in atmospheric regions around the Arctic Circle. This overburden was seen as an indication that large local methane emissions were occurring in the Arctic. Subsequent research found methane emissions from thawing Arctic tundra, from melt lakes and from peat bogs. In addition a large emission source was identified in the Arctic Ocean.
As of 2010, reports were coming in from the Arctic that the East Siberian Arctic Shelf was emitting more methane than the entire Earth ocean system combined. By 2011, an expedition to the Arctic found methane emission sources more than 1 kilometer across over the same region of submerged permafrost. By 2012, expeditions could no longer be conducted on the ice surface in the region of the East Siberian Arctic Shelf due to the fact that the sea ice there had become too thin and unstable to support research equipment.
Dr. Natalia Shakhova and Dr. Igor Similetov found that the permafrost cap over the shallow East Siberian Arctic Shelf seabed had become perforated. The cap locks a very large volume of methane, estimated to be about 500 gigatons, under constant cold and pressure. As the cap perforates, the cold and pressure release and increasing volumes of methane shoot up from the sea bed saturating the water with methane with some of the methane releasing to the surface.
Shakhova and Similetov warn that 1 percent or more of this methane could release over the course of decades as the sea ice continues to erode in the region of the East Siberian Arctic Shelf and the undersea permafrost continues to perforate. Just a 1 percent release would be enough to double the amount of methane in the Earth’s atmosphere, resulting in a .5 watt per meter squared forcing from an ESAS release alone. The researchers also identify the potential for a much larger, 50 gigaton release, which would more than double the current human GHG forcing over the course of just a few decades.
Such a large potential release was the subject of a much-debated Nature article by Peter Wadhams (read more here). And it was this article that raised the question of potential mechanisms that could result in such large releases of methane from the Arctic in the coming years.
The Arctic Under Heat: Ever More Powerful Mechanisms For Release
In examining potential release methane release mechanisms we will start with those currently acting on the East Siberian Arctic Shelf and work our way outward to the greater Arctic environment. It is worth noting that a paper by Carolyn Ruppel recently refuted Shakhova and Similetov’s findings, but that the Ruppel paper did not study the region of the East Siberian Arctic Shelf in question, only a related area of the Beaufort Sea which has not been found to currently show large, powerful, or widespread methane hydrate release.
East Siberian Sea
(Image source: Commons)
Taking the Ice Lid off of a Shallow Sea. In the case of the East Siberian Arctic Shelf, rapidly warming air and ocean combine with rapidly retreating sea ice to create what seems to be a powerful and concerning release mechanism. The East Siberian Arctic Shelf is a 2 million square kilometer region that composes some of the Arctic’s densest carbon stores. It represents about 1/5 the Arctic Ocean area and is thought to contain about 500 gigatons of shallow sea bed methane hydrates. Over the past few decades, this region has warmed very rapidly, at the rate of about .5 degrees Celsius every ten years. This warming, at about 2.5 times the global rate, has resulted in a very rapid weakening and retreat of sea ice from the surface waters of a shallow sea that is, on average, about 50 meters deep. In recent years, summer sea ice has almost completely retreated from the ESAS, leaving a dark ocean surface to absorb sunlight and to rapidly warm. Measurements from the region show that water temperatures have increased by as much as 7 degrees Celsius above average once the sea ice pulls away. With the ice now gone, surface winds provide great mobility and mixing of the water column, this results in much of the surface water heating being transported down to the seabed. It also draws methane rich waters up from below where they can contact the air and release some of the water-stored methane.
Shakhova and Simeletov have observed perforations of the subsea permafrost releasing large volumes of methane from the East Siberian Arctic Shelf since 2008 and, as noted above, many of the hydrates stored beneath this permafrost cap are far shallower than is typical for a normal ocean seabed due to the fact that they are ice age relics. This combination of mechanisms provides the greatest current risk for rapid methane release. However, a number of other mechanisms are increasingly coming into play that may add to the, already concerning set of risks for rapid ESAS methane release.
Melting Tundra, Hot Lakes and Arctic Wildfires. NSIDC has identified about 1,500 gigatons of organic carbon locked in tundra systems throughout the Arctic. As the Arctic is forced to rapidly warm, larger and larger portions of this vast carbon store begin to thaw. Once the tundra melts, this carbon is subject to breakdown and action by microbes. This process of decay releases CO2 in dry environments and methane in wet, anoxic environments. Much of the tundra melt is subterranean. As such, this tundra melt is locked away in moist pockets that have little access to airflow. These pockets are at risk of being broken down into methane by anaerobic microbes. In some sections, tundra collapses and fills with water to form melt lakes. These lakes contact the anaerobic melt regions and create their own anaerobic bottom systems for carbon breakdown and release. Many of these lakes are so hot with methane that they provide emissions with high enough concentration to burn.
As the Arctic experiences more and more heatwaves, a far greater expanse of this extreme northern region is subject to wildfires. These fires are increasingly found to have burned deep into the soil. Reports from the Arctic find that fires have incinerated as many as 50% of the stumps of trees in a wildfire zone and consumed the carbon rich soil to a layer as deep as 3 feet below the surface. The action of wildfires further breaks open the soil and tundra cap providing passages to release any methane stored in anaerobic pockets beneath.
With these tundra regions composing so large a volume of carbon and with these areas being subject to increasingly rapid melting and increasingly energetic wildfires, larger and larger methane releases are entirely likely.
Ocean Warming, Anoxia, and the Fresh Water Wedge. As the years and decades progress and Arctic sea ice becomes more scarce, there is an increasing risk of large freshwater melt pulses from Greenland to combine with a warming Arctic Ocean to further amplify methane release. With the increasing removal of sea ice, Arctic Ocean temperatures surge, spreading a wider and wider area of heat forcing deeper and deeper into the water column and, eventually, into the seabed itself.
Some of this warming is visible in climate models projecting temperature and precipitation change throughout the Arctic over coming decades:
Projected temperature and precipitation change above the Arctic Circle.
A warmer Arctic Ocean is a less oxygen rich environment. The heat reduces the oxygen in solution, creating more anaerobic environments for organic carbon to break down as methane. Warmth also creates a greater sea-bed forcing for spontaneous and long-term release of methane hydrates.
As the seas surrounding Greenland warm and the Greenland environment takes in more of this latent heat, Greenland melt rates will continue to increase. The large fresh water pulses from Greenland will push the Gulf Stream further and further south, reducing the mixing of seawater in and near the Arctic, further reducing oxygen levels. These pulses will also act as a wedge, forcing warmer, saltier waters to dive down toward the ocean bottom as a fresh water cap expands from the Arctic Ocean southward (see Does Fresh Water Runoff Change Ocean Circulation to Unlock Deepwater Hydrates?). This mechanism will create a cool surface, hot depths ocean environment for the Arctic Ocean and northern latitude regions surrounding it. Additional fresh water is likely to come from the continents as rates of precipitation increase, further adding to the fresh water cap and the creation of a growing region of stratified ocean with cooler, fresh water at the surface and a growing pool of warmer water below.
Unfortunately, large freshwater additions from melting snowcover and increasingly severe rainfall events, like the massive Yakutia floods have already resulted in changes to Arctic Ocean circulation, creating a large freshwater cap near the Beaufort and resulting in the risk of fresh water pulses entering the Pacific Ocean. A NASA animation shows how these changes are already ongoing:
Thus we have three factors acting in concert to increase methane release. First, sea ice retreats to warm the Arctic Ocean. Second, increasing freshwater inflows divert the warmer waters toward the ocean bottom. Third, the warmer waters are less oxygen rich, creating more anoxic environments for anaerobic bacteria to break down organic carbon from thawing permafrost into methane. These anaerobes will receive plenty of nutrients from the waters washing off of glaciers and continents and will likely create great blooms over large areas as seas continue to warm. These combined forcing mechanisms will likely destabilize the weakest methane hydrate reserves first even as the anaerobes go to work on the newly liberated organic carbon.
Sea Level Rise Floods Large Regions of Tundra. A final mechanism for methane release is the rise of a less oxygenated Arctic Ocean to flood large sections of coastal tundra in Siberia, putting it under water and in an oxygen poor environment in which anaerobic bacteria can act to convert organic carbon into methane. A wide swath of coastal Siberia is low lying and, in some cases, is vulnerable to sea level rise for tens or even hundreds of kilometers inland. Over the years, larger sections of this region will be claimed by the sea, adding their carbon stores to an oxygen poor ocean bottom region.
Together, a rapidly destabilizing ESAS, a rapidly retreating ice sheet, increasing Arctic Ocean anoxia, increasing fresh water runoff into the Arctic Ocean, numerous anoxic environments within tundra thaw regions, increasingly energetic wildfires, expanding regions of stratified waters with hot ocean bottoms and cooler ocean surfaces, and seas rising to flood areas of thawing tundra provide sufficient and numerous mechanisms to be seriously concerned about Arctic methane release as an amplifier and potential multiplier to human caused warming.
“It is a unique situation in the sense that it has spread over more than 2,000 kilometers if one looks from west to east, while its depth or width is more than 500 kilometers,” Vladimir Stepanov, head of the National Crisis Management Center of the Emergency Ministry, told a news conference in Moscow.
According to the report, hundreds of villages in this, thankfully, sparsely populated region have been inundated by water putting hundreds of thousands of people in amongst a swirling flood. According to reports from Russian government, the region is now the site of a massive and major rescue operation. As of August 11, the operation composed an army of 20,000 personnel — a force that is likely to have greatly swelled as this major climate disaster expanded through today.
Floods turn Amur Region of Russia into a Sea on August 14.
In the above image, we are looking down on the Earth from a shot taken above the North Pole. The region we are looking at is Siberian Russia and Yakutia which dominates the central section of the image. Toward the lower left are the Laptev and East Siberian sections of the Arctic Ocean. Toward the central and upper left is Eastern Russia (Kamchatka), Mongolia, and extreme north China. In the upper right corner is central Asia.
Note the very dense region of clouds and rain pulsing up from the Pacific Ocean and overlaying Kamchatka and southern Yakutia. The storm at this point is vast and its cloud coverage immense. But it is just getting started.
Russia August 7 — Low Pressure Emerges From Central Asia
By August 7, the storms had sagged toward the south, drifting slowly eastward along the monsoonal flow. Occasional pulses of moisture rose northward from the Pacific to refresh and intensify this storm and cloud flux. This action brought the Pacific and monsoonal storms in direct contact with a hungry low pressure system rising up out of Central Asia and moving from the southwest toward the northeast. By August 7 we can begin to see this storm system entraining the massive volume of moisture associated with the Pacific storm pulse and monsoonal flows.
The storm was emerging over a region of Yakutia that had experienced a massive and terrifying explosion of very energetic wildfires. The air was heavily laden with particles of dense smoke from a great burning that had intensified since late July. There the moisture erupted into a powerful deluge that by August 11th had broken flood records set as far back as 1896. By that time, more than 20,000 personnel had been mobilized to help deal with the floods as hundreds of homes and scores of roadways were inundated.
Russia August 11 — Deluge Fully Formed Over Yakutia
As of August 11, we see a massive and fully formed storm complex directly over Yakutia. The storm has now fully entrained the dense smoke cover belched out by the hundreds of fires, some of which were still burning throughout the region. It was also still drawing in moisture from the Pacific storms and monsoonal flow over south Russia, Mongolia and northern China. A second arm of the storm stretched northward linking the storm with the Arctic. With a strong south and north linkage, the storm had accessed energy to maintain strength and intensity for an extended period.
The large storm system continued to churn through Yakutia and by today, August 14th, a massive region covering 1 million square kilometers was inundated by floodwater. What we see in the satellite shot for today are not one, not two, not three, but four rivers of moisture linking the major storm system that has inundated Yakutia.
The first river of moisture is a continuation of the Pacific flow rising up along the southeast Russian coast, the second is the monsoonal flow moving from west to east to combine with this Pacific flow. A third flow feeds into the storm from Europe as it rides along parallel and to the north of the more southerly monsoonal flow. A final river of moisture rides up the from the storm, linking it to the Arctic and likely sharing energy and instability with that cold and dynamic region.
With a second low developing to the west of the first and moving along in its shadow and with moisture continuing to feed into these storm systems from the monsoonal flow to the south, it appears that rainy conditions will persist for the already inundated Yakutia region over the next few days at least. And if this pattern continues as predicted, it may well come to rival the great Pakistani floods of 2010.
Fires Still Burn Near the Flooded Lands
One, rather odd, feature of this major flood and fire event is that large areas of wildfires are shown to still be burning throughout Russia. Though the onrushing deluge clearly put out some of the major fires burning in north and central Yakutia, still other major fire complexes continue to burn — some of which remain very near to flooded regions.
In the below MODIS shot a major fire complex is still visible in a region of Russia to the west and south of areas most heavily affected by flooding:
Fires Burn in One Part of Russia as Another Part Floods.
These fires are burning directly in the shadow of the second storm system with their smoke trails feeding into the storm along its southerly inflow.
Conditions in Context
Earlier this year, drought and heatwaves blanketed Siberia and Yakutia. But late July, this region had begun to erupt in a series of extraordinary wildfires that blanketed almost all of northern and eastern Russia in very dense smoke. By early August what is perhaps the worst rainstorm in the history of this area of Russia had begun to form. As of the writing of this article, on August 14, major storms and flooding continued with no immediate end in sight.
Major heatwaves and droughts in extreme northerly regions of Siberia are an anomalous event linked to human caused climate change. Rapid sea ice and snow cover retreat combine with temperatures that are warming at a rate of .5 degrees C each decade over this region to increase the likelihood of such extreme events. Methane and organic carbon stores in the thawing tundra steadily release under this heat forcing and likely provide an amplifying feedback to summer heating events by locally providing more greenhouse gas emission and also providing another fuel store that is available to wildfires. In some of these wildfires, there are reports coming in that fires burn as far as 3 feet into the ground, taking out root systems and stumps along with the trees that burn above ground. Reports of burning ground have also been trickling in (Hat tip to Colorado Bob)
Such burn events are anomalous enough. But for a flood that covers a 1 million square kilometer area to immediately follow in the wake of such amazingly large and widespread fires is anything but normal. Atmospheric patterns that link major weather systems and increase their intensity can be attributed to the formation of powerful heat dome high pressure systems along with weakened and meandering Jet Stream waves. Rising atmospheric heat caused by human warming adds to the density and strength of heat domes (identified as becoming more intense by meteorologist Stu Ostro). Meanwhile erosion of the Jet Stream caused by reduced snow and sea ice cover (identified by Dr. Jennifer Francis) is implicated in a host of problems including more intense and persistent droughts and storm events along with the increased likelihood that weather systems will link up as north to south weather patterns deepen, back up, slow down, and elongate.
A massive ocean heat dome to the south over the Pacific adjacent to China and sea ice and snow cover remaining near record lows must be taken into account when looking at features that likely contributed to the extreme swings from drought, heatwave and fire to massive deluge and flood in Russia.
One last point to consider as a likely contributor is the fact that for each degree (Celsius) of human-caused temperature change, the hydrological cycle amplifies by about 8 percent. This means that rates of evaporation and rainfall are now about 6 percent more intense than they would be in the world of the 1880s. When combined with powerful new weather features like a mangled Jet Stream and immense heat dome high pressure systems, an amped up hydrological cycle further inflates an already extreme environmental condition.
UPDATE: LARGEST FLOOD IN RUSSIAN HISTORY
Reports from the Russian government indicate the region hardest hit stretches from lake Baikal to the Pacific Ocean with some towns in far eastern Russia along the Amur River under as much as 20 feet (6 meters) of water. Reports as recent as yesterday indicated that a total of 113 towns were experiencing major flooding and that an additional 100,000 residents may need to be evacuated.
As of today monsoonal flows and a large moisture pulse rising off of the Pacific Ocean along the back side of a powerful heat dome high pressure system continue to dump copious rains over the region.
Russian officials have stated that this event represents the largest flood in Russia’s history.
I’ve provided a MODIS shot of the hardest hit area under dense cloud cover on August 17:
Russia and China Flooding: Lake Baikal to Pacific Ocean
In the southeast this year, rain follows rain follows rain. Now a tropical system may be preparing to add its own moisture to the already very wet mix.
The river of upper level airflow called the Jet Stream begins an almost due south movement at the Arctic Circle near the Northwest Territory and Canadian Arctic Archipelago. The atmospheric river dives down over Central Canada and into the Great Lakes region. Continuing ever southward, it finally encounters a wall of warmer air setting up near the south Tennessee border where it speeds up and turns eastward, joining another Jet Stream flow coming in over the Rockies.
Riding along these convergent Arctic and Pacific Jet Stream flows are a number of wet and stormy impulses. Because this deep north to south dip has been in place over the Eastern and Central US for much of the summer, storm after storm has continued to impact a large region from Missouri to New Jersey southward through the Carolinas and then again southwestward along through Georgia and the Gulf Coast states. This persistent stormy pattern, a result of a slow, wavy, stuck Jet Stream, which is, in turn, caused by sea ice and snowfall loss in the Arctic, has pushed rainfall totals 20 inches or more above the yearly normal in some locations. It has delivered extraordinarily moist storms that dump inches of rainfall in just a few hours. And it resulted in some regions of Missouri receiving four months worth of rainfall in just one week.
In the above water vapor image, provided by NOAA, you can see the storms riding along the south frontal boundary of this Jet Stream trough through the Dakotas, Montana, Nebraska and Colorado then down into Texas, turning eastward through the Gulf Coast States and then surging north along the US East Coast.
Yesterday, this pattern delivered a powerful storm complex to Pennsylvania and New Jersey — flooding roads, knocking out power and dumping as much as six inches of rain. Now, the Jet Stream has driven further south, pushing the frontal boundary over the Gulf Coast and US Southeast.
But as if the convergent flows of the Jet Stream delivering very powerful storms, as if the stuck weather pattern keeping this storm-delivering trough over the Eastern US for months, and as if the human-added atmospheric heat amping up the hydrological cycle and spurring more intense rain events were all not enough, we now have a large, moist tropical weather system moving in and threatening to become entangled in an already very wet pattern.
As of this morning, the National Hurricane Center had issued an advisory for a tropical system in the western Caribbean predicting a 60% likelihood of tropical storm formation over the next several days. The system is a large, sprawling and disorganized mass of thunderstorms and moisture moving toward the north-west at 10 to 15 mph. A circulation appears to be trying to form in a region near the densest thunderstorms. The system is predicted to move toward the northwest until it is eventually captured by the frontal boundary at the leading edge of our deeply sagging Jet Stream. Should this mix-up occur, a tropical weather system and potential tropical cyclone will have again combined with an Arctic originating air-mass over the Eastern US, setting the stage for a rather intense and widespread rainfall event.
If there are some reading this analysis and thinking that it rhymes somewhat with set up for Superstorm Sandy, they wouldn’t be entirely off the mark. Until recently, it was less likely that tropical systems would combine with polar originating air masses over the US. The troughs originated and faded rapidly, only infrequently coming into dramatic collisions. But now, with the Jet Stream increasingly settling into a stuck pattern (spurred by human caused warming and sea ice loss) and seeming to favor trough development over the continental US and not over the ocean, such collisions are far more likely.
With the current system, unlike Sandy, rain appears to be the primary concern for now — not storm hybridization, expansion, and superstorm development. These are not on the radar. But we are still very early in storm development and we don’t yet know how powerful the slowly organizing tropical system will become. What we have right now is a large, and potentially strengthening package of tropical moisture setting its sights on an already soaked US southeast.
Very Moist Developing Cyclone Setting Sights on Southeastern US.
So the risks at the moment are for a potential major flooding event on the five to seven day horizon as the tropical system continues to track northwestward until it is pulled into the stormy flow of the Jet Stream trough. At that point, it is predicted to dump a heavy load of moisture and rain over the US southeast.
Current predictions from NOAA reflect uncertainty in storm development and track and, at the moment, call for 3-5 inches of rainfall from the Gulf Coast States through Georgia and the Carolinas over the next 5-7 days. Local amounts, however, could be much higher, on the order of 8 inches or more. Such an event would intensify an already severe flood problem over this large area, likely resulting in major and widespread flooding.
Any significant wind field of 40 mph or more would also likely result in a mass of fallen trees. The ground in this region is saturated with moisture, making it harder for tree root systems to grip the soil. So it takes much less wind to blow them down. Widespread power outages due to trees falling over power lines is, therefore, also a potential threat for this system.
Given the current position of the Jet Stream and uncertainty over potential storm strength and track, this situation could rapidly develop into a dangerous event for the southeastern US or we could end up with a storm system making landfall closer to Texas and Mexico. So we’ll be closely watching storm strength and path over the coming week.
UPDATE:
Tropical weather system 92 L is starting to exhibit some cyclonic turning:
According to recent reports from NOAA and the CDC, heat is the most lethal form of weather in the United States. Death and injury rates have been on the rise as human-forced temperature increases have expanded, surging northward into major metro areas such as New York City. The CDC report showed a growing number of heat deaths and injuries for this northern region, with the New York Metro area seeing an average of 13 deaths and over 440 heat injuries each year during the period from 2000 to 2011. Nationwide, the average number of heat fatalities surged to 117 during a period from 2003 to 2011.
Heatwaves have hit the NYC region time and time again over the past decade, driving the death and injury rate inexorably higher. However, the heat impacting that area is paltry when compared to the extreme and deadly temperatures that have broiled southeastern China since late July. For more than three weeks, the Shanghai region of China has experienced almost daily temperatures in excess of 100 degrees Fahrenheit and sweltered under very high humidity for such hot conditions. This combination has pushed wet bulb temperatures (a measure that simulates the temperature of human skin) into a range of 29 to 32 degrees Celsius, very close to the lethal human limit of 35 degrees C.
On Sunday, an extreme heat pulse sent thermometers soaring to 109 degrees Fahrenheit in the city of Shengxian — its hottest temperature ever recorded and a scorching 32.3 degree wet bulb temperature. Meanwhile, on the same day, Hangzhou had hit a new all time record high temperature of 105.8 degrees Fahrenheit, the twelfth time since July 24th that Hangzhou has tied or broken its old all time temperature record which, in some cases, was set just the day before.
High heat and humidity of this kind is deadly to humans because as temperatures approach 35 degree C wet bulb readings, it is nearly impossible for the human body to carry away the excess heat it generates through evaporation. Never has a wet bulb temperature of 35 degrees C been recorded by humans. However, climate scientists such as James Hansen have asserted that it’s just a matter of time under the current regime of human-caused warming before we hit that ominous mark.
So have thousands died?
Road Sign Burns Under Record Heat in Shanghai Region
As reports of vehicle fires and sporadically smoldering infrastructure in the massive Chinese heatwave flared, suspicions emerged that Chinese officials are covering up what are potentially thousands of heat-related deaths.
According to Chinese news agencies, the official report is that about two dozen have died so far in Shanghai’s record-shattering heatwave. But similar heat in Europe and Russia resulted in tens of thousands of deaths over the past decade. At issue is the fact that China’s current record heat and humidity are at levels never before experienced in its weather history and that this event is even more intense than the deadly heatwaves of Europe and Russia. Add to this extraordinarily dangerous event the fact that more than 400 million people live in the region of China currently being socked by record heat and the vague reports coming out of China seem highly incongruent.
Eastern China, where about 30% of the population of the country and 5% of the global population reside (approximately 400 million people) has undergone a heat wave unprecedented in its history. No one really knows how many have died as a result of the heat wave (Chinese news sources claim ‘about two dozen’), but statistically it is almost certain that many thousands must have perished as the result of the heat over the past month.
If Christopher Burt’s, quite rational, analysis ends up proving true, we can expect reports of fatalities to begin to slowly trickle out of China. Misreporting and under-reporting of Chinese heatwave casualties would also be yet one more instance of government officials and mainstream media downplaying and under-reporting the effects of catastrophic events related to human-caused climate change. Such under-reporting is yet one more manifestation of a dangerous and paralyzing denial that has so hampered an effective response to these increasingly dangerous and self-inflicted events.
Making such a call, however, is possibly premature as residents of this region are more acclimated to excessive heat than Europeans or Russians. As Burt notes:
One thing to keep in mind, however, is that it is ALWAYS hot and humid in eastern China during the summer (unlike Russia and Western Europe), so perhaps the population has learned to adapt to extreme heat.
The Ocean Heat Dome Expands to Cover Korea and Japan
A sprawling heat dome high pressure system that has scorched a region stretching from coastal China to a large expanse of the Pacific Ocean shifted eastward into Korea and Japan over the weekend. Southern Japan saw temperatures surge into the 100s with Shimanto recording the highest temperature ever measured in Japan of 105.8 degrees Fahrenheit (41 degrees Celsius). Tokyo, meanwhile, broke the record for its hottest minimum temperature at 86.7 degrees Fahrenheit (30.4 C).
South Korea, over the same period, reported 8 deaths as temperatures soared to 102.2 degrees Fahrenheit (39 C) in Busan. Temperatures in Seoul hit the still hot, but more moderate, 90s (32 C +).
Both South Korea and Japan are surrounded on multiple sides by water. This geographic feature would usually provide a cooling effect as ocean temperatures are typically many degrees cooler than land temperatures. But, in this case, a massive heat dome is baking the ocean itself to unprecedented high surface water temperatures. As a result, a large area of open ocean now shows readings above 30 degrees Celsius ( 86 Fahrenheit). This extremely hot, near 90 degree water, has formed the central pulse of the current heatwave even as it has pumped extraordinarily humid air for such hot conditions over adjacent land areas. A shift to the north of this large and still growing region of extraordinarily hot ocean water led to the record steamy conditions over Japan and Korea during the past few days — both of which can expect little relief from the now, very hot, water.
Forecasts for Shanghai, Korea, and Japan call for slightly less sweltering temperatures in the upper 90s with more isolated readings in the 100s as clouds are expected to move in and increase chances of rainfall by later this week. A slight improvement but a welcome change, nonetheless. Meanwhile, hot ocean conditions create a risk for continued very hot temperatures for much of this coastal region.
In looking at the potential impacts of human caused climate change over the coming decades and centuries, scientists have often pointed toward more recent times such as the Eemian (the most recent warm interglacial in which global temperatures are similar to what they are now and where they are expected to be over the next 20 years), the Pliocene (2-3 million years ago and the most recent time in which CO2 levels were about equal to those of today), and the PETM (about 55 million years ago and the most recent period during which CO2 levels were above 600 ppm and in which there was very rapid warming, possibly due to methane hydrate release).
The PETM has been a period of very intense study for leading climatologists such as James Hansen who has warned of the potential for a mini-runaway warming event of this kind should humans continue along a business as usual path of fossil fuel burning through the 21rst Century. In particular interest in the PETM corollary scenario is both the amazing velocity of the initial human warming, with CO2 and greenhouse gas releases occurring at rates that are five (CO2) to 27 (methane) times faster than the PETM (Hat tip to Timothy Chase, Source: Skeptical Science). So rapid and powerful a rate of forcing puts at risk of greater release a number of very large global carbon deposits including the massive CO2 and carbon stocks stored in the world’s melting permafrost as well as the even larger stores of carbon locked in methane hydrates scattered across the world’s oceans. Hansen and other scientists have noted a potential for a 4-7 degree Celsius or greater warming by 2100 (at between 700 and 1000 ppm CO2) through a combination of human greenhouse gas emissions and Earth systems carbon emissions. Overall warming by 2300 from Earth Systems feedbacks, even if human emissions were to stop by 2100, is likely to be twice this level.
That such a massive warming would be catastrophic is a given. There is no evidence in the geological record for such a stunning pace of warming over so short a period. And the potential climate change impacts from such high levels of heating, alone, would be extraordinarily difficult for human civilizations and the innocent inhabitants of our living world to manage.
Late Permian Just Prior to De-glaciation at approx 260 million years ago.
But this scientific scenario is based, in part, on knowledge gleaned by studying past geological periods such as the Eemian, Pliocene, and the PETM hyperthermal (other information is derived from the still-developing climate models of terrestrial, ocean, and Earth systems). And, in looking at each of these paleoclimate periods, we find that a single key factor is missing: they all occurred during periods in which Earth was either ice-free, or in which Earth was settling into its current period of glaciation. In the case of human-caused warming, the exact opposite process is ongoing. As during the great Permian Extinction event of around 250 million years ago, the Earth is rising out of a period of glaciation and into a potential human-caused hot-house.
No More Ice Ages and a Start Down the Path Toward De-glaciation
In the current period of human-caused warming we encounter the novel and relatively uncharted territory of an Earth System that is being forced to arise out of a 40 million year long period of glaciation. This period has been characterized, first, by the freezing of the vast land mass of Antarctica, then by the freezing of Greenland and, later, by long ice ages in which glaciers expanded from the poles to cover large areas of land and water. This latter ice age-interglacial period began about 800,000 years ago and has dominated until today.
With atmospheric CO2 levels now at 400 ppm and with humans continuing to emit high volumes of CO2 for at least the next two decades, we can officially declare the period of ice ages and interglacials at an end (or at least put on extended hold). For retaining even a very small portion of our current greenhouse gas emitting infrastructure or agriculture would be enough to stave off another ice age. Hansen notes:
Forces instigating ice ages, as we shall see, are so small and slow that a single chlorofluorocarbon factory would be more than sufficient to overcome any natural tendency toward an ice age. Ice sheets will not descend over North America and Europe as long as we are around to stop them.
Ice ages are now stopped in their tracks and current human levels of CO2 at 400 ppm are now sufficient to begin melting Greenland and West Antarctica. We can see this melt in yearly losses exceeding 500 gigatons of melt water and ice from Greenland and from Antarctic melt losses in the range of 300 gigatons per year or more. And with the increasing human heat forcing, these melt rates are on a very rapid incline. Greenland is showing a doubling in its melt rate every 5 years.
Yet even this, rapidly expanding, melt pace may seem slow if humans continue along their current path of greenhouse gas emissions growth. Last year, over 32 gigatons of CO2 were emitted into the atmosphere and the net human greenhouse gas emission was equivalent to more than 45 gigatons of CO2. At the current rate of emissions and emissions growth, we are now on track to hit between 500 and 600 parts per million of CO2 by the middle of this century. And this range of CO2 is enough or nearly enough to melt all the world’s ice, setting us on a path toward a place not seen in at least 40 million years. A path toward long-term temperatures in the range of 6 degrees Celsius hotter than the 1880s. If emissions continue until the end of this Century, the path is almost certainly toward that of a hyperthermal and one with unique consequences given the speed at which we approach it and the fact that we will send massive volumes of fresh meltwater into the oceans as we approach it.
The PETM and the Great Dying
And this is where we encounter a bit of a problem. Because the world is rapidly rising up out of a 40 million year long glacial period, it is bound to encounter changes not visible 40 million years ago as the Earth was steadily cooling down toward glaciation or even during the PETM as the Earth emerged from a lesser cool period and entered a hothouse state. In the case of the Permian and the current day, Instigating the loss of glaciers presents its own, rather unique, set of problems and difficulties.
In looking at the geological record, we find that the last major cold period with temperatures close to those of the recent ice ages (aside from a somewhat cool period during the late Jurassic and early Cretaceous) occurred during the late Carboniferous and the early to mid Permian period.
Hot and cold periods during the last 500 million years (best proxy data used).
During the late Permian and early Triassic, however, very rapid and intense warming roughly equivalent to that of the Eocene of 55 million years ago occurred. Both events resulted in extinctions in the oceans and on land. Both events showed major temperature spikes toward the end that are theorized to be linked with large methane pulses and amplifying Earth Systems feedbacks. And both are typical to a mini runaway hyperthermal of the kind James Hansen warns is possible under a regime of human warming.
The primary differences between these two events is that, first, the Permian Triassic extinction event occurred after a long period of glaciation and, second, that the Permian extinction was the greatest mass extinction ever recorded in the geological past. What resulted killed off a devastating 96% of the species in the oceans and 80% of all species on land. It is for this reason that the Permian-Triassic boundary layer extinction is known as the great dying.
By contrast, the PETM resulted in a similar, but far less, extreme event. About 35-50% of the benthic forminifera of the deep ocean went extinct. Many other ocean species, especially those of the deep ocean, exhibited stress and losses. Life on land, especially among mammals, was pushed toward dwarfism to deal with the extreme high temperatures. But, overall, stresses to land and ocean animals was far, far less than that of the Permian extinction.
Putting a Lid on the Ocean — Glacial Melt’s Role in Enhancing Anoxia
At issue here is the likely anoxic ocean states resulting from major warming events. As the oceans are heated, they are able to hold less oxygen in solution. This steady depletion results in growing regions of anoxia and related algae blooms that can be very dangerous to marine and, in extreme cases, terrestrial organisms. Warmer, anoxic oceans are more likely to host blooms of deadly green and purple algae.
These primordial creatures once ruled the seas during the days of ancient Earth, before higher levels of oxygen were present. Now, a mixed, oxygen rich ocean keeps their development in check. But the warmer ocean during the time of the PETM is thought to have brought anoxic states back to the world’s deep oceans.
In short, ocean circulation is thought to have reversed. Heating at the tropics resulted in seas becoming saltier as waters there evaporated. These saltier waters grew dense and sank toward the ocean bottom drawing fresher, cooler water in from the poles. This type of ocean circulation is thought to have dominated for about 40,000 years during the PETM and contributed greatly to anoxic ocean states by concentrating warmer, anoxic water at the bottom of the world’s oceans.
During the Permian, anoxic ocean states were thought to be far, far more intense. Paleontological research conducted by Peter Ward found a massive series of three extinction events ranging over the course of about 165,000 years in which death began at the bottom of the Permian ocean and climbed toward the atmosphere.
It is thought by some scientists that rapid warming during the Permian enhanced both glacial melt even as it amped up the hydrological cycle to increase fresh water runoff from the continental land mass. The result was a much greater freshening of the ocean surface. Enhanced evaporation at the equator is thought to have driven a similar ocean circulation to that of the PETM in which hotter, saltier water sank to the ocean bottom. Glacial melt, in this case, greatly enhanced an ocean circulation change that was already leading to anoxic ocean states. The result was that ocean layers became even more stratified and less mobile further amplifying anoxia. In the case of the Permian, ocean anoxia eventually enveloped a majority of the worlds oceans, permeating all the way to the surface and eventually invading the atmosphere.
The Emergence of the Canfield Ocean
A stratified, anoxic ocean developed which started increasing mortality among deep water life forms first. As anoxia rose through the deep and mid levels of the ocean, death advanced up the water column as green and purple algae found sunlit regions and proliferated, adding hydrogen sulfide gas as a killing mechanism to ocean acidification and low ocean oxygen levels. Eventually, the hydrogen sulfide reached the surface waters at which point it began bubbling into the atmosphere. The anoxic ocean had fully transitioned to a primordial Canfield Ocean.
Hydrogen sulfide gas is directly toxic to both plants and animals alike and this great out-gassing likely resulted in the massive loss of land species. Ironically, high temperatures (on the order of 9-12 degrees C hotter than now) enhance the lethality of hydrogen sulfide gas. When the gas reaches the stratosphere, it depletes the ozone layer, causing even greater harm to land species. Fossil remains show evidence of genetic damage indicative of a depleted ozone layer and related Canfield Ocean state.
Human Warming is Much, Much Faster
It took about 20,000 years for the Earth to warm 6 degrees Celsius during the PETM. During the Permian, the final extinction and related warming events lasted about 165,000 years. In the case of the PETM, it is thought that volcanism in India stoked global warming until a rapid methane release over a 20,000 year spike period occurred. During the Permian, volcanism is thought to have burned through coal patches over a large region of Siberia, possibly eventually setting off similar very large methane pulses to those suspected to have occurred during the PETM.
In both cases, temperatures rose to between 9 and 12 degrees Celsius hotter than today. But, in the case of human warming, we have the potential to warm the Earth by as much as 7 degrees Celsius by the end of this century and, possibly, to Permian/PETM levels over the next 300 years. Such a rapid pace of warming holds no corollary in either the Permian, the PETM or during any other major warming event visible in the geological record of Earth’s past. So while we may look to the Permian for potential enhanced ocean circulation and anoxia impacts due to glacial melt and increasingly intense ocean stratification, we have no rational means by which to determine how far behind increasing temperatures and glacial melt such events may arise. In the case of the Permian, it took about 165,000 years for a Canfield Ocean to arise. But anoxic ocean states emerged and intensified as warming ramped up. So it is likely that ocean anoxia and stratification will become an increasing problem as the Earth rapidly warms due to human forcing. We can also expect glacial melt to amplify the problems caused by anoxia by increasing stratification and by pushing warm, oxygen-poor waters toward the ocean bottom where they have little opportunity to recharge oxygen stores. Lastly, in the worst case, we can look for Canfield Oceans as a potential tail-end risk for human warming, especially if global temperatures approach 9 to 12 degrees Celsius above the 1880s average and if very large fresh water pulses from glaciers shut down and reverse current ocean circulation.
August 4-7 saw a large and growing pulse of methane emerging from the Yedoma region of Russia and the Siberian Arctic over the past week. By Wednesday, about 30 percent of the Yedoma region was covered in methane readings exceeding 1950 parts per billion, according to measurements published through the online resource — Methane Tracker.
This pulse emerged in conjuction with late summer fires and heatwaves scorching this massive region of permafrost above or near the Arctic Circle. Yedoma includes a broad expanse of permafrost ranging from Siberia to a shallow sea known as the East Siberian Arctic Shelf. In total, this region is estimated to hold 500 gigatons of carbon locked in, now thawing, tundra.
The region has come under increased scrutiny and study during recent years as temperatures throughout the Arctic and especially in this area have rapidly risen due to human warming. While global temperatures have increased by an average of around .2 degrees Celsius per decade, temperatures in Yedoma have increased by more than twice that rate at a whopping .5 degrees Celsius per decade. As a result, most of the tundra, both land and shallow sea, is subjected to increasing heat forcing and is at greater risk of releasing large volumes of carbon into the atmosphere.
The geographic region of Yedoma and its related loess layers are indicated on the map below. Note the large off-shore region extending into the East Siberian Arctic Shelf:
Originally, it was estimated that Yedoma released about 4 megatons of carbon each year. Instead, recent expeditions have found that the region releases a staggering 44 megatons of CO2 and an estimated 4 megatons of methane. The CO2 emission alone is greater than that pumped out by 1 million automobiles and, since methane is so powerful a greenhouse gas, the forcing provided by the 4 megaton methane emission is nearly twice that.
Recent studies conducted by N. Shakhova have estimated that as much as 50 gigatons of the methane locked in the East Siberian Arctic Shelf could rapidly destabilize and emit over a brief period of 1-50 years. The Shakhova paper is refuted by another scientific paper produced by C. Ruppel who claims that the global .2 degree Celsius temperature increase each decade is not enough forcing for a rapid release. Peter Wadhams, who produced a recent article for Nature, refutes these findings noting that temperatures in the Arctic are warming faster than the global average and that sea ice losses can result in very strong, if briefer, temperature spikes during summer months that provide a powerful forcing to the sub-sea methane. Wadhams observations are refuted by other scientists — notably Gavin Schmidt and David Archer, who favor a slow release scenario based on what they have seen in various climate models.
In context to this scientific argument is the well supported theory that methane release contributed to rapid warming during past global heating events such as the PETM and the Permian-Triassic.
Nevertheless, we have seen a rising methane emission from the Arctic over the past decade. These increases are not indicative of the extraordinarily rapid release Shakhova has warned is possible. But they are still rapid enough to raise local methane levels by a rate of 5-10 parts per billion each year — nearly twice the global rate of increase. What this rate shows is that Arctic methane emissions are occurring at a faster pace and at relatively higher volumes than those in the rest of the world.
The Yedoma spike chronicled above by Methane Tracker is a troubling, though not catastrophic, occurrence. It appears during a time when high temperatures and wildfires are affecting a large region of Yedoma where we see the methane pulse. It is possible that methane seeping up through the tundra from anaerobic pockets where methane-producing bacteria can thrive are venting into the atmosphere as the tundra thaws. During times of high heat forcing, such as periods of late summer at times when human warming has induced more and more Arctic heatwaves, higher volumes of this methane are at risk of venting into the atmosphere. In some places, the methane concentrations are high enough to ignite in fires, as we have seen in numerous melt ponds across the Arctic. In the presence of wildfires driven by Arctic heatwaves, a high rate of methane emission creates a volatile additive to an already anomalous situation.
Major Wildfire Outbreak in the Region of Yedoma and Siberian Russia
Whether or not catastrophic methane spikes of the kind Shakhova and Wadhams warn of will result from human forcing, it is likely that methane and related CO2 emissions will continue to increase throughout the Arctic and at rates far faster than is correlated in the climate record over the past 800,000 years. The carbon store there is vast, and the rate of forcing increase is far faster than at any time in the geological record. For reference, it took about 8,000 years for the Earth to warm out of the last ice age. Temperature increases averaged at a rate of .006 degrees Celsius per decade during this time. The current rate of human-cased warming is more than 30 times that. Yet even with this very slow level of forcing we find atmospheric CO2 and methane levels rising significantly over the ice age to interglacial transition period — with CO2 rising by 100 ppm and methane rising by 300 ppb.
The fact that even such slow forcings can result in such significant responses should serve as a warning when we consider the current, very rapid human temperature forcing. A related, more rapid, Earth Systems methane feedback could quickly overwhelm sinks and provide a much higher relative atmospheric methane level. Meanwhile, as we consider this, very valid, concern, we observe significant and rising methane emissions from the Arctic’s most vulnerable stores. Given these two very valid concerns, it is both prudent and rational to identify rising methane emissions as a current and growing threat.
The Jet Stream over North America is a complete basket case. It is far less a river of air flowing between colder northern regions and warmer southern regions than it is a disassociated hodgepodge of cut off air flows. In the far north over a region of coastal Alaska and the Northwest Territory, an Arctic heat dome has formed and grown more prominent setting off temperatures ranging from the high 70s to high 80s as far north as the shores of the Arctic Ocean. This system, which has already lasted for nearly a week over this region is expected to persist until at least mid August as it ever so slowly drifts south and east. Over the west coast of the US, another cut off low sits almost motionless. Over a region between the Great Lakes and Hudson Bay a second upper level low meanders, drifting slowly west, if it moves at all. To the south, a large high pressure system also sits over the Gulf of Mexico. And from the east, a final low moves from east to west riding the tropical flow in toward Florida.
Between them all sits a stationary storm system that simply cannot move. And so it dumps rain day after day after day.
The Jet Stream is so weak over North America that these systems are essentially locked in place. And that means more persistent weather. In the case of Missouri and Tennessee, where these upper level systems are combining moisture flows from the southwest monsoons, the Pacific Ocean, from the Atlantic and from coastal and western Canada over a stalled frontal boundary, it means a great, daily dumping of rain.
The net effect of these colliding and stagnate flows is a kind of storm sandwich that is focusing in on Missouri and Tennessee even as it spreads broader impacts over a twelve state region. You can clearly see these convergent and stationary systems in the water vapor image above provided by NOAA. Note the low pressure swirls off the US West Coast, in Canada, and off the US East Coast. You can also see numerous streams of moisture flowing from the Gulf of Mexico, from the monsoonal systems over Mexico and Texas, from the west coast low, and being pulled down through a still moderately active Jet Stream flow over western Canada. The swirl of whites and blues over the Central US represents an ocean of atmospheric moisture readying to dump yet more rain over Missouri, Tennessee and the central and eastern US.
Over the past week, satellite shots show persistent storms popping up again and again over the same region:
(Extreme rainfall over Central US from August 2 through August 7. Image source: NASA/Lance-Modis)
What this series of satellite shots represents is a constant, six day heavy storm pattern. Adding in the NOAA water vapor image above, it appears that today makes for day seven. And looking at the forecast, it appears this system is now set to expand eastward even as it continues to dump rain over already hard-hit ares.
The results of this continuous dumping of moisture over the Central US has been nothing less than staggering. In eastern Missouri, in a region near Fort Leonard Wood, over 14 inches of rain has fallen during the past week. Richland in central Missouri has received a whopping 17 inches. This massive dumping of rain represents the delivery of four months worth of precipitation in just six days. Brandon, another Missouri town, received a total of 8 inches of rain within the 24 hour period from Wednesday to Thursday. A broader region stretching from Kansas to Missouri and Arkansas and on through Tennessee received between 3 and 17 inches of rain over the same one week period. And a still larger area encompassing Georgia, the Carolinas, Alabama and Kentucky also experienced abnormally heavy rainfall, washed out roads, and destroyed houses.
In the west, rivers which, in some cases were near record low levels, surged to new record highs. The east, which has endured far above average precipitation since mid spring, saw already swollen rivers leap their banks.
The Gasconde River at Jerome, Mo., set a record high level of 31.81 feet, breaking the old record of 31.34 feet set on Dec. 5, 1982. A near-record crest is forecast by National Weather Service hydrologists farther downstream on the river at Rich Fountain, Mo.
[Meanwhile,] the Maries River in Missouri crested just below record levels.
These very intense periods of rain set off flash flooding that inundated roads and destroyed at least 50 homes. Hundreds of homes were also inundated over a broader area with residents forced to flee to roof tops as water levels rapidly rose. The scenes of highways flooded, homes inundated, rivers reaching record or near record levels, and people being forced to flee from raging flood waters repeated again and again in a large swath from Kansas stretching eastward to the Carolinas. In total, more than 12 states have been seriously impacted.
ABC News last night, in the below video, aptly described the hardest-hit areas as turning into ‘a water world.’ The coverage shows storm shocked residents staring in awe at lakes forming in roadways, being rescued from the roofs of their homes, or being forced to rescue heavy equipment from flash floods. One beleaguered Georgia resident, after watching flood waters sweep his dog away, states: “I can’t live here no more, I’m through…”
However in depth and accurate, the above video misses the broader overall storm context of stalling Jet Stream flows, cut off upper level lows, and converging upper level moisture streams. ‘Stationary front’ is, therefore, a shallow and inadequate explanation of the patterns involved. The reporters would have done well to interview Stu Ostro and Dr. Jennifer Francis as individuals who could give this very extreme event a proper context as it relates to ongoing changes in the world’s climate to include meandering Jet Streams triggered by loss of northern hemisphere snow cover and sea ice, an amping up of the hydrological cycle due to increased rates of evaporation and rainfall under a regime of rising temperatures, and powerful, dense high pressure systems arising from a thickening atmosphere that just want to sit in place for longer and longer periods. All these emerging factors combine to increase the likelihood of extreme, persistent weather patterns like the ongoing series of storms now driving major US floods.
Unfortunately, the forecast calls for this weather pattern to continue to dump rain over an expanding area. For today and tomorrow, a stretch from the US Midwest to the east coast is under the gun for additional heavy rainfall and powerful, sudden storms through at least the next four days. These weather systems aren’t moving and the powerful flows of moisture converging over the central and eastern US are predicted to remain in place. So it is likely that flooding will continue to intensify over the coming days.
“Think of the climate change issue as a closet, and behind the door are lurking all kinds of monsters — and there’s a long list of them,” — Steve Pacala.
***
It has been said that Nature is a serial killer. Within her vast managerie of life, climate, and the physical world, there are many, many terrible processes that could mortally impact individuals, larger groups, entire species and even families of species. And if you were to look for the means by which Nature performs her worst violence, the mass extinction events, your eyes would almost immediately settle upon the uncomfortable issue of climate change, an issue all too relevant today.
Of twelve major mass extinction events identified in past geological epochs, ten were likely caused by climate change. Marked by layers of rocks almost entirely devoid of complex life, these periods in which Earth became little more than a tomb should serve as a stark warning against our own rapidly increasing insults to Earth’s climate. The very worst of these ‘tomb epochs,’ the Permain or ‘Great Dying’ in which 90 percent of all species went extinct was clearly caused by a series of worsening insults brought on by a terrible switch in climate brought on by a raging global warming nightmare. And though the Permian Extinction raged about 200 million years ago, it has some rather disturbing similarities to today. For one, it was an era in which a cold glacial period emerged into a far warmer period. And secondly, a large greenhouse gas emission source forced warming to drastically accelerate resulting in not one but three major extinction crises over the course of about 165,000 years. It was the worst of the worst of all tomb epochs and it was most likely set off by a massive chain of events brought on by very rapid warming.
Scattered across the wreckage of the Permian and these other tomb epochs are the foot prints of the three climate monsters from Pacala’s horde that we most definitely do not want to unleash. Monsters we are through our current actions and choices, even now, causing to stir.
Three to Keep Behind the Door
Human beings, through their carbon emissions, risk prodding the very worst monsters in Nature’s death brigade to awaken — the ones that set off previous mass extinction events through a combination of terrible weather, unleashing carbon stocks sequestered over millions of years, and, eventually, turning the ocean into an enormous killing machine. These three, worst of the worst, climate monsters which we most certainly want to keep behind Pacala’s door are: Heinrich Events, Rapid CO2 and Methane release, and Anoxic and Canfield Oceans. Though these three are identified here as separate catastrophic events, they are related in that they can set in motion a chain of self-reinforcing effects that may enhance the likelihood for the other events to occur. They also unleash a set of more minor but still terrible associated difficulties.
In this particular blog, I’ll explore the first and arguably mildest of these catastrophes — Heinrich Events.
Pulses of De-glaciation
As Earth moved through its far more milder, nature-caused, phases of glaciation and deglaciation, previous warm phases often resulted in sudden surges of ice burgs and melt flows from the Earth’s ice sheets. Large pulses during warm trends set off armadas of these maritime brutes which flooded the ocean, causing drastic consequences to weather and climate.
The ice bergs unleashed during these warming-induced pulse events were enormous floating collections of rock and ice. As they melted, the glaciers disgorged the rocks frozen in their bellies, leaving layers of pebbles littering the sea floor and creating a record of their passage. Hartmut Heinrich was the first to describe these events. So now they bear his name.
Greenland and West Antarctica: Gateways For the Heinrich Monsters
In the emergence from the last ice age, it is thought that sudden melt pulses from the vast but now entirely melted Laurentide ice sheet resulted in the majority of these events. Since only the ghost of this ice sheet remains in the form of a thin patina of frozen tundra over the Northern Hemisphere’s Arctic regions, there is no longer any risk for Heinrich melt and ice burg pulse events from this now ephemeral source.
But the great Greenland and West Antarctic ice sheets remain. Greenland is a vast store of ice. Nearly two miles high at its center, it contains enough ice to raise the world’s sea levels by 23 feet. West Antarctica is yet one more great pile of ice. In total, if the two were to melt together, they could contribute as much as 75 feet of sea level rise.
But these melt events, as we see the in the geological past, don’t happen neatly. The great glaciers sit mostly still for long, boring periods and then they surge in brief, catastrophic instances unleashing massive flows of both water and ice bergs. Heinrich Events.
Alone or together, Greenland and Antarctica bear more than enough ice to set off this particularly nasty brand of climate induced catastrophe.
The Human Forcing is Far More Brutal
In the past, a slower build up of heat set off by the warm phase of gradual orbital cycles eventually passed tipping points that led to rapid ice sheet disintegration and related melt-pulse Heinrich Events. Today, the human greenhouse gas forcing is far, far more powerful. At the last ice age’s end, a combined forcing of about 100 parts per million of additional CO2 and the steady but ever so slight forcing caused by the warmer orbital cycle was enough to set off these powerful events. Today, CO2 has risen by 120 ppm and continues to rise by 2-3 parts per million each year even as other rising greenhouse gasses, primarily methane, add an additional 28% to this strong and growing forcing.
It could easily be argued that the human forcing surpassed that of a natural forcing powerful enough to end an ice age sometime last century. But the ice age is already done and so we head into mostly uncharted territory only vaguely hinted at in the deep geological past. The current pace and path of increased forcing makes a bad situation worse as a CO2 rise to at least 480 ppm is predicted by mid-century. Business as usual end century estimates come in at the catastrophic level of 800 ppm or more of atmospheric CO2 with an unknown additional amount of methane and related greenhouse gasses.
The Greenland Ice Sheet is Starting to Slip
Unfortunately, it seems we may have already begun to let one Heinrich monster off its leash. For reports coming in over the past decade show that the vast two mile high Greenland ice sheet is starting to slip.
Under the current and ever-rising insult of the human climate change forcing, the Greenland ice sheet is sagging and deforming, filling with melt ponds and flows that flush through to its base, and, most ominously, monstrously grinding toward the ocean at an ever increasing pace. Research conducted by Arctic scientists shows that the ice sheet’s speed is increasing by a rate of about 2-3 percent per year. This speed of increase results in the disgorging of vast volumes of ice burgs and melt waters into the North Atlantic. An average of about 500 cubic kilometers of ice bergs and melt waters are now flowing into the ocean from Greenland alone. But with the pace of ice sheet melt and movement picking up, we are, sadly, only at the beginning of what appears to be a very risky situation.
Flotillas of Icebergs Riding a Tsunami Like Melt Pulse
Let’s step back for a minute from this slow motion disaster that we’re both the cause of and captive audience to and consider, for a moment, the structure of Greenland’s ice and land mass. The Greenland coastline is little more than a honeycomb of semi-frozen channels both coming into contact with the larger water bodies of Baffin Bay and the North Atlantic and drilling deep into the interior of Greenland itself. The two mile high glacier slopes gradually down toward and into these hundreds of channel estuaries, creating a slope defined by tall ice sheets terminating in low, ocean-opening waterways.
In the above image, you can see just one section of these ice channels that encompass almost the entire coastline of Greenland. Note the dark ocean water coming into contact with the silver-white of Greenland ice. The small white flecks you can see in this Modis shot are nothing less than immense ice burgs riding the winds and tides out into the North Atlantic. If you accurately imagine the entire coast of Greenland perforated by such outlets, what you come to realize is that Greenland is nothing less than an enormous ice burg dispersal mechanism. One that, if it really cranks up, will disgorge vast flotillas of ice bergs riding out upon tsunami-like melt pulses in every direction.
Inherent to this potential is the fact that Greenland ice is continuously in motion. Pulled by gravity, the towering ice sheets constantly seek the sea. Slowly grinding away, the ice moves gradually, steadily until it, at last, finds water, there it explodes in a riotous calving of the immense and monstrous ice burgs. The more solid and cold Greenland becomes, the slower its ice moves toward the ocean. The ice sheet weight increases, depressing the entire island into the crustal plate and keeping more of its ice locked in the center. The ice forms more solid boundaries to other ice flows and the ice grinding slows as it thickens. But the more wet and warm the ice becomes, the opposite is true. Water flows through the ice sheet to lubricate its base, the large pools of water on top further heat and deform the ice, the crustal plates rebound, pushing the island higher and adding gravity as a more and more powerful force attracting ice to ocean, and increasingly large pulses of melt water flush out from the center of the glaciers, drawing both ice and water along in ever greater volumes toward the ocean.
In a Heinrich Event, the melt forces eventually reach a tipping point. The warmer water has greatly softened the ice sheet. Floods of water flow out beneath the ice. Ice ponds grow into great lakes that may spill out both over top of the ice and underneath it. Large ice dams may or may not start to form. All through this time ice motion and melt is accelerating. Finally, a major tipping point is reached and in a single large event or ongoing series of such events, a massive surge of water and ice flush outward as the ice sheet enters an entirely chaotic state. Tsunamis of melt water rush out bearing their vast flotillas of icebergs, greatly contributing to sea level rise. And that’s when the weather really starts to get nasty. In the case of Greenland, the firing line for such events is the entire North Atlantic and, ultimately the Northern Hemisphere. But the Southern Hemisphere has its own set of troubles to contemplate. For there resides the seemingly endless pile of ice that is Antarctica.
Storms of My Grandchildren
A long time ago, I read a book called “The Coming Global Superstorm.” The book trivialized the potential effects of Heinrich Events by lumping them into a myopic and artificial single instance that the authors referred to as a Superstorm. The book was also chock full of astrological New Age jargon and other unrelated philosophy that greatly discredited the authors’ notion of Superstorm. Even worse, Hollywood jumped onto the trivialization bandwagon by producing the entirely unrealistic movie “The Day After Tomorrow.”
About this New Age book and its related Hollywood film, I have but one thing to say — if only it were so easy. Both the book and the movie boil the risk of human caused global warming into a single, linear event, which ends in single results. Even worse, both the book and the movie produce the false impression that such storms will result in an ice age. Again, if only it were so easy.
If you want to learn about the potential involved in such events, you should become a student of climate scientist James Hansen. You could start by reading the excellent book “Storms of My Grandchildren” and you could continue by reading his papers pertaining to extreme weather caused by West Antarctic and Greenland Ice melt.
What Hansen describes in his later work is the potential for ‘continent sized frontal storms packing the punch of hurricanes’ to rip across vast swaths of the Northern Hemisphere in association with an extreme weather pattern set up by a Heinrich type event acting in combination with a human warming induced heat amplification of the tropics. In vast difference to the “Day After Tomorrow,” these storms are not single instances, but potentially re-occurring catastrophic weather hazards.
How bad could these storms get? As an example, the freak hybrid superstorm Sandy is but a prelude to the main events.
Sandy’s Arctic Arm
Yet Sandy’s somewhat unique hybrid structure and location may well provide us with hints as to the nature of future superstorm events. What we see in the above NOAA satellite shot is a storm that is linked both in the tropics and in the Arctic. The storm derives energy from a cold air mass over Greenland and pulls in another ‘arm’ of energy from the tropical Atlantic.
During the Heinrich event, the ice berg cooling effect mentioned by Hansen in his papers and the human caused heat amplification of the tropics will set up a far more disastrous atmospheric storm potential. And the raking effect of continent sized frontal storm systems would have even more damaging consequences to human infrastructure than the related pulse of sea level rise alone.
Ocean Circulation Change to Open the Door for the Hydrate Monster, Anoxic/Canfield Oceans?
Yet one more ominous result of Heinrich Events is a high-stress shock to ocean temperature and saline circulation systems. Such events are likely to shove the northern termination of larger ocean systems further toward the equator. The cold, fresh water pulses would result in less sinking of water at the poles. Related increased heat at the tropics would begin to set up a system where salty waters begin to sink there.
Even more ominously, a wedge of cold water at the surface spreading out from the poles would push hotter, saltier water toward the ocean bottom. Fresh water is less dense than salty water, so the fresh water pulses from glaciers and melting ice bergs will act as a wedge, driving the denser, warmer, saltier water toward the bottom The net effect of such changes would be a shallower and weaker ocean circulation system as more warm water is averted toward the ocean bottom near the equator and then spreads northward and as warmer surface waters toward the poles and temperature regions are driven toward the sea-bed.
Since vast stores of methane lay locked in hydrates on the sea bed, these stores are at risk of greater forcing and more rapid destabilization. To note, the end of the Permian, in which a partially glaciated world transitioned to a hot house, is estimated to have seen methane levels at around 11 parts per million — almost ten times the current level. Large melt pulses are, therefore, a potential mechanism for ocean bottom heating and increasing rates of methane release.
This event sets in place conditions that increase risk for the two other climate monsters — increasing CO2 and methane release from Earth Systems and the perhaps more ugly anoxic and Canfield Ocean states. And both we will visit in future blogs.
How Soon?
How soon could we see Heinrich type events, Hansen-style superstorms, and dangerous changes to ocean circulation? Hansen, in “Storms of My Grandchildren” indicates a risk for such events emerging by mid-century under business as usual fossil fuel emissions. Jason Box and others have shown an increasing speed and melt of the Greenland Ice Sheet occurring during the first and second decades of the 21rst Century. So it appears we are starting to ramp up to such events even now as an ominous ice sheet response begins to show on the climate radar. So the period of risk appears to be sometime between now (low) through 2070 (moderate to high depending on human CO2 forcing growth or mitigation).
That paleoclimate and modeling performed by Hansen show the potential for such powerful events should be cause for serious concern and reason for ever-greater urgency in reducing human greenhouse gas emissions and our related climate risk to the lowest levels possible. And, in the end, we almost certainly do not want to begin to bring forward conditions that will release the other two ‘monsters behind the door’ — rapid CO2 and methane response from Earth Systems and anoxic and Canfield Oceans.
Over the past week, large tundra fires have been erupting over a section of extreme northern Canada between the Great Slave Lake and the shores of the Canadian Arctic Archipelago. With a major Arctic heatwave predicted as various extreme weather conditions arise, this region will be worth very close monitoring over the next few days.
The fires are emerging in a region of the Arctic between 62 and 66 degrees north latitude, near the Arctic Circle. In the image above, we see the Great Slave Lake in the lower left hand corner, the Great Bear Lake in the upper center, and Coronation Gulf and Amundsen Bay bordering the map’s right hand side. The fires are visible, along with their tell-tale smoke plumes and underlying scorch marks, in a region between the Great Slave Lake and Great Bear Lake. Terrain type in the regions burned include boreal forest and tundra.
Weather conditions over the past two weeks have been both warm and dry for this Arctic region. But over the past few days, temperatures have been heating up. As temperatures rose, wildfires sparked and grew. Forecasts now call for a region of very hot Arctic weather to stretch all the way to the shores of the Beaufort Sea by Friday with temperatures likely to exceed 30 degrees C (86 degrees F) over the broad stretch of land surrounding the Mackenzie Delta.
This high Arctic heat pulse is being driven north by a powerful high amplitude wave in the Jet Stream which is setting up very extreme temperature differentials between the Beaufort Sea and North Canadian land masses. Temps over the Beaufort are now in the range of -5 degrees C in some areas (about 22 F), with temperatures over land hovering, at this time, in between 15 and 23 C (60s and 70s) and predicted to surge as high as 30 C + (86 F+). This amazing temperature differential is likely also providing fuel to a powerful 978 mb (Smokey) Arctic Cyclone now traversing from the Laptev and into the Central Arctic. It will also intensify winds and drive greater heating over Arctic land masses over the next few days.
The map indicates forecast daytime temperatures for the Northern Hemisphere land masses bordering the Arctic on Friday, August 9, 2013. Note the highly anomalous condition in which temperatures are predicted to be hotter further north, over regions near the Mackenzie Delta, than they are further south. This is an extraordinary inversion and one certainly worth putting into the context of the extreme weather conditions that are now ongoing. (Areas of red on the map indicate average temperatures in the range of 77-86 degrees (F). Maximum daily values are likely to exceed this average predicted range.)
Though not as massive or extensive as the fires raging across the Arctic Ocean in Russia, these fires are still quite large — with burn marks stretching 6 or more miles at their widest point in many cases. Another region just west of the fires shown in the image above is also experiencing a very large blaze. This complex of fires is raging along the banks of the Mackenzie River and is shown to have a fire line more than ten miles across at its widest point.
Note the extremely large scorch mark to the lower center portion of the map, with a large, energetic fire blazing in the upper right portion of the map and a smaller, though still substantial, blaze erupting to the upper left.
As noted above, fire-conducive conditions for this region are forecast to intensify well before they moderate. So this particular spate of fires may well be just starting to ramp up.
For a final note, I’d like to add the observation that this event represents a bit of rather harsh irony. These fires now rage in a region dominated by Canada’s Tar Sands Industry. Carbon is being baked and burned out of the land and soil by anomalous heat caused by human warming and not just by the immense grind and crush of fossil fuel industry. The steps of carbon extraction, in this case, have been shortened and are now out of our control.


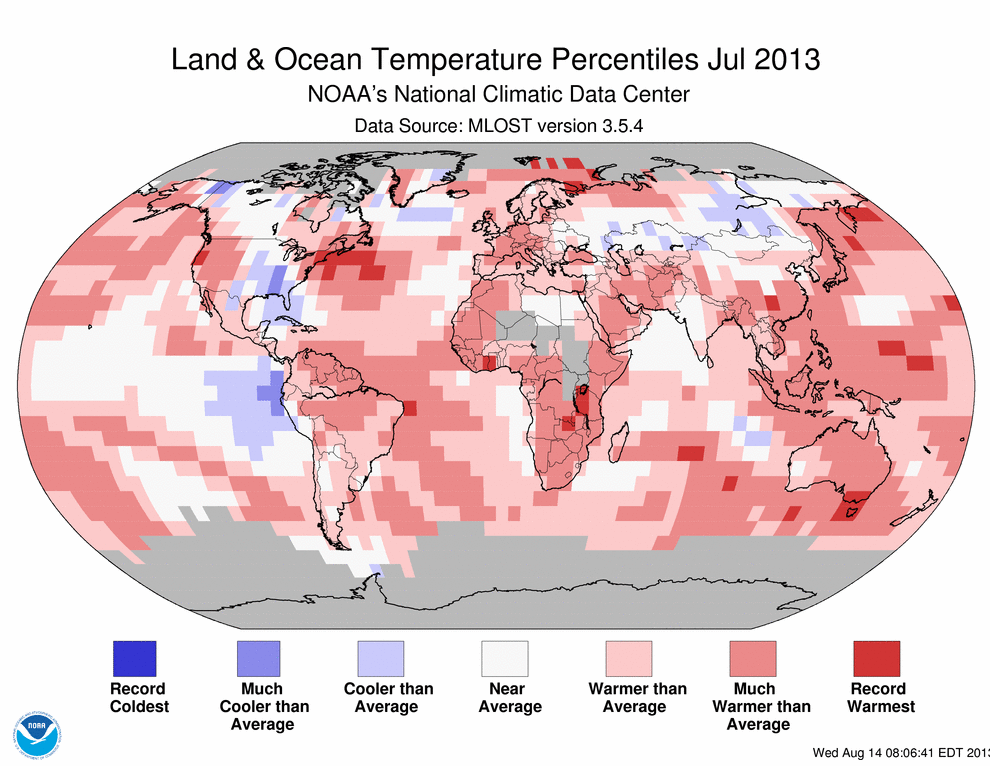


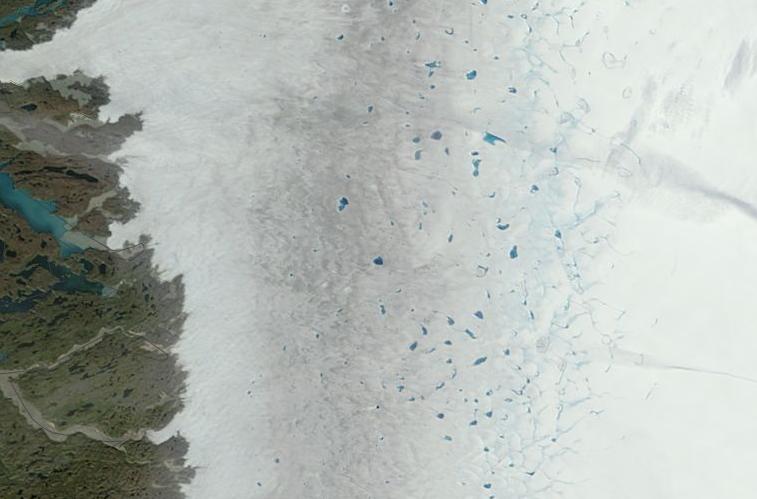


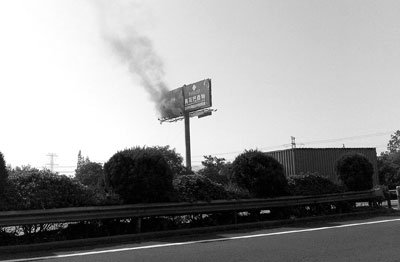


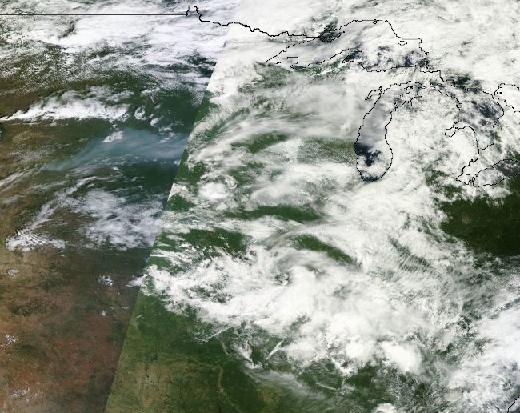


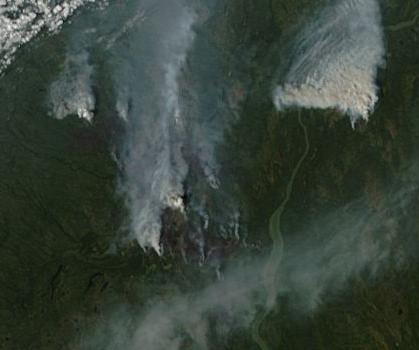


