Hot Winds Fan Massive, Unprecedented March Wildfire Burning 40 Mile Swath Through Kansas and Oklahoma

It’s likely that we’ve never seen a March wildfire like the beast that just ripped through Kansas and Oklahoma over the past day. But in a world that’s now exploring a new peak temperature range near or above 1.5 C warmer than pre-industrial averages, a level of heat not seen in the past 110,000 years, we’d be out of our minds to expect the weather and climate conditions to behave in any kind of manner that could be considered normal.

We’re Probably Looking at the Worst Wildfire on Record for Kansas and Oklahoma

Kansas Oklahoma Wildfire March 2016

(Massive, unprecedented, wildfire burns along a 40 mile swath across Kansas and Oklahoma on Wednesday. Image source: NASA/MODIS.)

And abnormal absolutely describes what happened in Oklahoma and Kansas yesterday and today.

The first sign of trouble was a warning of severe fire risk by weather officials for a multi-state region of the Central US on Wednesday. Extremely dry southwest winds gusting to 60 miles per hour coupled with anomalous temperature readings in the 80s (F) — or about 25 degrees (F) above average for this time of year — spiked fire hazards across a broad swath stretching from New Mexico and Western Texas on into Oklahoma and Kansas. The abnormal heat and dry winds combined to spark one of the worst grass fires on record.

The fire began in Northern Oklahoma at around 5:45 PM and almost immediately leapt northward — following the wind along a 1-2 mile wide swath through the northern portions of the state before roaring across the border into Kansas. It swelled to massive size — spewing out a plume of debris so large that doppler weather radar stations began picking it up. The large cloud, filled with tinders, dropped burning fragments over towns as far as 85 miles away from the blaze. People as far away as Arkansas reported smelling smoke.

During the height of the fire, the City of Medicine Lodge found itself facing an encroaching wall of flame on three sides. The nearby Route 160 had been cut off by the fire and as many as 2,000 structures, including the local hospital, were in danger of being consumed by the flames. Two homes burned, two bridges were destroyed and thousands were urged to evacuate as government officials declared a state of emergency. The American Red Cross scrambled to set up disaster shelters for evacuees.

Anderson Creek Wildfire Enormous Footprint

(Anderson Creek wildfire’s enormous footprint is likely to grow larger over the coming day before the massive fire is finally contained. For reference, 212,000 acres is about 300 square miles. Note that by early afternoon the size of the blaze had jumped to 400,000 acres or more than 600 square miles. Image source: KOCO.)

As of this morning, 800-1000 structures in Medicine Lodge remained under threat. But the fire appeared to have mostly swept around the city. An overnight shift in the wind had caused the blaze to balloon eastward. And, according to the most recent reports, more than 400,000 acres, or about 600 square miles, had burned along a 40 mile swath stretching through Kansas and Oklahoma by early afternoon Thursday.

Conditions in Context

For a single fire to burn so much land in just a single day is absolutely unprecedented for this region. By comparison, the fire season of 2014 was considered to be the worst on record for Kansas — but it took nearly 4,000 fires to burn 110,000 acres during March of that year and here we have a single fire that has now exceeded that record total.

Under the conditions of human-forced climate change, wildfire risk is amplified due to a number of factors. First, overall increased temperatures result in periods of greater and greater fire risk. In addition, the added heat increases rates of moisture loss, facilitating drought, flash drought, and brief periods of intense dryness. Plants, which have adapted over tens of thousands of years to manage an expected range of moisture levels, are unable to compensate for the increased heat and dryness and become more vulnerable to burning.

Hot Winds Blow over Oklahoma and Kansas

(Anomalous heat and dry wind events, like the unseasonable warmth over Oklahoma and Kansas that pushed March temperatures into the mid 80s [F] over Oklahoma and Kansas yesterday become more prevalent as human greenhouse gas emissions force the world to warm. These conditions are a trigger for increasingly severe wildfire events. Earth Nullschool GFS capture at 2100 UTC on March 23, 2016.)

Furthermore, increased prevalence of drought and thawing lands — such a permafrost thaw — provide an increasing volume of fuels to feed the fires that do ignite. Fires under such conditions tend to burn hotter — generating far more destructive and potentially rapidly expanding blazes than the tamer variety of fires both human beings and the lands they inhabit are used to. This is a story that could well be told the world over — from the Arctic to the tropics, to Australia, New Zealand, South Africa and the tip of South America.

Pretty much everywhere, increased global heat — now peaking in the range of 1.5 C above preindustrial temperatures — worsens wildfire risk. And it’s just one of the many, many negative impacts of rising global temperatures. But for Kansas and Oklahoma the massive plume of smoke painting the sky in shades of brown, gray and black may as well have spelled out the words — climate change.

UPDATE 2:40 PM Friday — Renewed Fire Hazard

By Friday afternoon, official tallies for total acres burned had remained at near 400,000 acres in Kansas and Oklahoma and included another 50,000 acres in Texas — or about 700 square miles over the three states. New damage estimates included the loss of hundreds and perhaps thousands of cattle along with many hundreds of miles of fence line.

Reports from the Weather Channel, from GFS model summaries, and from local observations indicated strong southerly winds re-emerging over the region and gusting up to 40 mph. Fire officials have indicated that the new strong winds and rising temperatures into the upper seventies (F) coupled with another slot of dry air could re-ignite smoldering flames in the large fire zone. As such, risks for continued burning and expansion of existing fires was on the rise by mid Friday afternoon.

Links:

Wildfire in South-Central Kansas

Wildfire Burns Through Barber County

Massive Wildfire Burns over 200,000 Acres

Real Earth Weather Analysis

NASA/MODIS

Broken Records, Strained Resources

Earth Nullschool

Hat tip to DT Lange

Hat tip to Kevin Jones


Dr James Hansen — Human Warming Pushing Seas Toward Exponential Rise of Several Meters This Century

Continued high fossil fuel emissions this century are predicted to yield … nonlinearly growing sea level rise, reaching several meters over a timescale of 50–150 years. Statement from a new scientific study led by Dr James Hansen entitled Ice Melt, Sea Level Rise, and Superstorms.

******

This week, Dr James Hansen and colleagues published one hell of a groundbreaking bit of scientific research. It’s a multi-disciplinary study incorporating the work of 19 top climate scientists, glaciologists, paleoclimatologists, and other Earth Systems researchers. Scientists from NASA, GEOMAR, JPL, and other top research agencies including recognized names like Dr Eric Rignot and Dr Makiko Sato all appear on the contributors list.

Global mean sea level change

(Rates of sea level rise since 1900 and associated with a 1.1 C jump in global temperatures have already shown a non-linear progression. Ice Melt, Sea Level Rise, and Superstorms attempts to pin down just how fast glacial melt rates will increase over the coming decades.)

The paper covers three topics related to the rapid accumulation of fossil fuel driven greenhouse gasses in the atmosphere and related rapid warming — Ice Melt, Sea Level Rise, and Superstorms. In other words, the paper looks into what will likely be the initiation of a Heinrich Event during the 21st Century so long as high levels of human greenhouse gas emissions continue.

A Heinrich Event for the 21st Century

For those not familiar with a Heinrich Event — it’s one of those disastrous climate change related incidents that you really don’t want to see emerge. One that drives rapid sea level rise, wrenching climate dislocations, and is likely also a trigger for regional and possibly hemispheric superstorms. Something that’s occurred numerous times in the geological past when the great Greenland and West Antarctic ice sheets warmed enough to disgorge armadas of ice bergs into the North Atlantic and/or Southern Ocean. The kind of thing that scientist Steve Pacala called a Climate Monster in the Closet. And Dr. James Hansen and colleagues’ new study is the first of its kind to scientifically explore the potential occurrence of just such a freak and dangerous event during the 21st Century.

Because the paper covers such a broad range of topics related to Heinrich Events, I’ve decided to write a two-blog post covering it. This post will focus on the ice melt and sea level rise issues. The superstorm-generating aspect of Heinrich Events — which Dr Hansen and colleagues found was capable of producing waves powerful enough to pluck 1,000 ton boulders from the sea floor and deposit them upon hillsides in the Bahamas 130 feet above sea level 115,000 years ago — is something we’ll cover in a second related post over the next few days.

Warm Ocean Waters Attacking Weak Glacial Underbellies

The chief driver of Heinrich Events is spiking rates of glacial melt issuing from the Greenland and West Antarctic ice sheets and related outflow of ice bergs and fresh water into the North Atlantic or the Southern Ocean. Hansen and colleagues’ paper builds on recent work by Eric Rignot and others who’ve found that the contact of warming ocean waters with the submerged sea faces of glacial cliffs and undersides of floating ice shelves is a primary driver for melt and ice berg release during periods of local and global temperature increase.

Heinrich Event Amplifying Feedbacks

(Illustration from Ice Melt, Sea Level Rise, and Superstorms shows how ocean stratification acts as an amplifying feedback to glacial melt. Cool, fresh surface waters generated by the initial ice release set up a kind of ocean heat conveyor belt that delivers more and more warm water to the submerged underbellies of the great ice sheets. In Greenland, prograde beds limit the amount of ice that can be released in sudden events. In Antarctica, retrograde beds below sea level set up a situation where the amplifying melt feedback is further enhanced.)

Grounding glaciers and ice shelves are, at first, weakened by slow but ramping melt rates. Eventually, the glaciers and shelves collapse due to the weakening process of melt which leads to a surge of previously buttressed ice sliding out into the oceans. As more fresh melt water expands over the ocean surface, it traps heat into deeper layers of the water column near the submerged glacial faces. So initial melt produces an amplifying feedback that delivers more ocean heat to the ice and, in turn, results in more ice rushing out into the North Atlantic or the Southern Ocean.

Exponential Rates of Glacial Melt and Sea Level Rise

It is this mechanism that Hansen and colleagues fear will come into play over the course of the 21st Century. Their paper identifies a risk that such a mechanism could set up 5, 10, or 20 year melt doubling times for Greenland, West Antarctica or both this Century. A new perspective from some of the world’s top scientists that assumes the risk of non linear melt is high enough to present a major concern. As an example, under a 10 year doubling time, the current approximate 3 mm per year sea level rise would double to 6 mm per year by 2026, 12 mm per year by 2036, 2.4 cm per year by 2046, and nearly 5 cm per year by 2056.

Doubling times in non linear events often don’t fit a pure exponential curve — instead tending to follow a series of spikes and recessions with major transitional events coming at the end of any ‘curve.’ But Hansen’s particular perspective is useful given the fact that current rates of sea level rise do not appear to be following a linear pattern and due to the fact that the mechanism for large, Heinrich Event type glacial melt spikes is becoming more supported in the observational science.

Rate of Greenland Antarctica Mass Change

(It’s still early days for Greenland and Antarctic melt. However, current trend lines do point toward a potential for multi-meter sea level rise this Century. Image source: Ice Melt, Sea Level Rise, and Superstorms.)

Early measures of Greenland and Antarctica ice mass loss imply 8-19 year melt doubling times for Greenland and 5-10 year melt doubling times for Antarctica. For reference, if both these ice systems continued to double mass loss on a roughly 10 year basis, total sea level rise by the 2090s would equal 5 meters or 16.4 feet. By contrast, a 5 year doubling time would result in 5 meters of sea level rise by the late 2050s and a 20 year doubling time would result in nearly a meter of sea level rise by the end of this Century and 5 meters worth of sea level rise by 2160.

Hansen notes that these are still early days and it is unlikely that ice sheet response trends have become clear at this stage. However, initial trend lines, though likely to be less accurate, appear to pose some cause for concern. In addition, Hansen points out that rates of sea level rise are less likely to be constrained by ice sheet inertia during periods when global temperatures are rapidly rising. Projected rates of global temperature increase in the range of 1-5 C this Century is on the order 20-100 times faster than during the end of the last ice age — at the upper end covering all of the 10,000 years worth of ice age warming in just one Century. And Hansen notes that this potentially extreme rate of temperature increase poses a much greater risk of rapid glacial destabilization than is indicated by current IPCC glacial melt models.

Hansen’s research also points to the likelihood that rapid glacial melt would temporarily put a break on rates of global atmospheric warming by cooling local ocean surfaces and increasing the rate of heat transfer into middle ocean layers. And it’s this energy flip-flop and related heightened imbalance that provides a pretty severe potential storm set-up as rates of glacial melt ramp up.

Links:

Ice Melt, Sea Level Rise, and Superstorms

Climate Guru James Hansen Warns of Much Worse Than Expected Sea Level Rise

Dr James Hansen

Dr Eric Rignot

Dr Makiko Sato

Heinrich Event

Climate Monsters We Want to Keep in the Closet

Melting in West Antarctica Could Raise Seas By 3 Meters

Hat Tip to DT Lange

Hat Tip to Colorado Bob

Hat Tip to TodaysGuestIs

Ten Times Faster Than a Hothouse Extinction — Human Carbon Emission is Worst in at Least 66 Million Years

“If you look over the entire … last 66 million years, the only event that we know of … that has a massive carbon release and happens over a relatively short period of time is the PETM. We actually have to go back to relatively old periods. Because in the more recent past, we don’t see anything [even remotely] comparable to what humans are currently doing.” Richard Zeebe of the University of Hawaii in a recent paper published in Nature.

*****

carbon-emissions

(Annual human carbon emissions are about 150 times that of all the volcanoes on the Earth, 10 times faster than a hothouse extinction that occurred 55.8 million years ago. Image source: La Rosa Rossa.)

Let’s be very clear. The human fossil fuel emission is outrageous and unprecedented on geological timescales. An insult the Earth has likely never seen before. For the pace at which we are emitting carbon into the atmosphere is just flat out insane. We’ve known this for some time because the best of science can’t find any time in all of Earth’s geological history that produces a rate of atmospheric carbon accumulation equal to the one that’s happening now.

However, a new study recently published in Nature now sheds more light on this rather difficult and scary topic. But in order to find an event that is even remotely comparable to the current human greenhouse gas emission, scientists had to look far back into deep time. All the way back through a period when the last of the Dinosaurs were dying off about 55-66 million years ago.

During this time we find evidence of the most recent Hothouse Mass Extinction Event in the geological record. We call this event the Paleocene-Eocene Thermal Maximum or PETM because it’s an extreme period of rapid warming that occurred at the boundary between these two periods of Earth History about 55.8 million years ago.

The PETM Hothouse Extinction

The PETM was pretty amazingly bad. It set off a mass extinction in the oceans which wiped out half of all shellfish through the varied impacts of anoxia, acidification and coral bleaching. Its heat forcing was enough to completely reverse ocean circulation and set up a stratified ocean state. Peatlands and forests went up in mass conflagrations. Terrible insect plagues swept the globe. The related extreme surface temperatures forced a mass poleward migration and widespread genetic alteration of mammals which were eventually reduced to dwarfism.

Human vs PETM

(Earlier studies estimated PETM emissions rates in the range of 1.7 billion tons of carbon per year. A new Nature study finds PETM emissions to be even lower at 1.1 billion tons of carbon per year. This compares to a current human emission of 10 billion tons of carbon per year. A rate of emission that could jump to as high as 25 billion tons of carbon per year by mid Century unless fossil fuel use is curtailed. It’s worth noting that the ‘slow but steady’ PETM emissions above represent one of the most rapid periods of warming in Earth’s geological history. Image source: Climate Crocks.)

It was a rough and wrenching time of change and difficulty for pretty much all of life on Earth. But what the new study finds and confirms is that the rate of atmospheric carbon accumulation during that extinction period, though enough to cause seriously dramatic climate shifts, was much, much slower than what we see now.

A Human Hothouse Extinction Would be Far Worse

On average, over the PETM extinction event, rates of atmospheric carbon accumulation were found to be in the range of about 1.1 billion tons per year. By comparison, human carbon emissions during 2014 were about ten times this level at around 10 billion tons of hothouse gas hitting the atmosphere. As such, the new study finds that the velocity of the human carbon emission exceeds that of the Paleocene-Eocene hothouse extinction event by an order of magnitude (x10).

Study authors found that the large carbon emission occurred over the course of about 4,000 years. This spike in atmospheric carbon coincided with an approximate 5 degree Celsius spike in global temperatures in the 4,000 to 12,000 year time period. This implies a rate of warming of at most around 0.12 degrees Celsius every 100 years (or as little as 0.04 degrees Celsius per Century). Other estimates put the rate of PETM warming at around 0.025 C per Century. Expected human warming between 1 and 5 degrees Celsius this Century is therefore about 10 to more than 200 times faster than during the PETM extinction event given the best available current scientific evidence.

Such high rates of atmospheric carbon accumulation and related global heating risk generating an event that is outside of any geological context that scientists might use to predict the human warming event’s severity.

“It means we don’t have a really good analog in the past for the massive amount of carbon we’re releasing,” Zeebe said to National Geographic. “Even if we look at the PETM and say the transition to a warmer climate may have been relatively smooth, there’s no guarantee for the future.”

In other words, if you’re adding carbon to the atmosphere at a rate ten times faster than during one of the most remarkable warming events in Earth’s History, then the pace of wrenching geophysical changes and the extinction pressure on organisms is going to be far, far greater. Something that is certainly worse than the PETM and that may even exceed the terrible losses seen during the Permian Mass Extinction if we don’t get a handle on our fossil fuel emissions soon.

Links:

Anthropogenic Carbon Release Unprecedented in Last 66 Million Years

A Deadly Climb From Glaciation to Hothouse — Why the Permian Extinction is Pertinent to Human Warming

Earth Hasn’t Heated Up This Fast Since the Dinosaurs’ End

PETM — Global Warming, Naturally

Hat tip to DT Lange

Hat tip to Colorado Bob


World Meteorological Organization — Dangerous Climate Future Has Arrived

The alarming rate of change we are now witnessing in our climate as a result of greenhouse gas emissions is unprecedented in modern records. — Petteri Taalas, Secretary General of the World Meteorological Organization

*****

It would be a bit of an understatement to say that the global scientific community is reeling. Sure, the various scientists and researchers knew that a massive accumulation of greenhouse gasses in the Earth’s atmosphere and oceans was beginning to take a serious toll. They knew that ocean heat content in the top 2,000 meters of the world ocean system (accounting for 93 percent of Earth System warming) was going through the roof. And they knew that this warmth was going to bleed out in a seriously big and bad way as a record El Nino swept through the global climate system during 2014, 2015 and 2016.

2016 Blowing Records Away

(Temperature averages for 2016 are so far about 1.22 C above the 1951 to 1980 baseline or about 1.44 C above 1880s averages. Though temperatures should fall somewhat as El Nino cools off in the Pacific, it’s likely that 2016 comes in well hotter than the previous three record warm years. Current guidance indicates a likely range of 1 to 1.13 C above the 1950 to 1981 baseline or 1.22 to 1.35 C above 1880s averages. This is uncomfortably close to 1.5 C warming levels the Paris Climate Conference has stated a desire to avoid by the end of this Century. Image source: Climate Central.)

But I’m pretty sure if you told these same scientists a year ago that February of 2016 would see temperatures in the range of 1.43 to 1.57 degrees Celsius above averages seen during the 1880s, as we see now in the three major global climate monitors (here, here and here), they’d have responded with not just a little incredulity.

“The startlingly high temperatures so far in 2016 have sent shockwaves around the climate science community,” said David Carlson, Director of the World Climate Research Programme, in a recent World Meteorological Organization press release. Dr Michael Mann, a climate scientist at Penn State echoed these sentiments — “I think we all knew this would be a warm year due to the major El Niño event. But I don’t think any of us expected such remarkable and persistent record-breaking warmth.”

It’s a new extreme record warmth that comes immediately following a major global temperature ramp-up during 2015 — a period that the World Meteorological Organization is calling alarming due to an increasing number of severe climate impacts. “Our planet is sending a powerful message to world leaders to sign and implement the Paris Agreement on climate change and cut greenhouse gases now before we pass the point of no return,” said Mr Taalas, the WMO’s Secretary General in a press release announcing its most recent State of the Climate annual report.

World Meteorological Organization — Dangerous Climate Change is Here

The new report entitled — Hotter, Drier, Wetter; Face the Future — is scheduled to be released on March 23rd. It highlights a world undergoing a fundamental and wrenching shift in its once-stable climates. A shift that became all the more vivid during 2015 as the pace of major climate change related events rapidly ramped up.

The report highlights observations of record global surface temperatures, record ocean temperatures within the top 2,000 meters of the worlds’ waters, and the highest sea levels ever recorded on a global basis. The report also noted that Winter Arctic sea ice during 2015 and 2016 were at the lowest extent levels ever observed in the satellite record. WMO also highlights major heat, wildfire and hydrological events during 2015. Devastating heatwaves swept through India and Pakistan, exceptional heatwaves scorched Western and Central Europe, and more than 2 million hectares of Arctic forest burned in Alaska. WMO points to a number of very extreme rainfall events around the globe — particularly highlighting a West African monsoon that in some places dumped 13 months worth of rainfall in just one hour. Severe drought was also an issue for 2015 with Southern Africa experiencing its worst drought since 1933 and Northern South America and the Caribbean also seeing record dry conditions.

Significant climate anomalies and events February of 2016

(The WMO notes a number of extreme and significant climate change related events in its most recent annual report. A series of events that, according to monthly monitoring by NOAA, continued on into a record hot February of 2016. Image source: NOAA.)

According to WMO, 2015 also saw some of the most intense tropical cyclones ever recorded with Pam, a category 5 storm, making landfall near Vanatu, Mexico and Patricia reaching a peak intensity of 346 kilometers per hour — the strongest storm ever to emerge in either the Eastern Pacific or the Atlantic basin. A very rare hurricane Chapala also churned ashore in Yemen. An event that was immediately followed by a second similar cyclone — Megh.

Overall, WMO notes that:

The year 2015 made history, with shattered temperature records, intense heatwaves, exceptional rainfall, devastating drought and unusual tropical cyclone activity… That record-breaking trend has continued in 2016. The theme Hotter, Drier, Wetter. Face the Future highlights the challenges of climate change and the path towards climate-resilient societies.

In confronting that challenge, WMO calls for a redoubled effort to rapidly reduce global greenhouse gas emissions to prevent runaway global warming. However, WMO realistically notes that current national pledges will likely result in about 3 C worth of warming this Century unless even more aggressive action causes fossil fuel based emissions to peak soon and swiftly decline.

WMO recognizes that increasingly intense droughts, heatwaves and wildfires will inevitably emerge due to the amount of warming that is already locked in. WMO recommends a set of climate resiliency enhancements to aid in climate change related disaster response. However, it is unclear if even the WMO realizes the level of threat and difficulty a rapidly warming world is now facing from an increasingly dangerous and destabilized global climate system.

In other words — that disorienting sensation scientists got from looking at these terrifying temperature jumps during February is about to become a lot more common for pretty much everyone. For from the weather to the ice to the oceans to the very complexion of the sky — things are about to get pretty darn weird. Worse and weirder if we don’t shut down fossil fuel based carbon emissions soon.

Links:

State of the Climate: Record Heat and Weather Extremes

Monster El Nino Emerging From the Depths

NASA: February Warmth Crushed All Previous Records

Climate Central

NOAA

GISS NASA

Japan Meteorological Organization

Hat tip to Wili

(Note: RS estimated temperature departures for 2016 have been revised upward to 1.22 to 1.35 above 1880s averages [1 to 1.13 above the NASA 20th Century baseline] in light of very high January, February and March global temperature anomalies.)

One Month Above 1.5 C — NASA Data Shows February Crossed Critical Threshold

We had a number of preliminary indicators that February of 2016 was going to be ridiculously hot. And, according to new reports from NASA, those indicators appear to have born out.

In short, we’ve just experienced a month that was more than 1.5 C hotter than 1880s averages. It’s not a yearly average in this dangerous range — but likely the peak reading from a very intense El Nino combining with the growing base forcing of human climate change. That said, it’s a foretaste of what could very easily happen on a 5-15 year timescale in the annual measure if fossil fuel burning and related carbon emissions do not radically ramp downward.

February of 2015 was About 1.57 C Hotter Than 1880s Averages

According to NASA GISS, February of 2016 was the hottest February ever recorded by a long shot with global temperature departures hitting a never-before-seen above average range. Land and ocean temperature averages hit 1.35 C above NASA’s 20th Century baseline (1951-1980). This extraordinarily hot global reading represents a 1.57 C departure from average temperatures in the 1880s. In other words, for one month during February of 2016, global temperatures exceeded the dangerous 1.5 C threshold.

NASA record Warm February

(February of 2016 showed an extreme departure from global average temperatures. Much of the extra heat focused on the Northern Polar region with the High Arctic bearing the brunt of it. Image source: NASA GISS.)

Japan’s Met Agency also showed February temperatures exceeding 1.5 C above 1880s averages. So we only await NOAA’s findings for final confirmation.

Overall, these temperatures were the highest anomaly departure ever recorded in the NASA GISS monitor. The previous highest anomaly reading being January of 2016 at +1.14 C above 20th Century and +1.36 C above 1880s averages. Overall, the three month period of December, January and February hit an amazing +1.20 C above 20th Century averages or +1.42 C above 1880s averages. Overall, this three month departure is +0.51 C above peak three month departures during the 1997-1998 El Nino or a peak-to-peak warming from strong El Nino to strong El Nino at a rate of 0.28 C per decade.

Such high peak to peak increases may imply an acceleration above the baseline rate of warming of 0.15 to 0.2 C per decade since the late 1970s. However, such above baseline rates of warming will need to also bear out in the post strong El Nino record before such a claim can be made with any confidence.

Ridiculous Amount of Heat Over the Northern Polar Region

Looking at the geographical distribution of these extreme, above average, temperatures we find a broad swath of record heat in the range of 4 to 11.5 degrees Celsius hotter than normal covering a huge swath surrounding and including the Arctic. A region stretching from just north and west of the Great Lakes including Northwest Canada, Alaska, the Beaufort and East Siberian Seas, the Chukchi, the Laptev, the Kara, a huge expanse of Europe and Asia stretching from Eastern Europe to Lake Baikal and north to the Arctic Ocean, the Barents, the Greenland Sea, the Northeast tip of Greenland and most of the region of the High Arctic above the 80 degree North Latitude line, all experienced these extremely warm readings.

Still very warm 2 to 4 C above average temperatures surrounded much of this zone even as a broad 2-4 C above average hot spot is apparent over the record El Nino region of the Eastern Equatorial Pacific. Smaller regions experiencing similar 2 to 4 C anomalies include sections of Brazil and Columbia, a region over Southern Africa, Northern Australia and Northern New Zealand.

Overall, very few regions show cooler than normal temperatures — though the cool pool just south and east of Greenland continues to stand out as a feature that is likely related to human-forced climate change.

Feb zonal anomalies NASA

(Zonal anomalies show an extreme polar amplification signature for February of 2016. Image source: NASA GISS.)

The disposition of extreme temperature departures centering over the Northern Polar zone is indicative of a pattern of extreme polar amplification during a strong El Nino year. As such, we can infer that the circumpolar winds did little to keep warm, Equatorial Pacific air isolated to the lower Latitudes and instead had weakened to the point that Equator to Pole heat transfer was facilitated.

The temperature anomaly map at the top implies a warm meridional air flow issuing directly from the Equatorial Pacific and over the Northeast Pacific and Western North America. A second implied meridional wind pattern appears running from the Eastern Equatorial Atlantic over Western Europe and the Barents and Greenland seas. These dual Equator to Pole warm air slots appear to have helped to push High Latitude zonal anomalies in the polar region to very extreme warm temperatures for February with the highest departures approaching 6 degrees Celsius above average for the entire region north of the 80 degree Latitude line.

Arctic Degree Days above Freezing

(We’re going to need a bigger graph to measure the Freezing Degree Day anomaly below average which has now hit near -1,000. An above average warmth that has continued since a spate of record Winter heat during February. It’s an all-time low in a measure that typically doesn’t level off until June. For reference, the less Freezing Degree Days, the closer the Arctic is to thawing. Image source: CIRES1.)

Zonal anomalies remain high above the 45 degree North Line — hitting a steep slope from 2 C to 6 C as we progress northward. An Equatorial peak in the range of 1.3 C above average is also observed near and just south of the Equator. But despite an extreme El Nino, these departures are nowhere near those seen in the upper Latitudes of the Northern Hemisphere. Pretty much all zones except for the heat sink region in the 60s South Latitude over the Southern Ocean and the far south over Antarctica experienced above average temperatures for the month.

Conditions in Context — Signature of Climate Change in the Anomaly Maps Continues, Global Temperatures to Settle Back into a New High Range

The extreme polar warming, the visible warm air slots facilitating Equator to Pole heat transfer, and the overall very strong global temperature departure for February continue to express the signature of human forced climate change as predicted by many of the global model runs. The extreme Winter heat in the Arctic — while a sign of things to come during this strong El Nino year — is also an early blow to snow and ice in the Arctic for 2016 and 2017. Already, snow totals are at or near record low extent levels. Meanwhile, sea ice volume during February returned to near new record low levels as measured by PIOMAS. As a result, the melt risk to both sea and land ice in the Arctic will likely be quite high over the next two years.

GFS_anomaly_timeseries_global

(GFS temperature anomaly time series shows peak February 2016 global temperatures falling off implying a March global temperature average that will likely be somewhere between January and February values. Perhaps in the range of near 1.4 C above 1880s or 1.2 C above the NASA baseline. Image source: Karsten Hausten using GFS data.)

It is worth noting, though, that February of 2016 will likely be the highest monthly temperature anomaly we see for some time. A record El Nino is fading away from peak intensity and NOAA is now predicting a 50 percent chance of La Nina conditions by Fall. We can expect to see global temperatures now begin to fall off a bit as a record El Nino starts to fade. To this point, 2016 will likely hit a departure range near 1.2 or 1.3 C above 188os values. Post 2016 temperatures will likely hover up to 0.2 to 0.4 cooler than those values during La Nina years, with new global records possible at the onset of El Nino again in the 3-5 year timeframe.

To be very clear, though ENSO sets the short term trend, the long term trend is governed by a human forced accumulation of heat-trapping gasses. And as long as that continues, the heating we’ve experienced will also continue. Finally, since we are now very close to hitting dangerous 1.5 and 2.0 C warming thresholds (possible within 5 years for 1.5 C and 15 years for 2 C in the worst case), we should be very clear that we are just passing the most recent peak in a long progression. The trend, therefore, is up and we have now been thrust into more dangerous times.

Links:

NASA GISS

The Roof is On Fire

Japan’s Met Agency

NOAA El Nino

Karsten Hausten

CIRES1

The Choice Before us is Urgent: Sans a Swift Switch to Renewables, Dangerous Climate Change May Be Imminent

The world right now is facing some very serious challenges.

The first is that the globe will probably rocket well past peak CO2 levels of 405 parts per million by April and May of this year. This jump has been pushed along by a baseline massive human CO2 emission and assisted by a record ocean warming event (El Nino) in the Equatorial Pacific. Overall, this new yearly record will be more than 55 parts per million higher than peak ‘safe’ levels of 350 parts per million recommended by some of the world’s top climate scientists.

405 ppm the Keeling Curve

(Global CO2 levels will cross well above the dangerous 405 parts per million threshold during April and May of 2016. During recent years, record or near record carbon emissions have exaggerated rates of atmospheric greenhouse gas accumulation. But did the world see emissions reductions during 2014 and 2015 and will those reductions be sustained? Image source: The Keeling Curve.)

Such high atmospheric CO2 concentrations likely haven’t been seen in 15 million years. If CO2 levels (and the levels of related heat trapping gasses) remain so high for extended periods or continue to rise, then more and more dangerous and disruptive changes to the geophysical system of the Earth are in store. Global temperatures, the driving force of many of these changes, are already hitting +1.1 C above 1880s averages during 2015 (and +1.57 C during one month of 2016!) and will continue to ramp higher for decades and centuries unless those excessive greenhouse gas concentrations start to fall.

In 2016, we see massive losses in Arctic sea ice, rapid warming in the northern polar regions of the globe, increasing instances of extreme weather, increasing rates of glacial destabilization, increasing rates of sea level rise, increasing instances of mass casualty producing heatwaves, increasingly rapid rates of ocean health decline (ocean anoxia and acidification), increasing stress on ecosystems around the globe, and a number of dangerous tropical viruses spreading up from the lower Latitudes.

This is the world that economic dependence on fossil fuel based energy sources has given us. It’s a more difficult and dangerous one to live in than that represented by the milder 20th Century climates. And, over time, that difficulty and danger grows worse so long as the fossil fuel burning continues and concentrations of atmospheric greenhouse gasses do not fall.

Lifting More Than Half the World Out of Poverty With Fossil Fuels Is a Climate Nightmare in the Making

Related to this increasingly difficult challenge of climate change is the fact that much of the world today still lives in poverty — unable to access many of the benefits of modern life. But nations around the world support policies that will lift billions out of this impoverished state. Providing billions with access to the services so many of us in the developed world take for granted. How this transition happens will have a dramatic impact on the health of the climate of our world and the health and safety of so many of the individuals living here. In other words — will the undeveloped and developing world choose to access new, renewable energy sources and deny the use of dangerous fossil fuels even as the developed world makes a responsible energy switch? Or will everyone basically double down on the climate-wrecking fossil fuels and risk wrecking all of human civilization in the process?

It’s a critical choice for our near future. Just how critical was recently highlighted in a new paper published by researchers at the Universities of Griffon and Queensland in Australia. This paper shows that if fossil fuels are used to meet projected energy demand growth over even the next 15 years, then 2 C worth of global warming will be locked in by as early as 2030.

Climate Risks IPCC

(Climate risks threat analysis provided by the IPCC shows greatly ramping impacts as human forced warming crosses the 2 C above the late 19th Century threshold. Note that warming above 1 C — a range we are now starting to explore — pushes most risks into moderate and some risks toward high. Image source: IPCC.)

For reference, a 2 C level of warming above 1880s values would place severe and increasing stress on many Earth Systems vital to maintaining a climate state conducive for the functioning and survival of human civilizations. To many scientists, it’s considered a tipping point beyond which catastrophic consequences become much more likely to unfold. To be clear, any warming beyond 1 C this Century is probably unsafe if you want to maintain stable coastlines and prevent serious climate shifts around the world. But we’ve already crossed that threshold and what we’re engaged in now is trying to prevent a growing number of the worst effects of human-forced warming from being realized.

To this point, the new study focused on predicted energy demand growth curves and related global economic growth projections and extrapolated projected emissions based on how growth was achieved — either through renewable energy use, or fossil fuel based energy use. Using these metrics, the study found that industrial CO2 and other greenhouse gas emissions would hit a very steep curve unless projected energy demand was filled by renewable sources.

Study co-author Hankamer recently noted to The Guardian:

“When you think about statements like ‘coal is good for humanity’ because we’re pulling people out of poverty, it’s just not true. You would have to burn so much coal in order to get the energy to provide people with a living to get them off $2.50 a day that [temperature rises] would just go through the roof very quickly.”

Study researchers supported a kind of creative destruction that involved a rapid switch away from fossil fuels and toward renewable energy sources. This kind of switch would be precipitated by a removal of the 500 billion dollars in annual global subsidies to the fossil fuel industry and a related transition of those subsidies to renewable energy sources. The authors noted that such a shift in global policy and capital support from fossil fuels to renewables would generate significant and revolutionary change in the energy markets as well as provide real hope of meeting projected demand growth with non fossil fuel energy sources.

Study co-author Wagner noted:

“If we swapped those subsidies globally, of course we could have rapid improvement and deployment of renewables to cover our shift from fossil fuels. You’re pushing a huge amount of capital into a different sector that requires an enormous amount of growth, so you would actually see a great deal more growth from putting it into renewables than providing it for fossil fuels.”

Hankamer also highlighted the need for serious work on batteries and a related full transition to electrified transportation. He noted that tough challenges still existed for aviation, heavy machinery, and shipping. Energy demand sources that may require biofuels, hydrogen or a combination of these with hybrid high efficiency and low weight battery technology to continue functioning and eliminate their portion of emissions. But as a fraction of the global greenhouse gas contribution, these three represent a smaller portion than electricity generation and internal combustion engine based land vehicle transportation.

The key, according to the researchers, was getting the incentives right and that involved a wholesale shift of capital and subsidy support away from fossil fuels. The point being that even if a fraction of increased global energy demand is met by fossil fuels, then the climate situation rapidly worsens. We just have to get off fossil fuels wholesale. But the new study researchers clearly point out — the renewable option is there and we should take it.

Is Global Coal Use Declining? If So, It’s a Trend That Needs To Be Rapidly Reinforced.

To this point, there already appears to be a number of early signs of a structural shift in many of the global markets away from coal — which is one of the highest emitting fossil fuels — as an energy source for base electricity generation.

As such, a current center of gravity for global carbon emissions increases and potentials for reduction is China. Overall, China alone now produces almost 30 percent of the world’s CO2 emissions. And a lion’s share of these greenhouse gas emissions come from China’s more than 2,500 coal fired power plants. But lately, recent reports coming out of China seem to indicate not only a slow down in the rate of emissions growth — but a reduction in the amount of total emissions overall.

China CO2 Emissions per year by source

(A new study by Glen Peters estimates that China’s greenhouse gas emissions may have fallen by 1.9 percent during 2015. This potential reduction is thought to have been precipitated by a shift away from coal use and toward a larger adoption of renewable energy. Image source: Glen Peters via Climate Crocks.)

In part, this reduction in coal use is due to a wholesale shift in China’s growth policies. A shift that focuses more on services and less on heavy industry. Clean air policies have also been put in place aimed at scrubbing up a terrible air quality situation for the country. Policies established to constrain the burning of coal at currently active coal fired plants. As a result, coal-fired facilities are increasingly under-utilized in China. A situation that has resulted in some sources stating that any new coal-fired facility build-out represents a ‘coal bubble’ for China.

But perhaps the most important trend is the fact that rates of renewable energy build-out are faster in China than anywhere in else in the world. In total, more than 17 percent of China’s massive energy infrastructure is now taken up by renewables. And each year these energy sources represent a larger portion of the new added generating capacity. By the end of this year, China is expected to have 120 gigawatts of wind energy installed, 43 gigawatts of solar, and 320 gigawatts of hydro. This total of nearly half a terawatt of installed renewable capacity is expected after a 21 percent or 35 gigawatt addition to China’s already large wind and solar generation fleets.

Finally, China appears to be a leading indicator of a larger global shift away from coal. A recent report out from Carbon Brief found that more coal fired power plants around the world were being cancelled than built. A trend that, if it continues and is coupled with a rapid rate of renewable energy adoption, provides a glimmer of hope that global greenhouse gas emissions will start falling off sooner rather than later.

Emissions Reductions Findings Remain Uncertain. Cutting Coal Use Alone is Not Enough to Prevent Catastrophic Climate Change.

To be very clear — these are very preliminary findings. And there is some recent reason to doubt that current emissions reporting from China is entirely truthful. Any fudging of numbers by China would somewhat alter current greenhouse gas emissions assessments. And any related shift in global policy back toward coal, while continuing to build out oil and gas production and consumption based infrastructure would rapidly re-assert the dangerous rates of atmospheric greenhouse gas emissions growth the world has seen over the past few decades. In addition, all current indicators show use of natural gas and oil continuing to expand. And without coordinate reductions in these other two big carbon emitters, a floor will be set on how far greenhouse gas emissions can fall through the, admittedly positive, apparent shift away from coal alone.

As the Australian scientists note above — you can’t really have much hope of a milder impact from climate change unless you rapidly replace all new growth-based infrastructure with renewables (and related non-carbon emitters). Any new fossil fuel based infrastructure is basically making an already bad problem worse. And continued wholesale reliance on fossil fuels locks in catastrophic climate change over very short time horizons.

Links:

Dangerous Global Warming Will Happen Sooner Than Thought

The Keeling Curve

Entering the Middle Miocene

IPCC

China Coal Use Declined in 2014

China Greenhouse Gasses May Have Already Peaked

China Unveils Low Carbon Growth Plan

China’s Coal Bubble

China to Increase Wind and Solar Capacity by 21 Percent in 2016

China Burns More Coal Than Reported During 2000-2012

Statistics From China Say Coal Consumption is Down


Northern Polar Melt Re-Asserts With A Vengeance — Arctic Sea Ice Volume Closed on New Record Lows During February

Arctic sea ice volume hit near new record lows during February. That’s kinda a big deal. What it means is that whatever sea ice resiliency was recovered during 2013 and 2014 are now mostly gone. That record all-time lows for sea ice set in September of 2012 are likely to see a serious new challenge during 2016 and 2017.

*****

A flood of severe Arctic heat — flowing up through the Barents and Greenland seas in the East and over Alaska and the Bering Sea in the West — has been hammering the Arctic Sea Ice all Winter long. During February of 2016, new record lows in sea ice extent and area were breached. Meanwhile, sea ice volume — as measured by PIOMAS — also greatly declined to hover just above previous record lows for this time of year set in 2011.

PIOMAS Daily Volume

(Arctic sea ice volume, as measured by the Polar Science Center, plunged back to near record low territory during February. Many consider sea ice volume to be the key measure determining sea ice health. So these new drops in the volume measure are a bit spine-tingling. Image source: Wipneus.)

Looking at the above graph, provided by Wipneus, and based on model and observation data collected by the Polar Science Center, it appears that for some days during February, volume measurements even briefly descended into record low territory. As of early March, volume totals were in the range of just above 20,000 cubic kilometers — beating out 2012 as second lowest volume on measure and hovering just above 2011.

Winter Warming Grand Finale

Over the past ten days, abnormal warmth in the Arctic has faded somewhat. The lower Latitudes have heated up with the onset of spring and this has tended to strengthen the circumpolar winds. Perhaps the last bit of seasonal change that can have this effect given the alterations to atmospheric circulation produced by a human-forced warming of the globe and a particular high concentration of this added heat centering on the Arctic.

Ironically, the time-frame of late February to mid-March is when the higher Latitudes in the Northern Hemisphere tend to experience their coldest temperatures. During 2016, we did see some of this atmospheric effect take hold. As a result, temperatures in the High Arctic above the 80 degree North Latitude line have fallen from record warm readings in late February to far above average warm temperatures over recent days.

Temperature above 80 north

(Ever since Early January, Arctic temperatures have been in near record or record warm ranges. This consistent heat has resulted in the warmest Winter temperatures ever experienced for the region above the 80 North Latitude Line. Image source: CIRES/NOAA.)

Today, another very strong pulse of warmth is building up through the region of the Barents and Greenland seas. This heat pulse representing yet another warm wind event for 2016. Another very strong south to north atmospheric draw flooding in front of yet another chain of strong low pressure systems in the North Atlantic. A flow of heat drawn up from the tropics and delivered to the Arctic that will briefly drive regions near the North Pole above the -2 C melting point of sea ice even as a wide wedge of 20 degree Celsius above average temperatures invades a region stretching from Northeast Greenland to the North Pole and back to the isle of Novaya Zemlya in Russia.

Overall, the sea ice in this region is much weaker than normal. Volume is greatly thinned as both the relentless heat influxes and strong sea ice export through the Fram Strait this Winter has leeched the area of thick ice. Most sea ice measures show a loss in concentration and volume for this area. But we’ll know more as the Earth tilts back toward the sun and visible satellite coverage again takes in the entire Arctic.

Given atmospheric changes taking place with Spring — where Continental and lower Latitude warming hold greater sway over atmospheric circulation — this may be the last burst of heat we see through this zone that produces such high temperature anomalies. A grand finale for the record warm Arctic Winter of 2016.

Warm North Atlantic Winds

(Warm North Atlantic Winds are predicted to blow into the Arctic yet again on Saturday, March 12. These winds will push temperatures over a broad region of sea ice to near freezing, driving such anomalously warm temperatures all the way to the North Pole. Image source: Earth Nullschool.)

To be clear, long range model forecasts do identify far above average sea surface temperatures and above average 2 meter air temperatures for this region through Spring and on into Summer. However, the Arctic overall is not as capable of producing such high temperature anomalies during Summer as it is during Winter when the human supplied greenhouse gas overburden and the related warming of the oceans holds a much stronger sway — re-radiating an insane amount of heat throughout the long polar night.

High Arctic Temperature Anomalies Predicted to Fall-off For a Short While, Melt Potential Through Summer Looks Rather Bad

To this point, it appears the Arctic may be in for a brief respite on the 3-7 day horizon. GFS model runs indicate overall cooling for the region above the 66 North Latitude line and temperatures above 80 North may see their first period of near average temperatures since late December of 2015. This respite for the High Arctic, though, comes as temperatures in the Sea of Okhotsk, the Bering, and along Hudson Bay are expected to warm.

Arctic Sea Ice Area lowest on record

(Arctic sea ice area remains at record low levels during March of 2016. Image source: Cryosphere Today.)

It’s a mixed signal that may continue some of the very slight Arctic sea ice rejuvenation we’ve seen during March — with sea ice area still in record low territory, but with sea ice extent edging back to second lowest on record and just slightly above 2015.

To be clear, we’re at a very low launching pad for the start of melt season in 2016. Record low or near record low sea ice volumes in February and continuing record low area show that sea ice resiliency is pretty terrible at this time. Furthermore, Northern Hemisphere snow cover totals also at or near new record lows hint that warming of the land masses surrounding the Arctic may be very rapid come mid to late March and throughout April. To this point, 10 day Euro model runs show a tendency for rapid warming over the Northwest Territories, Alaska, the Bering Sea, the Sea of Okhotsk, the East Siberian Sea, and far Eastern Siberia during this period even as the thaw line pretty much everywhere jumps swiftly northward.

A fading record El Nino in the Eastern Pacific will also tend to result in ample excess Equatorial heat heading northward. As a result, the overall risk of strong sea ice melt through the Summer of 2016 remains very high.

Links:

The Polar Science Center

Wipneus

The Arctic Sea Ice Blog

Arctic Sea Ice Graphs

CIRES/NOAA

Climate Reanalyzer

Arctic Explorer

Earth Nullschool

Cryosphere Today

Euro Model Runs


Mangled Jet Stream, River of Moisture Set to Deliver Extreme Flooding to Mississippi Valley

The potential rainfall totals for a broad region centering just west of the Mississippi River Valley are absolutely extraordinary. For even a strong spring storm, this event may hit unprecedented levels. It’s the kind of abnormal event we’ve now come to expect in a world driven 1 C + warmer than 1880s levels by a merciless burning of fossil fuels that just won’t quit.

****

Mangled Jet Stream Aims River of Moisture at Central US and Gulf Coasts

Over the past few weeks, a record warm El Nino has been slowly cooling down in the Equatorial Pacific. One of the top three strongest events on record, this particular warming of sea surfaces in the Pacific coincided with never before seen global heat as atmospheric CO2 levels spiked to above 405 parts per million on some days during February and March. The record warm sea surface and atmosphere held a never before seen excess of water vapor and moisture in suspension — primarily over the Equatorial Ocean zones. And as the world hit peak temperatures during early March and began to back off a little, some of that massive excess of moisture was bound to wring out somewhere.

For such events, all you really need is a trigger. And over the past two days, forecast models have been predicting an insane dip in the Jet Stream. Today, we got it. A raging storm track over the Northeast Pacific roared its 200+ mph upper level winds down over the Western US and Mexico. It drew deep from a rich, record global warming intensified, low Latitude moisture flood as its tail end reached all the way to the Equator itself. This insanely deep trough then turned north, aiming an unprecedented atmospheric moisture flood fire-hose style at the storm-tossed airs above the Mississippi River Valley.

Huge Dip in the Jet Stream March 8

(An extreme dip in the Jet Stream stretching through the Western US and all the way to the Equator is aiming both Pacific and Gulf moisture at the Mississippi River Valley today. The severe storms that are now firing and that are predicted to continue over the next three days may result in an unprecedented flooding event. Image source: Earth Nullschool.)

Severe storms are now firing off along a line stretching from the Gulf Coast to Nebraska. Coastal flooding, gale force winds, severe thunderstorms, tornadoes and hail are all expected as part of what can best be described as an epic storm system. But perhaps the most dangerous feature of the whole event is the severe rainfall totals that are expected to accumulate over the next three days.

Foot of Rain or More over Mississippi River Valley in the Next Three Days

Rain that is expected to be extraordinarily intense and long lasting. Reports from the Weather Channel indicated the risk for rainfall rates in the range of 3 inches an hour in some of the heaviest storm cells. Meanwhile, model runs earlier today indicated a potential for as much as 20 Inches of rain for some regions over the next 72 hours. Official NOAA models are now indicating nearly a foot in peak rainfall regions in Eastern Texas and Western Louisiana with the potential for greater than five inches along a broad swath running from the Gulf Coast through to Illinois.

72 Hour rainfall totals NOAA NCEP

(NOAA predicts very extreme rainfall totals over a broad region of the Mississippi River Valley during the next three days. Image source: NOAA’s Weather Prediction Center.)

According to NBC news reports, more than 15 million Americans are falling under risk of flooding from this very severe weather system. One that has been compared with the South Carolina floods of 2015 due to its potential to produce severe rains. But one that is also much wider in coverage — capable of impacts over a far broader region.

In addition, those flooding rains will fall all over the Mississippi River Valley — resulting in an extreme threat of very severe flooding all along this great river and its tributaries. As such, we are likely to be dealing with a flood situation for many days after the initial rain event tapers off. With Spring on the way, with so much moisture still bleeding off the Pacific, with a record level of global warming greatly amping up the hydrological cycle, and with a trough development tendency setting up for this region — this particular extreme rainfall event may, sadly, be but the first of many this season.

Links:

Earth Nullschool

NOAA El Nino

NOAA’s Weather Prediction Center

The Roof is On Fire

Models Predict Big Jet Stream Dip

National Weather Service Radar Loop

National Weather Service Alerts Map

The Weather Network

The Weather Channel

Texas, Oklahoma and Louisiana Face Drenching, Possible Tornadoes

Hat Tip to DT Lange

Hat Tip to Anthony Sagliani

Climate Change — Why 2016 May be the Most Important Election in US History

“I have talked to scientists all over the world. And what they are telling me — if we don’t get our act together — this planet could be 5-10 degrees warmer by the end of this Century! Cataclysmic problems for this planet! This is a national crisis!” — Bernie Sanders, Michigan Democratic Debate, March 6th.


(Bernie Sanders pledges to end fracking and tackle climate change in the Michigan Democratic debate last night.)

Last night, Bernie Sanders and Hillary Clinton gave a spirited debate over substantive issues. To someone who respects political figures who address problems and actively seek solutions, it was a welcome respite from the most recent low-information, public action denigrating, Republican wrangle. But one two-minute segment in Hillary and Bernie’s exchange really stood out for me. And it’s the clip streaming above where Bernie Sanders tackles the critical issue that is human-caused climate change.

And we should be very clear. Bernie is absolutely right — it’s a national crisis that will become an existential crisis if we don’t act swiftly, if we don’t act well, and if we aren’t also pretty amazingly lucky.

A Tough, Tough Issue of Critical Importance

Like many who write on this issue, I often find it difficult not to fall into crushing despair. With each post, it’s like seeing the life-blood of our world slowly drip away. It’s a tough, tough issue.

The posts appear to have an impact. There’s a vigorous discussion going on in the comments section. People are actively identifying problems, taking action, doing their best to contribute to solutions. To spread the word. To develop a sense of urgency. But despite the response here, despite the actions of a vast spectrum of other responsible groups around the world, and despite a growing warning and outcry from the scientific community, the world itself seems to be moving far too slowly to effectively confront the crisis.

The Keeling Curve March

(Atmospheric CO2 is now reaching levels comparable to those seen during the Middle Miocene. A period of time when the world was both much warmer than today and sea levels were far, far higher. Each year that greenhouse gas emissions continue, more heat, more sea level rise, and more future dangerous climate change is locked in. Image source: The Keeling Curve.)

To be clear, fossil fuel burning now pumps out enough heat trapping gas to equal one Permian Extinction producing volcanic prominence active on every major continent on the Earth and all going off at the same time. It’s a really big deal. One that people probably aren’t quite so aware of because, well, volcanoes are individually more spectacular than billions of tailpipes, coal and gas turbines, and smokestacks. All efficiently, but relatively quietly, throwing up that hothouse extinction producing pallor. One that hangs invisible in the air. But one whose effects are all-too-real.

The 2 C Goal is Pretty Bad; Continued Burning is Far Worse

Attempts to face down this growing threat became apparent in a flurry of new urgency at the Paris Climate Summit. There the strongest international agreement yet on preventing catastrophic climate change was forged as global climate policy makers appeared to have begun to get a whiff of the gravity of our current situation. But the new agreement doesn’t yet produce enough in the way of committed action to prevent 2 C warming this Century. And it’s pretty clear that Paris’s policies will meet stiff opposition from fossil fuel special interests — who exert far too much influence and control over the world’s various political bodies and governing systems even as they have managed to block many helpful policies and pollute public awareness through the active promotion of climate change denial.

2 C warming by 2100, even if we were to make the monumental strides necessary to achieve that limit, is by itself pretty terrible. Though nowhere near as catastrophic as the 3, 4, 5 or 6 C levels of heating that are entirely possible if the world keeps going all out to extract and burn coal, oil and gas, it’s a rate of temperature increase not seen in 55 million years and a level of warming not seen in 2-3 million years. It locks in severe heatwaves the likes of which we’ve never seen before, terrible wildfires, extraordinary rainfall and droughts, monster storms, city-wrecking sea level rise, habitat loss, ocean health decline, glacial melt on a scale that changes the very complexion of the Earth, sea ice winnowing away to a shadow of its former coverage, amplifying Earth System feedbacks, and a whole host of other problems. It also means that the Earth continues to heat up for hundreds of years more unless greenhouse gasses are somehow drawn down — resulting in a long term warming in the range of 4 C so long as climate sensitivity is about what we’ve come to expect from our study of paleoclimate.

Probably the Worst Crisis Humankind has Ever Faced — Which Makes the 2016 Election Absolutely Critical

Even achieving that rather difficult but probably survivable future will necessitate very swift action. For each year in which a peak in human greenhouse gas emissions is delayed, the more difficult it becomes to limit future warming.

Rates of warming based on global emissions and climate sensitivity

(Amount of warming this Century expected under differing emissions reduction and climate sensitivity scenarios. In the above graph TCRE stands for transient climate response to emissions. It’s basically how much warming you get short term as a result of accumulated greenhouse gasses in the atmosphere. Note that greenhouse gas emissions need to decline by more than 2 percent per year starting now if we are to have much confidence in avoiding 2 C warming this Century. It’s also worth noting that even a slow decline rate from near now likely locks in about 3 C warming this Century. Image source: Impact of Delay in Reducing CO2 Emissions.)

To this point, if the best case global policy can currently produce is a future in which the world’s temperatures warm by 2 C by 2100, then we have a serious problem. If that’s the case, then what it really boils down to is the fact that civilization this Century faces an existential crisis. A level of geophysical upheaval worse than the end of the last ice age that may all end up being crammed into the next 300 years with a good chunk of it happening this Century.

This is one of the toughest challenges humankind has ever faced. And its solutions require an unprecedented level of government involvement and activism. It’s for these reasons why it’s pretty amazing that climate change isn’t the central subject of every Presidential debate this year. For who we elect as President will have a significant and important role to play in confronting or facing down this crisis. But so far, candidate comments on climate change have been limited to only the briefest of questions and responses on the democratic side, and to a chilling and all-encompassing climate change denial on the republican side.

This is not how a nation readies itself to effectively confront a very serious crisis. Whispers and denial are not enough. We need strong statements and bold action.

To my mind, so far, Bernie Sanders has been the only candidate to address the problem with the level of urgency the situation warrants. And I suspect he would speak to it more if the question and answer format of the recent debates were not so limiting. Hillary’s own statements seem positive, but it’s pretty clear that much of this is due to Bernie’s own responsible and persistent prodding. A little more ardor on her part would be reassuring.

But the point here is that, according to many of the world’s top climate scientists, we are in a worsening global crisis at this time. If there was ever a time when government climate policy should be front and center as a political issue, then it is now. Rapid and radical efforts are now necessary and warranted. So we should praise Bernie for raising what is an absolutely critical issue. And we should criticize pretty much everyone else for downplaying and denying it.

Links:

Bernie Sanders on Fracking and Climate Change

Impact of Delay in Reducing CO2 Emissions

The Keeling Curve

Hat tip to Caroline (Thank you for your activism)


Dr. James Hansen: “We Have a Global Emergency” Dangerous Heat to Render Parts of the World Practically Uninhabitable by 2100

There’s a tragic new danger lurking in the world. Something that’s arisen from a mass burning of fossil fuels on an epic scale that now pumps out more than 100 times the greenhouse gas emission from all the volcanoes in all the world combined. Something that’s been building heat in our atmosphere at unprecedented rates. Something that’s been increasingly setting off the strange and deadly Hothouse Mass Casualty Events (HMCE). Events that appear ready to hit the innocent, the poor, and the vulnerable among us the hardest.

Over the past few decades, HMCEs, have occurred with increasing frequency during periods of extreme heat and drought that exceeded the scope and intensity of past heatwaves. These events resulted both in mass human mortality and in medical infrastructure crippling waves of heat injuries. These new, deadly heatwaves occurred in a world that was about 0.6 to 0.8 C hotter than 1880s averages. But as of the past two years, the global heat factor has cranked still higher — hitting 0.9 to 1.1 C above 1880s levels during 2014 and 2015 — and further increasing the likelihood of these dangerous events.

And according to a new scientific report from Dr. James Hansen — these events are about to become an ever-more permanent part of the global landscape. In essence, if fossil fuel burning continues, the poorest parts of the world who have contributed the least to the climate change problem will experience HMCEs with such a high frequency that many of these regions are going to become practically uninhabitable by the end of this Century. It’s a level of unfair and unequal treatment that’s difficult to stomach. For those who continue to burn fossil fuels, who continue to push fossil fuel burning through lobbying, market dominance, and short-sighted government policies, and who plan to burn these harmful fuels on into the future now appear to be involved in a kind of combined act of inflicted human habitat destruction and possible genocide.

*****

On Wednesday, Dr. James Hansen, former head of GISS NASA, and one of the world’s foremost authorities on human-caused climate change, dropped another bombshell on an in-the-know scientific community that appears to be struggling to keep up with the velocity of what has now become a Global Warming Emergency. Hansen’s new report first takes a look at warming in retrospect — using historical temperature and extreme warming event data to show that the world has been radically altered by a rampant fossil fuel emission. Then, Hansen takes a look forward into what appears to be an increasingly hot and dangerous greenhouse gas warmed future.

TimeBombFig16

(Through late 2015, Hansen’s data showed that human fossil fuel emissions continued along a path just above IPCC worst case ranges, and flirting with the lower edge of absolute worst case ranges. Hansen here identifies these carbon emissions as a global warming ‘Time Bomb.’ Image source: Dr. James Hansen.)

No More Cool Summers For Some Parts of the World

The paper found that the frequency of extreme heating events increased over the globe, even as the likelihood of cool or cold weather fell off. Though every region showed an increase in warm or hot events and a drop off in cool or cold events, some regions experienced more warming than others.

For example, in the US, summers cooler than the 1951 to 1980 average now occur only 19 percent of the time. Meanwhile, the frequency of extreme heating events 3 standard deviations outside the mid 20th Century average increased by an order of magnitude to 7 percent. These are strong shifts toward hotter summers for the US. But they are somewhat minor in comparison to shifts occurring in other parts of the world.

Hansen notes that in the Middle East and Mediterranean, rates of summer warming have increased to the point that there are now no summers that are cooler than average even as the period of summer seasonality has grown “considerably longer.” This statement is worth thinking about for a bit — essentially what’s happened is cool summers below the mid 20th Century average have been basically wiped out in the Med and Middle East. Cool summers there are a thing of a much less dangerous and far more pleasant past.

And looking at Hansen’s graph below we find that the impact of warming in many highly populated regions of the world is already far greater than within the United States:

Shifts to Warm and Hot Summers

(Shift to hotter Summers and Winters is now producing a greatly increased frequency of extremely hot summers even as it is steadily eliminating the likelihood of cool summers. Image source: Regional Climate Change and National Responsibilities.)

As the world continues to heat up, there is rising risk to human beings over broad regions. This is due to the fact that a warming world increases the latent heat of the atmosphere. When Ocean surfaces warm to above 35 degrees Celsius, this results in an increase in the amount of warm moisture in suspension in the atmosphere. For human beings, it makes it more difficult for heat to transfer way from the skin through evaporative cooling. At a 35 degree C Wet Bulb reading, the human body’s ability to cool itself breaks down — resulting in high risk of heat stroke and death if exposure continues for 1-2 hours.

But these are the kinds of conditions we’ll be increasingly putting into effect if human fossil fuel burning continues. Hansen notes:

The tropics and the Middle East in summer are in danger of becoming practically uninhabitable by the end of the century if business-as-usual fossil fuel emissions continue, because wet bulb temperature could approach the level at which the human body is unable to cool itself under even well-ventilated outdoor conditions.  Lesser warming still makes life more difficult and reduces productivity in these regions, because temperatures are approaching the limit of human tolerance and both agricultural and construction work are mainly outdoor activities.

Health-Risks, Violence, Climate Inequality and Responsibility

In addition to increasing the likelihood of hothouse mass casualty events, severe heatwaves, and increasing drought prevalence, Hansen notes added impacts to human beings and human societies. As we’ve seen with the Zika virus, disease vectors spread into higher Latitudes as the world warms — increasing the range of harmful and deadly tropical illnesses. Furthermore, studies indicate that violence increases dramatically in hotter regions. With each standard deviation increase in temperature patterns, group on group conflict has been observed to increase by 14 percent. This would already have increased conflict in the Med and Middle East by nearly 30 percent. For many regions of the world, if fossil fuel burning continues, warming is expected to shift a further 3-7 standard deviations off baseline. If the violence study findings are correct, this could double instances of group on group conflict for some parts of the world.

Carbon emissions cumulative by country

(Unequal climate change contributions, unequal impacts. Image source: Regional Climate Change and National Responsibilities.)

One final assertion of Hansen’s paper is that warming impacts and contributions are unequal. People living in Asia and Africa are seeing disproportionate warming even as they have contributed very little to the problem. And many of the regions now experiencing above average rates of warming could be rendered practically uninhabitable by Century’s end. People in the United States, Canada, Australia, Russia, Japan, and Northern Europe, though also suffering warming impacts, have been among those contributing the most to the problem and seeing the lowest rates of change in the form of extreme heat related events (though those experiencing ever more frequent droughts in the US Southwest may beg to differ). The Middle East’s own moderate national emissions contribution to global warming (though a rather high export contribution in the form of oil and gas sales) is matched by an extreme commitment to dangerous heatwaves for the region. This distribution represents a highly unequal and unfair spread of climate impacts and climate change responsibility. Yet one more reason why the industrial nations of the world should be getting their act together for a concerted and rapid transition away from fossil fuel use.

It’s worth noting that the Hansen paper does not assess the impact of other climate change related events such as extreme rainfall or sea level rise on regions that have contributed the most to the problem. It’s likely that vulnerable cities would see a widely distributed impact from the kind of multi-meter sea level rise Hansen warns is possible rippling across the globe. Portions of the US East and Gulf Coasts, in particular, have an extraordinary vulnerability to this climate change related threat.

Links:

Regional Climate Change and National Responsibilities

Wet Bulb Temperatures

Wet Bulb Temperatures 35 C

Hat tip to TodaysGuestIs


The Roof is On Fire — Looks like February of 2016 Was 1.5 to 1.7 C Above 1880s Averages

Before we go on to explore this most recent and most extreme instance in a long string of record-shattering global temperatures, we should take a moment to credit our climate change denier ‘friends’ for what’s happening in the Earth System.

For decades now, a coalition of fossil fuel special interests, big money investors, related think tanks, and the vast majority of the republican party have fought stridently to prevent effective action to mitigate the worst effects of climate change. In their mad quest, they have attacked science, demonized leaders, gridlocked Congress, hobbled government, propped up failing fossil fuels, prevented or dismantled helpful regulation, turned the Supreme Court into a weapon against renewable energy solutions, and toppled industries that would have helped to reduce the damage.

Through these actions, they have been successful in preventing the necessary and rapid shift away from fossil fuel burning, halting a burgeoning American leadership in renewable energy, and in flooding the world with the low-cost coal, oil, and gas that is now so destructive to Earth System stability. Now, it appears that some of the more dangerous impacts of climate change are already locked in. So when history looks back and asks — why were we so stupid? We can honestly point our fingers to those ignoramuses and say ‘here were the infernal high priests who sacrificed a secure future and our children’s safety on the altar of their foolish pride.’

Worst Fears For Global Heating Realized

We knew there’d be trouble. We knew that human greenhouse gas emissions had loaded the world ocean up with heat. We knew that a record El Nino would blow a big chunk of that heat back into the atmosphere as it began to fade. And we knew that more global temperature records were on the way in late 2015 and early 2016. But I have to say that the early indications for February are just staggering.

Extreme Global Warming

(The GFS model shows temperatures averaged 1.01 C above the already significantly hotter than normal 1981-2010 baseline. Subsequent observations from separate sources have confirmed this dramatic February temperature spike. We await NASA, NOAA, and JMA observations for a final confirmation. But the trend in the data is amazingly clear. What we’re looking at is the hottest global temperatures since record keeping began by a long shot. Note that the highest temperature anomalies appear exactly where we don’t want them — the Arctic. Image source: GFS and M. J. Ventrice.)

Eric Holthaus and M. J. Ventrice on Monday were the first to give warning of an extreme spike in temperatures as recorded by the Global satellite record. A slew of media reports followed. But it wasn’t until today that we really began to get a clear look at the potential atmospheric damage.

Nick Stokes, a retired climate scientist and blogger over at Moyhu, published an analysis of the recently released preliminary data from NCAR and the indicator is just absolutely off the charts high. According to this analysis, February temperatures may have been as much as 1.44 C hotter than the 1951 to 1980 NASA baseline. Converting to departures from 1880s values, if these preliminary estimates prove correct, would put the GISS figure at an extreme 1.66 C hotter than 1880s levels for February. If GISS runs 0.1 C cooler than NCAR conversions, as it has over the past few months, then the 1880 to February 2016 temperature rise would be about 1.56 C. Both are insanely high jumps that hint 2016 could be quite a bit warmer than even 2015.

It’s worth noting that much of these record high global temperatures are centered on the Arctic — a region that is very sensitive to warming and one that has the potential to produce a number of dangerous amplifying feedbacks. So we could well characterize an impending record warm February as one in which much of the excess heat exploded into the Arctic. In other words — the global temperature anomaly graphs make it look like the world’s roof is on fire. That’s not literal. Much of the Arctic remains below freezing. But 10-12 C above average temperature anomalies for an entire month over large regions of the Arctic is a big deal. It means that large parts of the Arctic haven’t experienced anything approaching a real Arctic Winter this year.

Looks Like The 1.5 C Threshold Was Shattered in the Monthly Measure and We May Be Looking at 1.2 to 1.3 C+ Above 1880s For all of 2016

Putting these numbers into context, it looks like we may have already crossed the 1.5 C threshold above 1880s values in the monthly measure during February. This is entering a range of high risk for accelerating Arctic sea ice and snow melt, albedo loss, permafrost thaw and a number of other related amplifying feedbacks to a human-forced heating of our world. A set of changes that will likely add to the speed of an already rapid fossil fuel based warming. But we should be very clear that monthly departures are not annual departures and the yearly measure for 2016 is less likely to hit or exceed a 1.5 C departure. It’s fair to say, though, that 1.5 C annual departures are imminent and will likely appear within 5-20 years.

If we use the 1997-1998 El Nino year as a baseline, we find that global temperatures for that event peaked at around 1.1 C above 1880s averages during February. The year, however, came in at about 0.85 C above 1880s averages. Using a similar back of napkin analysis, and assuming 2016 will continue to see Equatorial sea surface temperatures continue to cool, we may be looking at a 1.2 to 1.3 C above 1880s average for this year.

CFSv2

(El Nino is cooling down. But will it continue to linger through 2016? Climate Prediction Center CFSv2 model ensembles seem to think so. The most recent run shows the current El Nino restrengthening through Fall of 2016. Such an event would tend to push global annual temperatures closer to the 1.5 C above 1880s threshold. It would also set in place the outside potential for another record warm year in 2017. It’s worth noting that the NOAA consensus is still for ENSO Neutral to weak La Nina conditions by Fall. Image source: NOAA’s Climate Prediction Center.)

NOAA is currently predicting that El Nino will transition to ENSO neutral or a weak la Nina by year end. However, some model runs show that El Nino never really ends for 2016. Instead, these models predict a weak to moderate El Nino come Fall. In 1998, a strong La Nina began to form — which would have helped to suppress atmospheric temperatures by year-end. The 2016 forecast, however, does not seem to indicate quite as much atmospheric cooling assistance coming from the world ocean system. So end 2016 annual averages may push closer to 1.3 C (or a bit higher) above 1880s levels.

We’ve Had This Warming in the System for a While, It was Just Hiding Out in the Oceans

One other bit of context we should be very clear on is that the Earth System has been living with the atmospheric heat we’re now seeing for a while. The oceans began a very rapid accumulation of heat due to greenhouse gas emissions forcing during the 2000s. A rate of heat accumulation in the world’s waters that has accelerated through to this year. This excess heat has already impacted the climate system by speeding the destabilization of glaciers in the basal zone in Greenland and Antarctica. And it has also contributed to new record global sea ice losses and is a likely source of reports from the world’s continental shelf zones that small but troubling clathrate instabilities have been observed.

Nature Global Ocean Heat Accumulation

(Global ocean heat accumulation has been on a high ramp since the late 1990s with 50 percent of the total heat accumulation occurring in the 18 years from 1997 though 2015. Since more than 90 percent of the greenhouse gas heat forcing ends up in the world ocean system, this particular measure is probably the most accurate picture of a rapidly warming world. Such a swift accumulation of heat in the world’s oceans guaranteed that the atmosphere would eventually respond. The real question now is — how fast and far? Image source: Nature.)

But pushing up atmospheric heating will have numerous additional impacts. It will put pressure on the surface regions of global glaciers — adding to the basal melt pressure jump we’ve already seen. It will further amplify the hydrological cycle — increasing the rates of evaporation and precipitation around the world and amplifying extreme droughts, wildfires and floods. It will increase peak global surface temperatures — thereby increasing the incidence of heatwave mass casualty events. It will provide more latent heat energy for storms — continuing to push up the threshold of peak intensity for these events. And it will help to accelerate the pace of regional changes to climate systems such as weather instability in the North Atlantic and increasing drought tendency in the US (especially the US Southwest).

Entering the Climate Change Danger Zone

The 1-2 C above 1880s temperatures range we are now entering is one in which dangerous climate changes will tend to grow more rapid and apparent. Such atmospheric heat has not been experienced on Earth in at least 150,000 years and the world then was a much different place than what human beings were used to in the 20th Century. However, the speed at which global temperatures are rising is much more rapid than anything seen during any interglacial period for the last 3 million years and is probably even more rapid than the warming seen during hothouse extinction events like the PETM and the Permian. This velocity of warming will almost certainly have added effects outside of the paleoclimate context.

Arctic Degree Days Below Zero Anomaly

(Anyone looking at the temperature anomaly graph on the top of this post can see that a disproportionate amount of the global temperature anomaly is showing up in the Arctic. But the region of the High North above the 80 degree Latitude line is among the regions experiencing global peak anomalies. There, degree days below freezing are at the lowest levels ever recorded — now hitting a -800 anomaly in the Arctic record. In plain terms — the less degree days below freezing the High Arctic experiences, the closer it is to melting. Image source: CIRES/NOAA.)

One final point to be clear on is then worth repeating. We, by listening to climate change deniers and letting them gum up the political and economic works, have probably already locked in some of the bad effects of climate change that could have been prevented. The time for pandering to these very foolish people is over. The time for foot-dragging and half-measures is now at an end. We need a very rapid response. A response that, at this point, is still being delayed by the fossil fuel industry and the climate change deniers who have abetted their belligerence.

Links:

The Old Normal is Now Gone

NASA GISS

Hot, Hot, Hot

Michael J. Ventrice

No Winter for the Arctic in 2016

Big Jump in Surface and Satellite Temperature Measures

NOAA’s Climate Prediction Center

Industrial Era Global Ocean Heat Uptake Doubles in Recent Decades

CIRES/NOAA

Republican Governors Sue to Stop Clean Power Plan


Warren Buffett’s Disaster Capitalism — Downplaying Climate Change Risks, Attacking Solar, Increasing Insurance Premiums

How bad is climate change related risk? Should investors be worried? Are investments safe from this risk?

*****

Warren Buffett’s recent letter to shareholders attempts to answer these questions — as they relate to his investment firm’s climate change mitigations as well as its insurance industry climate risk exposure. His statement, and related framing of climate change risk, is one coming from the point of view of one of the wealthiest men in the world. It’s an announcement that comes fresh off a battle with solar energy companies and renewable energy advocates in Nevada — where Buffett’s actions and lobbying essentially cost Nevada years of solar and renewable energy development. And it’s one that appears to be both flawed in its outlook and cynical in its application.

Save Rooftop Solar

(A number of big money investors like the Kochs and Buffett have been lobbying to squash a burgeoning rooftop solar industry that empowers individual homeowners to make the responsible choice to stop using fossil fuels for power generation. This action appears to be aimed at protecting legacy fossil fuel assets that are inflicting serious and ramping harms to the global climate system. Image source: Vote Solar.)

Buffett’s general view, as with numerous big-money investors of his generation, is to both downplay climate change and to cast it in the most narrow of market contexts. His particular point of reference, like those of many of his peers, is rather sadly deficient. One that urges the inflation of vulnerable insurance company assets during a period when damages and losses are expected to increase.

Downplaying Risks, Increasing Premiums

Here are a few highlights of his statement to shareholders:

“Last year, [Berkshire Hathaway Energy] BHE made major commitments to the future development of renewables in support of the Paris Climate Change Conference. Our fulfilling those promises will make great sense, both for the environment and for Berkshire’s economics… BHE has invested $16 billion in renewables and now owns 7 percent of the country’s wind generation and 6 percent of its solar generation. Indeed, the 4,423 megawatts of wind generation owned and operated by our regulated utilities is six times the generation of the runner-up utility. We’re not done.

I am writing this section because we have a proxy proposal regarding climate change to consider at this year’s annual meeting. The sponsor would like us to provide a report on the dangers that this change might present to our insurance operation and explain how we are responding to these threats.

It seems highly likely to me that climate change poses a major problem for the planet. I say ‘highly likely’ rather than ‘certain’ because I have no scientific aptitude and remember well the dire predictions of most ‘experts’ about Y2K. It would be foolish, however, for me or anyone to demand 100% proof of huge forthcoming damage to the world if that outcome seemed at all possible and if prompt action had even a small chance of thwarting the danger.

This issue bears a similarity to Pascal’s Wager on the Existence of God. Pascal, it may be recalled, argued that if there were only a tiny probability that God truly existed, it made sense to behave as if He did because the rewards could be infinite whereas the lack of belief risked eternal misery. Likewise, if there is only a 1% chance the planet is heading toward a truly major disaster and delay means passing a point of no return, inaction now is foolhardy. Call this Noah’s Law: If an ark may be essential for survival, begin building it today, no matter how cloudless the skies appear.

It’s understandable that the sponsor of the proxy proposal believes Berkshire is especially threatened by climate change because we are a huge insurer, covering all sorts of risks. The sponsor may worry that property losses will skyrocket because of weather changes. And such worries might, in fact, be warranted if we wrote ten- or twenty-year policies at fixed prices. But insurance policies are customarily written for one year and repriced annually to reflect changing exposures. Increased possibilities of loss translate promptly into increased premiums.

Think back to 1951 when I first became enthused about GEICO. The company’s average loss-per-policy was then about $30 annually. Imagine your reaction if I had predicted then that in 2015 the loss costs would increase to about $1,000 per policy. Wouldn’t such skyrocketing losses prove disastrous, you might ask? Well, no.

Over the years, inflation has caused a huge increase in the cost of repairing both the cars and the humans involved in accidents. But these increased costs have been promptly matched by increased premiums. So, paradoxically, the upward march in loss costs has made insurance companies far more valuable. If costs had remained unchanged, Berkshire would now own an auto insurer doing $600 million of business annually rather than one doing $23 billion.

As a citizen, you may understandably find climate change keeping you up nights. As a homeowner in a low-lying area, you may wish to consider moving. But when you are thinking only as a shareholder of a major insurer, climate change should not be on your list of worries.

A Failure to Understand the Nature of Systemic Risk

After reading this statement, it’s a bit perplexing why even monied investors like Warren Buffett aren’t convinced the impacts of a ramping, fossil fueled, climate change will be dangerous and disruptive to the bottom line. Perhaps it is due to an inherent flaw of a money-centric worldview. But even investors can be practical-minded and decide not to throw good money after bad — as is now the case with fossil fuels and climate change.

As such, we might be kind to say that Buffett’s statement here is more than a bit short-sighted. He fails to recognize the basic and inherent link between the stability of his wealth and the stability of the climate system. He falsely equates 97 percent of scientists identifying a high risk of damages due to climate change with a host of unrelated issues including Y2K, a 1 percent chance of climate change danger and damage being realized (the risk is far higher), the great flood, and a cynical man’s view of the probability of the existence God. That’s not just comparing apples and oranges. That’s comparing a sirloin to a fruit salad.

Climate Change is Everywhere

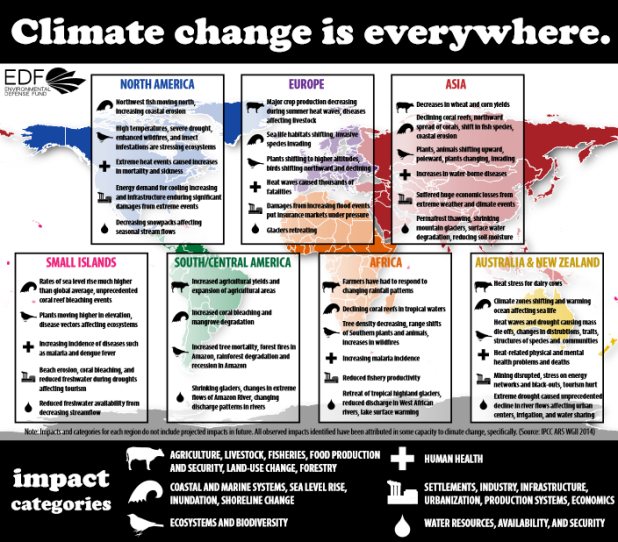
(The Environmental Defense Fund put together the above graphic based on the most recent 2014 Intergovernmental Panel on Climate Change report’s findings to illustrate the climate change related impacts that are already occurring around the world. For an increasing number of people, the damage has already happened and it’s steadily growing worse. Buffett’s comparison of an active crisis [which is already producing impacts] with Y2K [which was essentially a tempest in a teapot] is more than a little daft. Image source: EDF. Data Source: IPCC.)

Y2K was a human-based problem that impacted a limited, human-based system — computers. The fix was simple — change the dating mechanism. The potential impacts only affected that single system — how electronic devices functioned. And the transition was hyped in the media.

Climate change is a fossil fuel industry (and carbon emissions) caused problem that impacts broad and all-encompassing systems. It requires a tough fix — transitioning away from fossil fuel based energy, significant changes to land management, and a related and challenging draw-down of atmospheric carbon. And it is a problem that has been widely downplayed in the media.

And climate change has a much, much more widespread impact than Y2K. Everything from sea level, to weather, to the balance and health of life on the Earth is affected as the world warms. It impacts multiple systems upon which everyone relies. In the best case climate change generates weather that human civilization has never seen before (in the human context, these come in the form of the highest global temperatures ever experienced, highest peak storm potentials, worst droughts, fires and floods), it generates city-endangering sea level rise, and it generates or contributes to a decline in ocean health (a health that 1 billion people rely on for their food supply). In the worst case, if fossil fuel burning continues, it locks in multi-meter sea level rise, releases the permafrost and hydrate carbon, and kills most of the life in the ocean and on land in a hothouse mass extinction event. By comparison, the best case for Y2K was nada — no problem. The worst case was disruption in the use of electronic devices for a few years. Any threat analyst worth his salt would tell you — one of these things is not like the other.

As IPCC-identified warming-related damages and disruptions continue to unfold and worsen, people like Buffet should be seeing an inherent, long-term and ramping risk of instability within the markets. Climate change is not just about insurance risk. It’s about the loss of cities and the destabilization of the nations that global marketplace relies upon to remain viable. Markets can respond to these instances if the damage is limited and the pace of accumulated damage is slow. The problem is that when enough major instances occur rapidly, the viability of the markets and the related trade systems fail. Emergency action requires increasing state involvement. More and more of the productive capacity of nations goes to the effort of response, aid and dealing with conflict and instability. And traditional insurance systems in this case may suffer collapse or become non-viable.

If recent, and far milder than what we will be seeing in the future so long as fossil fuel burning doesn’t halt soon, events like the Syrian drought, the Russian fires, the Pakistan floods, mass migration from drowning Pacific Islands and drought stricken Middle Eastern countries, large increases in the frequency and intensity of wildfires, increasing rates of glacial melt, increasing rates of sea level rise, and an increasing inundation of the world’s delta regions on top of a 1 C jump in global temperatures since the 1880s, continue to expand and place strain on the developed world, then the threat to insurance market viability is all-too-real. Furthermore, if these instances haven’t convinced Buffett that the climate change threat is more real than a 1% probability of disruption, is already far more disruptive than Y2K, is entirely capable of producing great flood type catastrophes for many of the world’s coastal and flood-prone cities, and is worth responding to because one doesn’t want to take the chance that God does not coddle the destroyers of the Earth, then I don’t know what will.

Buffet’s Halfhearted Investments in Renewables Fail to Inspire Confidence

Buffett’s utility investments in wind and solar are certainly positive. However, he appears to be treating them as only a marginal hedge while still supporting a host of fossil fuel related investments. This is more a grown-up version of greenwash than anything else. To this point his fund’s rate of renewable energy and zero carbon fuels adoption is far too slow to meet even COP 21 commitments and far, far too slow to prevent seriously ramping harms. Furthermore, his actions in Nevada — which protected majority fossil fuel burning utilities from renewable energy adoption by citizens of that state in essentially crushing a burgeoning residential solar industry — were counter-productive to facing down the larger threat of climate change.

Buffett has failed to propose an alternative to fossil fuel dominated power generation in Nevada after playing what amounts to a cynical market dominance game there. Both his actions and his statements show a troubling lack of urgency and a larger failure to grasp the nature of the climate change threat. Even worse, his statement regarding insurance –‘the problem is solved in the market by just increasing rates and increasing the value of the major insurers’ — implies a short-sighted and amoral approach.

This proposal rings of the oft-derided disaster capitalism in that it seeks to profit from ramping harm. It also generates a market bubble in the form of over-capitalized insurers who are ever-more vulnerable to the large climate disruptions that will certainly be coming. For if the market essentially prices people out of insurance or if insurance companies do not make good on claims due to increasing damages, then faith in markets is eroded and market stability crumbles. Pretty quickly, it can get to every man for himself and that’s a level of volatility that is very tough for even the most cynical and money-minded of investors to game.

Effective leadership in markets, as in so many other fields, requires taking on the long view, providing constituents with security, and truthfully working to confront future risks. Buffett’s statements and actions are all sadly lacking in this regard.

Links:

Warren Buffet’s Quiet Bid to Kill Solar in the Western US

Vote Solar

EDF

IPCC

Warren Buffet’s Letter to Shareholders

Hat tip to Greg

Gale After Gale After Gale Dumped Two and a Half Feet of Rain Upon Scotland and Wales This Winter

Reports from the UK Met Office are in. And we can say now with confidence that the UK have never seen weather like what they experienced this Winter. It looks like a storm track super-charged by climate change really socked it to the region this year. That we’ve just passed a winter worse than the then record years of 2013 and 2014 — only two years on.

A Stormy New Climate State for the North Atlantic

For the UK and for North Atlantic weather stability in general, the sea surface temperature anomaly signature in the graphic below is bad news. The cool pool just south of Greenland (indicated by the swatch of pale blue) is a new climate feature. One that appears to be related to glacial ice melt outflow from Greenland.

North Atlantic Sea Surface Temperatures

(10 degree Celsius above average sea surface temperatures off North America in today’s ensemble sea surface temperature model graphic are just insanely warm. Ocean surface anomalies used to rarely exceed 2 degrees Celsius warmer than average. These spikes off North America are an indication that the Gulf Stream is backing up and that overturning circulation off Greenland is slowing down. Image source: RTG-SST/NCEP /US National Weather Service/Earth Nullschool.)

Such melt outflow tends to slightly freshen sea surface waters. Freshening waters keep more heat locked into the ocean’s depths. They tend to cool the surface waters. And they slow down an ocean overturning circulation that, in the North Atlantic, drives the flow of the Gulf Stream.

A slowing Gulf Stream delivers less heat to this zone even as it piles more heat up off the North American Coast. As a result, a warm west, cool east dipole tends to develop. In the cool region south of Greenland, unusually strong storms have developed more and more frequently — with a dramatic impact on UK weather. The storms feed on this temperature differential even as they have gorged on heat and moisture streaming northward in a meridional flow over Western Europe. The results this year were nothing short of record-shattering.

Hottest and Wettest

For England and Wales, with temperatures ranging about 2 degrees Celsius above average for December, January and February, 2015-2016 probably beat out 2007 and 1989 as the hottest Winter on record. Meanwhile, Wales and Scotland saw the most rainfall ever recorded — with totals for both regions hitting around 756 millimeters or about two and one half feet. That’s even more rainfall than the previous record stormy Winter of 2013 and 2014.

Yet one more Gale

(Yet one more gale sets up to hammer Ireland, the UK and Scotland by Thursday. Four months of ongoing stormy conditions appears set to continue through to at least mid-March. Image source: NOAA’s Ocean Prediction Center.)

These heavy rains set off severe floods and damaged homes, roads, and bridges throughout the UK with the worst damage focusing in on regions to the North. One heavy precipitation hot spot — Argyll — saw an extraordinary 1035 mm or 3.5 feet of rainfall over the three month period. The Met Office is quick to point out that though December, January and February were the wettest on record since 1910, heavy rainfall events began in November — resulting in what amounts to a relentless four month pounding as storm followed storm and flood followed flood.

And, it appears, this persistent and ongoing storm pattern has not yet changed. For the North Atlantic remains riled — setting up to hurl a new gale-force low at Ireland and the UK this week. With the weather pattern essentially stuck in stormy since November, folks from these regions have got to be asking — when’s it going to end? As storms continue to fire off in the dipole zone above, it appears it will likely last until at least mid-March.

Links:

The UK Met Office

NOAA’s Ocean Prediction Center

World Ocean Heartbeat Fading

RTG-SST/NCEP /US National Weather Service/Earth Nullschool

Winter of 2015/2016 Wettest on Record for Scotland

Mystery Deepens Around Greenland Cold Spot

Hat tip to Colorado Bob

Hat tip to TodaysGuestIs

Hat tip to Dan Combs