Extremely Warm Cyclone Predicted to Drive 50-60 F Above Average Temperatures Across North Pole

Our lexicon of what’s considered to be normal weather does not include February days in which temperatures at a North Pole shrouded in 24-hour darkness cross into above freezing ranges. But that’s exactly what some of our more accurate weather models are predicting will happen over the next five days.

Another Unusually Warm and Powerful Storm

During this time, a powerful 950 to 960 mb low is expected to develop over Baffin Bay. Hurling hurricane force gusts running from the south and digging deep across the North Atlantic, Barents, and Arctic Ocean, the low is projected to drive a knife of 50-60 F above average temperatures toward the North Pole by February 5th.

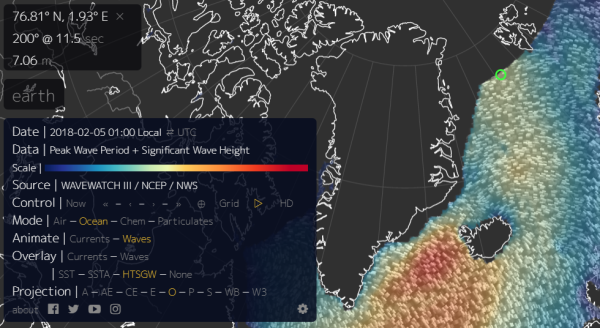
(20-25 foot surf heading for the increasingly fragile sea ice in this February 4 wave model forecast. Note the 30-40 foot waves off Iceland and associated with the same storm system that is predicted to bring above freezing temperatures to the North Pole on February 5th. Image source: Earth Nullschool.)

These warm winds are predicted to bring above freezing temperatures to areas that typically see -20 to -30 F readings in February. They are expected to rage over a sea ice pack that is at record low levels. And if the storm emerges, it will hammer that same dwindling ice pack with 20 to 25 foot or higher surf.

Fragile Arctic Sea Ice Faces a Hammering

Presently, Arctic sea ice extent is trending about 200,000 square kilometers below record lows set just last year for the period of late February. And recent scientific research indicates that warm winter storms like the one that is now predicted to form can have a detrimental impact on sea ice.

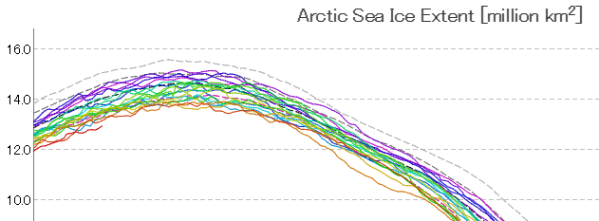
(Arctic sea ice extent is presently at around 13 million square kilometers [bottom red line] — a new record low for this time of year. It should be around 15 million square kilometers and would be if the world hadn’t warmed considerably since the 1980s. Image source: JAXA.)

Not only do the storms bring warmer temperatures with them — a kind of heat wave that interrupts the typical period of winter freezing — they also drive heavy surf into a thinner and weaker ice pack. The surf, drawn up from the south churns warmer water up from the ocean depths. And the net effect can dissolve or weaken large sections of ice.

The presently developing event is expected to begin to take shape on February 4th, with warm gale and hurricane force winds driving above freezing temperatures near or over the North Pole on February 4th – 6th. To say that such an event, should it occur, would be practically unprecedented is the common understatement of our time. In other words, this is not typical winter weather for the North Pole. It is instead something we would expect to see from a global climate that is rapidly warming and undergoing serious systemic changes.

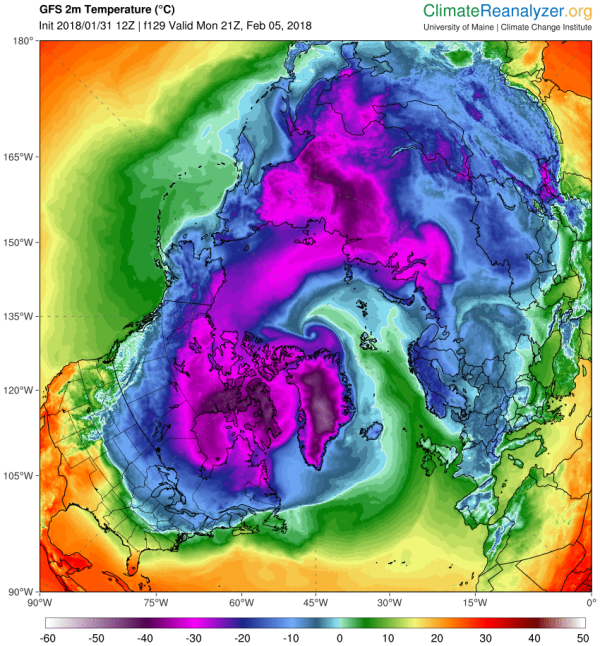
(February 5 GFS model run shows above freezing temperatures crossing the North Pole. Temperatures in this range are between 50 and 60 degrees [F] above average for this time of year. If the extremely warm cyclone event occurs as predicted, it will be a clear record-breaker. It will also further harm Arctic sea ice levels that are already in record low ranges. Image source: Climate Reanalyzer.)

Extreme Cyclone Beneath an Extreme Jet Stream

In the predicted forecast we see more of the extreme jet stream waves that Dr. Jennifer Francis predicted as an upshot of human-forced polar amplification (a condition where the poles warm faster than the rest of the globe under a larger warming regime). The particular wave in question for the present forecast involves a high amplitude ridge running very far to the north over Svalbard and knifing on into the high Arctic. The facing trough over Baffin Bay, Greenland, and North America is also quite pronounced and elongated. A feature that appears to want to become a cut off bubble of displaced polar air in a number of the model forecasts.

High amplitude Jet Stream waves during Northern Hemisphere winter as a signature of global warming are predicted by Francis and others to generate greater temperature and precipitation extremes in the middle latitudes. They are a feature of the kind of stuck and/or upside down weather we’ve been experiencing lately where temperatures in the Northeast have been periodically colder than typically frigid locations in Alaska. These flash freezes have, at times, faded back into odd balmy days in the 50s and 60s (F) before plunging back into cold. But the overall pattern appears to get stuck this way for extended periods of time.

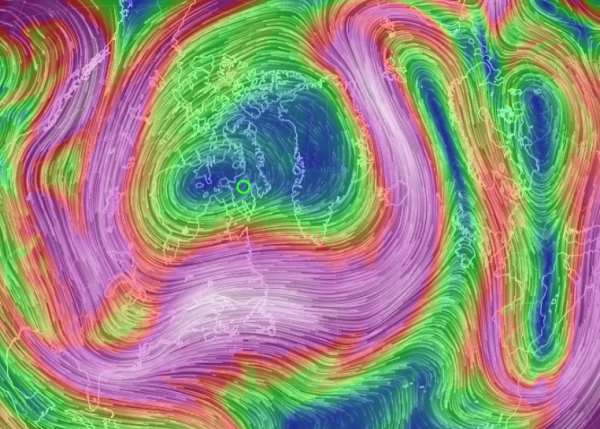
(Very high amplitude ridge and trough pattern at the Jet Stream level of the circumpolar winds is thought by a number of scientists to be a feature of human caused global warming. One that is related to polar amplification in the Arctic. Image source: Earth Nullschool.)

Heat in the Arctic is driving sections of cold air south even as warm air invades through places like Alaska, Northeast Siberia, and the Barents Sea. But the main variables of this story are global heat, global warming, fixed extreme temperature and precipitation patterns, and warm air invasion. The winnowing streamers of cold air driven out over places like the U.S. Northeast are just a side effect of the overall warming trend. One that is starkly apparent in the very odd western warmth that has grown more and more entrenched with each passing year.

For Now, It’s Still Just a Forecast

As with any five day forecast, we can take this one with more than just a grain of salt at the present time. But such an extreme event is entirely possible during the present age of human-forced climate change. During late December of 2015, we identified a predicted major storm that ultimately drove North Pole temperatures to above freezing. At the time, that storm was considered unusual if not unprecedented. However, since February is typically a colder period for the North Pole region, a warm storm drawing above freezing air into that zone would be even more unusual. It would also be a feature of the larger trend of loss of typical seasonal winter weather that we’ve been experiencing for some time now.

5 FEB UPDATE: Storm and Heat a Bit Further South and East Than Predicted

A powerful warm storm in the 952 mb range did form and track across Greenland to exit over the Greenland Strait earlier today. The storm drove warm air far north, pushing above freezing temperatures past Svalbard and over the dark and frozen sea ice. It hurled gale force winds, hurricane gusts, and massive swells into the ice. But it did not push temperatures to above freezing at the North Pole as some models had earlier predicted.

(Warm cyclone hurls much warmer than normal temperatures across the Barents Sea and Arctic Ocean on 5 Feb, 2018. Image source: Earth Nullschool.)

It did, however crank temperature there up to -4.3 C or about 26 C above average for this time of year.

The storm is now predicted to drive above freezing temperatures across the Barents Sea, over Novaya Zemlya, through the Kara Sea and ultimately into Northern Siberia over the next 24-48 hours. In numerous regions, temperatures are already hitting near 30 C (54 F) above average. This extremely warm spike relative to typical conditions — associated with a high amplitude Jet Stream wave and related cyclone — will continue to ripple through the Arctic over the next few days.

Overall, total Arctic region temperature anomalies are predicted to range from 2.5 to 3.5 C above the 30 year average for the next few days. These are very warm departures. But not so warm as recent spikes in the range of 4 to 5 C above average for the region. In addition, there appears to be a tendency for powerful warm storms to continue to develop near Svalbard in the longer 5-15 day model runs. So the North Pole isn’t out of the woods yet for potential above freezing temperatures this February.

Not Even the Briefest of Pauses for Human-Forced Global Warming — Oceans During 2017 Were the Hottest on Record

Where does most of the heat trapped by human fossil fuel and other greenhouse gas emissions ultimately end up? Given our fixation on global surface temperatures, many people would say ‘the atmosphere.’ But this answer is incorrect. The vast majority ends up in the world ocean.

(Global change in ocean heat content through 2015. Image source: Skeptical Science and CMIP5.)

The world ocean system is the largest heat sink on our planet’s surface. This is due to the fact that liquid water contained in the oceans both has a far greater mass and overall heat capacity than the atmosphere. Just a fraction — less than 1/30th of the heat trapped by human-emitted greenhouse gasses ends up in the atmosphere. Similar portions end up getting soaked in by the land and by melting glaciers. The rest, about 90 percent, finds its way into the oceans.

The ocean is thus the best, most reliable global thermometer available. For good reason, most scientists wait for readings from this big, wet thermostat to get an idea where global temperatures are headed and how fast. And what some of the world’s top ocean researchers found this week was that during 2017 the top 6,000 feet of the world’s oceans experienced their hottest year ever recorded.

(Ocean heat content change since 1958. Illustration: Cheng and Zhu (2018), Advances in Atmospheric Sciences.)

Not only was 2017 the hottest ocean year on record, the heat gain from the previous hottest ocean year (2015) was quite considerable. In all 15,100,000,000,000,000,000,000 Joules of heat energy were added by the world ocean from 2015 to 2017. By comparison, 61,500,000,000,000 Joules were produced by the Hiroshima bomb. The world ocean is now taking in a similar amount of heat every 3-5 seconds.

In the atmosphere, we tend to focus on El Nino years as the hot ones in an ongoing upward trend. This is because warm surface waters spreading across the Equatorial Pacific belch a bit of that huge volume of stored ocean heat back into the atmosphere. But during La Nina years, cooler surface waters across wide regions of the Equator swallow up more of the atmospheric heat. It is during these years that oceans tend to warm the most swiftly even as atmospheric warming tends to take a break. 2017 saw a weak La Nina and a comparatively strong rate of related ocean heat gain. And though atmospheric temperatures were ‘only’ the second hottest ever recorded according to NASA, ocean temperatures tracked further into uncharted territory.

(During El Nino years [left], the global oceans transfer a portion of their vast store of warmth to the atmosphere. During La Nina years [right] the oceans draw in more of the atmosphere’s heat. Image source: Climate.gov.)

It’s worth noting that ocean heat gain is presently both quite rapid and rather steady. All of the past five years were each one of the five hottest ocean years ever recorded. Global temperature gain thus hasn’t slowed. And though atmospheric temperature gain has accelerated during recent years, the ocean measure hints that overall heat gain per year has been pretty steady since the mid 1990s. At least for the top 6,000 feet of the world’s surface waters (though other measures provide some hints at acceleration [see image at top of this post]). An observation that would seem to reinforce the present decadal rate of temperature increase in the range of 0.15 to 0.20 C every ten years or about 30 to 50 times faster than the warming that ended the last ice age.

To be clear, the primary driver of what is a very rapid warming in the geological context is human fossil fuel burning and related carbon emissions in the range of 11 billion tons per year. Halting fossil fuel burning is therefore critical to slowing down and ultimately stopping the present rate of warming and dangerous related atmospheric and ocean carbon addition.

The Day the Water Ran Out — Climate Change Day Zero Swiftly Approaching for Cape Town

It’s the worst drought in at least 100 years. Possibly the worst in 300 years.

I’m not talking about Iran or Syria or California or Sao Paulo or the Caribbean or Somalia or Yemen or India or a hundred other places that have suffered severe drought and related water crisis during recent years. This time, I’m writing about Cape Town, South Africa.

For Cape Town, the dry time began two years ago. A strong El Nino initiated a warmer, drier than normal weather pattern. Accelerated by much warmer than normal global temperatures, what would have typically been a milder period of heat and drought bit deep into South Africa’s reservoirs. These hotter temperatures associated with human caused climate change enhanced evaporation causing both lands and lakes to give up their precious moisture at a much faster rate.

(From the video climate scientist Peter Johnston notes that increased heat from global warming means more evaporation which results in less water for Cape Town and other places around the globe. Video source: CBS This Morning.)

El Nino has since moved on and the La Nina months are here. But the blistering drought remains. Stuck in a self reinforcing cycle of heat and lack of rainfall. After such a long period of such abnormal punishment, the reservoirs that feed Cape Town are on the brink of running out.

With supplies dwindling, residents of this major city and tourist destination have been slapped with serious water restrictions. Each has been asked to use just 87 liters of water per day. That’s about 1/4 the average use for an American. One that provides precious little for washing dishes, taking showers, flushing the toilet, doing the laundry, preparing food, and drinking. But only about half of Cape Town’s residents are complying with the restriction.

(The long term precipitation trend for Cape Town reservoirs has been on a steady decline since the 1940s. A signal concurrent with a human-forced warming of the global climate system. Image source: Piotr Wolki and Andrew Freedman.)

In the Cape Town region, crushing drought continues unabated. And as a result of the combined lack of compliance with rationing and lack of rain, the reservoirs are swiftly falling. By February 1, Cape Town will ask residents to adhere to a draconian 50 liter water restriction. And if that doesn’t work, if the rains don’t somehow miraculously come, then Cape Town will effectively run out of enough water to fill pipes.

Under this very difficult scenario, water pipes to everything but essential services like hospitals would be cut off. Residents would be forced to make daily treks to one of 200 outlet pipes to fill up water bottles. If this happens, then Cape Town will be the first major city in the world to be forced to fully cut off its municipal water supply.

The day on which this historic and ominous presage of climate change related water difficulties is predicted to happen is a moving target. And lately the target has been moving closer. Ignominiously called Day Zero, the water cut-off date for Cape Town as of last week was April 21 of 2018. This week, due to failure to adhere to water restrictions and due to unrelenting drought, that date has jumped to April 12.

That’s 79 days left until Cape Town’s taps run dry for the first time since that city, or any other major city, possessed a municipal water system.

This event is happening in a hotter than normal world. It’s happened due to a drought that has been enhanced by that very heat. And it’s happening following an 80-year-long period of declining rainfall for the Cape Town region. Let us hope for the city’s sake that the rains return soon.

Let this serve as yet one more warning to us all. Climate change is generating a much more difficult water security situation for pretty much everyone. It’s just a simple fact that the more heat you have, the more evaporation that takes place. And it’s a more intense rate of evaporation that enables both worsening drought and increased risk of water shortages as we’re seeing so starkly now in Cape Town.

Record Year For Renewables Brings 185 GW of Clean Power Generation and 1.1 Million Electrical Vehicles

Despite policy opposition from fossil fuel backers across the world, renewable energy adoption rates rapidly accelerated during 2017 as both renewable electricity generation and clean energy vehicles saw considerable growth. This rapid growth is providing an opportunity for an early peak in global carbon emissions so long as investment in and broader policy support for clean energy continues to advance.

Solar Leads Record Year for New Renewable Power Generation

At the grid level, the biggest gains came from solar which saw an estimated 98 GW added globally. This is a 31 percent jump YOY from 2016 when 76.2 GW of solar energy was installed. More than half of this new solar generating capacity (52.83 GW) was added by China — now the undisputed solar leader both in terms of manufacturing and installations. That said, large gains were also made by India, Europe and the U.S. even as the rest of the world saw broader adoption as panel prices continued to fall. Uncertainty in the U.S. over the 201c trade case brought by Sunivia and enabled by the Trump Administration hampered solar adoption there. However, it is estimated that about 12 GW were still installed. Australia also saw a solar renaissance with more than 1 GW installed during 2017 as fossil-fuel based power generation prices soared and panel prices continued to plummet.

(Solar energy’s versatility combined with falling prices generates major advantages. In the coming years, solar glass will make this clean power source even more accessible.)

Wind energy also saw major additions in the range of 56 GW during 2017. Though less than banner year 2015 at 60 GW, wind grew from an approximate 50 GW annual add in 2016. This clean power source is therefore still showing a healthy adoption rate despite competition from dirty sources like natural gas and cheap coal due to overcapacity. Other renewable energy additions such as large hydro power, small hydro, biofuels, and geothermal likely resulted in another 30 GW or more– with China alone adding 12.8 GW of new large hydro power capacity.

Overall, about 185 GW of new clean electricity appears to have been added to global generation during 2017 — outpacing both new nuclear and new fossil fuels. This compares to approximately 150 GW from similar sources added during 2016. The primary drivers of this very rapid addition were swiftly falling solar costs, continued drops in wind prices, a number of policy incentives for clean energy adoption, rising access to energy storage systems and increasing concerns over human-caused climate change.

(More bang for your buck. Despite a plateau in clean energy investment over recent years, annual capacity additions keep rising — primarily due to continuously falling wind and solar prices. Image source: Bloomberg New Energy Finance.)

Electrical Vehicles Boom

Even as clean power generation was making strides, clean transport was racing ahead. With new offerings like the Chevy Bolt, the Tesla Model 3, and the upgraded Nissan Leaf, the electrical vehicle appears to have come of age. Luxury EVs are now more and more common in places like Europe and the United States even as mid-priced EVs are becoming widely available. Concern over both clean air and climate change is driving large cities and even major countries like India and China to pursue fossil fuel vehicle bans. A growing number of EVs with range capabilities in excess of 200 miles are hitting markets. And charging infrastructure is both growing and improving. As a result of these multiple dynamics, EV sales grew by nearly 50 percent from about 740,000 sold in 2016 to 1.1 million sold in 2017.

Renewables + EVs Bring Potential For Early Peak in Carbon Emissions

Such rapid rates of renewable energy adoption are starting to have an impact on human carbon emissions. Annual rates of renewable power addition in the range of 150 to 250 GW are enough to begin to plateau and/or reduce global carbon emission so long as reasonable efficiencies are added to the energy system. Meanwhile, annual EV sales in the range of 3 to 5 million per year and growing around 20 percent annually is enough to start to tamp down global oil demand and related externalities.

(Very rapid EV sales growth during 2017 is likely to be repeated in 2018 as more capable and less expensive electrical vehicles like Tesla’s Model 3 hit markets in larger numbers. Image source: Macquarie Bank and Business Insider.)

We are beginning to enter the range of visible fossil fuel replacement by renewable power generation now and it appears that EVs will start to measurably impact oil demand by the early 2020s. To this point, direct replacement of coal with renewable and natural gas based energy sources during recent years has resulted in a considerable slowing in the rate of carbon emissions growth. If renewables continue to make substantial gains during 2018 and onward, this trend of replacement of fossil fuels and reduction of harmful greenhouse gasses hitting the atmosphere will become more and more apparent.

2018 to see Third Consecutive Mass Coral Bleaching Event for the Great Barrier Reef?

One point two degrees Celsius hotter than average (1.2 C). That’s the temperature threshold where 50 percent of the world’s corals are likely to die off according to a scientific study written in Nature during 2013.

The El Nino year 2016 was about 1.2 C hotter than 1880s averages. Meanwhile 2017 was about 1.1 C warmer than normal despite a shift toward La Nina.

We are thus entering a very harmful period for the world’s corals. One in which corals are bleaching and dying off at unprecedented rates. The global bleaching event of 2014 through 2017 was the longest lasting and most damaging in the historical record. Many reefs around the world suffered severe losses. Reefs that had never bleached before experienced bleaching and mortality. And this event included severe damage to the majestic Great Barrier Reef of Australia.

Bleached Staghorn corals on Keppel Island Reef during 2016 event that impacted 93 percent of the Great Barrier Reef. Image source: UNESCO.

Unfortunately, despite an official end to the 2014 to 2017 global bleaching event, ocean temperatures across widespread regions remain at thresholds that are likely to result in stress to corals. And it is arguable that if bleaching were so widespread as it is now in past decades, then the present 2018 period would still be considered a global bleaching event.

Regardless of how we parse official declarations, reef systems are obviously still under stress. Just this past week, reports were coming in that sections of the Great Barrier Reef were bleaching for the third year in a row. The bleaching was rather widespread for this time of year. It was occurring earlier than normal — generating concern that 2018 bleaching could be worse than expected come February and March. It was hoped that the large reef system would be given a bit of respite from the heat. But now that particular hope is in doubt.

Corals around the world are still under threat from extreme ocean heat despite the fact that the 2014-2017 global coral bleaching event was officially ended during summer of 2017. Image source: NOAA.

Corals are one of the many canaries in the climate change coal mine. These organisms are a vital aspect of global ocean health and the reefs they build are the present home for upwards of 2 million species. Humans depend on corals for the food chains they support and for the natural beauty they provide. And a global ocean with less corals provides both less food and support for human beings and for ocean life as a whole.

Because corals are so sensitive to temperature change, it is expected that about 90 percent of the world’s corals will be lost if the Earth warms by 1.5 C. Meanwhile, virtually all of the corals (more than 95 percent) could be gone if the world warms by 2 C. With global temperatures at around the 1.1 C threshold and rising, we are in the danger range for corals at this time. And the world stands at the brink of losing the majority of this vital species with the potential to see 90 percent or more of the world’s corals lost over the next 3 decades under various scenarios in which fossil fuel burning continues.

Warmer than normal sea surface temperatures are again threatening Australia’s Great Barrier Reef (GBR). Jan 15, 2018 sea surface temperature anomaly image provided by Earth Nullschool.

Danger to corals is, today, a very immediate issue. And we are in the period of risk and damage now. This reality is highlighted by the fact that what should be a relative respite period for corals is still seeing abnormally high levels of bleaching.

During 2018, La Nina in the Eastern Pacific has generated relatively cooler surface waters in a number of locations. And we would normally expect La Nina to beat back global coral bleaching severity. However, an anomalous hot blob of ocean water between Australia and New Zealand is causing an unusual spike in ocean temperatures for the zone east of Australia (see image above). The result is that the GBR is again at risk.

Early bleaching for the Great Barrier Reef in 2018 is definitely a bad sign. However, scientists aren’t yet stating that this year will see bleaching intensity hitting levels similar to 2016 and 2017. Let’s hope that remains the case. But so long as fossil fuel burning and related warming continues, the road ahead for corals is one of existential crisis.

How Climate Change is Fueling Iran’s Political Instability

Drought.

Year after year after year for the past 15 years, it’s been the reality for Iran.

As with recent severe droughts in places like Syria, Nigeria, India and in other parts of the world, Iran’s drought impacts have forced farmers to abandon fields and move to the cities. It has enhanced economic and physical desperation — swelling the ranks of the poor and displaced. It has produced both food and water insecurity with many families now living from hand and cup to mouth. And it has served as a catalyst for political unrest, protest, and revolt.

(Iran’s Lake Urmia shrinks to ten percent of its former size following a 15 year long drought. Image source: U.S. Department of the Interior.)

Perhaps the most visible sign of this drought’s epic severity is the drying up of the 5,200 square mile expanse of Lake Urmia. The sixth largest salt water lake in the world and the largest lake in the Middle East, Urmia is now a desiccated shadow of its historical range. Just 10 percent of its former size, it is the casualty of both the drought and the dams that have been built to divert water to Iran’s struggling farmers. But it’s not just the lake that’s drying up. In the interior, individual provinces have seen as many as 1,100, or approximately 1/3 of its springs, run out of water.

Iran is on the eastern fringe of the worst drought to hit parts of the Middle East in 900 years. Ninety six percent of the country has been afflicted by escalating drought conditions over the past seven years. A drought so long and deep-running that it has been triggering unrest since at least 2014. A kind of climate change enhanced instability that has been intensifying over recent years.

(Iran shows long term precipitation deficits over 2016-2017 and 2010-2017 in this analysis provided by Iran’s Meteorological Organization.)

The growing drought-driven unrest has thrust climate change into the Iranian political spotlight even as populist farmer uprisings are on the increase. Iran’s Supreme Leader Ayatollah Ali Khamenei has directed government to “manage climate change and environmental threats.” However, with climate harms so long-running and with distrust in government so deep, even positive action by Iran’s leaders may be viewed in a negative light. Hindering impetus for response and generating a ripe field for the revolt or fragmentation.

From the scientific perspective, it appears that the effects of climate change are already enhancing the most recent dry period. Temperatures are rising — which increases evaporation. So more rain has to fall for soils to retain moisture. Complicating this issue is the fact that rains are expected to decline by 10 percent even as drier soils are expected to reduce rainfall and snow melt runoff by 25 percent over the next twelve years. Both are impacts caused by climate change and the predicted warming of Iranian summers by 2 to 3 degrees Celsius.

(Under business as usual fossil fuel burning scenarios, wet bulb temperatures are expected to periodically exceed the range in which humans can healthily function over portions of the Persian Gulf region before the end of this Century. Video Source: MIT News.)

Moreover, a recent MIT study from 2015 found that major cities in the Persian Gulf region may be driven past the tipping point for human survivability under business as usual fossil fuel burning (Wet Bulb of 35 C +) by climate change before the end of this Century (see video above). This means that during the worst heatwaves under this scenario, it would be impossible for human beings to retain an internal temperature cool enough to support key body functions while outdoors for even moderate periods. This would result in higher incidences of heat injury and heat mortality than we see even during present enhanced heatwaves.

Though it is uncertain whether collapse pressure driven by climate change has reached a tipping point for Iran similar to the events which enabled Syria’s descent into internal and regional conflict, the warning signs are there. The international community would thus be wise to both prepare responses and to broadly acknowledge climate change’s role in the enflaming of this and other geopolitical hot spots.

2017 — Second Hottest Year on Record as Climate Troubles Escalate

The world continues to warm. In the geological context, it is warming very rapidly. Likely more rapidly than at any time in at least the past 200 million years. And as long as this very swift warming trend continues, as long as it is not bent back, it spells serious trouble for the world’s weather, for stable coastlines, for corals, for ocean health, for stable growing seasons and for so, so many more things that we all depend on.

2017 was the second hottest year in the global climate record. It was notable due to the fact that it followed the strong El Nino year of 2016 with ENSO neutral trending toward La Nina conditions. The short term conditions that emerged during 2017 would tend to variably cool the Earth. But the resulting cool-down from 2016 to 2017 was marginal at best — representing about half the counter-trend drop-off following the strong 1998 El Nino. Instead, much warmer than normal polar zones kept the world in record hot ranges even as the Equator tried, but failed, to significantly cool.

(Rate of global warming since the 2010s appears to have accelerated in the above graph following a strong El Nino during 2015-2016 and a very mild counter-trend cooling during 2017. Temperatures in 2018 are likely to be similar to those seen during 2017 if the present prediction for ENSO-Neutral conditions is born out. Image source: NASA.)

Overall, warming above historical baselines remains quite acute in the NASA graph. And global temperatures for 2017 were 1.12 C warmer than 1880s averages. This is comparable to the 1 to 2 C warmer than Holocene range last seen during the Eemian — when oceans were about 20 to 30 feet higher than they were during the 20th Century.

Present rate of warming appears to be at the higher end of the observed 0.15 to 0.20 C warming per decade increase since the mid 1970s. This rate of warming is approximately 30 to 50 times faster than the warming that ended the last ice age. During that time, it took ten thousand years for the Earth to warm by about 4 degrees Celsius. Now we are at risk of seeing a similar warming within 1 to 2 Centuries or less if a switch back to business as usual fossil fuel burning occurs.

(This is what a world featuring temperatures hotter than 1 C above late 19th Century averages looks like. All-in-all not a very cool place. If present levels of atmospheric greenhouse gasses simply remain and do not rise, we are likely to see 2 to 3 times this level of warming long-term and over the course of multiple centuries. Present policy pathways for additional greenhouse gas emissions will likely achieve 2-3 C warming or more by the end of this Century unless more rapid energy transitions, carbon emission curtailment, and atmospheric carbon capture are undertaken. Image source: NASA.)

NASA and other top scientific agencies point toward human CO2 and other greenhouse gas emissions as the primary cause of present warming and a related growing disruption to the Earth’s climate system. Action to switch energy systems away from fossil fuels and to, as a follow-on, draw down a portion of that climate warming CO2 now in the atmosphere is presently necessary to prevent ratcheting levels of harm and disruption on local, regional and global scales.

Though mild compared to the potential impacts of future human-forced warming, present warming and presently elevated CO2 levels in the range of 407 ppm and 492 ppm CO2e are enough to generate climate disruptions of serious consequence over the short, medium and long term that negatively impact the health of human civilizations and the natural world. Meanwhile, continued fossil fuel burning and related dumping of carbon into the atmosphere is increasing the risk of catastrophic events and related mass loss of human shelter, forests, fertile growing zones, and earth system life support services. The need for response and a rapid energy transition to renewables is therefore both considerable and growing.

Tesla Model 3 Production Ramp — Steady as She Goes

If a person were to define the goal of aspiration, not in the dictionary sense, but in the ideal sense, a part of it would include attempting to achieve things that were previously considered impossible.

From the point of view of Tesla, setting seemingly impossible goals and then shooting to attain them has apparently become a new model for doing business. As the old adage goes — shoot for the stars. Go ahead try. If you miss them you might hit the moon instead.

With the Model 3, it appears that Tesla, so far, may have just managed to land on the moon after setting some pretty amazingly ambitious initial star-shot-type goals. That said, the moon, at this point, appears to be a temporary way-station as the company course corrects, but is still aiming for some ridiculously starshot-high production goals through 2018.

According to recent announcements from Tesla, the company achieved 2,425 units of production in the 4th Quarter of 2017. This is a considerable jump from third Quarter production of around 260 Model 3s. It is not, however, anywhere near the 5,000 vehicle per week target by year end that Tesla had initially aimed for. In other words — some moon, but no stars as yet. And it’s obvious that some Tesla watchers are disappointed. Perhaps more frustrating to those of us who are EV lovers, Tesla has again scaled back its targets somewhat — shooting for 2,500 vehicles per week by the end of Q 1 of 2018.

(Ramping Model 3 deliveries in a record 4th Quarter for Tesla. Image source: Electrek.)

But before we leave it at that, let’s add just a little context.

The first bit is that reviews for the Model 3 are coming back as very positive. Even Jalopnik, which regularly tears Tesla a new one, recently complained that there wasn’t enough to criticize about the Model 3. Meanwhile, previous Tesla owners are raving about the car. So some credibility must be given, there, to Musk’s recent claim that the company is aiming for a slower ramp to focus more on quality early and push the mass quantity part back for later. But how much later is still a pretty serious question on everyone’s mind.

The second piece of context that’s worth considering is the fact that as of December, the Model 3 was likely the 5th or 6th best selling EV in the United States. If Tesla manages to achieve an average production rate of around 500 to 1,000 vehicles per week in January, then the car will likely be ranked between 1st and 3rd. By March, if the ramp continues to scale up, it’s likely that the Model 3 will hit over 5,000 monthly sales and be the best-selling EV in the U.S.

(Despite moderate production delays, the Tesla Model 3 continues on its ramp to mass production. As you can see from the above video, fans really love this car. Meanwhile, many analysts don’t see major issues with the present Model 3 ramp and still expect Tesla to be selling north of a million EVs per year by the early 2020s.)

Looking still closer, we should take Tesla’s claims of 750+ vehicle per week production in late December with a dash of salt. It’s clear that Tesla production is now ramping. That bottlenecks are being cleared. That said, this announced sustained rate is the highest yet achieved over a relatively decent period of time. And, if past is any guide, it’s likely that Tesla will be speeding and slowing the line as they address issues. We probably shouldn’t assume that every week from now on will produce 750 or more. It could. But it’s likely we’ll see a kind of two step forward, one step back, two step forward progression as Tesla continues to refine the Model 3 line.

To this point we should probably also add that when Tesla says it is aiming for 2,500 vehicles per week by end of Q1, that’s probably a snapshot of peak production. Not of average weekly production during March. Same for the 5,000 vehicle per week target by June.

It’s a lot to digest. But I think those of us who’ve been following EVs for some time should sit back and take stock of what is a really big achievement underway. It may not be happening as fast as many had hoped. But it is happening. And even with its less ambitious ramp, Tesla appears set to at least double its overall EV production during 2018.

Steady as she goes…