In achieving any kind of real progress toward an important end, it’s necessary to set goals that are difficult to attain. To aim further than you think you can go. And that’s even more important for a climate crisis that will produce catastrophic outcomes if we don’t set some very serious renewable energy, emissions reduction, and sustainability goals.
(This is your home.)
Because the important end that we are now trying to attain involves saving the future. Future prosperity, future vitality, future generations of human beings and living creatures. In the end it’s about the future of your home. For each 0.1 C of additional warming will bring with it more risk. More potential for increased harm.
It doesn’t matter if you live in Miami or Bangladesh. In Norfolk or Washington DC. In London or LA. In Calgary or Quebec. Where you live is where climate change is happening now. And where you live is where the future catastrophic impacts from climate change will be felt if we don’t do the necessary work.
We have ZERO years left to solve climate change. Emissions have to come down steadily in the years ahead to avoid committing to catastrophic climate change impacts. https://t.co/zPyQFiJYBs
— Prof Michael E. Mann (@MichaelEMann) July 13, 2018
In saying this, I can also say with confidence that we have a pathway out of this crisis. We have the renewable energy technology available now that is capable of replacing fossil fuel burning — so long as it is deployed on a mass scale. We have the ability to make our energy systems more efficient. We have the ability to change the way we manage lands and farms. And we can do all this — getting to net zero carbon emissions — without the kind of (post-Maria Puerto Rico-like) austerity invoking collapse of the global economy that the mongers of fear, uncertainty and doubt falsely say is necessary.
But to do this, to prevent catastrophe — not harm, because we are already going to see harm — we have to set our goals high. We have to try to achieve what might not be possible. And that’s why we aim for 1.5 C. Because this is your home. And we will employ every tool in our kit in our fight to save it.
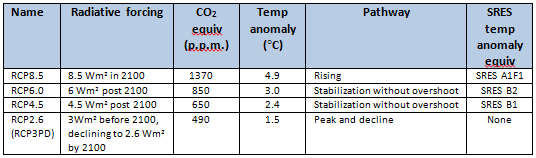
Each day, as individuals and as a global civilization, we decide how difficult our future will be. We do this, ultimately, by deciding whether we will burn fossil fuels, and whether or not we will emit carbon into the Earth’s atmosphere. The most liveable climate change scenario is the one where we emit the least carbon, where we first switch carbon emitting energy systems with renewables, and where we then learn how to draw carbon down from the atmosphere. In scientific parlance, this best case response to climate change is described as the RCP 2.6 emissions pathway.
(Shooting for 1.5 C Warming — Risk and Necessity.)
What is RCP 2.6? How do we define it?
We do this in many ways. By one measure, it roughly equates to an average of 490 ppm CO2 equivalent greenhouse gasses in the atmosphere over the course of the 21st Century. By another, it equals an added average radiative forcing at the top of the atmosphere of 2.6 watts per meter squared. By another, it roughly equals 1.5 C warming by 2100.
In short, it’s the best case that we could rationally hope for. A much more liveable world. But it is also a long shot. A heavy lift. One that will require great courage, moral fiber, innovation, and effort if we are to have any hope of achieving it.
if we want to keep below 1.5°C, the science says the entire u.s. needs to be 100% carbon free by 2035.
In order to have a shot at hitting RCP 2.6 we’ve got to, as a global civilization, achieve net zero carbon emissions by 2050. What this means is that U.S. carbon emissions need to be net zero by 2035. And the world needs to quickly follow suit. That’s not going to be easy. But I think it’s doable, if we work hard and honestly and if we are lucky.
Ultimately, it’s something that we can’t not try to do and still be a good people. For in undertaking the path to 1.5 C we commit to the greatest rescue operation in the history of the planet and of humankind. And that’s what part 2 of this post series is about.
“During this earlier period, known as Heinrich stadial 1, atmospheric CO2 increased by a total of ~40ppm, Antarctic surface atmospheric temperatures increased by around 5°C and Southern Ocean temperatures increased by 3°C.”
How did it all happen? According to the science, Greenland melt slowed down North Atlantic Deep Water formation. This, in turn, caused the North Atlantic to cool and the South Atlantic to warm. The resulting change in temperature then shoved the band of stormy weather called the Inter-Tropical-Convergence-Zone southward. Subsequently, the westerlies in the Southern Hemisphere were shifted poleward and strengthened. Stronger, more southward running winds around the southern pole dredged up carbon rich deep water near the pole and on into the Pacific. This carbon then transferred to the atmosphere.
It’s an interesting bit of science. But it has a good degree of relevance to the present day. That’s because Greenland is again melting greater volumes of water into the North Atlantic. The North Atlantic is again cooling. And the Southern Ocean winds are again being driven south as they strengthen.
(How Greenland melt pulled carbon from the Southern Ocean. A process that is being driven to repeat by present human-forced climate change. Image source: Nature Communications.)
“With this in mind, the contraction and strengthening of westerly winds today could have significant implications for atmospheric CO2 concentrations and our future climate.”
This is a kind of feedback that results from the warming humans have caused that can result in more carbon being wrung from the ocean. And it’s a concern because it shortens the available time-frame in which to respond to the crisis that is climate change.
(Greenland melt, the North Atlantic cool pool, and strengthening, southward moving Southern Ocean winds. These dynamics set off a carbon feedback about 16,000 years ago. Similar dynamics are coming into play today due to human caused climate change. Image source: Earth Nullschool.)
To be clear, present rates of fossil fuel burning are dumping an amount of carbon into the atmosphere at a much higher rate than this identified Earth System response could ever match. But, as the study authors note, the Southern Ocean has already sequestered 10 percent of carbon emitted by humans. If that sequestration halts and then reverses, then the rate of atmospheric CO2 accumulation, even if emissions stay stable, will rise by about 0.2 to 0.4 ppm per year.
This report lends further urgency to global efforts by responsible institutions and individuals to reduce global carbon emissions and transition to clean energy. Bringing the more difficult outcomes of rising heat trapping gasses closer and closer to the present day.
What’s the difference between bad (Trumpian) energy policy and good (clean energy based) energy policy? For Los Angeles and San Diego which both experienced an extreme, climate change driven, heatwave over the past week, about 4 degrees Fahrenheit.
In other words, fossil fuel burning under Trump policies would be of much greater magnitude and extend for far longer into the future. This would pump more heat trapping carbon into the atmosphere and ratchet global temperatures much higher.
In other words, it’s not a question of whether climate change will worsen. It will, at least for a while. It’s a question of how bad things will get. And from Obama to Trump we have a clear example and contrast between various helpful policies like increasing CAFE standards, the Sun Shot Initiative, the Clean Power Plan, and the Paris Climate Summit to various attempts to force people to buy coal, allowing the most toxic high emissions trucks on the road, putting up vast swaths of public lands for drilling, all while denying the scientifically proven existence of climate change and doing everything possible to roll back and withdraw from past positive policies.
One of these governments is clearly not like the other. And while we, as environmentalists and clean energy advocates could criticize individual climate policies for not going far enough, we must certainly concede that they were, on net, significantly helpful.
To this point, I’d like to call your attention to a recent spot-on statement by Dr Michael E. Mann:
This is not binary, F’d/Not F’d. It’s a matter of HOW F’d. We have a great amount of control over that. We can still avert catastrophic warming if we act now. Now is the very worst time to give up…. https://t.co/X4OVD9AzMo
— Prof Michael E. Mann (@MichaelEMann) July 9, 2018
And we are coming to realize how much more F’d we will be if we let those like Trump win out.
In the end, so much of the future of humankind is decided by international, national, state, and city government policy. If policies support a transition away from fossil fuel burning and toward a renewable energy based economy, then fossil fuel burning will halt more rapidly and warming will be reduced.
If, on the other hand, governments (like the one under Trump) fight to extend fossil fuel burning indefinitely into the future, to deny access to clean energy and to prevent the advance of efficiencies and energy savings, then warming will proceed very rapidly along what is known as a business as usual pathway. A pathway that is better described as the fast lane to increasingly hot and hellish conditions on Earth.
One future is probably survivable by human civilizations. The other future is very painful and difficult, calling prosperity and even habitability for large regions of the Earth’s surface into serious question.
(U.S. Heatwaves under some climate response [RCP 4.5] vs Trump policies leading to no climate response [RCP 8.5]. Image source: Think Progress and The National Climate Assessment.)
That other future is the one that pro fossil fuel governments like the Trump Administration are fighting for by trying to delay or deny access to renewable energy all while attempting to extend the burning of fossil fuels indefinitely.
So we are at a crossroads in more ways than one. But we should hold a measure of cautious optimism due to the fact that the economics of renewable energy are increasingly superior to those of ailing fossil fuels. And, in some cases, these economic conditions have been enough to overwhelm the negative, pro-fossil fuel policy stances of certain federal governments presently holding sway.
Take Australia, for example, which since 2013 has been headed by pro fossil fuel parties led by Tony Abbott and Malcolm Turnbull. These governments, holding thin majorities have done whatever they could to water down clean energy policies, reduce emissions cuts and support fossil fuels. During recent sessions, they have repeatedly attempted to send taxpayer money to coal facilities so that they will continue to operate (sound familiar, Rick Perry?).
(Major increase in clean solar adoption in Australia has primarily been driven by falling solar prices even as various Australian states continue to push hard for adoption despite the federal government’s fossil-fuel backing. Image source: Green Energy News and WA Today.)
What’s driving all this new solar? Well, for one many regions in Australia still incentivize solar. Meanwhile, some federal policies supporting solar still remain in place. But the one factor that has changed dramatically is that the cost of solar energy now out-competes practically every other major source in Australia. Panel prices are presently around 50 cents per watt down under and are falling to 40 cents per watt. This means that many customers can now recoup their investment in 3-5 years time. And with electricity prices running high, this is a really big incentive.
Solar possesses what is called a positive learning curve. What this means is that the more solar panels produced, the lower the future cost of solar panels. Both wind and batteries benefit from the same economies of scale. But if politicians like Trump increasingly use subsidies to prop up fossil fuels while fighting to kill off clean energy, then that horrible business as usual future that Joe Romm mentioned above is a very distinct possibility.
Or as Michael Mann put it — how F’d up do you want to see things get. From where I’m sitting, they’re already messed up enough.
“We’ve never experienced this kind of rain before. This is a situation of extreme danger.” — The Japan Meteorological Agency
*****
During recent days as much as 25 inches of rain has fallen over parts of Japan shattering previous all time precipitation records for parts of the island nation. The resulting floods have spurred a major emergency response by 54,000 personnel, taken the lives of more than 125 people, and forced more than 2.8 million to evacuate.
(Rising global surface temperatures increase atmospheric water vapor levels — providing liquid fuel that spikes the most powerful rainfall events to even greater extremes.)
On July 3, Typhoon Prapiroon swept over southwestern Japan bringing with it a spate of heavy rains. Over the following days, Prapiroon got caught up in stationary front even as a high pressure system to the east continued to circulate tropical moisture into the region. Beneath that eastern high, sea surface temperatures ranged between 2 and 3.5 degrees Celsius above normal. Meanwhile, warmer than normal ocean surfaces dominated a region east of the Philippines. These large, abnormally warm zones produced excess evaporation which helped to feed even more moisture into the region.
The result was a historic and devastating rain event for Japan. Isolated locations received more than 39 inches (1000 mm) of rain over a three day period. With one hour rainfall exceeding 3 inches in a number of locations. Motoyami received one day rains of 23 inches. With Mount Ontake seeing more than 25 inches over three days.
(Warmer than normal ocean surfaces, as shown in yellow and red in this sea surface temperature anomaly map, helped to fuel Japan’s recent extreme rainfall event. Image source: Earth Nullschool.)
Rising global temperatures increase overall atmospheric moisture loading by approximately 8 percent for each degree Celsius of global temperature increase. Water vapor provides fuel for storms both through enhancing convection and by engorging clouds with moisture. Recent scientific studies have found that climate change can greatly enhance the peak intensity of the most severe storms in this way. And the U.S. National Climate Assessment has identified a historical trend of increasing instances of heavy precipitation.
The big surge in electrical vehicle sales within the U.S., primarily driven by clean energy leader Tesla, continues.
According to reports from Inside EVs, total U.S. EV sales are likely to hit near 26,000 for the month of June. Such sales increases have primarily been driven by Tesla — which sold over 11,000 EVs in the U.S. for the month — representing nearly half (42 percent) of the entire U.S. market.
(Unpacking why EVs are so important to confronting climate change.)
Tesla’s dominance was spear headed by its Model 3 — which sold over 6,000 in June to the U.S. (and approximately 2,000 to Canada). Meanwhile, combined Model S and Model X sales were in excess of 5,000 in the U.S.
Other U.S. clean energy vehicle leaders for the month of June included Toyota Prius Prime (a plug in hybrid electrical vehicle), the Nissan Leaf, The Chevy Bolt and the Chevy Volt (plug in hybrid). In total, all of these four models combined represented less sales than Tesla — approximately 5,900 in total or about 55 percent of Tesla’s sales. Of these, only the Prius Prime cracked the 2,000 mark (see more here).
(U.S. EV sales are rapidly increasing in 2018. Image source: Inside EVs.)
Overall, it appears that U.S. EV sales are likely to hit near 400,000 on the back of Tesla’s rapid expansion in production rates. In addition, GM has recently acknowledged that it is unable to meet high demand for the Bolt in the U.S. and has stated that production lines are set to expand by 20 percent. Though this is unlikely to satiate rising EV demand, it will add to the widening trend of ramping clean energy sales here.
GM recently saw big Bolt sales gains in South Korea. And the company recently acknowledged that it is not doing enough to meet consumer’s clean energy needs in North America. Though a bump from 26,000 to approximately 31,000 Bolts sold from 2017 to 2018 is a drop in the bucked compared to the approx 100,000 or more new EVs Tesla will be adding by itself vs 2017 (100,000 total EVs in 2017 to approx 200,000 total in 2018).
(Tesla hits past 5,000 Model 3’s per week in late June and early July. Image source: Bloomberg.)
Looking ahead, Tesla appears set to sell well in excess of 10,000 Model 3s alone in the U.S. in July as weekly production rates surge. According to Bloomberg’s Model 3 Tracker (image above), the company has sky-rocketed weekly Model 3 production rates to above 5,000 during late June and early July. And while some wag is likely between the mid 2,000s to mid 5,000s as Tesla continues to work on its lines, the company is on a clear path for increased production — aiming at another surge to 6,000 per week by August.
A massive 100,000 acre blaze has hurled off 300 foot high walls of fire that local authorities are describing as a ‘fire tsunami.’
The Spring Creek Fire, now the third largest in the Colorado state record, has forced more than 2,000 people to evacuate, destroyed or damaged 200 homes, and drawn the emergency response of 1,000 firefighters.
(Explosive Spring Creek Fire reaches 300 feet in height — forcing hundreds to flee.)
“unprecedented fire behavior. Because the fire has been moving so fast we don’t know exactly how big it has become. It was a perfect firestorm. This is a national disaster at this time. You can imagine standing in front of a tsunami or tornado and trying to stop it from destroying homes. A human response is ineffective.”
Thankfully, and due in large part to heroic efforts by firefighters and emergency responders to evacuate those in the fire’s path, no reports of loss of life have yet been received. Overnight rainfall on the 5th to 6th of July has also given firefighters an opportunity to respond. And now this enormous blaze is 35 percent contained. However, the explosive, lumbering fire is still a serious threat to the region.
(NASA satellite image of the Spring Creek Fire burn scar.)
Across the west, fully 60 large fires are now burning across the U.S. from Alaska to the Southeast. But the most intense fires are occurring in the west. These fires are sparking as record heat and severe drought conditions strike the west. And, presently, over 2,900,000 acres have burned on U.S. soil.
The 2018 Atlantic hurricane season has produced another record after a string of similar strange climate change related excursions during recent years. Meanwhile, at powerful Category 5 storm has formed in the Pacific.
(Mid Ocean Season starts early with Beryl; Pacific cat 5 Maria tracks toward China.)
The height of the Atlantic hurricane season is known as the Cape Verde Season. During this time, massive clusters of thunderstorms called tropical waves develop over Africa and head out into the tropical North Atlantic. There, they feed on warm sea surfaces and favorable atmospheric conditions — forming into tropical cyclones at a much higher rate than during the rest of the year.
Of the 89 pre-August hurricanes on record, #Beryl is the easternmost among those that formed from African waves… by a HUGE margin! 1 further east was Dorothy on July 24, and 2 further east were in January (all 3 moving north). pic.twitter.com/dyOi2zQIJq
Cape Verde storms typically begin forming in August. And though July does see an increase in tropical wave generation from Africa that can fuel storm formation in the Caribbean and just off the Windward and Leeward Islands in the North Atlantic, we don’t typically see mid ocean forming storms until August.
The odd thing about Beryl is it is acting a lot like an August Cape Verde storm — but a month earlier than is typical. Factors that possibly contributed to Beryl’s early formation include climate change driven warmer than normal sea surfaces in the region, strong clusters of thunderstorms developing over Africa and heading out into the Atlantic at a high rate, and a post-La Nina atmospheric influence that tends to increase the frequency of Atlantic storm formation.
Cat 5 Maria Heading Toward China
Moving over to the western Pacific, we find a very powerful category 5 storm — Maria — moving slowly toward China. Yesterday the storm achieved the highest intensity rating we give for hurricanes as maximum sustained winds surged to 161 mph. The storm has since backed off a bit to just stronger than 155 mph maximum winds. However, it is still a very dangerous system.
Wow! Super Typhoon Maria is already a Category 5 equivalent, less than 1 yr after Cat 5 Maria in the Atlantic. The only other example I can find of the same name being used for Cat 5s in different basins was Rita (1978 in the NW Pacific, 2005 in the Atlantic). Img: CIMSS/SSEC/UW pic.twitter.com/FxDywLZnxc
Like Beryl, Maria formed over warmer than normal sea surface temperatures — a climate change related factor that provides more fuel for storms. Maria is now tracking off to the north and west. It is expected to cross somewhat cooler waters before heading back into warmer than normal waters off Shanghai. It is thus likely that Maria will see fluctuations in strength as it approaches the China mainland over the coming week.
Overall, climate change’s influence on tropical cyclones is that a human-warmed climate is increasing the peak intensity of the most powerful storms. In addition, alterations in ocean heat and energy balance is moving the zones and changing the times during which storms form. We are thus seeing storms that form out of season and outside of typical climate zones. These shifts and these increases in peak intensity will continue so long as fossil fuel burning and related carbon emissions do not abate.
According to news reports, major temperature records in this broad ranging swath of heat included a 105 F (40.5 C) reading in Denver, a scorching 122.4 F (50.2 C) temperature in Pakistan, a ridiculous 97.9 F (36.6 C) reading in Montreal, and a 91.8 F (33.2 C) reading in Motherwell Scotland of all places (see graphic here).
In Quebec, safety officials were inundated with 1,200 calls per day due to heat stress and heat injury. Emergency crews were at the ready with 3,400 house visits conducted each day. Despite the high state of readiness, 33 people so far are reported to have lost their lives — primarily middle aged to elderly males. High heat, high humidity, and lack of residential cooling all contributed to heat injuries and loss of life over this typically much cooler region.
My thoughts are with the loved ones of those who have died in Quebec during this heat wave. The record temperatures are expected to continue in central & eastern Canada, so make sure you know how to protect yourself & your family: https://t.co/JSPPsU80x9
In context, a total of 23 all time record high maximum and record high minimum temperatures have been produced as a result of the present heatwave during the past 7 days. This compares to zero all time record low maximum and zero record low minimum temperatures over the same time period. Daily and monthly record highs and record high minimum temperatures are outpacing record low temperatures on a global basis at a rate of 4-12 to 1.
Global warming due to fossil fuel burning has put us in a 115,000 year heatwave on a whole Earth system based context. So we can continue to expect record high temperatures to be breached at higher rates.
(Very high incidence of all time record hot temperatures over the past 7 days. Image source: NOAA.)
According to GFS model forecasts, extreme heat is expected to continue to impact of number of Northern Hemisphere regions over the coming days. Though the North American East may see a respite from the heat over the 1-5 day horizon, high temperatures are expected to continue to hammer western and central zones. Northeast Siberia is predicted to see extreme heat early on, which is then expected to shift west into Eastern Siberia and Scandinavia. Meanwhile, the Middle East, North Africa, and parts of Central Asia are predicted to continue to experience much hotter than normal summer temperatures.
The big surge was led by major production increases from Tesla, BYD, and BAIC, with BMW and Volkswagen running close behind.
(Global EV production appears to be on track for between 1.8 and 2 million by end of 2018 led by Tesla, BYD, and BAIC.)
The large increase in EV interest comes as nations, states and cities move to address a combination of issues including bad air quality due to fossil fuel based vehicle use and increasing impacts from human caused climate change. Numerous cities set about to restrict or ban fossil fuel vehicle use to improve local health by reducing particulate emission and/or due concerns about threats to cities emerging from human caused climate change.
Overall, between 1.8 and 2 million EVs are likely to hit the roads in 2018. A number which appears set to double through 2020 as traditional automakers race to catch up to the likes of Tesla and the Chinese. As an example, 7 percent of BMW vehicles sold are now electric. A portion that is likely to rapidly expand over the next couple of years as the former all ICE manufacturer tries to fight off major competition from Tesla and others.
Tesla achieved a major surge in clean energy vehicle production during the second quarter of 2018.
According to reports from Tesla, the all renewable energy corporation produced a whopping 53,339 electrical vehicles during Q2. Of these, 24,751 were Model S and X. Meanwhile, Tesla produced an amazing 28,578 Model 3s.
Overall, this is almost double the 25,708 EVs produced during Q2 of 2017. A very impressive jump that included Tesla exceeding 5,000 Model 3s produced during the final week of June with a total weekly EV production rate of nearly 7,000 (see below).
(Tesla hits clean energy vehicle production milestones during Q2 of 2018.)
These are huge numbers for Tesla — showing that the company is achieving its goal of mass produced clean energy automobiles. A feat that is even now setting off shock-waves through the global auto market (and a major smear and fear campaign at the hands of pro-fossil fuel Tesla shorts).
Tesla appears to be well on its way to hitting around 200,000 EVs produced by the end of 2018 — with 88,000 coming out of Tesla’s factories in the first half of the year. If present trends hold, it appears that Tesla will hit between 60,000 and 75,000 EVs during Q3, with still more on the way during Q4.
(Tesla crushes Q2 production during big Model 3 surge. Image source: Inside EVs.)
Such high rates of production from Tesla’s multiple vehicle lines are now likely to enable Tesla to begin leveraging economies of scale to increase cash influx. Setting up Tesla’s planned profitability during the second half of the year. Meanwhile, Tesla revenues continue to rapidly grow. All good news.
I’ve said it before here, but I’ll say it again. Tesla’s success is critical to the clean energy revolution. It is the only major all-clean energy automaker in the West. One that is leveraging a combination of 100 percent renewable energy technologies — solar, batteries, and EVs — to rapidly and competitively move into markets traditionally dominated by fossil fuel based industries. And it is this kind of direct replacement of fossil fuels with renewables that will enable rapid global carbon emissions reduction and movement away from a future blighted by catastrophic climate change.
(Tesla team celebrates its achievement of 5,000 Model 3s produced within one week. Image source: Tesla.)
PALO ALTO, Calif., July 02, 2018 (GLOBE NEWSWIRE) — In the last seven days of Q2, Tesla produced 5,031 Model 3 and 1,913 Model S and X vehicles.
Q2 production totaled 53,339 vehicles, a 55% increase from Q1, making it the most productive quarter in Tesla history by far. For the first time, Model 3 production (28,578) exceeded combined Model S and X production (24,761), and we produced almost three times the amount of Model 3s than we did in Q1. Our Model 3 weekly production rate also more than doubled during the quarter, and we did so without compromising quality.
GA4, our new General Assembly line for Model 3, was responsible for roughly 20% of Model 3s produced last week, with quality from that line being as good as our regular GA3 line. We expect that GA3 alone can reach a production rate of 5,000 Model 3s per week soon, but GA4 helped to get us there faster and will also help to exceed that rate.
Tesla expects to increase production to 6,000 Model 3s per week by late next month. We also reaffirm our guidance for positive GAAP net income and cash flow in Q3 and Q4, despite negative pressures from a weaker USD and likely higher tariffs for vehicles imported into China as well as components procured from China.
Q2 deliveries totaled 40,740 vehicles, of which 18,440 were Model 3, 10,930 were Model S, and 11,370 were Model X. Model S and X deliveries are in line with our guidance provided on May 3. As we previously noted, we are in the process of changing the quarterly production pattern of those vehicles for the various worldwide regions to ensure a more linear flow of deliveries through the quarter. Both orders and deliveries for Model S and X were higher in Q2 than a year ago. Our overall target for 100,000 Model S and Model X deliveries in 2018 is unchanged.
11,166 Model 3 vehicles and 3,892 Model S and X vehicles were in transit to customers at the end of Q2, and will be delivered in early Q3. The high number of customer vehicles in transit for Model 3 was primarily due to a significant increase in production towards the end of the quarter.
The remaining net Model 3 reservations count at the end of Q2 still stood at roughly 420,000 even though we have now delivered 28,386 Model 3 vehicles to date. When we start to provide customers an opportunity to see and test drive the car at their local store, we expect that our orders will grow faster than our production rate. Model 3 Dual Motor All Wheel Drive and Model 3 Dual Motor All Wheel Drive Performance cars will also be available in our stores shortly.
The last 12 months were some of the most difficult in Tesla’s history, and we are incredibly proud of the whole Tesla team for achieving the 5,000 unit Model 3 production rate. It was not easy, but it was definitely worth it.
**********************
Our delivery count should be viewed as slightly conservative, as we only count a car as delivered if it is transferred to the customer and all paperwork is correct. Final numbers could vary by up to 0.5%. Tesla vehicle deliveries represent only one measure of the company’s financial performance and should not be relied on as an indicator of quarterly financial results, which depend on a variety of factors, including the cost of sales, foreign exchange movements and mix of directly leased vehicles.
Forward-Looking Statements
Certain statements herein, including statements regarding future production and delivery of Model S, Model X and Model 3, expected cash flow and net income results, and growth in demand for our vehicles, are “forward-looking statements” that are subject to risks and uncertainties. These forward-looking statements are based on management’s current expectations. Various important factors could cause actual results to differ materially, including the risks identified in our SEC filings. Tesla disclaims any obligation to update this information.


