Hothouse 2090: Category 6 Hurricane A Grey Swansong For Tampa

Tampa. 2090. Late September.

The stiff wind running off the Gulf of Mexico felt like a blast furnace. Ocean surface temperatures near 100 degrees Fahrenheit; air temperatures of 113 F, high humidity, and a smell like rotten eggs added to the overall insufferability. Unpleasant was a better word from a better time. Mere unpleasantness had long since fallen away before the new deadly edge that Nature had adopted.

Tampa’s streets were packed with vehicles but featured only the rare transient foot and bike traffic. Just 15 minutes’ exposure to the brutal four p.m. heat and humidity could swiftly result in heat stroke as a body’s natural cooling systems were overwhelmed by conditions no human physiology could for long endure. The city had long since grown accustomed to the warnings. Anyone wanting to stay healthy remained indoors, huddling close to the blessed vents blasting machine-cooled, filtered air.

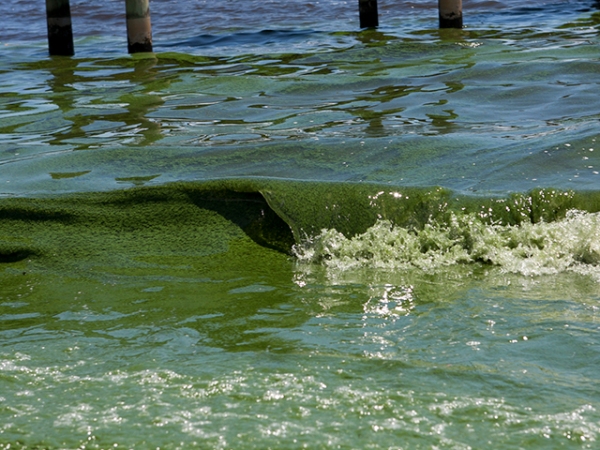
In the heat-scorched streets, elevated many times over to keep above the rising seas, a few diehards still roamed. They sported the latest in cooling accessories — thermal-bleeding fashions were all the rage and had been for at least three decades now. So too were the thin-film sulfur filtration masks, totem-like in their branding and individually styled in patterns of iridescent colors. These were the stylized provisional responses to the gigantic dead zones that regularly painted the Gulf’s waters purple-black with stinking, toxic-gas-spewing bacteria. But today, the waters were sickly green. The stink was merely unbearable and only somewhat unhealthy, thanks to the large and powerful storm now pushing in the bluer off-shore waters and flushing out some of the seaside dead zone.

RCP 8.5

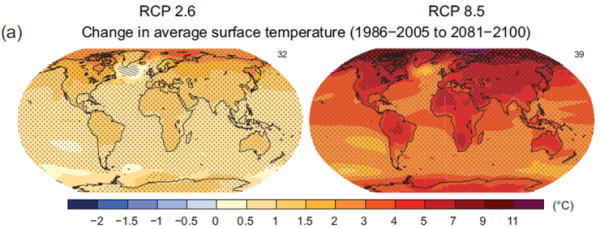
(Under RCP 8.5 warming scenarios, the Earth is transformed into a hotter, more deadly place, capable of supporting storms of never-before-seen intensity. Image source: The European Environmental Agency.)

Great swells churned away – covered in gooey sludge. Some residents thought fondly of the December- to-February tourist season when temperatures fell, the waters cleared and, at times, swimming was safe. But such thoughts were quickly blasted away by the constant warnings now blaring through the local radio. Hot waves capped with frothy green foam were already roaring over the shoals of the old seaside districts and barrier islands before slamming into the defensive ring of sea walls. Ice melt in Greenland and Antarctica had long since forced a retreat from the bay and ocean, pushing an eight-foot rise in sea levels over the 90 years. The near-water residences, once premium real estate, had long since been relegated to tourist homes or the odd air and ocean monitoring station

Tampa Reeling in a Dangerous Climate Zone

Tampa had fared badly, but not so badly as Miami, or the huge chunk of South Florida now covered up by the Gulf and Atlantic Ocean. In the 2030s, large numbers of South Floridians and coastal residents began an exodus northbound and inland. Some stopped in Tampa, staking a claim on the increasingly-expensive higher elevations, but most just kept heading north — past drought-stricken Georgia, through the drying Mid-Atlantic states, and on north, even into Canada. But anywhere they went, there were problems. A big zone from the Mid-Atlantic on south and west was turning into desert. The Mississippi was becoming more and more an intermittent river –practically drying up most summers and then flooding like the dickens during February through April as gigantic storms cycle south out of the Arctic, driving massive swaths of hurricane-force winds before them. The West was even worse, with a large section of four states now experiencing temperatures that make early-century conditions at Death Valley seem tame.

It was tough to find a place of safety and security, much less comfort. Lives were shorter, harder than ever before. People scrambled from place to place. They hoarded food. Most were thin — Renaissance-era voluptuousness was making a comeback. Indoor and underground farming had exploded — saving the lives of millions in the parts of the world that adopted these methods — but the dead oceans, lost farmlands, and increasingly scarce fresh water sources resulted in a cascade of regional and global crises. Needless to say, there were less people. There was basically less of anything living anywhere. All the heating and burning and storming and putrefying had seen to that — the results of two centuries of fossil-fuel emissions that ebbed and flowed but never really stopped growing.

Tampa, like every other city still functioning, had seen her fair share of all this trouble. She was one of the lucky ones — still around, clinging to the higher elevations, still building up her sea walls, making and importing what food she could, finally casting off the corrupt fossil-fuel industries and enabling what economy that remained through all-renewable energy. You couldn’t call it sustainable — that ship had long since sailed. Some day, a big glacial outburst flood somewhere in Antarctica would push seas high enough to devour Tampa whole. Or some day, a giant city-killing storm could scour enough of Tampa from the face of the Earth that the resources and effort necessary to recover would simply become a mountain too high to climb.

Haiyan enhanced

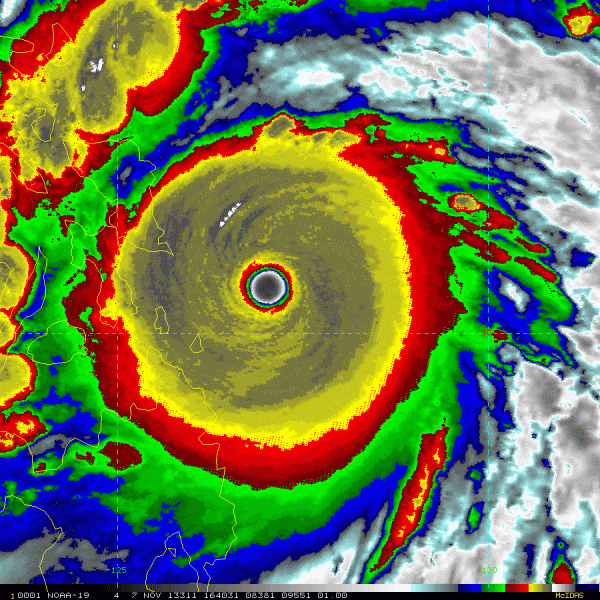
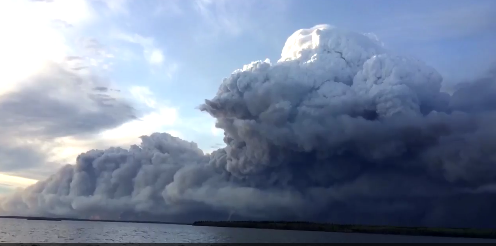
(Under the hothouse-warming scenario that is RCP 8.5, hurricanes will have the potential to substantially exceed the strength of supertyphoons like Haiyan [enhanced satellite image above] which devastated the Philippines. Image source: NOAA.)

Category 6 Hurricane Raptor Sets Sights on Tampa

For Tampa, that day may well be the day after tomorrow, for monster storm Raptor now tore through the blue, green, and purple-black waters of the Gulf of Mexico. Gorging on sea-surface temperatures near 100 F, this enormous stack of lightning-wracked clouds reached 80,000 feet into the atmosphere. It ripped that hot air and moisture up from the surface, casting it in an enormous bellow toward space. In the wall of the resulting funnel, winds howled at 230 miles per hour. Minimum central pressures measured 835 millibars. Wave-height measures from some buoys — those whose sensors hadn’t been slammed into inoperability — were coming in at 100 feet.

A 20-mile-wide swath of these conditions formed an atmospheric axe along the right front quadrant of the storm as it turned toward Tampa. Crossing land, it would produce a 35-foot storm surge topped by 20- to 40-foot breaking waves. In areas not submerged by these churning, toxic waters, the winds would blow as strong as an EF 5 tornado — enough to strip the bark from trees. This combination of conditions would demolish any above-ground structures. The cone of destruction centering at the coast, then ripping 60 to 100 miles inland before the storm finally slaked its rage.

Taller Storms Climate Change

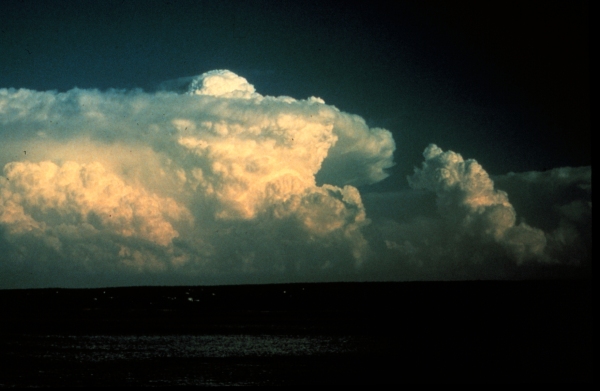
(Increasing global temperatures enlarges the zone in which storms can form, heightening cloud tops. Taller warm-air updrafts more heavily laden with moisture increases storm potential energy. In this way, climate change increases top potential storm intensity. Overshooting cloud top image provided by: Commons/NOAA.)

Similar nasty storms had helped to render the Persian Gulf region uninhabitable. Cairns, Australia had been ripped apart by such a beast five years earlier. The Phillipines, Taiwan, coastal China and Japan were visited ever more frequently by the monster category 4, 5, and 6 systems. And the thing barreling toward Tampa was among the strongest of a deadly new breed that meteorologists were now calling city killers.

The threat was not lost on residents. Those unresponsive to storms and extreme weather didn’t have a very high life expectancy. Roadways leading out of Tampa became packed with traffic. Inbound lanes were designated outbound. Trains, planes, hyperloops, and buses were all packed to the gills with those fleeing the path of Raptor. Lower populations after the migrations and mid-to-late Century crashes, in part, made the flight easier. As did the increased responsiveness. But the size of the storm swath, lower road and track resiliency due to the heat ahead of the storm, the more toxic air blowing off the ocean, and the increased population densities due to suburban abandonment created its own evacuation nightmares.

Higher populations of older persons suffering from increased rates of dementia and frailer organ systems due to toxin accumulation and disease proliferation were also less mobile. Moving this vulnerable group required a major effort on the part of Tampa volunteers and emergency responders. But after suffering decades of increased losses, lives and personal relationships were often considered all-the-more precious as people nostalgically clung to what connections remained or fought a crushing sense of fear and isolation by increasingly working to help others. The great ages of excess that preceded this period had left deep and enduring marks on the psyches of the people who’d survived through those times. And a quiet, defiant, never-again mentality had begun to emerge. In the face of such loss of beauty and safety, people were not only determined to live, they were determined to make the most of what meager lives remained to them by caring. By adding art and color to a world increasingly denuded of beauty. And by, most of all, attempting to preserve life.

The flight of Tampa’s populace from before the storm was, therefore, far more responsive, far more vigorous, than the responses of previous generations. And a vast majority heeded the warnings and left. As a result, the city became an empty shell with only about a hundred thousand die-hards and emergency personnel remaining.

With the big evacuation pulse now running inland and northbound, and with sections of Orlando evacuating while other portions hunkered down, the first outliers of Raptor began to encounter the coast. The green-white froth on the swells grew more vivid — almost looking neon in the light of dawn. Off-shore, an angry black stack of clouds thrown off from Raptor’s outer bands rushed toward shore. Gale-force gusts and a large accompanying swell pummeled Tampa’s seawalls and streets. The down-drafts and the first falling rain drove temperatures lower — into 90s (F). But the sensation was still one of oppressive heat due to the near 100 percent humidity.

The Storm Rushes In

Winds continued to rise and, over the next few hours, hot, driving rain steadily wrapped the Tampa region in a kind of stinking, hissing, steam. The continuously lifted sea walls and dikes never quite kept up with sea level rise. So even the early outliers of Raptor were enough to generate floods of putrid, green waters rushing through the lower-lying streets. Bridges and roads were quickly cut off and those remaining in town, and especially those on the newly dubbed Petersburg Island, were quickly cut off. Those poor souls remaining would have to face Raptor on their own and without the aid and comfort of an increasingly necessary emergency response force.

Current Tampa Bay Topographical Map

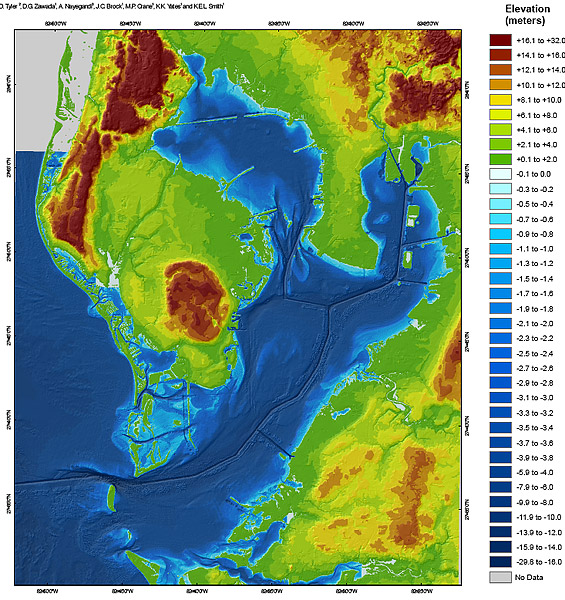
(Current Tampa Bay topographical map provided by the US Geological Survey. Under the 8 feet of sea level rise by 2090, most of the green sections would be below sea level. 8 feet of sea level rise plus 35 feet of storm surge plus 30-40 foot breaking waves would generate flooding in event some of the higher elevation areas [orange to brown]. Note that elevations in the map above are listed in meters. Image source: USGS.)

Raptor was moving rather swiftly and by early evening the storm’s eye wall was beginning to approach the coast. Off-shore, a great mound of water like a tsunami ran up from the waters of the shallow Gulf. Still taller waves rose atop it. Some of the rogue peaks stretched 150 feet above the base sea level. The net effect was one of an intense green-white mass taller than the tops of most buildings roaring in from the Ocean. The mass drowned St. Petersburg in a foundering break-water. It roared into Tampa Bay, and there it lifted the remaining ships and boats and hurled them bodily into buildings, across the shore line, and into rapidly flooding streets. Waters rushed into Tampa and on inland — in some places continuing for 10-20 miles before the great pulse of water was finally slaked by elevation.

Southwest winds rose up into a sound like a freight train. Debris was hurled into a great cloud over the flooded city. Everything from bits of sand and dirt, to paint chips, to flinders of bark from the few hardy trees remaining, to as large as vehicles and wall sections was lifted and hurled with lethal force. The churning vortex of 150 to 230 mph winds created a wall of moving air full of this shrapnel. Tampa was engulfed in a loud and angry blackness full of giant waves and flying teeth. In the above-water sections, it was impossible to see more than 10 feet outside clearly. And tens of thousands of structures were quickly ground down to their foundations by the combination of violent water and air.

These conditions covered a region stretching for 20 miles along the coast. With Raptor making landfall near Largo, this swath covered the mouth of Tampa Bay, St. Petersburg, Lealman, and Pinellas Park. With the storm running across the northern bay to make a second landfall about ten miles south and east of Safety Harbor, most of Tampa proper was affected by this zone. The raging storm surge, concentrated by the Bay and pulled along the arch of the storm’s vortex peaked to extreme heights where the bay narrowed into Tampa. And large sections of the nearby city simply drowned.

Then the storm passed inland, dumping torrential rain and cutting an 80 mile long, 20 mile wide swath of destruction through Central Florida. The wall of airborne shrapnel picked up more and more debris as it went. A few travelers on the road were forced to hunker down at a nearby recharging station’s convenience store — which subsequently collapsed. Their ordeal, recorded by portable devices which caught the hours-long images of flying cars, bits of transmission towers and other debris so damaged as to be rendered into an unrecognizable black grit across the sky, became a part of one more ‘new most violent’ storm record. A testimony to the worsening hazards and losses of the time.

As the next day dawned and rescue and disaster relief aircraft entered the storm zone, the epic destruction was more fully revealed. Observers from airplanes pointed out the swirling impressions upon the stripped land. One pilot noted that it looked like a thousand tornadoes had all gotten into a line 20 miles long and then run north and east inland. Another simply stated that it looked like the land had been pounded barren by the vast fists an angry god. Over a million structures had suffered at least moderate damage. Over 200,000 had been blown or knocked by waves down to their foundations. Despite the effective evacuation, the death count was tremendous. More than 35,000 in the Tampa region and points inland immediately lost their lives to the storm. Another 60,000 were estimated to have perished in the aftermath as a failure to restore power in time resulted in exposure to killing heat and near-shore airborne toxins. Considering comparable storm, fire or drought losses in three other US cities that year and the inevitable coming multi-meter sea level rise, government officials decided to add Tampa to the growing list of communities that would never be rebuilt.

Conditions in Context – Global Warming Increases the Top Potential Strength of the Most Powerful Storms

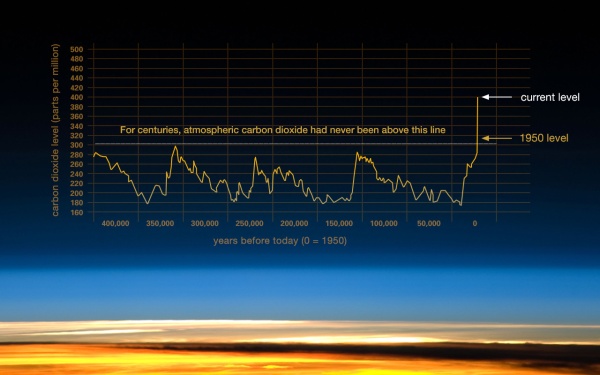
In 2016, Earth’s atmosphere isn’t yet capable of producing a storm like Raptor. But in a not-too-distant future, a 5-degree (Celsius) rise in global temperatures pushed on by 900 parts per million of atmospheric CO2 would result in heightened levels of heat and moisture fueling a great deal of instability. The Earth’s atmosphere would still be taking in huge amounts of heat at its top. The glaciers would likely be unzipping and sending out hordes of icebergs riding a pulse of cold surface water. As ever-more-dominant heat goes to war with dying cold, the amazing temperature differentials spawn equally terrible storms.

Seventy-four years from now, under business as usual warming scenarios, the tropics and subtropics are likely to be hundreds of miles to the north of their current geography. Rising troposphere heights will bring ever-taller thunderstorms. When these storms manage to organize into hurricanes, the results have the potential to be dramatically more powerful than today’s comparatively tame storms. Category 3, 4, and 5 storms would be more frequent. And a new category — 6 – may be needed for storms whose maximum sustained winds exceed a range near 200 miles per hour and whose minimum central pressure hits lower than around 880 mb (a range that starts out a bit more powerful, on balance, than the strongest storms that are capable of forming today).

Links/Statements/Attribution

The above scenario is a climate fiction portrayal of a potential category 6 hurricane impacting Tampa in the 2090s. The scenario incorporates recent scientific studies pointing toward projected increases in hurricane intensity due to human-forced warming of the Earth’s oceans and atmosphere. In particular, the work of Dr. Jeff Masters on emerging Grey Swan hurricanes driven by climate change proved very helpful in providing a groundline basis for potential category 6 hurricane strength and impacts. And it is worth noting that Dr. Masters is highlighting scientific work showing that under business as usual human warming it is possible that storms of never-before-seen intensity will hit the Tampa region.

The storm in this scenario, Raptor, is nearly as strong as the storm produced by one of the climate models Dr. Masters references. This extremely powerful storm hit Tampa in a physical computer model assessing hurricane strength under business as usual warming. The modeled storm achieved 235 mph maximum sustained winds and an 830 mb minimum pressure. It’s worth noting that we have no record of a storm of this strength ever forming on Earth. But, under greenhouse gas loads and temperatures that continued fossil fuel burning will establish by the end of this century, the Earth atmosphere becomes capable of supporting such extreme events.

To this point, it is absolutely also worth referencing Dr. James Hansen’s seminal Storms of My Grandchildren while making the very clear statement that the atmospheric brew we are pumping out will make never before seen monster storms a terrible and dangerous aspect of the world our children and grandchildren will inherit and try to survive in.

Tampa Bay Florida LANCE MODIS

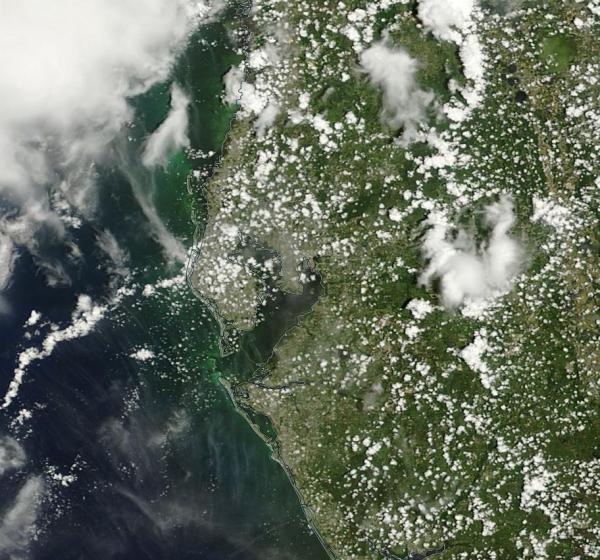
(Tampa, Florida, seen in the center of this July 2016 satellite image, is currently one of many cities facing serious threats posed by human-caused climate change. Whether Tampa or any of these other cities survive depends on how well human beings respond and on how much we lessen the coming damage by reducing fossil fuel emissions now. RCP 8.5 is a bad climate scenario. The only problem is that all we have to do to get there is simply continue to burn oil, gas, and coal. Image source: LANCE MODIS.)

The scenario also takes into account various broader Earth System changes such as potential sea level rise due to melting glaciers, increased disruption of food and water supplies, loss of ocean health and increased anoxia and related water and local air toxicity (due to warming and increased nutrient run-off into the world ocean), model simulations and understandings of the increasing prevalence of extreme land and ocean surface heat and 2 meter humidity (wet bulb temperatures increasing into the lethal range of 35 C+), and expanding drought, disease and extreme weather zones.

This particular event and context follows closely to conditions projected under the IPCC’s business as usual fossil fuel emissions or RCP 8.5 warming scenario. For the purpose of this exercise, I have added climate conditions to the business as usual case that I see as plausible given that level of warming. Some of these additions are based on my own interpretation of scientific efforts that are currently not fully settled. However, I feel the overall portrayal is likely at least relatively accurate given various model projections and how the Earth System appears to have changed in response to past warming events.

It’s worth noting that RCP 8.5 does not assume zero renewable energy adoption. It simply assumes that fossil fuels will remain the dominant source of energy with consumption growing through the end of the 21st Century. As such it results in a catastrophic warming scenario over a less than one century time-frame. But such a warming would be achieved over longer time-frames so long as human carbon emissions are not rather swiftly brought to zero, Earth System feedbacks are strong enough, or elevated atmospheric greenhouse gas levels are not drawn down. Conditions similar to RCP 8.5 at 2100 could be achieved by approximately 500 ppm CO2 by around 2500. A reality that increases the necessary urgency of our current mitigation responses. Lower level warming and emissions scenarios are still dangerous, but do not result in the higher levels of harm evident in RCP 8.5.

Human impacts in the scenario such as loss of lives and lifespan reduction are based on my own understanding of how human beings are likely to adapt to such situations and how multiplied environmental stresses are likely to start to overwhelm human population growth in net by middle-to-end Century under the RCP 8.5 scenario. The writing above assumes that the civil system surrounding Tampa and this section of the United States remains at least partially intact due to cooperative effort on the part of individuals living in society at the time. Such a response is hopeful, but it is not guaranteed.

From Russia With #HateTrumpsLove — Is Putin’s Petrostate Attempting to Tilt US Election Toward Republicans?

As the Democratic National Convention continues its week-long stay in Philadelphia, accusations of Russian hacking continue to cloud the proceedings. At this point, it seems likely that Russia is responsible. What’s less clear is what that will mean going forward.Wired

****

Donald Trump and Vladimir Putin, for a long time now, have aligned their statements and political actions. As it becomes more and more certain that Russia hacked into Democratic National Committee emails in what appears to be a weaponized information warfare attack on the U.S. electoral process, one has to seriously consider the notion that Trump stands to substantially benefit from such an act of international cyber-aggression.

When asked in December about the killing of journalists under Vladimir Putin, the Republican presidential candidate, who just the day before had called Putin “brilliant” and “a strong leader”, reluctantly admitted that such atrocities under Putin might possibly be a bad thing.

Russia Petrostate

(Russia is one of the largest oil and gas producers in the world. As a state, it has put very little effort into developing renewable energy. Instead, it has focused an amazing attempt to militarily control and exploit an expanding range of Arctic oil and gas sources. Russia’s claimed greenhouse gas emissions reduction goals are rife with distortions and cherry picking, and the state is a well-known persecutor of environmentalists and climate change action advocates. What could a climate-change denier and fossil-fuel energy dominance advocate like Trump possibly have in common with Putin’s Russia? Image source: EIA.)

Trump went on to backhandedly defend Putin’s alleged poll-rigging and positively compared Russia, which is rated worse than Sudan and Iraq when it comes to press freedoms, to the United States. Implied was not only a kind of admiration in Trump of Putin, but for the kinds of oppressive political activities that denigrate the foundations of democracy itself.

This noted tendency to defend the political strongman is especially salient when you consider the fact that Putin has held growing autocratic power over a Russia now falling down the dark hole of ever-worsening human rights abuses and political persecution by various means for the past 16 years and shown all of the worst kinds of contempt for the electoral process. All of this served to highlight Trump’s callous disregard for a free press — one of the foundations of democracy here in the U.S.

Various astounded and befuddled Republicans, including the likes of George Will and Mitt Romney, showed a modicum of morality and quickly condemned Trump’s admiration for Putin. And CNN, though not as tonally taken aback as MSNBC’s Joe Scarborough, noted the existence of a strange “bromance” between Trump and Putin.

Russian Petro-State Authoritarian and Trump Have a Lot in Common

Whether it’s an autocrat profiting from draconian laws, intimidation and human rights abuses in Russia or a corrupt billionaire rigging the game against struggling students for monetary gain in the U.S., it would appear that both Trump and Putin have quite a lot in common. And though political and economic bullying may seem the most obvious, there’s a deeper alignment here that we should not entirely ignore.

Fracking Wasteland

(Fracking wastelands like these would be expanded by a Trump energy policy which would broaden and extend fossil fuel dependence, setting us on a path toward increasingly more violent and harmful changes to the global climate. Russian fossil-fuel development policies run along similar lines. Trump fails to acknowledge climate change as a threat and has nominated a climate-change denier to sit as his energy adviser. Image source: Greenpeace.)

At issue is the fact that Russia is a state that has unwisely and irresponsibly bet a large share of its economic fortune on fossil fuel exploration and extraction. U.S. policies aimed at mitigating human-caused climate change by reducing fossil-fuel burning and increasing renewable energy access would, by extension, erode Russia’s fossil-fuel based economic model. Russian plans for using oil and gas as a lever to exert political influence over Europe and China also fades in a world that rapidly adopts renewable energy.

Hillary Clinton and a Democratic Party invigorated by Bernie Sanders have come to, more and more strongly, support the kind of needed action in the face of rapidly worsening human-caused warming. Donald Trump and the Republicans who support him are climate-change skeptics or deniers. Trump’s policies call for vastly expanded fracking, removal of supports for renewable energy like Obama’s Clean Power Plan, and an increasing dependence on and production of oil and gas. Such retrograde policies would set the U.S. back on a terribly damaging business-as-usual carbon-emissions path and secure the dominance of the kinds of polluting fuels that Putin’s Russia has irresponsibly bet its economic future upon.

Russian Hacking of the DNC in Context

Such an alignment of interests cannot be ignored, and nor should Trump’s and Putin’s mutual overtures or Trump’s defense of Putin’s various and noted abuses of power. It is in this context that the hacking of DNC emails, much like the hacking and misrepresentation of climate scientist emails over recent years, has occurred.

NOAA Red Marble

(NOAA’s red marble view of what business-as-usual fossil-fuel emissions looks like: a world sweltering beneath devastating global heat. Under energy policies supported by those like Trump and Putin, the world is bound to get to that wretched and wrecked state. Image source: NOAA.)

In this case, Trump’s alignment with Putin is concurrent with what appears to be an active effort of information warfare against the United States. Wired Magazine notes:

If the allegations do prove correct, this is an unprecedented step for Russia. Hacking is nothing new, but publicizing documents to attempt to sway an election certainly is. Putin would clearly prefer a Trump presidency. The billionaire Republican candidate is a longtime admirer of Putin’s, and has publicly stated that he wouldn’t necessarily defend NATO allies against a Russian invasion. To top it all off, Trump’s campaign manager, Paul Manafort, formerly worked as an advisor to Viktor Yanukovych, the Russian-backed President of Ukraine before he was ousted in 2014.

In addition, Trump’s own belligerence on the subject may well be crossing the line into an ongoing association with, and support of, an entity conducting harmful espionage operations against the U.S. government and its political leaders, and against the integrity of the process of establishing such a government. Wired, in a recent update:

In a press conference Wednesday, Republican presidential candidate Donald Trump invited Russia to retrieve “missing” emails from Hillary Clinton’s campaign and release them. Cybersecurity experts described the remarks as “unprecedented” and “possibly illegal.”

If even only some of this bears out and if the obvious alignments and motivations between Trump and the international fossil fuel establishment prove to be part of the motivator (pretty clear motive and pattern of behavior here folks), then it looks like the climate wars — which have been a vicious political and media undercurrent for years now — just went hot.

Links/Attribution/Statements

Putin Election Fraud

Trump University Fraud

Here’s What We Know about the Russia DNC Hack

Spy Agency Consensus Grows — It Looks Like the Russians Hacked the DNC

Think of Russia as a Petrostate

NOAA

Obama’s Clean Power Plan

The Hockey Stick and the Climate Wars

Climate Change, Drought Fan Massive Sand Fire, Forcing 20,000 Californians to Flee

On Friday, amidst temperatures exceeding 100 degrees Fahrenheit, and at a time when California is now entering its fifth year of drought in a decade when seven out of the last ten years have been drought years, a rapidly growing and dangerous wildfire erupted in the hills north of Los Angeles.

(Sand Fire looms over Santa Clarita, California. Video source: Sand Fire Time Lapse.)

The Sand Fire, which some firefighters are calling practically unprecedented, sparked before typical wildfire season peak and began a rapid spread that consumed 10,000 acres per day from Friday through early Monday. Nearly 3,000 firefighters scrambled to gain a foothold against the blaze, but were somewhat unprepared as contracted water-bomb aircraft from Canada won’t be available until next month, during what is usually the worst part of fire season. The aircraft assistance was planned as extra fire-suppression capability for Santa Clarita, but typical fire threat and risk assessments no longer hold much water in an era where human-forced climate change is pushing temperatures and drought conditions to new extremes across California.

By Monday, the fire had exploded to 33,000 acres (51 square miles). In total, 18 buildings are now reported to have burned and more than 10,000 others have been evacuated. A population the size of a small city, 20,000 people, have now been displaced by this rapidly expanding wildfire. Due to heroic efforts by firefighters, an estimated 2,000 homes have been saved so far. Sadly, the fire has also now claimed a life.

California Wildfires July 24

(Smoke plumes from large wildfires burning over southern and western California, framed by a warming Pacific Ocean, a drying Central Valley, and what appear to be snow-free and bone-dry Sierra Nevada Mountains in this July 24 LANCE MODIS satellite shot.)

Continued hot temperatures and 30-mile-per-hour winds are expected to continue to fan the fire today, which as of this writing is just 10 percent contained. If the worst case is realized and this fire continues to expand out of control, as many as 45,000 homes may ultimately be forced to evacuate. Such an evacuation would be comparable in scale to the Fort McMurray Fire which raged through Alberta during May and forced more than 90,000 people to flee.

Conditions in Context — Living in a Fire Age

There is widespread geological evidence of voracious fires burning through large regions of the globe during past hothouse warming events. At the Paleocene-Eocene boundary 56 million years ago, a warming rate that was about ten times slower than what we are experiencing now set off immense blazes that ripped through the world’s peatlands and forests. In other words, evidence points to past instances of Earth warming into hothouse conditions generating periods of intense fires that may well be called fire ages. Today, the Earth is about 1.2 degrees Celsius warmer than during the late 19th century. This high temperature departure combines with a very rapid rate of continued warming to dramatically increase wildfire risks around the globe.

Drought Climate Change

(Conditions related to climate change continue to increase drought frequency across the U.S. West. For the past five years, California has seen the brunt of this predicted increasing drought trend as a result of human-forced warming. Image source: US Drought Monitor.)

More local to the Sand Fire, California is in a zone that global climate models have long predicted would suffer from severe heat and drought as a result of fossil-fuel burning and related human-forced warming. This year’s persistent above-average temperatures on the back of five years of drought have greatly increased wildfire risk for the state. Millions of trees now stand dead, surrounded by withered vegetation in a heating and drying land — a vast range of additional fuel that is ever more vulnerable to ignition.

Not only do these conditions generate a higher risk of extreme fires during fire season — sparking blazes like June’s Erskine Fire which burned 200 homes and was the most destructive fire in this California county’s history — but they also increasingly spark large wildfires out of season. It’s a set of conditions that basically generates a year-round fire season for the state, even as it also sparks winter wildfires at far-flung locations around the world.

Links/Attribution/Statements

10,000 Homes Evacuated Due to Wildfire

Sand Fire Map

Sand Fire Time Lapse

Omens of a Fiery Future

US Drought Monitor

29 Million Trees Died in California this Year

Climate Models Predict US Megadrought

Hat tip to DT Lange

From the Arctic to Africa to the Amazon, More Troubling Signs of Earth Carbon Store Instability

The time for debate is over. The time for rapid response is now. The Earth System just can’t take our fossil-fueled insults to her any longer.

*****

Arctic Wildfires

(These Arctic and Siberian wildfires just keep getting worse and worse, but what’s really concerning is they’re burning a big hole through one of the Earth’s largest carbon sinks, and as they do it, they’re belching out huge plumes of greenhouse gasses. Image source: LANCE MODIS.)

Carbon Spikes over the Arctic, Africa, and the Amazon

Today, climate change-enhanced wildfires in Siberia and Africa are belching out two hellaciously huge smoke clouds (see images below). They’re also spewing large plumes of methane and carbon dioxide, plainly visible in the global atmospheric monitors. Surface methane readings in these zones exceed 2,000 parts per billion, well above the global atmospheric average.

Even as the fires rage, bubbles of methane and carbon dioxide are reportedly seeping up from beneath the tundra — generating big blisters of these heat-trapping gasses that are causing sections of the Arctic soil to jiggle like jelly. Greenhouse gas content in the blisters is, according to this Siberian Times report, 7,500 parts per million CO2 and 375 parts per million methane. That’s about 19 times current atmospheric CO2 levels and 200 times current atmospheric methane levels. Overall, these carbon jiggle mats add to reports of methane bubbling up from Arctic lakes, methane blowholes, and methane bubbling up from the Arctic Ocean in a context of very rapid Arctic warming.

Surface Methane

(Methane spikes over Siberia, Africa and the Amazon correlate with wildfires and extreme drought conditions associated with human-forced climate change. Add in carbon dioxide spikes over the same regions of Africa and the Amazon and it begins to look like a visible amplifying feedback signal. Image source: The Copernicus Observatory.)

Meanwhile, a global warming-enhanced drying of the Amazon rainforest appears to be squeezing a substantial amount of these hothouse gasses into the Earth’s atmosphere. Copernicus Observatory surface monitors indicate pools of 600 to 800 parts per million CO2 concentrations near and around the Amazon rainforest. These 100- to 200-mile-wide spikes in CO2 concentration are 1.5 to 2 times current atmospheric concentrations. These very high CO2 levels occur even as methane readings over the Amazon are also abnormally high, a possible precursor signal that the NASA-predicted Amazon rainforest wildfires this summer may be starting to ignite.

Any one of these instances might be cause for some concern. Taking all these various observations together looks like a clear signal that the Earth is starting to produce an increasingly strong carbon feedback response to human-forced warming. If true, that’s some pretty terrible news.

Human-Forced Warming Warps the Carbon Cycle

Each summer, the boreal forests of the Northern Hemisphere take a big breath. In the warmer airs, leaves unfurl, grasses grow, and all kinds of CO2-respiring organisms take hold. Together, they produce a frenzy of activity, a riot of life gathering great stores of energy for the next plunge into winter. Over time, this natural capture of CO2 stores this atmospheric carbon in plant matter that ultimately becomes soil, permafrost, or is buried in the Earth in the form of various hydrocarbon stores.

It’s this annual great growth and greening that, in large part, drives the seasonal up-and-down swings of the global carbon cycle — a cycle that, under stable conditions, would generate an annual wave in atmospheric CO2 concentrations running over a long-term flat line.

Surface carbon dioxide

(Surface CO2 readings show boreal forest uptake of CO2 over Siberia, Scandinavia, and parts of North America. Note the CO2 surface hot-spots over the fire zones in Central Africa and over the drought-stricken Amazon rainforest. Image source: Copernicus Observatory.)

Ever since the advent of the Industrial Revolution, human fossil-fuel burning has been adding carbon to the atmosphere. The result is that these seasonal swings, driven by plant respiration, have overlaid a significant upward trend in atmospheric carbon, one that this year pushed peak atmospheric CO2 values to near 408 parts per million. This is a level not seen in about 15 million years.

That increase in its turn has dramatically warmed the Earth — a result that has its own larger impact on plants, on the cycles that influence their ability to take in carbon, and even on the older carbon that was long ago stored in plants but is now sequestered in the soil, permafrost and oceans.

Amazon Drought Africa and Siberia Burning

(LANCE MODIS satellite shot shows extensive wildfires spewing large plumes of smoke over Siberia and Africa. Meanwhile, very dry conditions in the Amazon appear to be generating understory fires even as carbon is baked out of the Equatorial soil. Click image to zoom in.)

Warm the world up, as humans have, and you generate what, in scientific parlance, is a carbon feedback. Overall, the ocean can take in less atmospheric carbon and increasingly bubbles with thawing methane, the soils can store less carbon even as more is baked out in the heat, the plants and peats on balance burn more than grow, permafrost thaws and releases its own carbon. It is this carbon-cycle response to warming that is expected to add more carbon dioxide and methane into the atmosphere on top of that already being released through the harmful processes of fossil-fuel extraction and burning.

Warming Forces More Carbon Out of Lands and Seas, Keeps More in the Atmosphere — But How Much is Still Pretty Uncertain

How much heat-trapping carbon the Earth System will ultimately add to human fossil-fuel emissions is kind of a big scientific question, which is answered in large part by how much fossil fuels humans ultimately burn and how much heat is ultimately added to the Earth’s oceans, glaciers, and atmosphere.

Climate Change Impact on CO2 Simulations

(A sampling of climate model-projected Earth System CO2 feedbacks to human-forced climate change. Note the high level of variation in the model projections. It’s also worth noting that these model projections did not include difficult-to-assess permafrost and hydrate responses to warming over the period through 2100. Image source: IPCC AR 4 — Coupled Climate-Carbon Cycle Projections.)

Back in 2007, the IPCC estimated that around 87 parts per million of additional CO2 would be added to the world’s airs by 2100 (under an apparent assumed final human-driven CO2 accumulation of 700 ppm) as a result of this kind of carbon feedback to human warming. This implied about a 20-percent positive CO2 feedback to warming. However, the model projections were wide-ranging (from 4 to 44 percent) and the overall assessment drew criticism due to a lack of inclusion of permafrost and hydrate feedback estimates.

In 2012, the IPCC produced a more uncertain, complex, and unclear set of projections that notably didn’t include permafrost carbon feedback or methane hydrate feedback model projections, the scientific understanding of which is apparently still developing. But despite a good deal of specific-issue uncertainty, the consensus appeared to state that over the medium- (21st century) and long-terms (multi-century), we’d have a significant amount of extra carbon coming from the Earth System as a result of responses to a human-warmed atmosphere and ocean.

Smoke From African Wildfires

(African wildfires, whose smoke plumes are visible here, are just one of many sources of carbon spikes around the globe triggered by human-forced climate change. Amazon rainforest next? NASA seems to think so. Image source: LANCE MODIS.)

Overall, there’s a decent amount of support for the notion that the Earth System is pretty sensitive to warming, that it tends to respond to even a relatively small amount of initial incoming heat in ways that produce a good deal of extra carbon in the atmosphere. After all, only a small change in the way sunlight hits the Earth is enough to end an ice age and pump an additional 100 parts per million of CO2 out of the Earth’s carbon stores as a result. The added heat forcing provided by the current human fossil-fuel emission is far, far greater than the one that ended the last ice age.

It is in this understanding and context that we should consider what appears to be an increasing number of Earth System responses to a human-forced warming that has currently exceeded 1 degree Celsius above 1880s averages. It’s easy to envision that these responses would grow in number and intensity as the Earth continues to warm toward 2 C above 19th-century averages.

Links/Attribution/Statements

LANCE MODIS

Coupled Carbon Climate Cycle Projections

Carbon and Other Biogeochemical Cycles

Arctic Methane Bubbles are Leaking 200 Times Above Normal

The Copernicus Observatory

The Keeling Curve

Hat tip to TodaysGuestis

Hat tip to Colorado Bob

Hat tip to DT Lange

Hat tip to Andy in San Diego

El Nino is Basically Over — But this Global Coral Bleaching Event Just Won’t End

Back in 2014, an unsuspecting world was on the verge of a major global temperature increase. But despite warnings from scientists like Dr. Kevin Trenberth that deep ocean warming had sped up and would eventually result in rapid surface warming, the big media meme at the time was that global warming had ‘paused.’ Originating in The Economist, and swiftly spreading to numerous other news outlets, this particular blast of bad information fed the public a big helping of false sense of security.

In 2014 through 2016, maximum global temperatures jumped from around 0.65 degrees Celsius to around 1 C above the 20th-century average. In just three years’ time, the whole of the Earth’s surface had warmed by about 0.35 C. This is like cramming all of the warming from 1880 to 1980 into the three-year 2014-to-2016 period. Never before in all of the global climate record starting in the late 19th century has the Earth warmed so much in so short a time.

Leaving 20th Century Climate Behind

(Huge jump in global temperatures over the past three years has probably passed a number of climate thresholds — including temperature thresholds for key sea creatures like corals. Data Source: NOAA. Image source: Mashable.)

Global warming hadn’t paused at all. It was just getting ready to hit the accelerator.

Global Heat Spurs Bleaching, Mass Coral Mortality

All this newly-added surface heat represents a big step up into much warmer conditions for the global climate. What this means is that even the coolest months now will probably approximate the warmest months during the big super El Niño of 1998. Such a large temperature increase in so short a period means that the world has likely hit a number of tipping points for geophysical and ecological harm. One of the most visible of these tipping points involves an ongoing ecological crisis — a global coral bleaching event.

Perhaps the most vivid and heart-wrenching example of what is a very wide-ranging coral mortality situation is the bleaching-related damage to Australia’s Great Barrier Reef. In a terrible blow to one of the world’s most stunning natural wonders, about a quarter of the Great Barrier Reef’s corals have already been killed off — an event that some scientists say may eventually lead to 100 percent mortality of the Reef’s corals. (see a related report in The Guardian).

American Samoa Bleaching

(Coral bleaching events like this one in American Samoa during 2015 have been happening around the world since 2014. It’s a global event that’s still ongoing despite a turn toward La Niña conditions in the Pacific. This is the longest global coral bleaching event ever recorded, and one that could continue into 2017 or beyond. Image source: Nature.)

The Great Barrier Reef is not the only reef system to suffer. In fact, the added heat due to human-forced warming of the atmosphere and oceans has generated bleaching-induced heat stress and mass coral mortality the world over. And some of the world’s other great reef systems, including Kiribati, which lost 80 percent of its live corals in 10 months, have been hit so hard it’s doubtful they’ll ever recover.

The Seemingly Never-Ending Global Coral Bleaching Event

At issue is the fact that all this added global heat is creating a situation where reefs bleach year after year and, in some cases (as was the case with parts of the Great Barrier Reef this year) even bleach during winter. It’s a coral mass mortality that falls under the definition of a global bleaching event. But it’s also happening with an intensity, persistence, and duration that we’ve never seen before.

Beginning in 2014 with the big warm-up that preceded the 2015-2016 El Niño, the present global coral bleaching event is now, according to NOAA, the longest-running and the most extensive such event to have occurred in the modern record. NOAA notes:

…the current global coral bleaching event is the longest ever recorded. It has affected more reefs than any previous global bleaching event and has been worse in some locales (e.g., Great Barrier Reef, Kiribati). Thermal stress during this event also has caused mass bleaching in several reefs that never bleached before (e.g., northernmost Great Barrier Reef).

Global coral bleaching event continues

(Global coral bleaching event extent as of July 20 according to NOAA. Note that sections of bleaching watch and warning conditions now extend across the northern edges of NOAA’s map, an indication that latitudinal extent of bleaching is expanding beyond typical ranges even as bleaching due to rising ocean temperatures appears to be becoming a near-constant issue for world corals. Image source: NOAA.)

NOAA had initially forecast that this very-long-duration bleaching event would end sometime in 2016 as El Niño faded out. However, with sea-surface temperatures in the equatorial Pacific hitting the cool side of natural climate variability in the form of La Niña-like conditions during recent weeks, and the current global coral bleaching event still going strong, one has to wonder if oceans have now become hot enough to spur widespread bleaching at almost any time.

NOAA now predicts a possible end to the current global bleaching event in 2017, giving the event a four-year duration. But with global temperatures continuing to warm, what we may be seeing is the start of an unbroken or nearly unbroken period of expanding coral bleaching, a time when global stress to corals due to high ocean temperatures is practically continuous.

Links/Attribution/Statements

NOAA

NOAA El Nino

Sections of the Great Barrier Reef Suffering Complete Ecosystem Collapse

Kirubuti Loses Almost all its Corals Due to Bleaching

Nature

Great Barrier Reef Catastrophe Laid Bare

Leaving 20th Century Climate Far Behind

Hat tip to June

Hat tip to Colorado Bob

Hat tip to DT Lange

Large Sections of Greenland Covered in Melt Ponds, Dark Snow

Over the past couple of days, temperatures across the Greenland Ice Sheet have really ramped up. The result has been a pretty significant mid-to-late season melt pulse. According to NSIDC, nearly 40 percent of the ice sheet surface has been affected by surface melt during recent days. And Greenland ice mass balance appears to have also taken a hit.

This surface melt pulse is, arguably, best portrayed in the satellite imagery:

Greenland Melt July 20

(Large section of Western Greenland near the Jackobshavn Glacier experiencing significant surface melt on July 20, 2016. Image source: LANCE MODIS.)

On July 20th, this approximate 300 x 70 mile swath of Western Greenland shows a number of distinct strong melt features. Near the interior edge of the melt zone we notice the light blue coloration indicative of widespread and general surface melt. From the satellite, this bluing gives the impression of a thin layer of surface water covering a widespread area of the ice sheet. But it is more likely that the blue tint comes from a plethora of small melt ponds and rivers that blend together in the lower resolution satellite shot to lend the impression of ubiquitous water coverage.

Large Melt Ponds, Dark Snow Over Western Greenland

Further in, we notice the darker blue swatches that indicate large melt ponds. Some of these ponds are quite extensive — measuring 1/4 to up to 1 mile in length. Ponds of this size tend to put a lot of pressure on the Greenland surface and can pretty quickly bore down into the ice sheet’s depths and interior. The water then either becomes locked in the ice — forming a kind of subglacial lake — or flows to base regions of the glacier where it can lubricate the ice — causing it to speed up.

Large Melt Ponds Dark Snow Western Greenland

(Close up satellite shot shows 1/4 to 1 mile long melt ponds, general melt ponding and a darkened Greenland Ice Sheet. Image source: LANCE MODIS.)

Still closer to the ice edge we find greatly darkened patches of ice. Darkening occurs when ice melt reveals and thickens past layers of ice sheet dust and soot accumulation. Each year, winds carry dust from land masses and soot from fires — which now, due to rapid Earth warming, burn more frequently over the Arctic and near-Arctic — to the ice sheet where it accumulates. This darker material is then covered by the annual layers of snowfall. If enough snow and ice melts, the yearly layers of dust and soot accumulation can concentrate into a gray-black covering. Such a covering is clearly visible in the July 20 satellite imagery above.

According to Dr. Jason Box, as much as 5.6 percent of the Greenland Ice Sheet was covered by this darkening, which he calls Dark Snow, as recently as 2014. Darkening of the Greenland ice sheet can accelerate melt as it reduces the ice sheet’s ability to reflect the sun’s rays — resulting in more overall heat absorption.

Substantial Northeastern Greenland Melt Also Visible

Zachariae Surface Melt Darkening

(Zacharie Isstrom Glacier in Northeastern Greenland shows significant melt in July 20 satellite shot. Image source: LANCE MODIS.)

Though surface melt and darkening is quite extensive along the southwestern flank of Greenland, toward the north and east, widespread surface melt, ponding and ice darkening is also visible over sections of the Zachariae Glacier. Here, in a far northern section of Greenland that borders the Arctic Ocean, we find an approximate 100 x 20 mile region of melting and darkening ice. Note the tell-tale bluing and dark gray patches visible in the above image.

For this region, ice has tended to experience more melt during recent years as sea ice within the Fram Strait and Greenland Sea has receded. This has revealed more darker ocean surfaces which, in turn, has absorbed more incoming solar radiation resulting in increased warming for this section of Greenland.

Conditions in Context — Human-Forced Warming Pushing Greenland to Melt Faster

Overall, Greenland melt is this year less extensive than the record 2012 melt season. However, the current mid-to-late season pulse has forced a big melt acceleration that may result in melt that exceeds 250 billion tons of ice loss for 2016 (or the average over recent years). In the pretty near future, continued high global temperatures and additional warming due to human fossil fuel emissions will almost certainly push Greenland to melt at a faster pace.

To this point, the Earth has now warmed by more than 1 C above Preindustrial temperatures. And a range of 1-2 C warming from this baseline in past climate eras such as the Eemian resulted in a 10-20 foot rise in world ocean levels. We’re in this temperature range now. So that’s pretty bad news for sea level rise — to which Greenland now contributes enough melt to lift seas by about 0.75 mm every year. The only real questions at this point are how fast will that already substantial melt accelerate, and will we halt fossil fuel burning swiftly enough to slow it down.

Links/Attribution/Statements

LANCE MODIS

The National Snow and Ice Data Center

Greenland Surface Mass Budget

These Stunning Photos of Greenland’s Dark Snow Should Worry You

The Dark Snow Project (please support)

Hat tip to Andy in San Diego

Hat tip to DT Lange

Scribbler-sponsored note on Trump:

Trump Chooses Climate Change Denier as Energy Advisor

Record Hot Atlantic Basin to Fuel Brutish 2016 Hurricanes?

Last week, Gulf of Mexico sea surface temperatures off Tampa Bay were outrageously hot. On July 10, the ocean temperature measure hit 93 degrees Fahrenheit (34 Celsius). By the 11th, temperatures had warmed still more. And by the 12th, ocean surfaces had hit a sweltering 95 F (35 C).

Tampa bay water temperatures

(NOAA shows extreme sea surface temperatures at Old Port in Tampa, FL. Hat tip to Michael Lowry.)

It’s pretty rare that you see ocean waters anywhere on Earth become so hot. And when you do, it’s often in places like the Red Sea or the Persian Gulf — not the Gulf of Mexico. But in the new world driven to increasingly extreme warmth by human fossil fuel emissions, the potential heat bleeding off of ocean surfaces has jumped by quite a bit.

And it’s not just true with Tampa Bay. According to Michael Lowry, a hurricane specialist at The Weather Channel, the whole of the Gulf of Mexico recorded its hottest average daily July sea surface temperature this month at 86.3 F (30.1 C).

Atlantic Basin Sees Record July Heat

The record ocean heat extends still further. National Hurricane Center storm specialist Eric Blake earlier today noted that, for July, the entire Atlantic Basin west of longitude 60° W is the hottest it’s ever been during any hurricane season, including the record storm year that was 2005. In other words, a huge zone of ocean stretching from the far eastern edge of the Caribbean, encompassing all of the Gulf of Mexico and running up the entire eastern seaboard of the US and on to just east of Bermuda is now seeing the hottest July ocean temperatures experienced in our modern records.

Record Hot Atlantic Basin Sea Surface Temperatures

(Sea surface temperatures hit record ranges for the western North Atlantic during recent days. CDAS image via Eric Blake.)

Overall ocean surface temperatures range from 0.5 to 1 C above average for the Caribbean, 0.5 to 2.5 C above average for the Gulf of Mexico and 1 to 6 C above average for the coastal US Atlantic. These temperatures compare to an already hotter-than-normal 1981-to-2010 average, so departures from the 20th-century average would be even greater.

Record Ocean Heat to Strengthen 2016 Atlantic Hurricanes?

Hot ocean temperatures are fuel for the powerful storms we call hurricanes. But it’s not the only ingredient. Low-pressure formation at the surface, a lift in the atmosphere, high pressure aloft, widely available moisture, and a lack of wind shear are all atmospheric assists that aid in storm formation. So far during July, a dearth of these other factors has resulted in no storms as of yet for the month.

2016, however, has already seen four named tropical storms — including the odd winter Hurricane Alex and three tropical storms which spun up during June. And given the extreme ocean surface heat in the Northwestern Atlantic, some agencies are beginning to call for the potential for more and possibly powerful storms on the way.

According to The Weather Network:

The main driving elements for hurricane formation in the Atlantic are the SST values present in the Atlantic itself, the predicted wind shear conditions in the region, and the SST pattern found in the Pacific related to the timing of the transition from El Niño to La Niña in the equatorial Pacific Ocean. Model predictions anticipate that the second part of this 2016 season will be more active as La Niña intensifies in the Pacific and becomes one of the main drivers of activity for the Atlantic.

As a result of the combined extreme Atlantic Basin heat and the predicted emergence of La Niña conditions in the equatorial Pacific, some hurricane monitors are upping the number of storms predicted for 2016. Colorado State is now forecasting 15 named storms as opposed to its earlier 13. However, its prediction for the number of major hurricanes has remained the same at two, with one affecting the US.

Predicted tropical wave

(Models predict what appears to be a very healthy tropical wave emerging off the west coast of Africa by July 28. If a tropical cyclone results that tracks into record warm western Atlantic waters, peak storm intensity near the US could be quite extreme. Hat tip to meteorologist Ryan Maue for the ECMWF infrared forecast capture.)

However, predicted warm-water formation in the Pacific off Mexico could dampen Atlantic storms by pushing in more dry air and developing a higher degree of wind shear than is typical during a La Niña year. In addition, large African dust flows currently over the tropical Atlantic also may tend to suppress storm formation.

Given the ambiguous conditions noted above, the situation still appears to be a bit of a crapshoot. That said, those extreme sea surface temperatures near the US will likely continue to ramp up through August. And that’s a situation that creates a potential where storms approaching the US rapidly intensify as they hit those record-hot waters. Overall, it’s a pretty dicey environment for forecasters and one that has been wagged in no small amount by conditions related to human-forced warming.

Links/Attribution/Statements

NOAA

National Hurricane Center

ECMWF

The Weather Network

Michael Lowry

Ryan Maue

Eric Blake

Hat tip to DT Lange

Global Heat Leaves 20th Century Temps ‘Far Behind’ — June Another Hottest Month on Record

We’ve left the 20th century far behind. This is a big deal. — Deke Arndt, head of NOAA’s National Centers for Environmental Information

*****

One of the top three strongest El Ninos on record is now little more than a memory. According to NOAA, sea surface temperatures (SSTs) in the Central Equatorial Pacific hit a range more typical to La Nina conditions last week. This cool-pool formation follows a June in which ocean surfaces in this zone had fallen into temperatures below the normal range.

El Nino Gone

(El Nino had faded away by June and turned toward La Nina-level temperatures by late June and early July. Despite this Equatorial Pacific cooling, June of 2016 was still the hottest June on record. Image source: NOAA.)

But despite this natural-variability related cooling of the Equatorial Pacific into below-normal ranges, the globe as a whole continued to warm relative to previous June temperatures. According to NASA, last month was the hottest June in the global climate record.

NASA figures show the month was 0.79 degrees Celsius warmer than the 20th century baseline (1951 to 1980) average, edging out June of 2015 (when El Nino was still ramping up) by just 0.01 degree C to take the dubious position of the new hottest June ever recorded by human instruments. June 2016 was also about 1.01 C hotter than temperatures in the 1880s, at the start of NASA’s global climate record.

January to June — Anomalous Warmth Centers Over Arctic

June marks the 9th consecutive hottest month on record in the NASA data. In other words, on a month-to-month comparison, each month since October of 2015 was the new hottest of those months ever recorded. In addition, the six-month 2016 climate year period of January to June showed an average global temperature of about 1.31 C above 1880s averages — perilously close to the 1.5 degree C global climate threshold.

Record warm Earth

(Arctic heat dominated the first half of 2016 which is likely to end up being the hottest year ever recorded in the global climate record. Image source: Berkeley Earth.)

Distribution of this anomalous heat during this six-month period, despite the Equatorial warming pulse related to El Nino, was focused on the Arctic, as we can see in this Berkeley Earth graphical composite of the NASA temperature series above.

Warmest temperature anomalies for the period appear above the Barents and Greenland Seas boundaries with the Arctic Ocean and approach 12 C for the six-month period. During this period, this region has hosted numerous warm-wind invasions of the Arctic from the south. A second, similar slot of warm south-to-north air progression appears over Alaska.

Record June Warmth Most Apparent at Northern Continental Margins

During June, the Arctic as a whole remained much warmer than average, with the region from latitudes 80° to 90° North seeing a +0.8 C temperature departure in the NASA measure. The highest anomaly regions globally, however, were near the continental margins bordering the Arctic Ocean in the region of latitudes 70° to 75° North. Here temperatures ranged near 2 C above average.

June Zonal Anomalies

(According to NASA’s zonal anomaly measure, the northern continental margins showed the highest temperature anomalies globally. Image source: NASA GISS.)

Some parts of this region were particularly hot. These included the region of Russian Siberia near the Yamal Peninsula, which saw 4-8 C above average temperatures for the month, the Bering Sea and Northeastern Siberian region adjacent which saw 2-8 C above average temperatures, and the Canadian Archipelago which saw 2-4 C above average temperatures for the month.

Odd Warm-Air Slot Runs from Equator to West Antarctic Peninsula

Notable is that visible warm-air slots running from Tropics to Pole appear to remain intact in the Northeastern Pacific and over Central Asia in the Northern Hemisphere during early Summer. Meanwhile, an odd Southern Hemisphere warm-air slot appears to have developed during June in the region of the Southeastern Pacific.

June of 2016 Anomaly Map

(June of 2016 was the hottest June on record. This is what the anomaly map looked like. Image source: NASA GISS.)

This particular Equator-to-Pole heat transfer appears to have run as far south as the West Antarctic Peninsula and assisted in producing a 4-8 C above-average temperature spike there.

As the majority of the world remained hotter than normal during June of 2016, the only noted outlier cool region was Central and Eastern Antarctica which, in spots, saw 4 to 7.1 C below-average temperatures.

2016 is Blowing All Previous Years Away

Overall, as El Nino continues to shift toward neutral or La Nina states, global temperatures should remain lower than during peak periods seen earlier this year. It’s likely that over the coming six months, the very long period of new monthly global record temperatures we’ve seen will eventually be broken by a top-five- or top-10-hottest month.

Blowing heat records away Climate Central

(2016 is on track to blow all previous record hot years out of the water. See related article here.)

However, it appears that global heat has in total taken a big step up. As such, 2016 appears to be set to average near 1.14 to 1.25 C above 1880s levels. That would beat out previous hottest year 2015 by a big margin. To this point, Deke Arndt, head of NOAA’s National Centers for Environmental Information, recently noted in The Scientific American:

“It’s important to keep perspective here. Even if we aren’t setting [monthly] records, we are in a neighborhood beyond anything we had seen before early 2015. We’ve left the 20th century far behind. This is a big deal.”

In other words, that’s about a decade’s worth of typical human-forced warming in just one year. If it shapes up that way, it basically blows all previous years out of the water. Pretty nasty to say the least.

Links/Attribution/Statements

NASA GISS

Berkeley Earth

NOAA

NOAA Also Found June 2016 to be the Hottest on Record

Japan’s Meteorological Agency Also Found June 2016 to be the Hottest on Record

First Half of 2016 Blows Away Global Temperature Records

Hat tip to Zack Labe

Hat tip to DT Lange


Greenland’s Contribution to Sea Level Rise Doubled During 2011-2014 — Larger Melt Pulses on the Horizon

According to a new report, the Greenland Ice Sheet lost one trillion tons of water due to melt during the four-year period from 2011 through 2014. That’s about double the typical rate of loss during the 1990s through mid-2000s. Subsequently, Greenland’s contribution to sea-level rise also doubled. As a result, Greenland alone contributed 0.75 mm of sea-level rise every year during the 2011 to 2014 period.

(The above video briefly explains the findings of a new scientific study indicating a doubling in the rate of Greenland melt during 2011 through 2014.)

Bear in mind, the study focuses on Greenland only. Those numbers don’t include thermal expansion from the world’s warming oceans. Nor do they include an increasing amount of melt from Antarctica. Nor do they include large volumes of melt coming from the world’s rapidly disappearing mountain glaciers. Together, all of these in total are pushing sea levels higher by around 4 mm per year during the 2011 through 2016 period. That’s about 1 mm more per year than the 1993 to 2009 period. But the greater additional contribution appears to be coming from melting glaciers in Greenland and Antarctica.

The new Greenland Study found that melt averaged around 250 billion tons per year over the four-year period. This included a single melt year, 2012, in which Greenland contributed about half a trillion tons of melt water. The massive 2012 melt was spurred by high Greenland surface temperatures during summer which resulted in spiking surface melt rates during June, July, and August. At the time, a powerful high pressure system focused heat across the ice sheet which caused most of the surface area of Greenland’s glaciers to experience melt.

According to the study:

During 2011–2014, Greenland mass loss averaged 269 ± 51 Gt/yr. Atmospherically driven losses were widespread, with surface melt variability driving large fluctuations in the annual mass deficit. Terminus regions of five dynamically thinning glaciers, which constitute less than 1% of Greenland’s area, contributed more than 12% of the net ice loss. This high-resolution record demonstrates that mass deficits extending over small spatial and temporal scales have made a relatively large contribution to recent ice sheet imbalance.

In other words, melt at the margins of the ice sheet and large surface melt pulses during brief periods were the primary contributors to increasing melt rated during the study period.

Annual Mass Loss from Greenland and Antarctica

(Annual mass losses from Greenland and Antarctica are accelerating. This results in increasing rates of global sea level rise. While mass loss in Antarctica has recently primarily been driven by basal melt, surface melt has been the chief contributor to Greenland mass loss. In addition, the highly variable nature of surface mass loss along with its tendency to create brief, intense melt pulses is some cause for concern. Image source: Charting Ice Sheet Contributions to Global Sea Level Rise.)

The study found that surface melt rates were highly variable and dependent upon weather — with a strongly negative North Atlantic Oscillation contributing to conditions that enhanced melt during 2012. In this case, it appears that natural variability is beginning to be pushed by human-forced warming into a phase where certain years will preferentially further enhance Greenland melt. To this point, the tendency for large surface melt spikes was found to have increased during recent years. In contrast to Antarctica, where warming oceans contact glacial cliff faces and ice shelf undersides to accelerate melt, in Greenland, surface melt appears to currently be playing a bigger role in driving melt acceleration.

Surface melt can produce odd and unstable patterns of melt ponding and runoff over large ice sheets like Greenland. And as Greenland continues to warm due to human-forced climate change, an increasing risk of glacial outburst floods can be the result. The highly variable nature of surface melt is also a concern. In other words, overall warming can produce extreme, if brief, periods of warmth over Greenland that produce disproportionately large melt spikes. In this case, 2012 should not be seen as an outlier, but as the first of many future strong surface melt years — ones that will almost certainly surpass that year in melt intensity unless human-forced warming is somehow brought to a halt.

Links/Attribution/Statements

A High Resolution Record of Greenland Mass Balance

Excellent Comment on the Paper By Slate writer Phil Plait

Charting Ice Sheet Contributions to Global Sea Level Rise

Glacial Outburst Flood

Hat tip to Colorado Bob

Scores of City-Sized Siberian Wildfires Spew 2,500 Mile-Long Plume of Smoke Over Northern Hemisphere

Today’s satellite pass by NASA’s LANCE MODIS array tells a dire story that practically no one in the global mainstream media is talking about. Northern and Central Siberia is burning. Scores of massive fires, some the size of cities and small states, are throwing off a great pall of smoke 2,500 miles long.

The vast boreal forests are lighting off like climate-change-enhanced natural fireworks. The tundra and permafrost lands — some of them frozen for hundreds of thousands to millions of years — are thawing and igniting. But for all of the loudly roaring fires, most of the major media reporting agencies have thus far produced only deafening silence.

Country-Sized Swath of Siberia is Covered With Wildfires

Massive Siberian Wildfires

(Large sections of Russia and Eastern Europe are blanketed by smoke from massive Siberian wildfires in today’s LANCE MODIS satellite shot.)

Imagine an enormous rectangle. At its northwestern end is the Yamal Peninsula and the shores of the Arctic Ocean. At its southeastern end is Lake Baikal, nearly 2,000 miles away. The vast expanse between is littered with fires. Some of these fires are relatively small. But others are vast, sporting firefronts 20-25 miles wide and revealing individual burn scars that, according to unconfirmed satellite analysis, appear to cover as much as 400 square miles of land.

And it’s not just a case of a smattering of these fires burning across the broad region. Rather, these massive fires are burning in multiple clusters, some of which would easily cover a region the size of the US state of South Carolina. The below image is a 300-by-220-mile box showing a section of North Central Arctic Siberia between north latitudes 58.5 and 66.2. Note that a significant portion of the land area in this satellite capture is covered by very large fires.

South Carolina Sized Siberian Region covered in smoke and flame

(Extensive swath of fires burn over North Central Siberia. Image shows a 300-by-220-mile area. Image source: LANCE MODIS.)

These very large fires are vigorously burning in a contiguous permafrost zone of Siberia. During recent years, as human fossil-fuel burning has continued to warm the Earth, such fires have become more and more common. Burning not only forest, the fires have also consumed duff, peat, and, increasingly, recently thawed sections of the permafrost. Though these fires are now in the process of activating a very large northern carbon store, and though such an event represents a dangerous amplifying feedback to human-forced warming, their occurrence and extent has been greatly underreported by the Russian government.

Fires Burning Near Yamal, Frozen Methane Deposits, Fossil Fuel Production Infrastructure

Further north, even the typically hard-frozen tundra regions are burning. Near the town of Nuya, along Obskaya Bay just east of Yamal, Russia and located in the fossil fuel development zone between north latitudes 66 and 67.3, enormous fires are raging. Like the recent Fort McMurray fire, these blazes appear to be burning near fossil fuel infrastructure and development zones.

Fires near Nuya Russia

(Large fires on the shores of Obskaya Bay in Northwestern Russia on July 18, 2016. Image source: LANCE MODIS.)

The Yamal region was also the location of the recent, and controversial, methane blowholes. The region sits over large gas deposits, some of which are in the form of clathrate. And some of the previously stable frozen deposits appear to be facing an increasing release pressure due to thawing, the invasion of warm liquid water into the subterranean environment, and, at the near-surface region, lightning strikes (which were previously unheard of in this zone) and wildfire pressure.

Up to 40-F-Above-Average Temperatures Blanket the Northern Fire Zone

Today, a good number of these fires burn north of the farthest northern extent of the Siberian tree line in 77 to 86 degrees F (25 to 30 C) temperatures. For some regions, these temperatures are 30 to 40 degrees F (17 to 22 C) above average. At the northwestern end of the vast, fire-marred range that now covers a land area larger than most countries, temperatures near the Arctic Ocean shore at 70.9° N, 81.4° E are 86 degrees F (30 C) — about 40 degrees F (22 C) above average. Not far away, the wildfires in the above image burn.

86 Degrees Near Arctic Ocean

(Extreme heat in the range of 30 to 40 degrees F above average temperatures [17 to 22 C] near Arctic Ocean shores greatly increases Arctic wildfire risk. Such extreme heat is related to human-forced climate change. As the Arctic warms at a rate two to three times faster than the rest of the globe, such fire-hazard and related potential for worsening amplifying feedbacks is also likely to increase. Image source: Earth Nullschool.)

Despite increasing prevalence and extent, Siberian wildfires have continued to be underreported during recent years, despite the fact that out of all major Arctic permafrost and boreal forest regions — Alaska, Canada, and Siberia — Siberia has shown the visibly greatest increase in wildfire frequency and extent. This is likely due, in part, to a now-documented underreporting of wildfire extent by the Russian government.

Links/Attribution/Statements

Earth Nullschool

LANCE MODIS

Yamal Map

Methane Blow Holes

Russia Significantly Under-Reporting Wildfires

Hat tip to Colorado Bob

Hat tip to DT Lange

Hat tip to Jim Benison

Clouds of Denial Clear as Rising Storm Tops, Middle Latitude Drying Found to Speed Global Warming

“The data shows major reorganization of the cloud system… I consider this as the most singular of all the things that we have found, because many of us had been thinking the cloud changes might help us out, by having a strong feedback which is going the other way instead of amplifying it.”climate scientist Veerabhadran Ramanathan

“Our results suggest that radiative forcing by a combination of anthropogenic greenhouse gases and volcanic aerosol has produced observed cloud changes during the past several decades that exert positive feedbacks on the climate system. We expect that increasing greenhouse gases will cause these cloud trends to continue in the future, unless offset by unpredictable large volcanic eruptions.”Evidence for Climate Change in the Cloud Satellite Record (emphasis added).

Scientists now have a satellite record of cloud behavior over the past few decades. What they’ve found is that, in response to Earth warming, cloud tops are rising even as clouds are forming at higher altitudes. This traps even more heat at the Earth’s surface. In addition, storms are moving north toward the poles, which means more sunlight hits the temperate regions near 40 degrees latitude both in the Northern and Southern Hemispheres. This northward movement of storms also causes the Earth to warm more rapidly. In the past, scientists had hoped that changes in clouds would shelter the Earth from some of the greenhouse gas warming caused by fossil fuel emissions. What we are finding now is that the opposite is true. The way clouds change as the Earth warms appears to be increasing the intensity of greenhouse gas warming.

Sowing the Clouds With Doubt, Denial and False Hope

Will the impacts of human-caused climate change be as bad or even worse than we feared? Will the Earth warm as rapidly or more rapidly than climate models suggest?

These are critical questions. Ones that revolve around the issue of how sensitive the Earth is to the added heat build-up initiated by a large and growing pulse of human-emitted greenhouse gasses. One whose answer will have lasting consequences for all those currently alive today and for many of the generations to follow. For if the answer to this question is yes, then we have responded too slowly to what is now a swiftly worsening global climate crisis (and, according to a new observational study, that answer appears to be, with growing certainty, YES).

Storm Track Heading North

(A new study has found that human forced warming drives the storm track toward the poles. This increases drought risk for places like the US Southwest. It is also a part of a larger cloud feedback that is found to have caused the Earth to warm more rapidly. Image source: LANCE MODIS.)

In relation to these questions is a noted relevant scientific uncertainty over the behavior of clouds in response to warming. Mainstream science has long produced state of the art climate models showing that changes in clouds due to Earth’s warming was likely a heat-enhancing (positive) feedback overall. And paleoclimate studies have tended to support the kinds of Earth System sensitivity to heat forcing that would result. But due to the fact that cloud behavior is difficult to model (and confirm through observation), there was a decent level of uncertainty in the science over the issue. And it is this seeming gap in our physical understanding that has spurred a big controversy circulating among climate change skeptics/deniers and the mainstream scientific community.

On the deniers side are people like Judith Curry, Roy Spencer, Richard Lindzen, and Anthony Watts (and their fossil fuel backers) who have broadly asserted that clouds respond to warming in a way that alleviates some of the added heat. The group also claimed that the cooling impact of clouds (negative feedback) was strong enough to reduce the Earth’s overall sensitivity to human greenhouse gas forcing to significantly less than the widely accepted 3 C Equilibrium Climate Sensitivity range (ECS — or about a 3 C warming over an approximate 100 year period for each doubling of CO2, or approximately double that warming over the long term). On the other side are the mainstream scientific heavy weights — including notables like NASA GISS’s Gavin Schmidt and Michael Mann of Hockey Stick notoriety — along with a large and growing body of studies producing evidence to support the cloud model essays.

The upshot has produced what could best be called a debate enabled to sow doubt (climate skeptics/deniers tend to receive funding from fossil fuel think tanks and other political bodies, which is a marked and glaring conflict of interest) between actual science and what might well be characterized as an intentionally misleading industry PR campaign.

Climate change gallup serious threat

(Climate change is a very serious threat. It threatens the existence of coastal communities like Miami, Norfolk, and New York City, it’s putting the US Southwest into an increasingly dangerous drought and water shortage situation, it’s driving vector driven illnesses like Zika out of their tropical zones, it’s threatening the stability of global food supplies, it’s forcing mass migration on a scale worse than warfare and conflict, and it’s pumping up the intensity of the most extreme weather events. Despite glaringly obvious trends revealing worsening climate states, just 41 percent of the American public views climate change as a serious threat. This is in large part due to confusion sown by climate change skeptics and deniers. Image source: Gallup.)

Wrapped up by this doubt-sowing were a number of scientists who simply seemed to hope that something (even changes in clouds) would give humankind enough time to make the tough policy choices needed to respond to human-forced warming. This group included a number of well-intending individual scientists who simply appeared unwilling to unequivocally accept the stark implications coming from the model assessments and from the paleoclimate proxy data.

Unfortunately, uncertain understanding of how clouds respond to warming has served either as false comfort or fed into yet one more climate change skeptic/denier based doubt-sowing delaying tactic for much-needed global policy action on climate change.

High Clouds, Middle Latitude Drying Enhance Human-Forced Warming

Now, a new observational study headed by Joel Norris has helped to clear up some of this uncertainty. The study used satellite based observation of cloud behavior over the past 25 years to confirm that alterations in Earth’s cloud  cover is producing an amplifying feedback to human caused climate change. In other words, the heat provided by human fossil fuel emissions is forcing the clouds to respond in ways that warm the Earth even faster.

At issue are two big mechanisms. The first is that warming up the Earth’s atmosphere is observed to be forcing the storm tracks toward the poles. This pole-ward movement is resulting in less overall cloud cover for the middle latitudes. Less cloud cover in this region reduces the coverage of bright, reflective clouds which, in turn, generates a loss of Earth reflectivity (albedo). As a result, more of the sun’s rays enter the Earth’s lower atmosphere in this zone which causes the atmosphere to heat up.

The second big cloud feedback mechanism was an observed increase in upper level cloud formation. This is important because high level clouds act as a blanket, trapping more of the Sun’s heat in the atmosphere. What the study found was that cloud tops were both rising even as the number of clouds at higher altitudes was increasing.

All Cloud Trend

(Higher cloud tops and less cloud cover in the middle latitudes means that the Earth warms faster due to human greenhouse gas emissions. In addition, a poleward movement of the storm track facilitates drying across many continental regions including Brazil, the US Southwest, Europe, and parts of Africa, Asia, and Australia. Image source: Evidence for Climate Change in the Cloud Satellite Record.)

This combination resulted in an observed increase in radiative forcing on the order of 0.39 Watts per meter squared. That’s about a 12 percent increase above and beyond the base additional greenhouse gas forcing currently provided by human beings. In other words, the way clouds respond to human greenhouse gas emissions caused the world to warm up even faster.

In addition to these changes that add heat to the Earth System, there is one noted significant knock-on effect. Loss of clouds in the middle latitudes results in less rainfall for places like the Amazon Rainforest, the US Southwest, and large parts of Europe, Africa, Asia, and Australia. In this way, shifting storm tracks are an enabler not only to amplified global warming, but also to the increasingly prevalent and severe droughts and wildfires that we are now seeing in many of the most highly populated parts of the world.

The new study appears to be robust and has received support from a number of scientists including Dr. Michael Mann, and Veerabhadran Ramanathan. And in response to those sitting on cloud fences, Ramanthan notes in the Washington Post:

“I consider this as the most singular of all the things that we have found, because many of us had been thinking the cloud changes might help us out, by having a strong feedback which is going the other way instead of amplifying it… The uncertainty is narrowing down. I used to say, if I made a 50 percent overestimation of the global warming, it was due to the clouds. But we are running out of that excuse now.”

(UPDATED July 16, 2016)

Links/Attribution/Statements

Evidence for Climate Change in the Cloud Satellite Record

Clouds Study Alarms Scientists

LANCE MODIS

Gavin Schmidt

Michael Mann

Gallup

Hat tip to Wili

Hat tip to Greg

Hat tip to Miep

Another Global Warming Enhanced Heatwave is on the Way — 111 Degree (F) Temperatures Predicted For Central US

It was in the 80s along Alaska’s Arctic Ocean shores yesterday. Record hot temperatures for a far northern region facilitated by factors related to human caused climate change such as warming ocean surfaces, sea ice melt, and an increasingly wavy Jet Stream.

North Slope Temperatures

(Record hot temperatures in the lower to middle 80s F [26 to 28 C] spread into the North Slope region of Alaska along the shores of the Arctic Ocean yesterday. And according to Dr. Jeff Masters, the 66 F [19 C] reading at Barrow tied its all time record high. Image source: Brett Brettschneider.)

But extreme heat along the northern reaches of Alaska appears now to be ready to morph into another record heatwave for the lower 48. For the past two weeks, weather models have been consistently predicting severe heat for the Central US. And with each passing day, as the forecasts grow evermore certain, the development of yet one more period of record hot temperatures becomes more and more likely.

An extremely tall dome of hot and heavy air is expected to build up over Colorado, Oklahoma and Nebraska. Heat beneath the dome and near the surface is expected to intensify. By the middle of next week, temperatures over a continuous large swath from Northern Texas to Montana and the Dakotas is predicted to experience near or above 100 degree F (38 C) temperatures. By late week, some of these readings could peak at around 111 degrees Fahrenheit (44 C) for parts of Central Nebraska.

111 degree temperatures Central US

(Saturday, July 24 GFS model forecast shows severe heat settling over the Central US. It’s the kind of heatwave that is now more and more likely to occur due to human-forced climate change. Image source: Pivotal Weather.)

These temperatures are expected to range 18-25 F (10-14 C) or more above typical July averages. And if temperatures do hit so high, they will likely make a number of new record highs for this region of the US.

By Sunday, the heat is expected to sprawl both east and west. And high temperatures near or above the Century mark could ultimately stretch in a great triangle from Alabama west to the Central Valley of California and north to Montana’s Canadian Border.

Conditions in Context — Human-Caused Global Warming, Hot Ocean Surfaces

This extreme heat comes in the context of record hot global temperatures. During 2016, global surface temperatures are likely to range near 1.2 degrees Celsius above the late 19th Century average. These record temperatures have been spurred by greenhouse gasses spiking to levels not seen in millions of years. CO2 concentrations this year hit near 408 parts per million at the Mauna Loa Observatory — a level high enough to significantly further increase global temperatures, melt large glaciers, substantially raise sea levels, and prevent another ice age for thousands or tens of thousands of years. And continued burning of fossil fuels by human beings will likely push that number near or above 410 parts per million by May of 2017.

image

(A North America surrounded by sea surface temperatures in the range of 1-5 C above average is one that is more susceptible to extreme heat, heavy downpours, and drought. Image source: Earth Nullschool.)

Closer to home, very warm sea surface temperatures surrounding the US are likely also aiding in the formation of the predicted heatwave. Hotter oceans surrounding continents can increase the prevalence of heat waves and droughts. And, in this case, 1-5 C above average sea surface temperatures encompass most of North America. In fact, the extent and extreme range of sea surface temperatures — which in the past have rarely exceeded 2 C above average — is notably pretty extraordinary.

These conditions, overall, are less and less impacted by El Nino which has now mostly faded in the Eastern Pacific. As ENSO neutral status now prevails, most temperature extremes are far more related to human-forced warming than El Nino. And, in any case, there’s practically zero chance than any given El Nino year would have resulted in global average temperatures hitting 1.2 C above 19th Century averages without the added heat forcing provided by human greenhouse gas emissions. So the truth of the matter is that the record heat we’re seeing is in greatest part the result of human-forced climate change.

Links:

Two Flavors of Record Heat: Dead Horse and Houston

Pivotal Weather

Earth Nullschool

NOAA El Nino

Brett Brettschneider

NASA GISS

Hat tip to Colorado Bob

Hat tip to DT Lange

Hat tip to Cate

Hat tip to Greg


Climate Change is Pushing Lake Okeechobee’s Water Levels Higher — And that’s Bad News For Algae Blooms, Flood Risk

More powerful storms. Heavier extreme rainfall events. Storms with higher potential energy. These are the result of a human-forced warming of the Earth’s atmosphere. And South Florida finds itself sandwiched between heavier evaporation flows streaming off the Gulf of Mexico, a more volatilely stormy North Atlantic, and large rivers of moisture streaming in from the Southeast Pacific.

image

(Atmospheric water vapor levels over South Florida during late June of 2016. South Florida sits between numerous heavily laden atmospheric moisture flows. As human forced warming increases evaporation, these moisture flows expand, resulting in heavier rainfall potentials during storms over South Florida. This climate change dynamic is increasing over-topping flood risks for Lake Okeechobee even as the added heat and rainfall run-off enhances the potential for toxic algae blooms like the one now afflicting South Florida. Image source: Earth Nullschool).

And as these moisture-enhanced storms of climate change dump heavier and heavier rains over South Florida’s Lake Okeechobee, the choice appears to be one between flood risk or toxic algae blooms.

*****

Flood Risk Worsens With Climate Change

Lake Okeechobee sits at the heart of South Florida. Covering 730 square miles, the lake is bounded on the north, east, and west by farms. Run-off from these farms streams into the lake, feeding the growth of algae blooms. As the Earth’s atmosphere and ocean warmed due to human greenhouse gas emissions, rainfall events over South Florida have grown more intense. This trend increases run-off from pesticide, phosphorous, and nitrogen rich soils which then swell the lake with these chemicals and compounds — many of which promote the growth of cyanobacteria (or blue-green algae).

The increasingly heavy rains also force lake levels higher. During Winter of 2016, the wettest January in South Florida’s climate record pushed Lake Okeechobee’s water levels to 16.4 feet above sea level by February. November through May is South Florida’s dry season. So abnormally wet conditions during a typically dry period greatly increased flood risk for communities surrounding the lake as South Florida entered its June through October wet season.

Heavy rains have continued through recent months and, in order to mitigate the heightened flood risk, the US Army Corp of Engineers has been pumping large volumes of the run-off enhanced, nutrient-rich waters out of the lake in order to relieve pressure on the Hoover Dike. The Dike, for its part, is a 132 mile system of levees surrounding the lake and preventing its waters from flooding local communities during heavy rainfall events.

Lake Okeechobee Algae laden waters South Florida late June

(Lake Okeechobee [upper right of frame] and the algae-laden coastal waters of South Florida as seen in this June 26 LANCE MODIS satellite shot.)

Paul Gray, a scientist with Audubon Florida and Lake Okeechobee expert recently noted:

“One big storm would be a bad situation, really bad. We are nearing the heart of the tropical season and the corps knows they are one storm away from levels they are not comfortable with.”

To reduce pressure on the Dike, the Corps likes to keep Lake Okeechobee in a range of 12.5 to 15.5 feet above sea level. This creates a buffer zone to allow for the impacts of unexpectedly strong storms — like tropical cyclones — which can alone produce enough rainfall to push lake water levels between 1-4 feet higher.

At around 18.5 to 19.5 feet above sea level, the Hoover Dike system is under high risk of a breach or of over-topping. An event which would flood thousands of homes and businesses with 1-5 feet of water and generate a serious risk of loss of life.

So this year, with the dry season acting like the rainy season and with the rainy season now underway, the US Army Corps of Engineers has been releasing much larger volumes from the Lake in what some could call a frantic effort to keep water levels there in the safe range. These efforts, as of Thursday, July 7 produced a Lake Okeechobee water level of 14.93 feet — which was at the top edge of the safe zone. But the effort came at the cost of flushing nutrient rich waters into South Florida’s rivers and estuaries.

Mitigate Flood Risk and Toxic Algae Blooms Result

During recent years, heavy use of fertilizers has loaded up farmland soils surrounding Lake Okeechobee with phosphorous and nitrogen. As human-forced climate change has produced more extreme rainfall events over lands surrounding the lake, greater runoff of these nutrient-rich soils and chemicals into the lake has resulted.

Phosphorous levels, which government regulators like to keep in the range of 40 parts per billion in lake waters, has risen to 100 to 200 parts per billion. That’s 2.5 to 5 times the safe allowable level. And as the Army Corps of Engineers ramped up lake water outflows into the St. Lucie and Caloosahatchee rivers during recent months, this influx of high nutrient lake waters helped to spur the large algae blooms now afflicting the region.

John Campbell, a spokesperson for the US Army Corps of Engineers recently noted that people often ask:

“‘Why didn’t you release more water?’ Well, this is what releasing more water looks like.”

Due to the increased water outflows from Lake Okeechobee, high nutrient levels hit river systems warmed to bacterial growth enhancing temperatures by climate change. Cyanobacteria (blue-green algae) populations in these river and estuary systems then exploded. Goo painted waterways green, putrescent mats of algae formed in calmer waters, and airs smelling of rotten eggs wafted up from the suffocating rivers. These explosive and toxic bacterial growths prompted a declaration of a state of emergency by Governor Rick Scott as four South Florida counties were heavily impacted by the algae blooms.

Algae bloom Florida

(Toxic algae blooms like this one have resulted in beach closures across South Florida. Human-caused climate change spurs an increasing incidence of such toxic algae blooms by increasing water temperatures, which enhances algae growth, and by spurring more extreme heavy rainfall events — which generates increased nutrient influx into rivers, lakes, and oceans. Image source: Surfrider.)

Directly, cyanobacteria can produce a number of toxins capable of harming animal and human organ systems. Most common toxins are neurotoxins and toxins that impact the gastrointestinal track — particularly the liver. In addition, large blooms can deprive waterways of life-giving oxygen. Such anoxic conditions spur fish kills and mass production of hydrogen-sulfide generating organisms — a powerful toxin which generates the sulfuric rotten eggs smell that many South Florida locations are now reporting.

Indirectly, the blooms are unpleasant, unsightly and result in beach closures. And since the blooms became widespread, South Florida has experienced losses to its tourist industry (see toxic algae chokes business) — one of the biggest revenue producers for the State. Yet one more example of how human-forced warming not only harms the health of the natural world, but also harms human systems that rely on such natural wealth and beauty to function.

(Large algae blooms spurred by rising water outflows from an increasingly flood-stressed Lake Okeechobee resulted in tourism industry losses during the Fourth of July weekend of 2016. However, residents are rightfully concerned over long-term health risks due to the algae blooms. Note that purple water in gaps between the algae as well as reports of ‘rotten eggs’ smell is circumstantial evidence of increasing concentrations of hydrogen sulfide producing bacteria that tends to thrive in the anoxic dead zones produced by the algae. Video Source: CBS Youtube.)

Conditions in Context

The US Army Corps of Engineers is now reducing Lake Okeechobee water outflows in an effort to limit harmful algae blooms over South Florida waterways and estuaries. Outflow levels, as of June 30 were cut by 35 percent. As a result, some of the nutrients feeding algae blooms will be removed from waterways. But it’s questionable if the large algae blooms can be entirely halted by this mitigation.

Warmer than normal temperatures and heavier than normal rains are expected over this region during the coming weeks and months and these conditions will add to bloom promotion even without a larger pulse of water coming from Lake Okeechobee. In addition, reducing water flows from the lake will again push the lake to rise. And that puts South Florida one large storm away from risking an over-topping of the Hoover Levee System.

Climate change, in this context, has therefore put South Florida in a tough bind between worsening algae blooms over its waterways or worsening flood threats from a swelling Lake Okeechobee. A more immediate problem juxtaposed to the longer term risk of sea level rise — a human-forced ocean invasion which could flood the whole of South Florida by or before the end of this Century.

Links:

Why Drain Lake O? One Storm Could Push it Over its Limits.

What is Causing the Toxic Algae Blooms in Florida’s Waterways?

Army Corps to Reduce Lake Outflows Fueling Toxic Algae Blooms

Toxic Algae Chokes Florida Tourist Industry

Earth Nullschool

LANCE MODIS

CBS Youtube

Surfrider

Hat tip to Colorado Bob

Hat tip to DT Lange

Coastal Cities, Critical Infrastructure Unprepared to Face the Rising Tides of Climate Change

Civitasthe latin word for city and the root word for civilization. Civilization, in other words, is a collection of component cities. And, by extension, any major threat to a large number of cities is a threat to civilization itself. Such is the case with human-forced climate change.

*****

It’s a sad fact that many of the hundreds of coastal cities around the world are living on borrowed time. Current greenhouse gas levels — topping out near 408 parts per million CO2 (and 490 parts per million CO2e) this year — will need to fall in order to prevent 1-3 C of additional warming and 25 to 60 feet or more of sea level rise over the coming decades and centuries. And even if we somehow dialed atmospheric CO2 and CO2e levels back to 350 ppm, it’s likely that we’d still see seas eventually rise by 10-20 feet over the long term due to already destabilized glaciers in places like Greenland or West Antarctica.

But with fossil fuel burning continuing at near record levels globally, and with many corporations and political bodies around the world dragging feet on greenhouse gas emissions cuts, the level of heat-trapping carbon held aloft in our airs will continue to rise for some time. These vastly irresponsible actions will further heat the atmosphere and ocean — melting a greater share of the world’s land ice and forcing seas to ultimately rise even more. If CO2e exceeds a range of 550 to 650 parts per million — which could easily happen even under so-called moderate rates of fossil fuel burning before the middle of the 21st Century — then all the land ice on Earth will be placed under melt pressure. And that vast sum of ice melt represents about 220 feet of sea level rise long term so long as the greenhouse gas melt and heat pressure remains.

Sea level rise AVISO July 2016

(Seas have been rising in concert with ocean warming and fossil fuel burning since the start of the 20th Century. At first, during the first half of the 20th Century, rates of rise were less than 1 mm per year. By the 1993 through 2016 period, sea level rise averaged 3.39 mm per year. And since 2011, the rate of rise appears to have steepened into the range of 4 to 6 milimeters per year. Image source: AVISO.)

Even more disturbing is the fact that in the geological past, glacial melt has not tended to process in a gradual, orderly fashion. Instead, initial gradual melt has, in deep history, often been punctuated by very large melt pulses as glacial systems rapidly succumbed to warming environments. And with human warming now proceeding at a pace about 20 times faster than the end of the last ice age, the risk for rapid melt has been greatly enhanced.

Despite continued snide claims by climate change deniers to the contrary — it really is a global emergency. One that includes difficult impacts now and a rising risk of far worse impacts to come. A very real kind of long emergency for human civilization and the natural world combined. One made no less worse by its current deceptively slow, if massive and inexorable, advance.

Hundreds of Cities Under Threat

Due to this threat posed by human-forced warming of the global climate system, cities that have lasted for hundreds or thousands of years now face a serious risk that they will ultimately be devoured by rising tides. Around the world, nearly half of the world’s approximate 4,000 cities with populations of greater than 100,000 people sit on or near the coastline, at elevations below 220 feet, or near bodies of water that are vulnerable to sea level rise. Under the continued pressure of human-forced warming on global ocean levels, a good number (5-10 percent) of these cities may begin to succumb to rising tides in as little as a 10-30 years. And, long term, over 30-300 year time frames, pretty much all are threatened if the world continues burning fossil fuels.

Greenland Glacial Melt

(Glacial melt, like from this pond-riddled and melt-darkened section of Greenland as seen on July 8 of 2016, threatens many coastal cities this Century. With human warming of the Earth atmosphere approaching 2 C, the threat of large glacial outburst flood events that rapidly push sea levels higher is rising. But even gradual sea level rise is already disrupting cities and the infrastructure that supports them. Image source: LANCE MODIS.)

New Orleans, London, Sydney, Shanghai, Los Angeles, New York, Alexandria, Amsterdam, Miami, Norfolk, Washington DC, and Toyko are just a handful of the major cities that are mostly low-lying or that contain large low-lying sections. And all are below the 220 foot sea level rise line that current levels of fossil fuel burning will begin to put into long-term play before mid-Century.

Infrastructure is the First Vulnerability

While complete inundation by rising tides is the ultimate issue, cities do not have to face such drowning to fall under threat. Water supplies, transportation nodes and arteries, food supplies, and energy production and distribution facilities all represent lynch-pins that, if disrupted, can take down a city’s ability to effectively function. And sea level rise often threatens many or all of these critical supports well before the problem of total inundation becomes an issue.

Miami, for example, now faces a combination of these threats due to the presently emerging early outlier effects of human-forced sea level rise. There, just one foot of rising tides since the early 1870s has now put 2.4 million of Miami’s residents and 1.3 million homes within 4 feet of the high tide mark. By 2015, that relatively minor sea level rise had increased tidal flooding by 50 percent. Roadways and neighborhoods were more frequently cut off by the rising waters — which prompted the election of Philip Levine as Mayor of Miami Beach and the implementation of his 400 million dollar project to elevate roads and add pumps.

The city’s water supply, provided by a fresh water aquifer running through porous limestone, is protected from ocean salt water intrusion by a fresh water barrier of canals. A mere six additional inches of sea level rise will render the current system both ineffective and vulnerable to over-topping due to heavy rainfall events.

Power Stations, Roads, and Airports

By 2030, Miami is expected to see between 6-10 more inches of sea level rise. By the end of this Century, it will probably see at least 6 feet — and that’s if we don’t pursue business as usual fossil fuel burning and if the world’s glaciers mostly behave themselves by not giving us a big, angry melt pulse in response to our insults. The result is that not only Miami, but the far-flung critical infrastructure that supports it is also under threat.

In this context, Miami’s airport is just 8 feet above the high tide line. The nearby Turkey Point Nuclear facility which provides energy to the city and a big chunk of South Florida is about 6 feet above the high tide line. And though its reactors are elevated by another 20 feet of concrete buttressing, this Century’s predicted sea level rise would flood its grounds and surrounding roadways — likely rendering it inoperable.

Nuclear Stations Sea Level Rise

(Long term inland extent of sea level rise under 2 C and 4 C warming scenarios for US East and Gulf Coasts puts 13 nuclear facilities in the firing line. And an unexpected melt pulse or powerful storms riding on the top of sea level rise present a risk of flooded reactors. Such an inland rush of waters would also drown scores of coastal US cities, cut off roadways, flood aquifers, inundate crops, submerge airports, and sink conventional power stations. Image source: Nuclear Regulatory Commission, National Geographic, Climate Central.)

In the US, nine nuclear power stations are located on the coast. Another 13 are vulnerable to sea level rise. These sites are located near the ocean or along ocean fed rivers. They are ultimately vulnerable to sea level rise spurred by 2 or 4 degrees Celsius worth of warming. Without a herculean effort to not only reduce greenhouse gasses, but to recapture them from the atmosphere, 2 C warming is already locked in (this Century or longer term). The 4 C number is possible by late this Century under business as usual fossil fuel burning and is possible long term (500 year time scales) under the continuous 490 ppm CO2e forcing now in place.

Many large coal and gas power plants which also require heavy flows of water to support their operations are located near the coast. Oil refineries, which rely on shipping are often very close to sea level. Many major roadways are vulnerable to cut-off from sea level rise. And an amazingly large number of key airports are below a 20 foot elevation.  A small sampling includes San Diego International Airport at 13ft in elevation, Santa Barbara — 10 feet, Vancouver –14 feet, Portland 20 feet, JFK — 13 feet, La Guardia — runway elevations between 7 and 21 feet, Reagan National — 13 feet.

New York Also Armoring Against Rising Tides

In the northeastern US, another city has recently had a harsh global warming wake-up call. About a foot of east coast sea level rise added to the approximate 13 foot storm surge of Hurricane Sandy to flood Staten Island and large sections of lower Manhattan. The local power station flooded — propelling the city into darkness even as the subway system drowned and one neighborhood filled with water and burned at the same time.

Post Sandy responses have resulted in a flurry of activity. Fully 60 billion dollars has been spent to rebuild and a good chunk of that has gone to making the city more protected against both storms and rising sea levels. High rises are now required to lift critical infrastructure such as water pumps and spare generators into the upper stories should lower levels flood. A big flood resiliency effort, starting with the 3 billion dollar construction of a 10 foot high, two mile long flood barrier in 2017, is underway. One that may buttress much of lower Manhattan behind a U shaped wall meant to deflect both rising tides and worsening storms.  And a new park now features hills up to 70 feet above sea level.

Post-Glacial_Sea_Level

(At the end of the last ice age, as global temperatures approached 2 degrees Celsius above previous averages, large melt pulses from Antarctica and Northern Hemisphere Ice Sheets forced seas to rise by as much as 10 feet per Century. Human-forced warming is currently about 20 times faster than warming at the end of the last ice age. Current rates of warming and greenhouse gas emissions threaten to generate a 2 C warming by or even before the middle of this Century. Large melt pulses forced by such conditions would put cities like New York under risk of rapid inundation. Image source: Post-Glacial Sea Level Rise.)

These efforts appear to be aimed at facing off against another 1 foot of sea level rise for Manhattan by 2030 and a North Atlantic Ocean that is increasingly riled by powerful storms due to warming related climate instabilities. New York is digging in for the fight of its life. And for good reason. 10 percent of US gross domestic product funnels through this city of 8.5 million and over 100 billion dollars worth of real estate now sits in a high risk flood zone.

But build and buttress as it might, New York is hopeless in the long term if we can’t somehow stop human carbon emissions soon. If we can’t somehow start to draw carbon out of the air. If we can’t do these things, then New York, Miami and thousands of other coastal cities will ultimately face 25 feet of sea level rise or much, much worse. And the far flung infrastructures that they rely on will all, increasingly, need more and more costly and involved protections before they too succumb to the rising tides.

Links/Attribution/Statements:

Rising Seas Threat to Miami

Miami Nuisance Flooding Up by 50 Percent

As Waters Rise, Miami Beach Builds Higher Streets

Miami Herald — Sea Level Rise

Nuclear Regulatory Commission

Sea Level Rise — Are Coastal Nuke Plants Ready?

Sea Level Rise Risk to Coastal Nuclear Plants

Can New York Be Saved in the Era of Global Warming?

Post-Glacial Sea Level Rise

New Park Built to Withstand Epic Storms

Global Cities Map

Ancient Civilization

Scientific hat tip to Dr. James Hansen

Scientific hat tip to Dr. Eric Rignot

Scientific hat tip to Dr. Jason Box

Hat tip to DT Lange

Hat tip to Scott

Hat tip to Genomik

Hat tip to Cate

City-Threatening Wildfires — The North’s New Climate Future

That great roaring sound you’re hearing may just be another 3.6 billion dollar climate disaster…

*****

Reports are in and it’s official — the Fort McMurray Fire was the costliest disaster ever to impact Canada. According to the Insurance Bureau of Canada (IBC), claims of damages for the massive Alberta wildfire have now topped 3.6 billion dollars. That’s worse than the Alberta floods of 2013 at 1.8 billion dollars (ranked third), and worse than the great Quebec ice storm of 1998 which inflicted 1.9 billion dollars (in 2014 dollars) in damages.

Pyrocumulous cloud

(Fires in northern regions and within the Arctic are now so energetic that they often produce pyrocumulus clouds — like this one which was thrown off by the Fort McMurray Fire.)

CEO Don Forgeron of IBC stated that the damage from the fires provide “alarming evidence” that extreme weather events have increased in frequency and severity in Canada. And that’s especially true for wildfires — which are being worsened by a climate change driven warming. The added heat is lengthening the fire season in Northern Latitudes even as it is generating temperatures that are inhospitable to trees that have adapted to live in much cooler climates. It’s also thawing the permafrost — which adds more peat-like fuels for fires to burn.

The Fort McMurray fire erupted under these new climate conditions and under temperatures that were 40 degrees (Fahrenheit) above average at the time of ignition. It forced the entire city of Fort McMurray to empty. It resulted in the evacuation of 90,000 people, the (darkly ironic) temporary shut down of various fossil fuel production facilities, and leveled 2,400 structures. Many more structures were damaged due to smoke or falling embers. In total, more than 27,000 property claims were filed.

Dozens of massive wildfires Siberia

(Dozens of massive wildfires burn through Central Siberia on July 7th of 2016 in this LANCE MODIS satellite shot. For reference, bottom edge of frame is 220 miles. These kinds of events, according to Greenpeace, burned 8.5 million acres last year in Russia. It’s a new climate context that is turning northern regions into a fire hot zone and it’s not at all normal.)

Unfortunately, this fire is unlikely to be a one-off event. Year after year, an Arctic warming at 2.5 to 3 times the rate of the rest of the globe pulls heat northward. Earlier thaws and added fuels combine explosively with swaths of dead trees killed by rampaging invasive species that have arrived from the south. No northern or Arctic nation has been untouched by the extreme fires. Alaska, Canada, and Siberian Russia have all seen extraordinary and massive fires during recent years. Fires that throw great pulses of heat and burning debris high into thunderheads of flame called pyrocumulus clouds. A word that climate change has now added to the popular lingo.

Links/Attribution/Statements:

LANCE MODIS

Last Damage Estimate For Fort McMurray Fire 3.6 Billion

The Climate Context For the Fort McMurray Fire

Hat tip to Colorado Bob

Global CO2 Spike Spurs Hottest June on Record, Extreme Weather For US

According to NOAA, the United States just experienced its hottest June ever recorded in the whole of the national climate record starting 122 years ago in 1895. That’s an average temperature of 71.8 F (22.1 C) across the contiguous United States — or 3.3 F (1.83 C) hotter than a typical June.

NOAA Record heat

(The United States just experienced its hottest June on record. The extreme heat comes alongside a period of record global warmth and helped to spur numerous extreme weather events across the country. Image source: NOAA.)

The new national June record broke the old record set back in 1933 and comes amidst a 13 month long streak of record hot months in the NOAA Climate measure. The record US heat also coincided with an extreme Southwestern heatwave, an apparently unquenchable California drought, record low Lake Mead water levels amidst a 16 year drought in the Colorado River basin, severe US wildfires, and the worst flooding in a hundred years to strike West Virginia.

Record heat — both at the national and at the global level — is a well-known driver of extreme weather events such as wildfires, droughts, and deluges. And NOAA shows that six of the past nine years have seen far above average damages due to severe weather — with 2016 tracking near the all time worst year (2011) for number of billion + dollar disaster events. Meanwhile, extreme weather attribution studies are increasingly providing a physical science basis for linking single and regional events with the larger global warming trend.

Heat Driven By Spiking Carbon Dioxide Levels

At the same time that national temperatures were hitting new record highs, average carbon dioxide levels measured by the Mauna Loa Observatory saw record rates of rise for the month. According to NOAA’s Earth Systems Research Laboratory, June of 2016 saw average carbon dioxide levels that were 4.01 parts per million higher than June of 2015. That’s a huge jump in the atmospheric concentration of a greenhouse gas that rose by about 1 part per million every year during the 1960s and during recent years has risen by an average of about 2 parts per million.

NASA CO2

(NASA graphic provides a stark paleoclimate contrast to the human carbon dioxide spike. The current rate of increase in atmospheric CO2 levels is faster than at any time in the last 60 million years and, possibly, faster than for any period in which life occupied planet Earth. Image source: NASA.)

Last year saw a record annual rate of atmospheric CO2 increase of around 3.05 parts per million. But the first six months of 2016 have so far greatly outstripped even 2015’s nasty rise — currently tracking 3.59 parts per million above the first six months of the previous year.

Record global greenhouse gas levels and a spike that is essentially vertical on geological timescales are, in greatest portion, driven by human fossil fuel emissions. These spiking levels of heat trapping gasses, in turn, drive extreme global temperatures and related severe weather events. But as the world’s land and ocean surfaces heat up, they tend to also draw in less of the human carbon emission even as they emit more. Expanding deserts, worsening wildfires, expanding ocean hot pools and thawing permafrost all add to this vicious cycle. And it’s possible that we’re starting to see rumor of these amplifying feedbacks starting to kick in now. Which makes the continued burning of fossil fuel that drives the whole vicious cycle an ever more dangerous prospect.

Links/Attribution/Statements:

NOAA

NASA

June Swoon — US Breaks Another Monthly Temperature Record

Bad Rains Fall Across the Globe

Water Knives in the Near Future

US Drought Monitor

Humans are Likely Culprits of Southern European Droughts

Scientific hat tip to Dr. Stefan Rahmstorf

Hat tip to DT Lange

Hat tip to Greg

Hat tip to Suzanne

Rapid Bombification — Super Typhoon Nepartak Barrels Toward Taiwan, Takes Aim at Already Flooded China

This year’s Asian monsoon has been a real beast for China. Inflated by the aftermath of a strong El Nino combining with record global temperatures, the system has sent powerful thunderstorms roaring over eastern sections of the Yangtze River Valley for the better part of two weeks.

These storms have spurred record tornadoes, rocked the Chinese landscape with lightning strikes, and dumped more than 16 inches of rain over a region near Wuhan and just west of Shanghai. The powerful downpours and related winds have now resulted in more than 54,000 building collapses and an estimated 7.7 billion dollars in damages. 32 million people have already been impacted. 1.4 million people have been displaced. And 231 people are now dead or missing (see China Flooding).

China 2 week Rain July 6

(Very intense rainfall over the past two weeks over the Yangtze River Valley region of China has resulted in severe flooding that has destroyed 54,000 buildings and displaced 1.4 million people. Image source: China’s Meteorological Agency.)

And all this before the predicted arrival of a Super Typhoon which is expected to dump as much as 24 inches of additional rain near the hardest hit regions between Shanghai and Wuhan this weekend after it roars over Taiwan on Thursday.

175 mph Super Typhoon Nepartak in the Pipe

As China was reeling from the impacts of heavy rainfall, sea surface temperatures over the Northwestern Pacific were screaming hot. Surface waters over a region south and east of Taiwan on July 4 and 5 approached 31 degrees Celsius (88 degrees Fahrenheit) or 1-2 C above average. In addition, these hot waters extended to great depth beneath southeastern Pacific surface boundaries. As a result, the amount of ocean heat content available to fuel an intensifying Typhoon was at about the top range one would ever tend to see (near 150 KJ per square centimeter, according to Dr. Jeff Masters at Weather Underground).

Running through these deep, hot waters on July 4 was a 70 mph max wind intensity tropical storm Nepartak. But as wind shear lessened and Nepartak drew in a deep draught of that high energy Pacific Ocean heat and moisture, the storm exploded. In just one 24 hour period, the system added fully 80 mph of maximum wind speed intensity to leap from a mere tropical storm to a very strong category 4 Typhoon by Tuesday night.

NOAA Typhoon Floater

(Nepartak barrels toward Taiwan and China on Wednesday in this NOAA enhanced satellite image.)

By Wednesday, the storm had achieved category 5 Super Typhoon intensity with top sustained winds estimated at 175 mph and a lowest central pressure of 900 mb (Japanese Meteorological Agency and Joint Typhoon Warning Center).

The Typhoon is now expected to make landfall in Taiwan on Thursday as a Category 4 storm. Heavy storm surges, very powerful winds, and 5-15 inches of predicted rainfall over most of Taiwan with up to 43 inches in the higher elevations is expected to generate flooding, landslides, structural damage, and to disrupt crops.

The storm is then predicted to leap the Taiwan Strait and track north and west over mainland China. As the storm weakens, it is expected to be drawn northward into a trough that will ultimately funnel its moisture over the already flooded region between Shanghai and Wuhan. In this zone, between 4 and 24 inches of additional rainfall is possible as the storm winds down and unburdens its massive water load.

Nepartak Rainfall Swath

(NCEP’s predicted rainfall swath for Nepartak results in additional extreme rainfall expected for already flooded regions near the Yangtze River. Image source: NCEP and Weather Underground.)

In total, weather associated with Nepartak is expected to produce a 5 day long extreme wind, storm surge and rainfall event for Taiwan and China. Heaviest impacts will likely occur in Central Taiwan near the predicted point of landfall and in the region west of Shanghai where Nepartak’s predicted rains could result in even more severe flooding for the already hard hit Yangtze River region.

Conditions in Context — Ocean Heat Intensifying, Expanding in All Dimensions

A weak La Nina is starting to form in the Eastern Equatorial Pacific. And, already, deep, hot water formation has re-intensified in the Western Pacific. Ocean surfaces and temperatures at depth there are now very hot (1-2 C above normal at the surface, with such unusually warm waters extending well below the water-air boundary). Such hot, deep waters promote the formation of very intense tropical cyclones. During 2013, similar sea surface and deep water ocean heat states aided in the formation of the monster 190 mph Super Typhoon Haiyan which then devastated the Philippines.

These very hot water conditions occur in the context of a record warm world. And, in fact, scientific observation has found that not only are peak surface temperatures continuing to rise for broad ocean regions as heat expands into the depths, but that the size of biggest body of hot water on Earth in the Indian and Pacific Ocean is also getting bigger. This new world of hotter ocean surfaces, more extensive hot waters, and deeper extending warm waters all provide more storm intensifying fuel for powerful typhoons and hurricanes.

Indo-Pacific Warm Pool is getting bigger

(The hottest pool of water on Earth lies in the Indian and Pacific Oceans. And, according to new scientific research, that hot pool is expanding in size due to human-forced climate change. Image source: Human-Caused Indo-Pacific Warm Pool Expansion.)

In addition, extreme rains over China have been fueled by a record atmospheric moisture loading. As global temperatures increase, the rate of evaporation also increases. This results in more water held aloft in the Earth atmosphere. Overall, atmospheric water vapor content increases by about 7 percent for each 1 degree Celsius of warming. And the result is an increased likelihood for extreme droughts in some regions (due to added heat and related increasing evaporation rates) and extreme rainfall in others (due to the extra atmospheric moisture producing more intense storms with heavier downpours).

So while the La Nina to El Nino cycle is helping to drive the location of extreme rainfall over China and the location of tropical cyclone formation in the Pacific, human-forced warming is providing more atmospheric fuel to increase the top potential strength of these events.

Links/Attribution/Statements

Category 5 Nepartak Headed For Taiwan

China Floods Leave More than 120 Dead, Scores Missing

The Joint Typhoon Warning Center

Japanese Meteorological Agency

China Flooding: Wuhan on Alert For Further Rain

NOAA ENSO Forecast

China’s Meteorological Agency

The National Hurricane Center

NCEP

Human-Caused Indo-Pacific Warm Pool Expansion

The Biggest Body of Hot Water on Earth is Getting Bigger

Lawrence Livermore National Laboratories

Scientific hat tip to Dr Jeff Masters

Hat tip to Greg

Hat tip to DT Lange

Hat tip to Colorado Bob

Hat tip to 65Karin

Fahrenheit 85.9 Near Arctic Ocean Shores — Extreme Heatwave Settles in Over North-Central Siberia, Canada’s Northern Tier

70.8 North, 69.2 East. It’s the Lat, Long coordinate location of a section of the Yamal Peninsula in Siberian Russia. A typically chilly region of frozen but now thawing ground more than 4 degrees of Latitude north of the Arctic Circle. A place that saw the appearance of odd, disturbing (and now controversial) methane blowholes pockmarking the melting permafrost during 2014. Today, the high temperature in a land now being forced to rapidly warm by human-caused climate change spiked to a tropical 80 degrees Fahrenheit (26.4 C) at 0800 UTC. Tomorrow, temperatures are expected to again rise to 80 F (26.5 C). And in the same location on Thursday, the mercury is forecast to strike close to 86 F (30 C).

Across the Arctic Ocean at Latitude 71.4 North and Longitude 111.7 West, Canada’s Victoria Island is today also seeing temperatures spike to near 80 F (26.8 C). It’s a place encircled by sounds of wet crackling and fluid sighs. The mournful songs of melting sea ice. A sad threnody for the end of a much more stable and hospitable climate age. And there, and even further north to Banks Island, readings are expected to range from 80 to 82 F (26.7 to 27.7 C) on Wednesday and into Thursday.

GFS Five Day Average

(Extreme heat wave predicted to build over the Arctic during the next five days as indicated by daily maximum temperatures forecast for the next five days shown above. Image source: Climate Reanalyzer.)

The heatwave in Northern Siberia comes on the back of new record high temperatures of 93 F (33.8 C) being reached in Buryatia on July 1 amidst record thunderstorm-induced downpours. The heat has since built northward along an extended ridge stretching over Central Asia and has now compromised a large section of the Arctic Circle zone.

On the Canadian side, the odd warmth comes in the form of a weird Northern heat island. The heat near the Canadian Archipelago is surrounded by cooler regions north, south, east and west. The result of a heat dome high pressure ridge building in over this far Northern region during the coming week.

Weather monitors like the Global Forecast System model show that both of these regions are in for some very severe Arctic heat over the next five days. High temperatures in the range of 80 to 86 F (26 to 30 C) are about 27 to 36 degrees Fahrenheit above average (15 to 20 C).  Temperatures that will basically match those in Central America (8.3 N, 77.9 W) during the same time period. In other words, for these days and these regions, Arctic temperatures will roughly match tropical Equatorial temperatures.

Conditions in Context — 408 ppm CO2, 490 ppm CO2e is Forcing the Arctic to Warm Faster Than Lower Latitudes

This most recent Arctic heatwave occurs in a climate context that, taking into account for 408 ppm CO2 alone will likely result in 1-2 C of additional global warming (on top of current approximate 1 C warming since 1880s) over the long term. Meanwhile, total CO2e (including methane and other greenhouse gasses) measures of about 490 ppm imply 1.5 to 3 C of additional warming long term (on top of 1 C current) even if the present total greenhouse gas forcing is only maintained (not added to by human beings or the Earth System).

These are global averages. But all that extra heat forcing is causing the world to warm unevenly. As of 2009, the Arctic was warming up at a pace more than two times faster than the rest of the globe. And in the 40 year period from 1971 through 2011 NASA found that the Arctic had warmed about 3.55 degrees Fahrenheit while the rest of the world had warmed by 1.44 F. But that was before the big global heat spike during 2015 and 2016 further disproportionately heated the Arctic — pushing it into new record hot temperature ranges. In the end, it appears that the Arctic will eventually warm by about 2.5 to 3 C for every 1 C of overall global temperature rise. And the extreme heat we are seeing now in the Arctic is just a larger part of the geologically rapid warming trend now being driven primarily by human fossil fuel emissions.

Arctic Warming Faster Than Rest of World 2

(NASA graphic shows Arctic warming at a faster rate than the rest of the world. The capture is for 2000 through 2009 vs the NASA 1951 through 1980 20th Century baseline. Read article here at NASA’s Earth Observatory.)

Impacts like loss of sea ice’s cooling albedo effect (reflectivity), loss of land albedo due to greening and loss of snow cover, and unlocking of local carbon stores due to rising heat, expanding fires, and changes in weather all contribute to this more rapid rate of Northern Hemisphere Polar warming. In addition, warming oceans, northward moving climate zones, and warm wind influx events generated by weaknesses in the Polar Jet Stream preferentially transport heat toward the Arctic (especially during Winter). These various forcings generate an overall greater degree of warming for the Arctic Ocean region during Winter all while Summer sees extraordinary heat racing to the Continental edges North of the Arctic Circle.

The only effective way to slake this warming is to both halt human greenhouse gas emissions — which are the major driver of the big heat build up the world is now experiencing — as rapidly as possible while pursuing ways to remove the excess carbon loading from the Earth Atmosphere. Without these necessary responses and mitigations, more warming will continue to be locked into the pipeline and the greater the eventual temperature departure from 1880s (Holocene) values will ultimately become — with the Arctic increasingly entering a hot zone.

Links/Statements/Attribution:

Earth Nullschool

Climate Reanalyzer

Methane Blowhole

NASA’s Earth Observatory

What’s Causing the Poles to Warm Faster Than the Rest of The Earth?

Paleoclimate Tells Us We Have 1-2 C Additional Warming in Pipeline From CO2 Forcing

Record Heat and Abnormal Flooding as Siberia Gets Freak Weather

Scientific hat tip to Dr. Jennifer Francis

Hat tip to Cate

Hat tip to Spike

Hat tip to Colorado Bob

(Note: This post is not intended to draw any specific conclusion on the scientifically controversial issue of potential Arctic carbon store releases. Time-frames and thresholds for such potential amplifying feedbacks in response to human-forced warming — be they small, moderate, large or catastrophic — are currently not very well understood in the science. Mainstream science asserts that such feedbacks will tend to be more moderate and happen over longer time scales given current understanding of carbon store resiliency. That said, the amount of heat build up due to human-forced warming in the Arctic is impressive and concerning. For these reasons carbon store sensitivity necessitates close monitoring and further research by responsible observers.)

A Season of Record Melt — Sea Ice Extent In Uncharted Territory For 94 Days

From March 25th through June 26th, sea ice extent measures, as provided by Japan’s Arctic data system were in record low ranges. In other words, for about a quarter of a year, and according to this monitor, the Arctic Ocean and its surrounding estuaries have witnessed the lowest ice coverage ever measured for any similar period since record keeping began in the 1979.

Sea Ice Extent JAXA

(An amazingly long period of record low sea ice extents in JAXA’s sea ice monitor.)

This new period of extreme sea ice record lows comes during a time of continuous decadal sea ice losses. Average sea ice coverage for each successive ten year period since the 1980s during the March through June period has fallen by about 400,000 to 500,000 square kilometers. For 2016, the new record lows widened this gap to more than 2 million square kilometers — or a surface area of sea ice coverage lost roughly equivalent the size of Greenland.

Over recent days, the JAXA measure has edged slightly over the record low 2010 line for the period, ending a season-long escapade into record low ranges.

Winter/Spring Heat The Driver of New Record Lows This Year

Overall, these losses were driven by an extraordinary warming of the Arctic that has extended and intensified over these time periods. A warming that has itself been forced upon the Arctic by human greenhouse gas emissions which are, for the largest part, the result of fossil fuel burning. This year, the Arctic experienced new record warmth during a Winter that included odd periods when North Pole temperatures rose briefly above freezing.

Alaska, a microcosm of this building Arctic heat, experienced its second warmest winter on record — which was then immediately followed by its warmest spring ever recorded. Across the state, it was warmer than normal pretty much everywhere and mostly all the time.

Alaska 25 City Composite Temperatures

According to this 25 Alaska city composite index (provided by Climatologist Brian Brettschnieder above) every day but two through June 30 of this year saw above normal temperatures in the related regions. Yet another pretty clear indication that there’s nothing normal about Arctic or near Arctic temperatures these days.

Closer to the 2012 Line But Still in Record Low Range

All this extreme Arctic heat during Winter and Spring was probably the major contributor to new record low sea ice extents continuing for more than three months running. However, storms over the Arctic Ocean have since moderated temperatures into closer to normal ranges for June even as these weather systems’ circulatory patterns have tended to spread the ice out. As a result, rapid rates of melt slowed somewhat into June and the extent monitor has crossed the 2010 line, coming closer to the 2012 line in the JAXA measure, while flipping back and forth over the 2012 line in other major measures (NSIDC).

Arctic Storm East Siberian Sea Laptev

(Arctic storm churns through the East Siberian and Laptev seas of the Arctic Ocean on July 1 of 2016. Sea ice measures are currently near new record lows, but a steep rate of decline will be required to challenge or break with 2012. Image source: LANCE MODIS.)

The upshot is that the sea ice state during early July doesn’t look quite as bad as it did during late May and early June. Chances for a blue ocean event in which Arctic sea ice volume exceeds an 80 percent loss since the late 1970s, in which sea ice extent falls below 1.5 million square kilometers, or sea ice area falls below 1 million square kilometers seems less likely by end Summer at this time. Such an event would now likely require some rather severe Summer weather episodes including strong highs over the Central Arctic and/or very strong late summer lows pushing heavy swells into the Central Arctic Basin. That’s not to say we shouldn’t be on the lookout for strong negative sea ice departures over the next few months — which are certainly still possible. And given the current trend, 2016 remains in a position to hit near or below 2012 records by end Summer.

Links/Attribution/Statements:

Sea Ice Hit Record Lows Every Single Day in May

Hat tip to The Arctic Sea Ice Blog

Climatologist Brian Brettschnieder

LANCE MODIS

JAXA

NSIDC (please support public, non special interest based science by re-funding critical NSIDC satellite monitoring of the Arctic)

Alaska Experiences Warmest Spring on Record

Warm Arctic Storm to Push Temperatures Above Freezing at North Pole in Winter

NASA GISS

Hat tip to DT Lange

Hat tip to Cate

Hat tip to Colorado Bob

Hat tip to DaveW

(Disclaimer — The views and analysis expressed in this blog are my own. The related analysis is an exploration of current trends and possible future climate states informed by my own best assessment of the science. In no way is this analysis meant to be misconstrued as an absolute authoritative final word on sea ice states. For example, we cannot say with absolute certainty that any one of the following — new record lows, blue ocean events, or a failure to hit new record lows — will happen. As such, the analysis should instead be viewed as a middle-certainty forecast informed by current trends. Further scientific opinion and informed discussion on the issue is welcome.)

Wildfires in the Land of Frozen Ground — 1,000 Mile Long Pall of Smoke Blankets Burning Siberia

It’s another day in a record hot world. And in a few hours, just below the Arctic Circle in Siberia, the temperature is predicted to hit 33.2 C (or just shy of 92 degrees Fahrenheit). According to climate data reanalysis, that’s about 15-20 C above average for this time of year over a land filled with cold weather adapted boreal forests and covering ground that, just below the first few feet of duff, is supposed to be continuously frozen.

image

(33. 2 C [92F] temperatures run to within 3.7 degrees of Latitude south of the Arctic Circle [66 N]. These are readings in the range of 15-20 degrees Celsius above normal and are likely record ranges for the area. Nearby, enormous Siberian wildfires now burn. Image source: Earth Nullschool.)

All along the southern and western boundary of this region of extreme heat, very large wildfires now rage. Sparking near and to the east of Lake Baikal during early April, May and June, the fires have since run northbound. Now they visibly extend along an approximate 1,000 mile stretch of Central Siberia ranging as far north as the Arctic Circle itself.

As recently as June 25th, Russian authorities had indicated that around 390 square miles had burned along the southern edge of this zone in Buryatia alone. For other regions, the tally is apparently uncounted. An unreported number of firefighters are now engaged with these blazes and have currently been assisted by an additional 150 Russian Army personnel. The Interfax News Agency also reports that 11,000 personnel from the Russian Army are currently on standby to battle the massive fires, should the need arise.

Massive Siberian Wildfires June 30

(NASA’s LANCE-MODIS satellite shot for June 30, 2016 shows enormous smoke plumes rising up from intermittent wildfires apparently burning across an approximate 1,000 mile stretch of Central Siberia. For reference, right border of frame is approximately 1,200 miles.)

Today’s Siberia is a vast thawing land and armies of firefighters are now apparently necessary to stop or contain the blazes. Already interspersed with deep layers of peat, melting permafrost adds an additional peat-like fuel to this permafrost zone. When the peat and thawed permafrost does ignite, it generates a heavier smoke than a typical forest fire. This can result in very poor air quality and related incidents of sickness. During 2015, a choking smog related to peat fires forced an emergency response from Russian firefighters. The thick blanket of smoke currently covering Siberia (visible in the June 30 LANCE MODIS satellite shot above) now blankets mostly uninhabited regions. But the coverage and density of the smoke is no less impressive.

Peat and thawed permafrost fires have the potential to smolder over long periods, generating hotspots that can persist through Winter — emerging as new ignition sources with each passing Summer even as Arctic warming intensifies. During recent years, wildfires in the Siberian Arctic have been quite extensive. According to Greenpeace satellite analysis, 2015’s wildfires covered fully 8.5 million acres (or about 13,300 square miles). These reports conflict with the official numbers from Russia. Numbers Greenpeace indicates fall well below the actual total area burned.

(Wildfires erupt to the north and west of Lake Baikal in this June 27 rendering of the Japanese Himawari 8 satellite imagery.)

Thawing permafrost under warming Siberian temperatures not only generates fuel for these wildfires, it becomes an additional source of greenhouse gas emissions. And as the area of land wildfires burn in the Arctic expands together with the heat-pulse of human-forced warming, this amplifying feedback threatens to add to an already serious problem.

Links:

Earth Nullschool

LANCE-MODIS

Climate Reanalyzer

Russian Volunteers Seek a Foothold as Wildfires Rage in Siberia

Interfax

Hat tip to Colorado Bob

Hat tip to Andy in San Diego

Hat tip to DT Lange