(Tundra Fires Near Hudson Bay in Northern Canada on June 29, 2013. Image source: Lance-Modis)
Today, as temperatures rocketed to above 120 in the US Desert Southwest, temperatures hit 87 degrees on the shore of the frozen waters of the Canadian Archipelago. These were the south to north markers of a heatwave that spanned 3,000 miles from Death Valley, California to Cambridge Bay in extreme northern Canada.
Beneath the southern section of this vast and sprawling heat dome, US communities coped by setting up cooling centers and issuing heat warnings. But despite this agile preparedness, hospitals in the hardest hit areas were flooded with cases of heat injury.
In one instance, an outdoor concert in Las Vegas saw more than 200 persons treated for heat injuries while more than 36 were hospitalized. Sadly, an elderly man also passed away at one local hospital after suffering from heat stroke. Temperatures reached an extraordinarily hot 115 (Fahrenheit) in Sin City.
Elsewhere, across the region, Palm Springs hit 122, Death Valley hit 125, and Phoenix hit a scorching 119. Tomorrow is expected to bring another day of extreme record heat, so area cities and residents are still under the gun.
Further north, near 90 degree temperatures stretched all the way to the frozen shores of Cambridge Bay in extreme northern Canada. There, some locations on the ice choked waterway experienced 87 degree temperatures, which is nearly 40 degrees (Fahrenheit) above average for this time of year.
The extreme heat sparked numerous tundra fires across Northern Canada, some of which you can see in the NASA satellite image above. Note the smoke tails rising from two clusters of fires in the upper center portion of the image. That ice speckled area of blue to the right is the, usually frigid, Hudson Bay.
The heat also set off melt and fracturing of sea ice in Cambridge Bay, which you can see in the NASA shot below:
Warming air temperatures typical for this region (high 40s to low 50s) usually result in a more gradual melt. But hot air temperatures at up to 55 degrees (Fahrenheit) above freezing tend to have a far more rapid effect. It is also worth noting the nearly complete lack of visible snow cover in this extreme northern region.
I’ve Never Seen A Rossby Wave Like This
The cause of this 3000 mile swath of heat is an extremely high amplitude wave in the Jet Stream that stretches from the Western US all the way up to the Arctic Ocean. This large bulge has allowed a powerful ‘heat dome’ high pressure system to build up beneath it, concentrating heat over the vast area affected.
Note the up-flow of Jet Stream winds rising up the coast of California, Oregon, Washington and British Columbia then lifting all the way up to the Arctic Ocean before diving back down through central Hudson Bay and into the US Midwest, before making another hairpin turn north again over the Appalachians.
Large Jet Stream waves of this kind are termed ‘Rossby Waves’ after the climate scientist who first identified them. They show extreme north-south and south-north elongation. In the time I’ve been tracking the extreme changes to the Northern Hemisphere Jet Stream brought about by human-caused warming, I’ve never seen a Rossby Wave quite so large as this. Nor have I seen one that is the result of so many large back and forth meanders. In fact, the entire Northern Hemisphere Jet is a mess of meanders, cut off upper level lows and blocking highs.
One of these upper level lows is expected to bring abnormally heavy rain with up to 3-5 inches for some parts of the US East Coast over the next couple of days. So as heat bakes a swath from Death Valley to the Arctic Ocean, the Eastern US braces for potential flooding. Similar Jet Stream loops and swirls spawned the European floods this June, a series of deadly floods that killed hundreds in India and Tibet, and multiple anomalous Arctic heatwaves occurring throughout the past month.
Extreme Jet Streams, like the one displayed above (for late Saturday, June 29), are far more likely to spawn extreme weather events than the usual, gently wavy Jet Stream that human civilization has been used to for much of the 20th Century and, probably, for most of the 10,000 year period since the last ice age. But a combination of eroding sea ice and record or near record low Northern Hemisphere snow cover contribute to both a slowing of the Jet Stream and in greater north-south and south-north flows. The result is large wave patterns in the Jet that tend to get stuck in the same configuration for long periods. Beneath the swells in the Jet, we get hotter temperatures, dryer conditions, and the risk of everything from extreme heatwaves to droughts and fires. In the dips, we get cooler temperatures and much, much stormier conditions resulting in a range of weather from extreme winters (Europe during winter/spring 2013), to floods (Europe summer 2013, India late June 2013), to record rainfall and powerful thunderstorms (US May-June 2013).
These are vivid examples of how human-caused climate change can result in extreme weather.
Heat Wave to Last For at Least a Week
The current record heat wave affecting both the US West and a large section of Canada is expected to last at least until the end of this week. Slow moderation, though, is expected for some regions after Sunday. However, the blocking pattern that spawned this particular heat wave shows little sign of changing position. So hotter, dryer conditions are expected to remain in place for the foreseeable future for much of the US South-West.
Meanwhile, Canada and regions along the Arctic coastline are still likely to see much warmer than usual conditions as periodic warm air invasions from the south are likely to continue.
(Image of rocketing wind power capacity growth since 1996. Source: Futurist)
A new report from the International Energy Agency reveals that total renewable energy sourced electricity generation is set to surge another 40% between now and 2018. This means that by 2016, renewables will have supplanted natural gas as the world’s second largest source of electrical power and that by 2018, renewables will generate fully one quarter of the world’s electricity.
Power generation from hydro, wind, solar and other renewable sources worldwide will exceed that from gas and be twice that from nuclear by 2016, the International Energy Agency (IEA) said today in its second annual Medium-Term Renewable Energy Market Report (MTRMR).
According to the MTRMR, despite a difficult economic context, renewable power is expected to increase by 40% in the next five years. Renewables are now the fastest-growing power generation sector and will make up almost a quarter of the global power mix by 2018, up from an estimated 20% in 2011. The share of non-hydro sources such as wind, solar, bioenergy and geothermal in total power generation will double, reaching 8% by 2018, up from 4% in 2011 and just 2% in 2006.
(Emphasis added to clarify the usual confusion between capacity and generation)
Et tu Brute?
Raging development of renewables has come on strong despite the fact that they receive just 1/6th the subsidy support (523 billion vs 80 billion in 2011) of fossil fuels and have been the whipping boy of carbon energy cheer leaders in blogs, the media, and in chat rooms for years.
Misinformation, a clear funding disadvantage, and a constant wave of negative press from vested interests, has been unsuccessful in keeping the pace of renewable energy growth from running rapidly ahead of any other set of fuels. Doubts about renewables’ energy return on energy invested (EROEI), intermittency, and the ever-arcane ‘lack of thermal capacity’ has been rendered moot by a vast and growing volume of electricity generated from these sources. Instead, IEA has found renewables to stand on their own merits:
“As their costs continue to fall, renewable power sources are increasingly standing on their own merits versus new fossil-fuel generation,” said IEA Executive Director Maria van der Hoeven as she presented the report at the Renewable Energy Finance Forum in New York. “This is good news for a global energy system that needs to become cleaner and more diversified, but it should not be an excuse for government complacency, especially among OECD countries.”
Further to this point, IEA noted:
in addition to the well-established competitiveness of hydropower, geothermal and bioenergy, renewables are becoming cost-competitive in a wider set of circumstances. For example, wind competes well with new fossil-fuel power plants in several markets, including Brazil, Turkey and New Zealand. Solar is attractive in markets with high peak prices for electricity, for instance, those resulting from oil-fired generation. Decentralised solar photovoltaic generation costs can be lower than retail electricity prices in a number of countries.
Impetus for this massive growth comes primarily from wind and solar power sources, which, as noted above, are set to double their capacity over the next five years.
It’s enough to make the fossil fuels, who still remained the funding babies of the world’s governments in 2011, feel a bit of betrayed consternation.
Et tu Brute?
Coal Funding to be Cut
Adding further insult to injury, funding of the most polluting fossil fuel source — coal — appears to be on the chopping block. In his recent Climate Action Plan announcement, Obama laid down a policy in which the United States would no longer support loan funding for coal-fired power plants overseas and where his administration would begin to strictly regulate carbon emissions from coal plants in the United States. Meanwhile, the World Bank has stated that it would drastically cut its funding for new coal plants, providing support for them only in the ‘most dire of economic circumstances.’
But it’s Not all Roses for Renewables Yet
Surging worldwide investment in renewables has, sadly, come at time of lagging renewables investment in Europe. Wide-ranging ‘austerity’ measures imposed by central banks and conservative governments in Europe have forced some countries in the Eurozone to cut funding for new renewable energy projects.
That said, despite government cut-backs, the pace of adoption in many countries remains high due to both public purchases and due to the fact that prices for new generation keep falling rapidly. So even though funding fell, these lower outlays were still able to purchase more renewable watts for each dollar (or in this case, Euro), spent.
Direct Replacement Necessary to Have any Hope of Mitigating Human Caused Climate Change
Policy measures to cut coal plant funding and regulate carbon emissions raise the possibility of a growing direct replacement of fossil fuel energy sources with renewable energy sources over the coming decade. A rapid pace of this kind of replacement will be necessary to deal with a growing set of difficulties imposed by human-caused climate change. What appears hopeful is that renewables seem poised to encompass ever-larger portions of the world’s energy mix. Let’s hope the pace at which this replacement occurs is fast enough and strong enough to avoid the worst impacts of climate change.
To wit, it is important to note that global carbon emissions are still rising. As of 2012, the world had emitted 31.6 gigatons of CO2 into the atmosphere. And though the rate of increase slowed substantially from 2011 to 2012, this massive volume of CO2 was enough to set a new record high. So the sense of urgency and impetus for change could not be higher.
From this point forward, we’re in a race between the rate of fossil fuel burning and the rate of renewables adoption. Allowing too much more to be burned before the last coal plant, oil well, and natural gas plant are shuttered (or, more dubiously, have their carbon sequestered) puts in place a situation where we were ‘too late’ to prevent a climate nightmare.
And this is one situation where we really, really don’t want to be too late.
To this thought, I’ll leave you with a recent interview of climate activist and, in my opinion, hero of social and environmental justice, Tim DeChristopher by late night entertainer David Letterman:
Over the past month, warmth and energy have been building in the Arctic. All around, from Siberia to Scandinavia to Alaska, heatwaves have flared beneath anomalous long-wave patterns in the Jet Stream. Patterns, that in many cases have persisted for months. The Alaskan heat dome sent temperatures there to 98 degrees (Fahrenheit). Temperatures in Siberia flared to the low 90s. And heat built and flared again in Scandinavia and Northeastern Europe, sending Arctic temperatures first into the 80s and then to 92.
Now, with central sea ice weakened and with heat circling in from all around, the Arctic appears to be bracing for a period of rapid sea ice loss.
Part 1: The Monitors Start to Go Sharply Negative
The first hint that the Arctic may be at the start of a precipitous fall in sea ice came when the major monitors all went negative. Cryosphere Today, Jaxa, NSIDC — all these key monitors show Arctic sea ice coverage falling sharply over the past two days.
Cryosphere Today showed a substantial loss of more than 200,000 square kilometers of sea ice area in its most recent 24 hour period. Jaxa and NSIDC showed similar extent losses with NSIDC following a steeply declining curve to 10.6 million square kilometers and JAXA diving down to 10.1 million square kilometers.
You can vividly see this declining curve in the most recent NSIDC graph:
Together, these monitors begin to show what could well be the emergence of a potential ‘sea ice cliff’ resulting from rapid loss of ice during a time of escalating impacts. And these impacts appear to be emerging in rapid succession. Most notably, a Warm Storm now melts the central ice even as massive heatwaves threaten to inject hot air into the Arctic’s perimeter.
Part 2: PAC 2013 Now a ‘Warm Storm’
We find that even as these sharp sea ice declines began to emerge, temperatures in the Central Arctic Basin are now all above freezing. Meanwhile, a 995 mb low churns almost directly over the North Pole. This low is part of the same complex of storms that has remained in the Central Arctic since about May 26. Though storms, even strong, long duration storm events like this one, have been known to occur in this region during June, a persistent storm thinning and melting the Central Arctic Basin ice is unprecedented. And this is exactly what has been happening.
Now, it appears this storm has shifted into a new phase that is likely to further enhance central sea ice thinning and melting. The Warm Storm appears to have taken hold.
In a previous post, I defined a ‘Warm’ Arctic Storm as a storm occurring in the Central Arctic in conjunction with average atmospheric temperatures in the range of 0 to 6 degrees Celsius. We are now decisively in the lower end of that temperature range as you can see in the current DMI temperature measure:
Note the wide area of above freezing temperatures now dominating all but isolated portions of the Central Arctic. And, for reference, we have the position of our Warm Storm given in the DMI image below.
Here we can see our Warm Storm now hovering almost directly over the North Pole.
These Warm Storm conditions provide an added surface stress to the sea ice by burdening the ice will above freezing precipitation, winds, fog and air with higher moisture content. These forces add to the churning mechanism of the storm which tends to break the fresh water cap that protects the sea ice and pull up warmer, saltier water from below. It is a combined stress that has already greatly eroded and melted the Central Arctic’s sea ice.
A vivid modeling of current and projected impacts of this Warm Storm are graphically displayed in the US Navy CICE/HYCOM thickness monitor below:
In this vivid model history we can see our ‘Warm Storm’ turning a growing section of the Central Arctic sea ice into one enormous melt puddle even as it continues to shove sea ice along the north coast of Greenland and out through the Fram Strait. It is also worth noting the speed and violence with which edge melt is projected to proceed between now and July 5th. Hudson Bay, Baffin Bay, the waters of the Canadian Archipelago, The Kara Sea, The East Siberian Sea, The Chukchi, and even the edges of the Beaufort are all projected (in this model) to see rapid to extraordinarily rapid melt.
We can see the current Jet Stream configuration, which can well be described as a freaky hydra-head pattern with multiple rapid upper air flows converging on the high Arctic, in the image below:
In particular, we note the high amplitude Rossby Wave pattern emerging over the western US and reinforced by a second echoing pattern extending up over the Beaufort Sea. The wave height for this massive blocking pattern in the Jet is expected to jump northward over the coming days even as a terrific heat dome intensifies with a center near the ‘Devil’s Armpit’ (Hat Tip to X-Ray Mike over at Collapse) of the US (Southern California, Nevada, Arizona).
By Wednesday, we see extraordinary 35 degree Celsius (95 degrees Fahrenheit) average 5,000 foot temperatures at the heat dome’s heart in the US Southwest (translating into 105 to 123+ degree surface highs over a broad area), and a long pulse of hot air jumping all the way up to the Beaufort Sea where it appears near 80 degree (F) high temperatures could emerge near or even over the sea ice.
You can view this uncanny record hot air pulse in the ECMWF weather model forecast below:
Note the angry hot pink heat dome over the US Southwest and the long, hot arm extending from it and all the way into the Beaufort. It is also worth noting that a secondary, though somewhat less intense, heat surge also emerges above Scandinavia and extends deep into the Arctic from its opposite end, creating a kind of pincher of hot air keeping the Arctic in its grip.
By Thursday, this hot air gets wrapped into a 990 mb ‘Warm Storm’ that then goes traipsing through the Beaufort. Not a pleasant prospect, if one wishes to see sea ice preserved…
Worst Case Melt Scenario May be Emerging
So by late June, it appears that the worst case melt scenario — with a storm hollowing out and melting the Arctic sea ice from the center and powerful warm air pulses delivered by a mangled Jet Stream rapidly melting the sea ice from its edges — may be emerging. A start to a ‘melt cliff’ that occurred this week, therefore, may extend and rapidly advance over the coming days. Model ensembles seem to support this forecast even as atmospheric heat delivery to the Arctic ramps up. It is an extreme situation that is well worth monitoring.
The weather forecast for the American West is startling. An extreme blocking pattern that has persisted there since last year is now set to hit its highest amplitudes yet, allowing a massive heat dome to grow and sprawl out over the west for an extended period. The result will likely be a deadly heatwave that could send temperatures rocketing high enough to shatter Earth’s all-time record.
This blast-furnace heat is forecast to begin this weekend with temperatures expected to reach 126 to 129 degrees (Fahrenheit) in Death Valley, California. This range is very close to the all time high record Earth temperature of 134 degrees. So even a minor intensification of this predicted heat wave could result in a new Earth temperature record.
Other regions in the West are also predicted to experience record heat. Temperatures for both Phoenix and Las Vegas are expected to exceed 110 degrees (F) and could also shatter records for these two cities.
Overall, a broad swath from the American west and up into Canada is expected to experience temperatures between 10 and 35 degrees Fahrenheit above average. A visual representation of this incredible heat spike is provided by Weather Bell via Climate Central:
The cause of this predicted record heat is a highly anomalous jet stream. ECMWF northern hemisphere temperature and pressure forecasts show the emergence of an above 30 degrees Celsius ‘heat dome’ forming at 5,000 feet over a large section of the American West.
Temperature differentials on this map also outline the high amplitude wave pattern developing from the western US all the way up through Alberta, Canada. By Wednesday, July 3, this hot pulse has driven 15 degree Celsius (60 degree Fahrenheit) 5,000 foot temperatures all the way to the Arctic Ocean. Such a hot air invasion, should it emerge as predicted, could result in daily surface highs near 80 degrees directly adjacent to a region of the high Arctic even as 110, 120, or perhaps 130 degree temperatures bake Las Vegas, Pheonix, and Death Valley.
You can see this hot, oily knife plunging from south to north over the US and Canada in the ECMWF forecast below:
Dramatic and dangerous alterations to the Northern Hemisphere Jet Stream are a result of a combination of sea ice loss and loss of snow cover of in the extreme north during spring and summer months. During May of 2013, both snow cover and Arctic sea ice volume were the third lowest levels ever recorded. As sea ice and snow cover erode, it allows more warm air invasions into the Arctic the result is an increased waviness and slowing down of the Jet Stream. Under the up-swell of these large waves, dangerous heat and dryness become more common events. In the path of the down-slope, we can expect to see increased cloudy, cooler, stormy conditions.
So even as the American West bakes under temperatures that could, at their core, be the highest values ever recorded on Earth, the East and Central US are setting up for a dangerously unstable condition that may generate extraordinarily powerful storms. The heightening wave in the Jet will dig deep into the Arctic, tapping cooler air and instability before it makes a powerful dive into the moisture and heat laiden region from Minnesota, Iowa and Arkansas eastward. Powerful thunderstorms, hail, flooding, tornadoes, and in the case where streams of the down-rushing Jet converge, derechos are all possibilities given this powerful and unstable north-south flow.
Very dangerous and unstable weather from a damaged and increasingly riled climate. We should do well to not only implement a rational Climate Action Plan, but to add a number of goals and increased efforts. We’re living in the age of consequences and each year of delay begs for more dangerous conditions.
A record flood that inundated large regions of Canada last week is now sending a large pulse of silty water out through the Mackenzie Delta and into the Beaufort Sea. The pulse of floodwater is so large and bears so much silt that it has painted a wide section of the Arctic Ocean near the Mackenzie Delta brown.
You can see this major out-flow and brown coloration in the satellite image above, provided by NASA.
The fresh flood waters coming from the Mackenzie River are much warmer than the Arctic Ocean waters and the sea ice they contact as they push out from the continent. This flush of warmer water enhances sea ice melt even as it causes the local Arctic Ocean to heat up.
Since heat transfer to the Arctic Ocean from the continents via warm floods serves to increase ice melt rates in the summer season and since increasing flows of fresh water from both the continents (snow melt, increased summer storms) and glaciers (increasing rates of ice sheet melt brought on by human-caused warming) serve to enhance ice formation during the winter season, the Arctic is pushed to see-saw between record and rapid melt and rapid refreeze.
That said, an overall accumulation of heat in the Arctic Ocean has resulted in sea ice extent, area and volume decline during all seasons as the ice is unable to recover to past levels during winters. It’s just that the decline rate is fastest and most greatly amplified during summer.
The below graph, provided by Wipneus, displays this summer melt exaggeration:
Note the faster rate of loss during June, July, August, and September when compared to months during other seasons.
New Ocean Circulation Transfers Most Fresh Water to Beaufort
Increasing flows of fresh water via snow, glacial melt, and more rainfall has now met with strange changes to Arctic Ocean currents, wind patterns and circulation that, according to NASA, is both preserving some of the thermohaline circulation in the Arctic and pulling more fresh water into the Canada Basin and Beaufort Sea.
A visual presentation of these changes is provided by NASA below:
In its press release, NASA noted:
The transpolar drift (purple arrows) is a dominant circulation feature in the Arctic Ocean that carries freshwater runoff (red arrows) from rivers in Russia across the North Pole and south towards Greenland. Under changing atmospheric conditions, emergent circulation patterns (blue arrows) drive freshwater runoff east towards Canada, resulting in freshening of Arctic water in the Canada Basin (full press release here)…
Knowing the pathways of freshwater is important to understanding global climate because freshwater protects sea ice by helping create a strongly stratified cold layer between the ice and warmer, saltier water below that comes into the Arctic from the Atlantic Ocean. The reduction in freshwater entering the Eurasian Basin resulting from the Arctic Oscillation change could contribute to sea ice declines in that part of the Arctic.
NASA shows how changes in Arctic Ocean circulation have already re-distributed fresh water into the Beaufort Sea in the image below:
Higher concentrations of fresh water in the Beaufort would tend to preserve more sea ice there. Ironically, this ice is vulnerable to late-season melt due to its proximity to the North American Continent and away from the relative cool of Greenland. Higher salt water concentrations running from Greenland to the North Pole to the Laptev and then toward Wrangle Island would tend to enhance early season edge melt there.
Overall, this new distribution of fresh water combined with heat transfer into the Arctic Ocean via the continents makes it difficult to provide a case for long-term ice preservation under a regime of increasing human-caused warming. A fresh water cap near Greenland would have combined with cooler regional temperatures to preserve ice for longer periods there. Instead, we have the more resilient ice placed in close proximity to hot continental land rather than cold Greenland ice. Since these changes have yet to be fully understood, new reports will, hopefully, generate more clarity.
Yesterday in Alaska, as wildfires raged through interior regions, temperatures rose into the high 80s (Fahrenheit). Now, during relative night-time in the land of the midnight sun, lows are hovering around 70 in many places (near record daily highs for this time of year). Meanwhile, at the Arctic’s opposite end, temperatures in the region of Archangel, near the Arctic Ocean are in the range of 90 degrees. Nearby, Finland also sees temperatures rocketing up through the 80s as a Scandinavian heatwave that began in June reasserts itself.
The Arctic Heatwave: A Pervasive Feature for Summer 2013
The Arctic heatwave that started in Scandinavia then moved to Alaska and flared in Russia and Siberia has now become nearly ubiquitous. Record hot temperatures range the Arctic from shore to shore. These record heat invasions have been enabled by a combination of factors that include rising global greenhouse gasses, above average atmospheric methane and CO2 concentrations in the Arctic, and a rapid retreat of snow and sea ice cover that has enabled the Jet Stream to range further and further north, bringing temperatures from more southerly climates with it.
As a sample, atmospheric CO2 is now at about 403 parts per million at Barrow Alaska, while methane levels are around 1890 parts per billion. These levels are about 4 parts per million and 60 parts per billion above current global average CO2 and methane levels respectively. Higher levels of these heat trapping gasses in the Arctic are a direct result of environmental emissions sources including thawing tundra, melting permafrost, and destabilizing frozen methane on the Arctic sea bed. Together, these sources result in substantially higher levels of almost all greenhouse gasses over a broad range of the Arctic.
Extreme Jet Stream positions are also plainly visible today with a large, anomalous peak in the Jet Stream over Scandinavia and extending into Russia along with a fading, but still apparent, ‘heat dome’ high pressure system over central Alaska:
Both these features continue to bring much warmer than normal conditions in regions beneath their influence. The Scandinavian blocking pattern has been particularly persistent, with weather impacts stretching all the way back to early June. One last feature of note is a cut-off upper level low just off the Pacific coast of British Columbia. This particular low pressure system was the one that resulted in so much flooding over regions of Alberta and Calgary last week with rainy conditions persisting through today. A large band of clouds and rain storms continues to stream off this low, dumping more un-needed moisture over central Canada. Among today’s impacts was the flooding and shut-down of a meat-packing plant, yet one more ding to the world’s food supply.
ECMWF forecast models show this rough configuration of the Jet Stream remaining in place at least until July 6th when the Scandinavian blocking pattern begins to stage a major warm-air breakthrough to the Central Arctic. At the same time, a large trough of low pressure systems emerges again over regions of Alberta and northern Canada as a ridge of high pressure shoves what remains of PAC 2013 over Greenland and comes to take tenuous hold of the Central Arctic.
Note the above freezing 5,000 foot temperatures plunging all the way through the Central Arctic (which should translate to around 40-45 degree [F] surface temperatures). It is also worth noting the large pulse of warm air riding all the way up to the Canadian Archipelago ahead of the developing trough.
This forecast is still very far out, so we’ll have to keep watch for any changes. Yet given the history of summer 2013 Arctic weather, it appears likely that the ongoing extreme configuration of the Jet will result in more unusual events.
Yesterday, President Barack Obama gave a rousing speech to promote his new Climate Action Plan. In it, he used a number of keywords that those concerned about the increasingly violent state of the world’s climate might appreciate. He used the term ‘tar sands,’ when making the equivocal statement that he ‘wouldn’t approve the Keystone XL Pipeline unless it was proved to be carbon-neutral’ and in his uplifting conclusion he used the terms ‘Invest’ and ‘Divest’ — slogans the climate movement have used in their efforts to shift investment funds from fossil fuel companies to those that support renewable energy.
The speech earned praise from the likes of Bill McKibben, Chris Hayes, Michael Mann, and Joe Romm. Joe Romm labeled Obama a ‘climate hawk,’ Michael Mann gushed saying:
“It is the most aggressive and promising climate plan to come out of the executive branch in years and President Obama should be applauded for the bold leadership he has shown in confronting the climate change threat head on.”
Bill McKibben noted that Obama ‘had begun to advance the country in a sane direction.’ And Chris Hayes, citing the ‘invest, divest’ line from the speech, claimed these were the most ‘crypto-radical lines the President has ever uttered.’
And there is much in the plan to be praised though, perhaps, not enough to earn President Obama the label of ‘climate hawk,’ despite his very encouraging statements and use of language. In fact, there is compelling reason to believe that the Obama plan represents a response that is a too little, too late confrontation with a growing age of consequences.
The Good: Begins to Lay the Groundwork for Comprehensive Climate Policy
When we cut past the, admittedly encouraging, rhetoric and look at the nuts and bolts of the Obama plan, what we find are a few moderate steps in the right direction and a structured Action Plan that begins to lay the groundwork for a comprehensive climate policy. These steps in the right direction, however, may well represent walking when we should be running (see more on this in ‘The Bad’ and ‘The Ugly’).
The keystone (pun intended) of this plan is to establish carbon as a pollutant and to set in place a framework to begin direct legal regulation of the potent greenhouse gas: carbon dioxide (CO2). This is important because it spells the beginning of the end for CO2 emissions from a policy standpoint. It involves re-tooling and working with existing power infrastructure and supply lines to find ways to reduce CO2 emissions. So this first step is well worthy of the ‘good’ label.
It is worth noting that the US has achieved serious reductions in CO2 emissions over the first five years of Obama’s Presidency. These reductions were achieved via a combination of switching to a greater reliance on natural gas, markedly increased vehicular fuel efficiency standards, a rapidly increasing adoption of renewable energy generation, increased building efficiency and light bulb efficiency standards, and an increased reliance on biofuels (which currently uses a portion of the food crop to fuel vehicles).
Obama has also been helped by a massive campaign by environmentalists to shut down the nation’s dirtiest coal plants and to halt new construction of these carbon belching behemoths. These campaigns are one key reason why renewables and natural gas have had the opportunity to take greater market share.
If other countries around the world had achieved the CO2 reductions America has seen during Obama’s tenure, we would be in a much better place globally. Total CO2 emissions would have begun to fall off. Instead, the world has seen successive gains in the volume of CO2 dumped into the atmosphere with the total hitting nearly 32 gigatons this year. So US achievements in this area are both positive and noteworthy (Good). But they occur against a very stark global background.
Natural gas, however, does have a darker side (see Bad and Ugly) in that its enhanced production via fracking results both in more methane emissions even as it threatens local water supplies. Obama is right to seek to regulate industry, via his action plan, in an attempt to reduce methane leaks. Sadly, his speech and plan had no content involving threats to water, which appears to have been left out.
Obama’s proposal to remove all funding for new foreign coal plants, except in the poorest of countries and when carbon capture technology is applied, can also be labeled ‘Good.’ It represents starting to apply pressure on almost all countries to begin to remove this most polluting of all greenhouse gas sources or to construct means to capture and store the carbon emitted. It could well be labeled extraordinarily good because it will give the US the opportunity to diplomatically oppose massive new coal plant construction projects on the books for India and China unless Carbon Capture and Storage CCS facilities are added. This particular policy measure does look rather ‘hawkish’ so I’m tentatively hopeful we may see more diplomatic effort on the CO2 front. If such policies are aggressively applied we could see a start to a falling off of new coal plant construction as well as some of the first actual applications of CCS (making renewables more competitive vs coal).
Lastly, the Obama plan includes a raft of new alternative energy and efficiency measures. These include setting aside enough public land to support new renewable energy projects for 6 million homes, a number of increased building efficiency standards, constructing gigawatts worth of wind and solar capacity for US military bases, and a number of more minor, but still worthwhile, measures. Such efforts can all well be labeled ‘Good.’
In sum, these policies seem to represent a grand vision on climate change that seeks to:
1. Regulate and reduce carbon emissions at the source.
2. Begin putting in place the regulatory precedent for requiring fossil fuel facilities to capture carbon, both in the US and overseas.
3. Target new coal plant construction overseas for removal of US funding or, otherwise, pressuring nations to build CCS at these facilities.
4. Reduce methane emissions that result from hydraulic fracturing.
5. Continue to increase renewable energy adoption while pushing efficiency standards higher.
6. Establish a precedent whereby the US can employ diplomacy in an effort to reduce carbon emissions worldwide.
When taken together, Obama’s approach is far more rational than those submitted by Mitt Romney during the 2012 Presidential Campaign. At this point, Mitt would be submitting his policy to rapidly drill our way to oblivion while ignoring the fact that climate change is a problem altogether. Obama, on the other hand, moves gradually but decisively in the right direction. So all the efforts above are positive innovations. As such, we can expect loud and outrageous opposition to this, somewhat rational, approach to come screaming up from the ranks of conservatives. The ‘job killing’ rhetorical horse will be beaten to death yet again. So everyone prepare.
But despite the fact that Obama’s evolving climate policy is far, far better than anything submitted by the lunatics, deniers, fossil fuel cheerleaders, and curled into the fetal position while waiting for doomsday republican party, it still has a number of gaping holes in it. In short, there is reason for serious concern that Obama’s climate policy does not move fast enough.
The Bad: Slow Motion Carbon Reductions, Promoting Fracking Overseas, Pumping North American Oil and Gas Production
Though Obama’s proposed climate policy begins to construct the regulatory ‘stick’ to use against emitters in order to reduce carbon dumping into the atmosphere, it doesn’t apply this stick very liberally. Obama’s plan only calls for the US to reduce its total emissions by another 3 gigatons by 2030. Since the US in on track to dump 102 gigatons of carbon into the atmosphere between now and then, the 3 gigatons reduction is less than 3%. This, somewhat blase, reductions plan is hardly worthy of the term ‘climate hawk.’ It’s more like a climate chicken trying to cross the road to climate hawk fame and getting creamed by an oil tanker on the way across.
Hyperbole aside, it is worth raising the question: does a US role as climate leader require more than a 3% total reduction in planned emissions between now and 2030? I would say the answer to this question is, unequivocally, YES. A more worthy and, safer for our kids, target of 20%, 30%, or even 50% by that time is what should be on the table for US climate leadership. By comparison, if the world took such an approach, global CO2 emissions would total in excess of 522 gigatons between now and 2030. This snail’s pace rate of reduction would surely consign ‘the kids’ to a devastating 2 degree Celsius warming by the end of this century and a brutal 4-5 degree Celsius warming long-term. It also almost assures that large-scale emissions will continue long past 2030, an event that puts in place serious risk of even more catastrophic consequences.
Even worse, the Obama plan openly pushes for the use of US hydraulic fracturing technology overseas. Recent reports show that fracking has added 11% to the world’s oil and gas reserves, thereby adding to the total volume of fossil fuels on the world’s oil and gas company books that will need to stay in the ground to prevent a climate nightmare. Yet the Obama administration appears keen on promoting this new technology. As a result, the conservative 11% addition to oil and gas reserves may well double to 20% or more — creating the potential for far more trouble than the US solves by cutting carbon emissions by 3 gigatons at home. It also dramatically eats into any gains policy-makers may achieve by reducing new coal plant construction. Further, there is no guarantee that the methane leaks associated with fracturing and which we are struggling with so mightily today will be responsibly contained in foreign countries. To wit, the countries most likely to make wide-spread use of fracturing — Russia, China, and India — are least likely to responsibly regulate these sources.
So it is worth noting that though natural gas burns cleaner than coal in power plants, new sources produce large volumes of methane via extraction and as such it cannot rationally be viewed as a bridge to anywhere but a climate change nightmare. The gas plants, extraction, and pipeline apparatus will create a carbon emitting structure that will last for many decades — perhaps 80 years or longer. So investing in its wide-spread expansion is a very, very risky endeavor. Though better than coal, it is certainly no leap frog, and use of the term bridge is highly questionable. In short, we achieve climate change game over faster with coal, slower with gas. So, at best, the expansion of natural gas production worldwide may buy us a little time. But even these marginal gains are called into question by the expanded methane emissions resulting from hydraulic fracturing. Meanwhile, the pace of climate change advances at such a rate as to indicate we have very little time left.
Lastly, the Obama plan continues to hint that North American oil and gas production will continue to expand for some time. Both his tacit support of expansion of domestic oil extraction via fracking and his continuing ambiguity on the issue of the Keystone XL Pipeline continue to be causes for concern.
Though Obama has rhetorically distanced himself from the ‘tar sands’ Keystone XL pipeline, there is no clear indication what his decision will be on a structure that is, in large part, already pre-constructed. Pipes are being laid at a feverish pace and simply wait signatory approval by leadership before they are joined. Should Obama not approve the Keystone Pipeline and endure a massive and vicious backlash from powerful vested business interests, we can shift this particular issue to the ‘Good’ category and even put a climate hawk feather in Obama’s cap. But this critical climate issue remains up in the air. Now, in all fairness, I had written earlier that we shouldn’t have the Keystone Pipeline without a comprehensive climate policy which pushes to rapidly reduce greenhouse gas emissions. Sadly, I must say that the push for a 3% reduction in greenhouse gas emissions over the course of 17 years is no-where near enough to allay my concerns. So, in light of a notably robust regulatory advancement but with paltry goals, I must continue to fervently support efforts to block said pipeline.
In light of these policy initiatives, it is worth noting that Obama is granted the unenviable position of attempting to balance an economic system that requires growth to survive against a coming climate catastrophe made worse by the exploitation of a resource upon which our economies are still mostly tooled to rely: fossil fuels. Obama appears to be attempting to keep the machine humming and build in fixes (renewables) while at the same time partly promoting economic expansion via enhanced fossil fuel extraction. Obama’s plan seems to, at least in part, cut against his rhetoric. If Obama were truly serious about achieving growth outside the structure of fossil fuels, he would promote alternative energy sources more and begin a more rapid cut-back of emissions-based fossil fuel use. His approach, therefore, is still heavy on the side of traditional, fossil fuel-based, growth and less so heavy on the side of safety for our children. His plan is extraordinarily risky and leaves open a high chance of serious climate change harm coming down the pipeline. On the other hand, I wouldn’t label his plan blatantly stupid. I reserve that for when republicans counter-propose with their ‘drill the world into oblivion and burn coal ’til the world burns’ mantra.
Together, slow motion carbon emission reductions, support for fracturing in the US and overseas, and continuing ambiguity over the Keystone XL Pipeline represent the ‘Bad,’ dark underbelly of an otherwise positive proposal. These particular issues raise the question of whether or not Obama’s new climate policy is serious enough to provide substantial help in addition to preventing and reducing the harm rumbling our way like a freight-train that inexorably accumulates steam and velocity.
The Ugly: Preparing Communities for Climate Disasters
Now we get to the Ugly part. The part that makes real all the troubles I’ve been doing my best to highlight here. The part where Obama talks about hardening communities against climate change.
Obama noted in his speech that he would set aside funds to make communities more resilient to climate troubles that are already emerging and are likely to continue to get worse at least for decades to come. He also noted that, in some cases, it may be impossible to prevent damage in some areas, so a system would be put in place to ensure that money is sent where it is likely to do the most good and not wasted in areas that cannot be saved. He didn’t use these exact words, but the implication in his speech is clear:
Some communities will probably not survive what we’ve already set in motion.
On the front line of our expanding climate emergency lies the coastal cities of the US and the world. In particular, Miami, has fallen into the cross hairs as a city that will be very difficult to save. Under current emissions scenarios, it is possible that the world will see a 10 foot or more sea level rise over the course of this century. In such a case, Miami would nearly be impossible to save. It sits on porous limestone and is surrounded on all sides by waterways. Few areas in Miami are more than 6 feet above sea level. Even if Miami were encircled by lines of barriers and levees, like New Orleans, the water would seep up through the limestone. City planners are aware of what’s coming. Some of the suggestions for saving the city including raising the whole structure (like Galveston) or even putting it on stilts.
Miami is just one example of a community under assault. Everywhere along the thousands of miles of US coastline, communities will face flooding, rising waters, and increasingly powerful storms. It is likely that there will not be enough in the way of resources to save all of these communities. And it is this new, Ugly, reality that Obama, for the first time, broaches in his speech. Communities will be harmed, homes, businesses, valuable infracture will be lost. In some cases, entire cities may well be lapped up by the ocean.
We were warned of this possibility more than 30 years ago. And had we aggressively pursued policies to reduce greenhouse gasses and to aid developing countries in building renewable energy infrastructures, we could probably have avoided the troubles we now stand at the brink of. Now we face rising costs, rising damage, more powerful storms, more rapidly rising seas. Now our President raises the entirely real possibility that some communities may well need to be abandoned. That funding must go where it is most needed and most useful.
This is the very definition of triage and we are currently involved in planning for climate change triage for our communities. A more clear sign that we are in the grips of a growing emergency could not be seen than this: the President proposes triage funding for coastal communities now under severe threat from storms and rising waters. And this was the ugly part of Obama’s speech. Not because he was wrong in proposing it. But because it is terrible that we have come to this pass. Because it is terrible that we must now begin to assess the potential loss of our communities. Potential losses in the billions and trillions of dollars. But more importantly, potential losses to lives and livelihoods.
Considering these emerging realities brings new urgency to light. Obama’s proposed policies, though rational, are not fast enough, do not cut fossil fuels deep enough, and do not promote the renewables strongly enough. We don’t need to begin walking in the right direction to avoid serious trouble. We need to begin moving with a measured and rapid urgency.
(Large fires in Alaska. Image source: Lance-Modis)
A week after a record heatwave set off highest ever temperatures in Alaska, massive forest fires are blanketing vast areas of wilderness.
More than 80 fires are now raging across the state. The largest include the Lime Hills Fire at 154,000 acres and the Moore Creek Fire at 126,00o acres. In total, nearly 400,000 acres have burned so far this summer. For reference, an average full fire season in the US results in around 3 million acres burned. So the 400,000 acres for Alaska alone represents an abnormally large area burned, especially so early in the fire season and for a region at or above the Arctic Circle.
Like Colorado, where blazes resulted in record damage during June, the largest of the Alaskan fires, Lime Hills, currently threatens a local community. As of Tuesday, the fire had moved to within a half mile of the town which is located on the upper Stoney River just west of Fairbanks. About 70 firefighters are working to ensure no structures are taken by the blaze.
Though not as hot as last week, temperatures still remain in the range of record heat for interior Alaska with some regions Tuesday showing temperatures near 80 degrees (Fahrenheit). Daily record highs for this area range in the high 70s for this time of year. So record-breaking temperatures have become a day-to-day event for this Arctic region.
Fires in Alaska are a direct result of the extreme record high temperatures there. And these temperatures are also linked to a long-period warming trend caused by human-spurred global warming. Increasing heat, dryness and wildfires in vulnerable regions are just one result of the climate change caused by an excessive and continuous burning of fossil fuels. May of 2013 was the 3rd hottest on record, according to NOAA’s National Climate Data Center. Overall, temperatures are about .8 degrees Celsius above temperatures when climate records started in the 1880s. This difference is equivalent to that caused by the Little Ice Age, but on the side of hot.
Also in May, global atmospheric CO2 levels hit a record 400 parts per million. This level of Greenhouse gas is enough to raise Earth’s temperatures another 2-3 degrees Celsius long-term or about half the difference between now and the last Ice Age, but also on the side of hot. Long term results of 400 ppm CO2 also include a 75 foot rise in sea level. Unfortunately, due to a failure by the world’s leaders to enact appropriate CO2 reduction policies, CO2 levels are set to rise to around 550 parts per million by mid-century, enough to bake in a total temperature increase of around 7 degrees Celsius long-term. A virtual fire age.
Between now and then, and without proper policy measures aimed at reducing the damage, we can expect gradual but continually increasing global temperatures with increasing instances of extreme weather events.
The current Arctic heatwave is just one example of the strange climate we are creating. Let us hope that policy makers have gotten the message. We need to get to work before we set off even more dangerous events.
Barrow’s sea ice has borne a number of pretty severe insults over the past week. First, an Arctic heatwave sent Alaskan temperatures soaring to 98 degrees (F) in the interior, the highest temperatures ever recorded for the state. This heat pulse extended far above the Arctic Circle pushing temperatures at Barrow as high as 65 degrees (F) even as flows of warm water flooded into the Chukchi Sea from Alaska’s baked center. These high temperatures spurred an early break-up of Barrow sea ice last week. A break up that proceeded about three weeks ahead of schedule. Then, an ice-melting rain settled in, pelting the sea ice over the past three days.
Now the offshore ice is simply gone.
As you can see in the image above, huge sections of near-shore ice are melted and broken with large areas dominated by dark Arctic water. But offshore is were the greater effects have occurred. Over the past 24 hours, the off-shore ice has shrunk back and now only open ocean is visible on the horizon.
Ice break-up at Barrow occurs when off-shore ice at distances greater than 200 meters from shore begins to move. This event usually occurs on about July 8th. This year it happened on June 20th. Now, less than a week later, the ice that first broke has disappeared.
It will take a little longer for the near-shore ice to melt out. But the most important ice off Barrow — the sea ice — is now departing, retreating into a pack that is rapidly receding from the Chukchi Sea.
You can view the retreat of off-shore ice in the radar sequence below:
Note the ongoing parallel motion to shore and then the lifting away of sea ice during the last sequence.
These radar shots were taken on June 24. So final recession of sea ice occurred only four days after break-up.
Today’s radar shots from Barrow show only small chunks of sea ice remaining from a once-large pack.
We can now say farewell to significant sea ice at Barrow, Alaska for the rest of this summer. Melt will now begin to proceed past the Chukchi Sea and into the Beaufort and East Siberian. This will likely have significant impacts once Beaufort ice begins to break as a Gyre in the center of the Sea begins to increase ice mobility and melt. Already, anchors have been weakened by both rapid melt in the Chukchi and by a large pulse of warm floodwater flowing out of Alberta via the Mackenzie Delta. This pulse of water is a direct result this week’s Canadian floods. So we’ll have to see what impact these warm flood waters have on the shore area of the Beaufort over the coming week.
Last of all, it is worth mentioning that this year’s Persistent Arctic Cyclone has tended to push more ice into the Beaufort. Over past years, the Beaufort has been much more vulnerable to melt come late July through mid-September. With early melt rapidly proceeding from the Chukchi and with areas in Canada and Alaska vulnerable to floods and heatwaves, this critical region of buffering ice will increasingly come into play as melt season progresses. The new dynamic of a PAC hollowing out the central ice as Beaufort melt and ice motion begin to crank up raise the potential for a number of volatile outcomes.
So eyes will shift to the Beaufort as these new potentials emerge.
It’s your typical abnormal summer day in the Arctic. The Arctic heatwave flares again, Canada tries to recover from violent record floods, and a Persistent Arctic Cyclone that began in late May is continuing to core a hole through the sea ice near the North Pole.
The Arctic Heatwave Moves to Eastern Europe
An Arctic heatwave that has skipped from Scandinavia to Alaska to Central Siberia, pushing temperatures in this polar region into the 80s and 90s (Fahrenheit), has now re-emerged to plague Eastern Europe. Temperatures in the middle 80s are once again emerging in Finland, an area that blazed with anomalous 80 degree temperatures in early June. But areas north of the Arctic Circle in nearby Russia are, this time, receiving the real baking. There, highs in the region of Archangel, near the Arctic Ocean, reached 92 degrees Fahrenheit. Out over the Kara Sea, just north of these record-hot conditions, an area still choked with sea ice experienced near 70 degree temperatures today.
Average temperatures for most of these regions range from the 40s to the 60s. So current conditions are about 20 to, in some cases, nearly 30 degrees above average.
In the above weather map, provided by Uni Koeln, we can see today’s record high temperatures showing up in pink in the lower right-hand corner of the map. Note the instances of 32 and even 34 degree Celsius temperatures (which converts to 90 and 92 degrees Fahrenheit respectively).
We can also see that some of last week’s fires over Siberia, which I described here, have been put out by a massive rainstorm now dousing the region. The storm emerged as a trough surged down from the Arctic and over Siberia, setting off large storms.
Extreme Jet Stream Sets Off Floods in Canada, Forcing 100,000 to Evacuate
During the middle of last week, the convergence of two upper-level flows of the Jet Stream set off very unstable conditions over Alberta, Canada. A cut-off upper level low stalled, trapped beneath a long-period blocking pattern and dumped rain on Alberta and regions of Central Canada from Wednesday through Monday. Consistent moderate-to-heavy rainfall fell in some areas for up to 16 hours without stop. By the weekend, many places had set one day records as a swath of 2 to 7 inch rainfall blanketed a broad region. Many areas, including Calgary, received their highest rainfall totals ever recorded.
Contributing to the problem was hard, frozen ground and ongoing mountain melt filling up streams and rivers. This combination of impenetrable ground, snow melt, and ongoing, record rainfall resulted in massive floods that turned streams into torrents, roads into rapids, and stadiums into lakes. In total, more than 100,000 people were forced to abandon their homes.
This particular event is likely to see damages well in excess of 1 billion dollars and could rival the record 22 billion dollar floods that rocked Europe just last month. Jeff Masters, at WeatherUnderGround, speculates that the 2013 Canadian floods may be the most costly in that country’s history. Given the massive impact of this major flood, damage totals may exceed previous record flood impacts, at around 800 million, by well more than an order of magnitude.
Persistent Arctic Cyclone Cutting Through the Central Sea Ice
Lastly, a Persistent Arctic Cyclone that began in late May, and has now composed numerous storms remaining in place over the Central Arctic for about a month, continues to cut a hole into the sea ice near the North Pole. The above image, provided by DMI, shows PAC composed of an old low near the Canadian Archipelago and a new, stronger low that just entered the Central Arctic.
Lowest pressures are now about 990 mb, which is somewhat stronger than the storm that lingered over the Arctic this weekend.
Impacts to central sea ice appear to be ongoing even as somewhat rapid edge melt continues. The latest model assessment and forecast from the US Navy shows a widening and thinning area of broken ice near the North Pole, one that displays much greater losses than those seen earlier in the month. A band of open or nearly open water has now emerged just on the Russian side of the 180 degree East line. As you can see, model forecasts show this area of open water continuing to widen over this coming week.
Meanwhile, some of the thickest sea ice is also showing the corrosive impacts of these ongoing storms. In the image above, you can clearly see the invasion of ice thinner than 2 meters where 2.5, 3, and 3.5 meter ice previously dominated. In fact, in later sequences, it appears that a knife of much thinner ice begins to drive down through the relatively small pack of remaining thick ice.
The Central Arctic is extraordinarily cloudy today. So it is not possible to verify these Navy observations with visual shots. That said, the Navy projections have been both consistent and confirmed in the other monitors since early-to-mid June.
****
Any one of these extreme weather events — a heatwave in Arctic Europe, immense floods never before seen in Canada, and an anomalous storm coring through the thickest sea ice — would be evidence that human caused climate change has radically altered the weather. Instead, we have all three occurring over the span of as many days. It is a pace of extreme events that is both troubling and astounding. And each has been affected by the sea ice loss, ocean, ice sheet, and atmospheric warming, loss of summer snow cover, and extreme changes to the circum-polar Jet Stream brought about by human caused climate change.
We are in the age of extreme weather brought on by our fossil fuel use. If we are to have any hope of preventing the very worst impacts, we need to drastically begin reducing CO2 and related greenhouse gas emissions as soon as possible.
Today, fires raging in the region of West Fork, Colorado exploded through a forest full of pine-beetle ravaged trees, swelled as 50 mph wind gusts fanned the flames, and joined into an immense blaze covering nearly 60,000 acres. The fire swept through miles of drought-ravaged forest at a pace that firefighters described as nearly unprecedented casting thick smoke over a broad swath of Colorado. A murky haze spread out from the blaze, enveloping regions up to 100 miles away, causing cars to use their headlights during daytime.
Under immediate threat from the encircling blazes, the entire town of South Fork was evacuated forcing about 1,000 to flee the area. As of yet, no buildings have been damaged. Highway 160 was also closed due to the encroaching fire.
The West Fork Fire is now the second major forest fire to threaten Colorado this month. Earlier, the Black Forest Fire devoured nearly 400 homes becoming the costliest fire in Colorado history.
A global-warming intensified drought has plagued Colorado since spring of last year. With many areas experiencing near-record dryness, risk of fires is likely to remain high throughout the summer. Currently, more than 44% of the United States is still experiencing drought after more than one year of continuously dry conditions have ravaged much of the US Southwest.
As human caused climate change intensifies, Colorado is expected to see the frequency of wildfires more than double. So, unfortunately, what we are seeing is just the beginning. A rapid mitigation via drastically reducing human greenhouse gas emissions can help to reduce the degree of future harm. Unfortunately, Colorado is probably in for at least some worsening conditions even if the most responsible path toward lowering our contribution to atmospheric carbon is taken.
(Fires Flare in Central Siberia As Temperatures Near 90 Degrees. Image source: Lance-Modis)
Today, a heatwave circling the Arctic set its sights on central Siberia. Temperatures soared into the upper 80s to near 90 degrees (Fahrenheit) over a vast region of Siberian tundra, setting off pop-corn thunderstorms and sparking large, ominous fires reminiscent of the blazes that roared through this region during late June of 2012. Those fires were so large they sent a plume of smoke over the Pacific Ocean and blanketed valleys in western Canada.
Each individual fire in the above image hosts a plume of smoke about a hundred miles long. The fire to the far left, hosts a very long smoke plume of at least 350 miles in length.
You can see these soaring Siberian temperatures and related fires on the Arctic weather map below. Note the instances of 32 degrees Celsius temperatures (which is 89.6 degrees on the Fahrenheit scale).
If you look to the right side of the above map, you’ll see a large swath of pink spanning the Arctic from Norway all the way to the Pacific coastal region of Siberia. The most intense heat is located directly in the center of this zone where sporadic readings of 90 degree temperatures start to pop up. Fires are also shown on this weather map, indicated by a vertical black bar with a squiggly black line at the top.
Heatwave conditions also appear to have re-flared in Scandinavia where numerous instances of 80 degree + weather appear.
Alaska is in its ‘cool night-time’ phase. But even now, some locations in the interior are showing ‘lows’ of 70 degrees — which is hotter than usual highs for this time of year in that region.
Looking at the Jet Stream map for today, we see three anomalous pulses rising up over each of these regions.
The Siberian pulse rises just to the edge of the Arctic Ocean. The Scandinavian pulse hits the top of Norway and Sweden. Meanwhile, the Alaskan pulse rides all the way up into the Beaufort and Chukchi Seas.
Jet Stream waves should not penetrate so far into the Arctic. It is a situation facilitated both by eroding sea ice and by loss of snow cover during spring and summer. As of May, both sea ice volume and Northern Hemisphere snow cover were the third lowest on record. Back in September of 2012, Arctic sea ice hit a record low volume that was 80% below levels seen in the early 1980s.
This mangling of the Jet Stream has also been implicated in a number of severe weather events (spawned by blocking patterns associated with large waves in the Jet Stream) including the extreme European Winter and Spring of 2013, the US Drought of 2012-2013, Hurricane Sandy, and, now, various heat-waves striking the Arctic.
Sea ice break-up, characterized both by melt and off-shore movement of surface ice, has now occurred off Barrow, Alaska. The event usually happens around July 8th. Since break-up was confirmed by visual yesterday, we are about three weeks early. If you want to see the video of off-shore ice breakup and movement, you can view it here.
Satellite images provided by Lance-Modis shows break-up and off shore ice motion between the days of June 19 and June 20.
Here’s the image of Barrow just as sea ice is starting to break up on June 19th. Barrow is located on the point of land near the lower left-hand portion of the image. Now, note how open water expands as ice shifts away in the second image below:
This early ice break-up off Barrow came in conjunction with a powerful Alaskan heatwave that sent temperatures in some places to the high 90s. Barrow didn’t experience the same extremes of temperature, but it did see highs in the 50s and 60s on some days. When temperatures usually hit highs around 39 degrees during this time of year, consistent highs in the mid 40s to the mid 60s is a heat-wave. And that’s what we’ve seen for more than a week now. Today’s high for Barrow is supposed to top off at around 50 degrees.
Barrow may soon see ice-free seas as a rapidly expanding melt front advances through the Chukchi and into the Beaufort Sea over the coming days. This region of melt hosts much higher than above average water temperatures that were likely fueled by the recent Alaskan heatwave which pumped air temperatures in Prince William Sound above 90 degrees. A pulse of warmer water feeding from Alaska’s estuaries and into this growing body of ice free area is likely fueling above average water temperatures.
Expect a large area from Barrow to Wrangle Island to be vulnerable to rapid melt as this front of warmer ocean water advances northward. The image above shows this region of open water advancing along the north coast of Alaska and into a region of the Beaufort and Chukchi Seas off shore on June 21rst.
Well, it’s official. PAC 2013 has yet to give up the ghost. After transitioning to the Canadian Archipelago, it has now formed a trough composing three low pressure centers that roughly straddles Greenland, Baffin Bay, and the thickest sea ice. At this point, the storm is nearly one month old (with a formation date around May 21-26). Lowest pressures appear to be around 990 mb, but the entire region is covered in rough weather and clouds.
A look at the heat map shows the storm pulling in warmer air from the Alaskan side of the Arctic and from regions around it. This extra energy has given it enough to fuel multiple lows for an extended period. As a by-product, many regions over the Central Arctic are now above freezing. Areas near the low pressure centers still show temperatures in the range of 0 to -3 Celsius. But a broad swath of above-freezing temperatures are now under the circulation of this, rather large, storm.
On the map, we also notice areas of high heat concentration centered over Scandinavia, Central Siberia, Alaska, and just West of Hudson Bay. These regions of heat are both potential launching pads for more warm air invasions of the Arctic as well as feeding sources for our storm, should it continue.
And, according to forecasts, we can find that this storm isn’t done by a long-shot. ECMWF model runs show it forming troughs with numerous low pressure cells and chewing through large portions of the Arctic all the way through to July 1. Seems we were right to caution against an end to PAC 2013 in this earlier blog.
A very interesting example is the ECMWF forecast for June 27th when PAC 2013 forms a sprawling trough from the East Siberian Sea to Baffin Bay to Greenland to the Kara. It is a trough composed of not one, not two, but at least six separate low pressure cells. The forecast for tomorrow through much of the model run shows similar configurations with daisy chains of storms linked by a trough swirling along through the Arctic.
These model runs would seem to indication very stormy conditions not only for the Central Arctic, but for the periphery as well.
The ‘Warm’ Arctic Storm Begins to Emerge?
With temperatures rising to above freezing in the Central Arctic Basin and with storms projected to persist at least until July 1rst, we may receive an unwelcome glimpse of the ‘Warm’ Storm described here. Previously, I had speculated that ‘Warm’ Storm conditions would be present with moderate-to-strong cyclones persisting in the Central Arctic at a time when air temperatures ranged from 0 to 6 degrees Celsius. As we can see from the temperature map at the top of the post, we are not far off from that threshold now. And with heatwaves popping up around the Arctic there is more than enough warmth to push Central Arctic temperatures higher over the coming days and weeks.
Over at the Arctic Ice Blog (read it, join it, follow it, chat on it — you will learn boatloads), expert posters Wayne and R. Gates have noted that while clouds block direct sunlight, they can act to trap long-wave radiation. R. Gates had also linked a recent scientific study which showed that cloudy conditions from March to May enhanced rather than inhibited melt. The energy of this long-wave radiation would transfer directly to ice and ocean, so atmospheric temperatures would not be directly impacted. But more heat content in the waters and ice, overall, might be providing some of the extra kick that ECMWF appears to have missed. Another recent study by Edward Hanna found that low level clouds helped to increase the record Greenland ice sheet melt of 2012 (study here) by trapping heat near the ice. So the overall effect of clouds in cooling is less certain than one would think at first blush.
Another source of this extra heat may be via the ocean itself. As noted in previous posts, cyclonic action creates a kind of pumping force (Ekman), that can pull water up from the ocean’s depths. In the Arctic, the surface layer is cold. But underneath lies a layer of warm water fueled by the inflow from oceans surrounding the Arctic (primarily the Atlantic). As commenter Johnm33 noted, once a strong inflow of upwelling water is established, it is possible that yet more warm water is being drawn into the deep Arctic Ocean from the Atlantic. If this warmer inflow was pumped to the surface, it would add to atmospheric heat beneath the storm.
Lastly, the atmosphere, via high amplitude waves in the Jet Stream is now also providing its own source of heat by dredging deep into the lower latitudes and pulling warmer air up into the Arctic. So far this summer, we have seen record heat waves in both Scandinavia and Alaska. These heat waves were caused by persistent blocking patterns that injected heat into these Arctic locations. Scandinavia saw temperatures in the 80s, Alaska saw temperatures rocketing into the upper 90s. The Jet Stream configuration allowing for these hot air injections at these locations still persists and are plainly visible on the current Jet Stream map:
Note the large wave in the Jet Stream (and associated warmer air) now riding up over Alaska and deep into the Beaufort, Chukchi, and East Siberian Seas. Another pulse is visible lunging up through Scandinavia. A third, though less southwardly linked, pulse is also now rising over Eastern Siberia. These extraordinarily high amplitude waves all cross far beyond the Arctic Circle. An atmospheric condition that is anything but normal and one that is also continuing to supply warmer air to the Arctic environment, even one covered by a storm that would normally substantially cool the atmosphere there (for more information on how snow and ice melt in the Arctic is enabling these high amplitude Jet Stream waves, take a look at some of the work of Dr Jennifer Francis). Instead, as the discrepancy with ECMWF predictions and surface observations shows, we have temperatures that are only .5 to 1 degree C cooler than average under the storm (they should be about 3-7 C cooler) and much, much warmer conditions surrounding it.
A Warm Storm persisting in the Central Arctic for long periods is a potential nightmare scenario for sea ice melt. Currently, we have warming conditions in the Central Arctic, a spate of record heat-waves at the periphery in places like Alaska and Scandinavia, a mangled Jet Stream that keeps pumping warmer air into the Arctic, and a storm that is now projected to persist until at least July 1rst. So we now have to consider at least the temporary emergence of the Warm Storm to be a possibility going forward.
Impacts to Sea Ice Still Ongoing, Likely to Ramp Up
A substantial thinning and chopping up of the sea ice is now apparent in all visible (when you can see through the clouds), concentration, and thickness monitors. Now, a wasteland of thinned, shattered and broken ice is visible in a swath from Svalbard all the way to Wrangle Island near the Bering Strait. A comprehensive graphic summary of these impacts is provided below:
The current image, provided by the US Navy is a stark contrast to conditions seen at the end of May. This thickness measure shows a long ‘claw’ of much thinner ice reaching all the way in to the Central Arctic and encompassing the North Pole. This graphic reveals very poor Central Ice thickness conditions for mid-to-late June.
Uni-Bremen has been providing consistent confirmation of ice damage and fragmentation due to the Ongoing Arctic Storm for nearly two weeks now. Here’s the most recent concentration monitor showing the broad swath of broken ice.
And Cryosphere Today, which is less sensitive than the other monitors shows low ice concentrations stretching from Svalbard to Wrangle Island.
Overall, should PAC 2013 continue to warm even as it persists, it should have ever-greater deleterious effects on the Central Arctic sea ice as mid-to-late June transitions into July. The US Navy thickness forecast shows ongoing thinning and fracturing in this region all the way through June 28th. One interesting feature of note in this forecast is that it appears a substantial section of ice will be separated from the main pack and stranded in the Kara Sea if current trends continue through early July.
So, apparently against all odds, PAC 2013 continues and, even worse, shows risk of beginning a transition to a ‘Warm’ Storm in the Central Arctic. Should this trend remain in effect, increasingly visible damage to the central ice is likely to become ever more apparent as June turns to July.
According to reports from the National Climate Data Center, May 2013 was the third hottest May in the climate record. May 2013’s average temperature was .66 degrees Celsius above the 20th Century average, tying values for May of 2005 and 1998.
Though the Eastern Pacific edged closer to La Nina conditions, this cooling of waters off South America did little to abate near record warmth. Overall ocean temperatures were 5th hottest on record with very high temperatures remaining over much of the Tropical Atlantic and likely providing fuel for the two storms that have already developed in June: Andrea and Barry. Normally, June only hosts one storm every two years. However, in recent years, the number of tropical systems during June has markedly increased, leading some meteorologists to speculate that the Hurricane Season is getting longer.
According to observations from Dr. Jeff Masters at WeatherUnderground, Northern Hemisphere snow cover was also 3rd lowest on record whiles sea ice volume remained in record low territory at 3rd lowest as well. Combined lower sea ice and snow cover, according to Dr. Jennifer Francis of Rutgers University, results in a lessening of the difference in temperatures between the equator and the tropics which can push the Jet Stream into extreme configurations. As I’ve reported over the past month, a number of blocking patterns in the Jet Stream have resulted in periods of severe weather over a number of regions.
According to Dr. Masters:
An extreme jet stream configuration was responsible for the record $22 billion floods in Central Europe in late May and early June, and it is possible that the unusually low May Northern Hemisphere snow cover contributed to the unusual jet stream behavior.
Overall, WeatherUnderground notes 5 major weather disasters during May which exceeded 1 billion dollars in damage, and one, the European Floods, which totaled 22 billion in overall losses. They included:
1) Floods in Central Europe, May – June, $22 billion
2) Drought, Brazil, 1/1 – 5/31, $8.3 billion
3) Tornado in Moore, OK and associated U.S. severe weather, 5/18 – 5/22, $5 billion
4) Tornadoes and severe weather, U.S., 5/26 – 6/2, $2 billion
5) Drought, New Zealand, 1/1 – 5/10, $1.6 billion
Masters does not, however, include the ongoing US drought of 2012-2013 which has already resulted in tens of billions of dollars in damages.
Overall, the 22 billion dollar European flood of 2013 ranked as the 5th most damaging weather disaster outside the US since 1980.
According to NCDC, the period of January to May of 2013 was the 8th hottest on record. With La Nina remaining on the cool side of neutral, natural variability will tend to push 2013 to remain a non-record year. The wild-card, however, is quite a lot of heat that seems to be building up at the Earth’s polar regions. But we’ll have to wait until end of summer to see if this develops into a serious challenge to the El Nino, La Nina base-line.
Over the past year, we’ve now experienced three major heatwaves north of the Arctic Circle. Greenland melted under a freakish blanket of heat-trapping clouds, Scandinavia saw an early June heatwave that sent temperatures into the 80s, 30 to 40 degrees hotter than normal, and just this week Alaska experienced record heat that sent temperatures there into the upper 90s, probably the hottest temperatures ever recorded there.
Now, a combination of new research reveals changes to the Jet Stream that enable warm air to enter the Arctic even as a thickening atmosphere sets in place conditions where powerful ‘heat domes’ are more likely to form.
Unprecedented Heat, Melt In Greenland
Our story begins in Greenland during July of 2012. At that time, a powerful blocking pattern enabled a strong high pressure system to form over that frozen land. An upward swing in the jet stream pumped ever-warmer air over its vast ice sheets. Finally, record temperatures were reached both along the coast-line and even at the center of its three kilometer high glaciers. Temperatures in the Greenland interior rocketed to 60 degrees.
Within only a few days, almost the entire ice sheet was experiencing some kind of melt. A record 90% of the ice sheet succumbed, far out-pacing the previous record of 52 percent set just two years before in 2010.
Draped over top of this melt was a freakish layer of low clouds. Clouds are, generally, thought to block heat from the sun. But, in this case, it appeared the clouds had locked heat in, recirculating it and keeping it close to the ice, forming a heat-trapping blanket over Greenland.
Far above this low cloud layer, the atmosphere was growing ever thicker. A towering high pressure system known as a heat dome was sucking in the warmer air from around and beneath it, trapping it in a denser and denser layer. From the south, a long-period, very persistent blocking pattern fed warmer, moister air into this heat dome. Meanwhile, the sea ice, which had tended to insulate Greenland from direct assaults of heat in the past, had retreated far behind its usual summer lines of defense.
As a result, Greenland baked.
In the media, contrarians did their best to down-play what was clearly a catastrophic event. They retreated to their usual ‘natural variability’ claims. But the closest event bearing any similarity to the 2012 event happened in the 19th Century and it didn’t occur at the end of a long string of worsening melt. Context formed a mire which contrarians were having ever-greater difficulties extracting themselves from.
The Scandinavian Heat Wave
But context was coming back to haunt us yet again as June 2013 rolled around. This time, another blocking pattern had emerged — creating a strange whirl in the Jet Stream. The path of atmospheric current followed a course much like a river bends through a marsh. It coiled, snake-like, bending back on itself, forming cut off circles.
This punch of colder air extended from Greenland all the way into central Europe. This extrusion of Arctic atmosphere resulted in one of the most extreme winter/spring periods Europe has ever experienced. Record snows were followed by record floods. By June, some water gauges on Europe’s largest rivers recorded the highest levels since the 1500s. It was the third 1,000 year flood to occur within the last 13 years.
But the colder, stormier air didn’t penetrate any deeper than Eastern Europe. There, it doubled back on itself, heading up and back into the North Atlantic. In front of this coil of air, this blocking pattern that had persisted over Europe since winter, rose a burst of heat. This pulse flowed into Scandinavia where it stagnated. Heat pooled in this region and, in a few days, records were being shattered across such improbable Arctic regions as Finland. 80 degree temperatures reigned in a region that usually experienced 40 degree weather this time of year.
In about a week, the Scandinavian Heat Wave had backed off, but temperatures remained well above average into mid-June.
The Alaskan Heat Wave
But heat was, again, about to re-emerge just two weeks later in another improbable region of the Arctic.
This time, a blocking high pressure system that had created a high amplitude wave in the Jet Stream over the Pacific Ocean just south of Alaska and west of British Columbia was about to preform an exotic trick. Alaska, resting just north of this blocking ridge had lain beneath a front of cold air for much of May. So while areas of California, Nevada, Arizona, Washington, Oregon, and British Columbia were experiencing abnormally warm conditions, Alaska experienced temperatures that had plunged into record low territory for many cities.
Contrarians proclaimed the end of global warming for Alaska. But the heat was coming and they only had to wait one month. By June, the blocking pattern which had kept cold air to the north and warmer air to the south began to edge into Alaska. Temperatures flipped from the 20s to the 70s for many regions. Barrow, which had experienced a warmer than average winter and spring, saw temperatures rise into what, for it, was the balmy 40s.
But this pulse of warmer than average air wasn’t finished. The current of Jet Stream cut off, giving this warm high pressure system an encapsulating band of winds. Conditions were now right for the formation of another heat dome. And form it did. By Monday of this week, temperatures had rocketed to 98 degrees in some places of the Alaska interior, possibly breaking the all-time record high for the hottest temperature ever recorded, at any time, in Alaska.
Today, temperatures for Barrow, one of the coldest cities on Earth, are projected to hit 70 degrees, about 31 degrees above the average high for this time of year.
Greenland, Scandinavia, Alaska, three record heat waves above the Arctic Circle all in the last year. What in the world had happened to the weather?
Enter the Experts…
A number of climate scientists and meteorologists have begun to grapple with the new, unstable regime of weather gripping the Arctic. These include Dr. Jennifer Francis of Rutgers University, Stu Ostro of The Weather Channel, and Dr. Edward Hanna of the University of Sheffield.
Dr. Francis, last year, provided compelling scientific evidence that the erosion of Arctic sea ice and the rapid melt of Northern Hemisphere snow cover during the summer time resulted in changes to the Jet Stream. This erosion of sea ice and land snow resulted in less of the Arctic’s cold air being trapped within the Arctic. It also resulted in more floods of warmer air coming up from the south. This north-south motion of air masses had the net effect of reducing the temperature difference between the Arctic and the mid-lattitudes. As a result, the river of air surrounding the pole known as the Jet Stream began to slow down, forming large dips and bulges.
As these dips formed and the air slowed, the Jet Stream had more of a tendency to become stuck. This sticking in place created ‘blocking patterns’ in which a given set of weather was more likely to persist over long periods of time. Recent examples of these blocking patterns and their related weather include Europe’s extreme winter and spring of 2012-2013 and the 2012 US Heatwave and related 2012-2013 drought. Further, without the collision of Arctic and Tropical air masses enabled by a massive dip and up-swing in the polar Jet Stream near the US East Coast, it is doubtful that the Hybrid Superstom Sandy would have ever formed.
Dr. Francis notes an increased frequency of such extreme, blocking pattern spawned, events and the picture she paints provides us with a much better understanding of how climate change is impacting our weather.
Recently, Dr. Francis spoke on the subject of climate change in an event entitled “The Alarming Science Behind Climate Change’s Increasingly Wild Weather” with the weather Channel’s Stu Ostro. Stu brings a different yet complimentary set of knowledge to the new observations presented by Dr. Francis. Over the past couple of decades, Stu has noted what appears to be a ‘thickening’ of the atmosphere. He equates it to a cake batter which, when heated, tends to rise. This rising atmosphere, according to Stu, has led to the formation of powerful, persistent high pressure systems. As Stu noted in a recent article in Mother Jones:
“The frequency of these really strong ridges of high pressure aloft, these anomalous high pressures aloft are increasing.”
And the result is some rather alarming consequences.
A recent paper headed by Dr. Edward Hanna at the University of Sheffield implicates both the mangled Jet Stream and a powerfully thickened high pressure system in the record 2012 melt in Greenland. According to the paper:
Our analysis allows us to assess the relative contributions of these two key influences to both the extreme melt event and ongoing climate change. In 2012, as in recent warm summers since 2007, a blocking high pressure feature, associated with negative NAO conditions, was present in the mid-troposphere over Greenland for much of the summer. This circulation pattern advected relatively warm southerly winds over the western flank of the ice sheet, forming a ‘heat dome’ over Greenland that led to the widespread surface melting.
Dr. Hanna’s paper pointed out the movement of warmer air over Greenland via a strong blocking pattern in the Jet Stream and the building up of a powerful ‘heat dome’ and blocking high pressure system over the ice sheets. Hanna also added the contribution that lower level clouds enhanced, rather than inhibited, melt.
Together, this research points toward how receding sea ice and a warming climate are setting in place conditions that are causing these Arctic heat waves. And the recent heatwaves in Greenland, Scandinavia, and Alaska provide excellent illustrations of the kind of events we can expect with greater frequency in the future.
As the world hit a new and ominous CO2 record of 400 parts per million and rising, just one milestone on the road toward ever greater harm from damage via human-caused greenhouse gas emissions, another record was quietly reached. At the Mauna Loa Observatory, world-wide methane levels hit a new record average of 1830 parts per billion in April of 2013 even as they continued to ramp higher.
The new record follows a short-term rise in atmospheric methane that began in 2007 and has continued to this day. It also caps a long-term rise in methane that began at the start of the industrial revolution and, through a long ramp-up, has resulted in atmospheric methane levels rising from about 750 parts per billion to the record high level of 1830 parts per billion today.
You can view this long-term rise in atmospheric methane in the second chart, provided by NASA, below. Note that atmospheric levels given are only updated through 2008, just at the start of the most recent jump in atmospheric methane concentrations:
This ramping up of atmospheric methane that began in 1750 and has continued to this day has, so far, been mostly caused by humans. Primary sources for human methane emissions include landfills, coal mining, leaks from oil and gas infrastructure, and the digestive generation of methane in the guts of livestock animals such as cattle. An explosion in the volume of methane coming from these sources pushed world methane levels about 1080 parts per billion higher over the last 250 years.
This increase has had a powerful impact on global warming caused by humans. It is estimated that, at current concentrations, methane’s contribution to global warming is about 28% that of CO2. The reason for this, even though atmospheric levels for methane are more than 200 times lower than CO2, is that methane is at least 25 times as potent a heat absorber by volume (and as much as 105 times during the short term). What this means is that atmospheric methane increases are a huge contributor to climate change.
Now, I want to stop here before going any further. And the reason is that some oil industry cheer leaders have made the false argument that reducing human methane emissions is more important to mitigating the impact of climate change than reducing CO2 levels. The short answer to this false claim is that they’re both important and there’s no way to address human climate change without reducing both CO2 and methane emissions. And, since there’s at least 500 parts per million worth of CO2 in the remaining fossil fuel reserves, for us to maintain much hope of a livable future climate will necessitate that most of these fuels remain unburned or that the carbon from these fuels is captured and permanently sequestered.
Human-caused warming results in increasing methane release from Earth’s environment
Unfortunately, humans are no longer the only contributor to rising levels of atmospheric methane. New research being conducted by NSIDC, NASA, and a number of scientists around the world show that organic material stored in the world’s permafrost and methane clathrates at the bottom of the ocean are showing signs of stirring.
Permafrost is a region of frozen soil that dominates large sections of the Northern Hemisphere and the entire continent of Antarctica. This image, provided as part of NASA’s CARVE research project, shows the Northern Hemisphere’s permafrost zones.
As humans have driven the climate to warm, larger and larger sections of the northern permafrost have been subject to thaw. As the permafrost thaws, it opens organic material, sequestered for tens of thousands of years, to decay. If the region where the permafrost melts is predominantly wet, the organic material breaks down into methane. If the region is primarily dry, carbon dioxide is produced.
The volume of organic material locked in permafrost is massive. In fact, NSIDC shows that there are about 1,400 gigatons of carbon locked up in the world’s permafrost. This is nearly twice the volume of all the carbon currently contained in the atmosphere. For even a small fraction of this carbon to be released via human warming would have dramatic consequences. And, since many regions in the Arctic are predominantly wet, a large portion of any future release is likely to be methane.
Already, research is beginning to indicate that carbon stores in the Arctic are being set free by human-caused warming. In NASA’s most recent press release describing its CARVE research mission, entitled “Is a Sleeping Giant Stirring in the Arctic,” NASA scientists were said to have found large methane emission sources comparable to major cities.
“Some of the methane and carbon dioxide concentrations we’ve measured have been large, and we’re seeing very different patterns from what models suggest,” Charles Miller, of NASA’s Jet Propulsion Laboratory, said. “We saw large, regional-scale episodic bursts of higher-than-normal carbon dioxide and methane in interior Alaska and across the North Slope during the spring thaw, and they lasted until after the fall refreeze. To cite another example, in July 2012 we saw methane levels over swamps in the Innoko Wilderness that were 650 parts per billion higher than normal background levels. That’s similar to what you might find in a large city.”
If methane emissions from the Arctic permafrost via human-caused warming are beginning to rival those of major human sources, then we could be in for some rather serious trouble. CARVE’s mission is to find out if such a threat is emerging. Early observations are, as one NASA researcher put it, “both amazing and potentially troubling.”
The Clathrate Gun
Potentially even more troubling is the possibility that seabed methane stores locked in ice, known as clathrates, may also be starting to destabilize.
Worldwide, there is estimated to be between 1,600 and 2,000 gigatons of carbon locked in clathrates (or methane hydrates) on the bottom of the ocean. This is a massive store of carbon is at least two times the amount currently in the atmosphere. As with permafrost, if even a small amount of this methane reached the atmosphere, it would have powerful global warming impacts.
The problem is that human warming, via CO2 and other greenhouse gas emissions, is currently causing the world’s oceans to heat up. In fact, the oceans are accumulating heat faster than expected. You can see the pace of this increasing heat content in the graph below:
And since clathrates are ice structures that are only stable in a narrow range of temperatures, any warming of the oceans, especially the deep oceans where clathrates are primarily stored, results in risk that the clathrates will melt, releasing their methane.
Unfortunately, we have emerging evidence showing that sea-bed clathrates are starting to destabilize. One set of evidence, produced by Shakhova, began to emerge in 2007. Shakhova’s study: Methane Release and Coastal Environment in The East Siberian Arctic Shelf illustrated how sea-bed methane in the region of the East Siberian Sea was venting into the ocean and even up through the thawing permafrost. A later survey of sea-bed methane releases, also conducted by Shakhova, found stunning one kilometer wide plumes of methane bubbling up from the ocean in the region of the East Siberian Arctic Shelf. In thhe report, published in The Independent, Igor Semiletov, Shakhova’s co-author, noted:
Earlier we found torch-like structures like this but they were only tens of metres in diameter. This is the first time that we’ve found continuous, powerful and impressive seeping structures more than 1,000 metres in diameter. It’s amazing,” Dr Semiletov said.
“I was most impressed by the sheer scale and the high density of the plumes. Over a relatively small area we found more than 100, but over a wider area there should be thousands of them,” he said.
Another study, this one conducted off the US East Coast, found that methane depositions on the Continental Shelf were also starting to destabilize. The study, published in Nature, showed that changes in the Gulf Stream and an unusual level of warming off the eastern seaboard of the United States was destabilizing a 10,000 square kilometer region rich in sea-bed methane. The study warned:
A changing Gulf Stream has the potential to thaw and convert hundreds of gigatonnes of frozen methane hydrate trapped below the sea floor into methane gas, increasing the risk of slope failure and methane release…
Evidence of Growing Trouble
Though not yet conclusive, the current permafrost studies by NASA and others combine with growing scientific evidence of sea-bed methane destabilization to provide a rather stark warning. Human warming via greenhouse gas emissions is beginning to push Earth to release some of her carbon stocks. These stocks, contained in tundra and sea-bed methane, are now showing signs of disturbance and are visibly starting to contribute to atmospheric carbon. It is worth noting that tipping points may be fast approaching and could run away from us rather rapidly.
As such, all efforts should be made to reduce worldwide human CO2 and methane emissions as rapidly as possible. Over the past 250 years, humans have contributed a large and growing forcing to the world’s climate. Now, emissions have grown to vast and dangerous levels even as Earth’s systems are reaching their carbon storage limits. Major feedbacks and threatening changes are likely in store if we don’t dramatically draw down emissions soon.
Evidence of methane coming from the Earth system should, therefore, serve as a warning, one we would well be wise to heed.
Yesterday, temperatures in Prince William Sound hit upwards of 93 degrees. Communities there, including Valdez and Cordova, both set new record highs. Talkeetna hit 94 degrees, also an all-time record high for the date. Meanwhile, Seward hit a new record of 88 degrees Fahrenheit. Temperatures in the interior rose to between the mid 80s and lower 90s.
This pulse of heat was driven by a persistent bulge in the Jet Stream over the Pacific Ocean, the Western United States, and the Pacific Northwest that has been present since mid winter. The bulge has resulted in warmer than normal temperatures and drier conditions for much of the Western US while keeping temperatures warm for western Canada and Alaska. It is a blocking pattern implicated in the ongoing drought conditions in places from Colorado to Nevada and California. A pattern which sees 44% of the US still locked in drought.
Sunday and Monday, this blocking pattern enabled warm air to flood north into Alaska, setting off a record heatwave there. You may not think of 50 and 60 degree temperatures in Barrow, Alaska as a heatwave. But when average highs for June there are about 38 degrees, 50 and 60 degree weather is quite hot for this time of year.
Last Thursday saw temperatures in Barrow above 60 degrees. Today, so far, temperatures have risen to 52 degrees, though the high will probably not be reached for a few hours yet.
All this warmth is doing a number on sea ice in the region. As I posted yesterday, large, dark melt ponds and holes in the ice are now visible off Barrow. You can see them in the most recent Barrow Ice Cam shot below:
Note the near-shore melt as well as the large, dark holes forming and widening off-shore.
The pulse of warm air riding up into Alaska is common to a warmer air mass now pervading much of this region of the Arctic. As a result, above freezing temperatures have now invaded large sections of the Beaufort, Chukchi, and East Siberian Seas. This warmer air is causing melt ponds to form over the region leaving their tell-tale bluish tint in the satellite pictures.
In the above image you can see this bluish tint covering about half of the Arctic Ocean area represented in the picture. Also note the large and rapidly expanding area of open water north of the Bering Strait and the large and expanding cracks over the East Siberian Arctic Shelf.
Ice of this color indicates a speckling of melt ponds and hints at the ongoing impacts of solar insolation on the sea ice. Warm conditions in this region have favored insolation for at least the past week. And persistent warmer, clearer weather is beginning to enable the sun to do some serious work on the sea ice.
Warmth is expected to continue for this area until at least next week. The latest long-range forecast from ECMWF shows above-freezing and even 50 degree temperatures plunging deep into this region of the Arctic all the way through late June.
By June 28th we have 40 degree average temperatures extending far off-shore with above freezing temperatures covering much of this section of the Arctic. Melt in this region, therefore, is likely to be greatly enhanced as the sun is provided with an extended period during which to do its work.
Today, the center of 2013’s Persistent Arctic Cyclone of May and June transitioned to Baffin Bay and the Canadian Archipelago. Forecast models show the storm lingering there over the next 24 hours, then briefly redeveloping in the Central Arctic on Thursday and Friday before finally transitioning on out of Baffin Bay by Sunday. If this forecast holds true, a storm that developed in late May and persisted to fracture and melt a broad swath of sea ice from Svalbard to the East Siberian Sea, will finally be done.
(PAC 2013 over the Canadian Archipelago and North Baffin Bay on June 18. Image source: DMI)
The storm’s legacy, should it transition away from the Central Arctic as forecast, will likely leave impacts throughout this summer and beyond. The large area of fragmented and thinned ice left in the wake of PAC 2013 is more vulnerable to melt as June, July, and August progress. And a controversy among scientists, researchers, and Arctic and climate enthusiasts over if and how much PAC impacted the 2013 melt season is also likely to ensue, perhaps lasting for years after this melt season.
Already, a number of excellent blog posts on the subject of PAC 2013 have been published. Two that are certainly worth reading appear over at the Arctic Ice Blog and on FishOutofWater’s Daily Kos page. At the center of this controversy will likely be the issue of whether or not PAC 2013 enhanced or impeded melt. An issue arising from the new possibility that human warming enables summer storms to melt and thin Arctic sea ice.
This new possibility emerged in the wake of the Great Arctic Cyclone of 2012, which is shown to have melted about 250,000 square kilometers of sea ice, contributing to, but not causing, the record melt seen in that year. 2013’s PAC is likely to prove even more controversial due to the fact that its primary action was to thin and fragment thicker ice during June, rather than blow large holes in already weakened ice during August.
Regardless, the discussion will probably be far-flung. Just one more aspect of our evolving understanding of a rapidly changing Arctic.
Not Quite Done Yet
PAC 2013 is not done quite yet, though. So here’s a basic assessment of its, likely, last days.
As noted above, PAC 2013 is expected to transition to Baffin Bay, then re-develop over the Central Arctic, before retracing its steps through the Canadian Archipelago and, finally, out of the Arctic. It will be very interesting to see what happens to the remaining Baffin Bay sea ice, which has been substantially thinned during the June melt and may now see impacts from this storm.
Here is the ECMWF model run for June 20th showing a 985 mb PAC about the eject itself from the Arctic:
It is also worth noting a very strong ‘warm side’ to this PAC persisting over Alaska and the Beaufort Sea. This particular region of warm weather has spawned some very hot temperatures over Alaska and resulted in a broad swath of melt lakes forming over the Beaufort, Chukchi, and East Siberian Seas. This particular warm air pulse has lasted for at least a week and may have consequences for mid-to-late June melt (I’ll be exploring this Alaskan Heatwave more in another blog).
PAC’s transitions over the thickest ice appear to be having impacts, which you can see in the US Navy’s CICE model runs below:
Note the substantial reductions and fragmentation in the large pack of thick ice just north of Greenland and the Canadian Archipelago even as the already fractured ice from Svalbard to the East Siberian Sea continues to thin and break.
It is also worth noting that the CICE/HYCOM model shows substantial impacts you would expect from a PAC continuing on until June 25. Whether this is indicative of a disagreement between US Navy and ECMWF models on the length of PAC duration or just a projection of after-effect is unclear.
To this final point, one caution. Though models now show the absence of PAC 2013 from June 22 on, this particular storm has shown a dogged resilience. Further, even after the ECMWF model shows PAC 2013’s exit, a number of smaller storms are shown to enter and leave the Central Arctic. So it’s not, as yet, a decisive end to stormy conditions there.
In May of 2011, worldwide CO2 levels hit a yearly maximum of 394 parts per million. At the most recent average rate of CO2 increase (about 2 parts per million each year), the world would have hit 400 parts per million by 2014. Instead, that number was reached 1 year sooner.
It was a faster rate of atmospheric carbon increase — about 3 parts per million rise each year — that resulted in the world rocketing to the new milestone sooner than expected.
Pace of Rise Accelerating
The pace of atmospheric CO2 increase, at the time measurements began in the late 1950s, was about 1 part per million each year. This pace of increase steadily rose to an average of 2 parts per million each year during the late 1990s. By the end of the first decade of the 21rst Century, average rates of increase were about 2.2 parts per million.
This accelerating pace of CO2 accumulation has been driven, largely, by a vast increase in the amount of CO2 released into the atmosphere. In the late 1950s, the world dumped about 8 gigatons of CO2 into the atmosphere each year. By 2012, that number had nearly quadrupled to 31.6 gigatons.
You’ll notice that though carbon emissions nearly quadrupled, the average pace of atmospheric carbon increases only slightly more than doubled. The reason for this is that as global emissions rose, the amount of carbon absorbed by the oceans and the land also dramatically increased. So both the oceans and land together continued to absorb about 50% of all the carbon our factories and automobiles spat out.
The remaining fraction still ended up in the atmosphere. And so we still saw a rapid increase in global CO2 levels. But not so rapid as we would have if carbon sinks weren’t helping us by drawing down half of the CO2 we were dumping.
Unfortunately, carbon sinks are a finite resource. As such, scientists expect them to eventually lag in their ability to uptake ever greater volumes of our greenhouse gas emissions. This is especially true with the oceans which a number of scientific reports show are starting to reach their saturation point.
“The uptake of carbon dioxide by the oceans and by ecosystems is expected to slow down gradually,” Tans [one of the report’s authors] said. Oceans, for example, are already becoming more acidic as they absorb about a quarter of the carbon dioxide pumped into the air by human activities. “As the oceans acidify, we know it becomes harder to stuff even more CO2 into the oceans,” Tans said. “We just don’t see a letup, globally, yet.”
In fact, a related research paper found that a large swath of the southern ocean, which absorbs 15% of the world’s CO2 emissions, had become completely saturated and could no longer absorb CO2 from the atmosphere.
A New, Very Dangerous Pace of Increase Going Forward?
So all this begs the question: are the world’s CO2 sinks starting to become exhausted?
A six parts per million CO2 increase over two years is a much more rapid rate than the world is used to. At such a rate, we reach 450 parts per million by 2030. And if the world’s carbon sinks are, indeed, starting to exhaust even as world CO2 emissions remain high or continue to climb, then we may see annual increases of 4 parts per million or more over the coming decades.
We won’t know if the 3 parts per million annual increase is established for a few years yet. But if it is, it is yet one more sign that the world is starting to reach a number of very dangerous tipping points and we should do our best to reduce the potential harm by as much as possible.

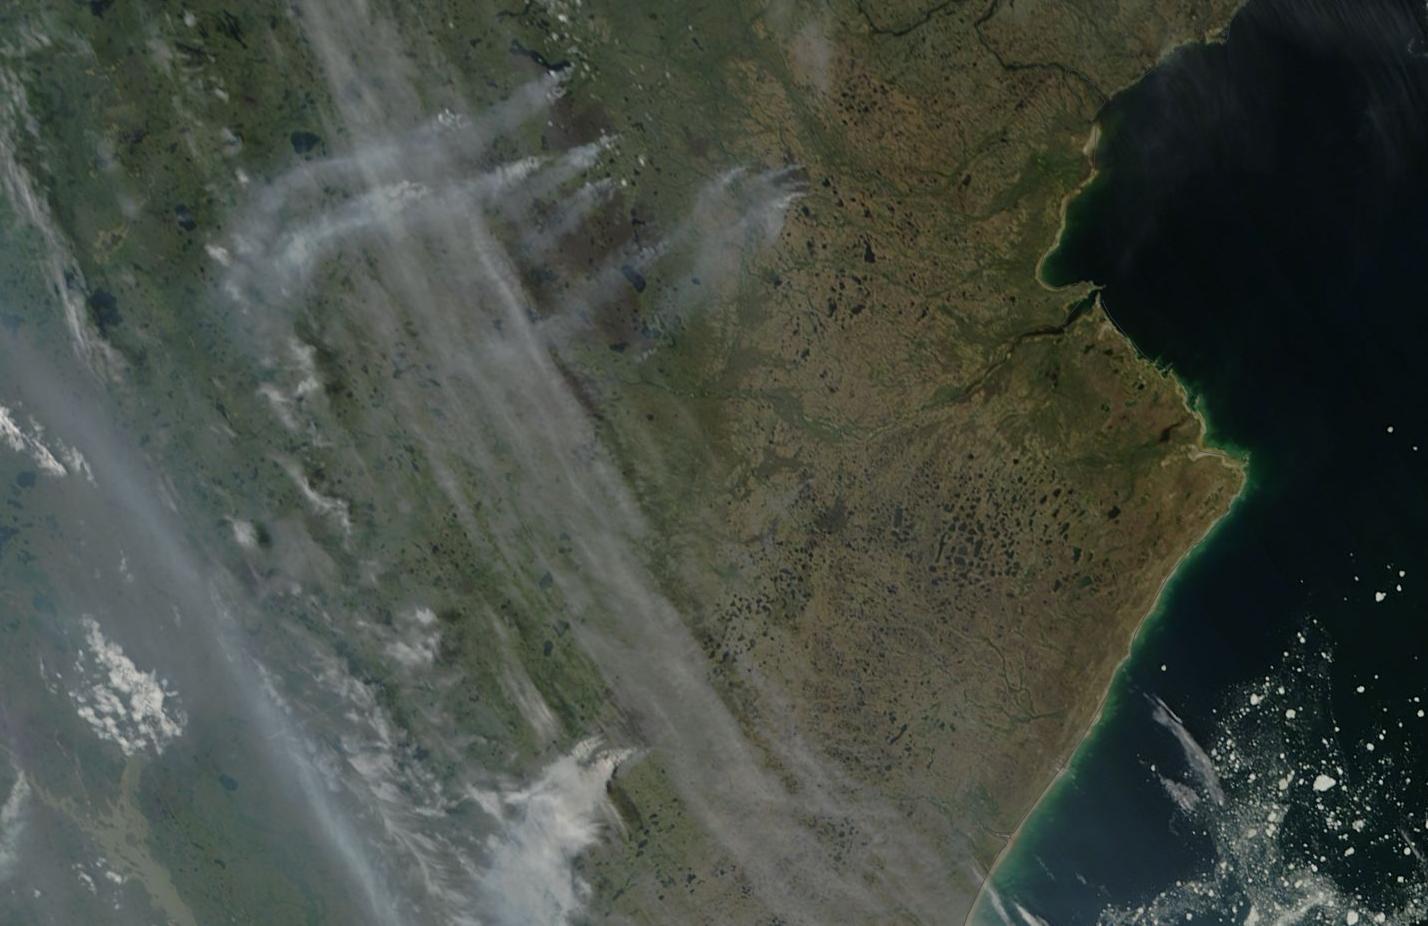


