Climate Change Induced Drought and Fire at Critical Stage in Chile — Construction of 12 Desalination Plants Underway

In the National Forests of Chile, it’s been burning since February.

An intense upshot of the stifling of water supplies through month after month of heat and lack of rainfall. A kind of intense onset, persistent drought that has become all too common in a world in which atmosphere, ice and ocean temperatures keep rocketing on to new record highs.

Starting February 17th, massive fires erupted, spreading swiftly through Chile’s forested mountainsides and valleys, threatening protected woods and endangered species. The fires have continued off and on now for more than a month — fueled by hot winds and a record drought that has forced the nation to build 12 desalination plants in a desperate effort to restore the country’s ebbing water supply.

Chile Fires February 17Chile Fires March 24

(Side by side frames of same region of Chile on February 17 [left frame] and March 24 [right frame]. For reference, bottom edge of frame is approximately 100 miles. Right frame is slightly off-set toward the east. Image source: Lance-Modis.)

Reports from BBC indicated that today’s fires are burning in three protected national parks: China Muerta National Reserve, Nalca Lolco National Reserve and Conguillio National Park. The fires threaten ancient growth forest that is the abode of the majestic Araucaria araucana trees. A kind of pine that can live up to a thousand years. Over 4,500 hectares are now burning and the smoke is plainly visible in the NASA satellite shot (right frame in the image sequence above). Fully fifteen fire brigades are involved in what is currently a massive firefighting effort.

Overall, the fires that have been raging for more than a month throughout Chile have consumed an exceptional 91,000 hectares — nearly double the 59,000 hectare per year average over the last five years. Years that themselves experienced increased heat, drought, and burning.

This extreme burning comes as Chile faces a ramping, multi-decadal water shortage set off by human warming. Climate scientists there have indicated a high risk of drastically increased drying throughout Chile over the next 35 years through to 2050 due to climate change related impacts.

According to President Michele Bachelet the country’s current drought situation is already at critical stages. Bachelet recently announced millions of dollars in funds to drill for underground water and to construct desalination plants to provide drinking water to fight ramping drought conditions with the ugly prospect of more to come.

In a report today from BBC, Bachelet noted that the situation was now endemic and expected to worsen:

“Faced with this critical situation, there is no choice but to assume that the lack of water resources is a reality that is here to stay and that puts at risk the development of important regions of our country.”

Though climate change is expected to continue to ratchet down on drought impacts to Chile — increasing heat, melting critical glacial ice, and drying out forestlands — this year, at least, there appears to be some hope for an end to the stifling heat and the ongoing fires. Hints of the first rains of autumn have now begun to show up in Central and Northern Chile.

But by 2050 with the world expected to be between 1.5 and 2.5 degrees Celsius hotter than 1880s averages, the autumn rains will have been brutally beaten back — retreating further and further into fall. In that time, the heat and dryness of spring and summer will come early and the great glaciers upon which Chile depends so much for its water will be but wan shadows of former grandeur. If they exist at all.

Links:

Forest Fires Rage in Chile — Made Worse By Wind and Drought

Chile Declares Forest Fires Alert

Lance Modis

Hat tip to Colorado Bob

World Ocean Heartbeat Fading? ‘Nasty’ Signs North Atlantic Thermohaline Circulation is Weakening

Scientists call it Atlantic Meridional Overturning Circulation (AMOC). But we may as well think of it as the heartbeat of the world ocean system. And when that heartbeat begins to slow down, we’d best sit up and start paying attention:

(New video produced by climate hawk Peter Sinclair and featuring top scientists Stefan Rahmstorf, Michael Mann, and Jason Box, issues warnings about an observed disruption to ocean circulation due to water freshening in the North Atlantic. This is the kind of work I mentioned last week in my KPFA interview. The kind that should be showing on major network news every single night. Since that probably won’t happen, I urgently ask you to spread this video, together with its critical information, as far and as wide as possible.)

Global Warming Poses Risk to Ocean Circulation, Life Support

For nearly three decades now, prominent climate scientists have been warning policymakers that salt and heat driven circulation of the world ocean system (called thermohaline — thermo for heat and haline for salt) could be disrupted by cold water outflows from Greenland. There, in the North Atlantic, salty, dense, ocean water issuing from the tropics along the Gulf Stream begins to cool. The heavier water, burdened with salt, sinks to the bottom in the North Atlantic. This sinking, in turn, drives a massive ocean conveyer belt. It delivers colder, oxygenated water to the deep ocean. It dredges less oxygen rich bottom waters to the surface where they can be reinvigorated. And it drives this ocean revitalizing train of currents through every major corner of the world ocean.

A disruption of this ocean water mixing machine would ripple through the world oceans like a gunshot to a vital circulatory organ, reducing oxygen levels throughout the whole ocean system, and greatly reducing the oceans’ ability to support life. It would be a major shift toward a stratified, less life supporting ocean, and one step closer to the nightmare ocean state called a Canfield Ocean (named after its discoverer — Dr. Donald Canfield).

Warmer, salty water cooling and sinking in the North Atlantic is an essential cog in the wheel of this massive ocean water overturning machine. It has also been described (as Dr Box notes in the video above) as the Achilles Heel of global ocean circulation.

But I like to think of it more as the world ocean’s beating heart. The reason is that any disruption of the overturning process in the North Atlantic basically kills off a life-giving circulation to the entire world ocean system.

Cooling in Exactly the Wrong Place

AMOC Temperature Trend

(Linear temperature trend from 1900 through 2013 produced by Stefan Rahmstorf in his new study. Note the anomalous cool pool just south of Greenland. That’s exactly the kind of temperature signature you don’t want to see. One that is indicative of cold, fresh water outflows from Greenland interfering with North Atlantic and World Ocean Circulation. Also see: RealClimate.)

Now, a new 2015 report headed by Dr. Stefan Rahmstorf finds that the world ocean system is cooling in exactly the wrong place — the North Atlantic just south and east of Greenland. This cooling is an indicator that a high volume outflow of cold, fresh water is entering this region of ocean. A cold, fresh outflow that comes directly from the melting glaciers of Greenland itself. A cooling and freshening that creates a physical block to salt water down welling in the North Atlantic. The kind of block that can directly disrupt the Gulf Stream and the rest of ocean circulation on down the line.

Dr Rahmstorf explains the findings of his study in his notes at RealClimate:

The North Atlantic between Newfoundland and Ireland is… the only region of the world that has defied global warming and… cooled. Last winter [this region] was the coldest on record – while globally it was the hottest [such period] on record. Our recent study (Rahmstorf et al. 2015) attributes [ anomalous North Atlantic cold water] to a weakening of the Gulf Stream …, which is apparently unique in the last thousand years.

It happens to be just that area for which climate models predict a cooling when the Gulf Stream System weakens (experts speak of the Atlantic meridional overturning circulation or AMOC, as part of the global thermohaline circulation). That this might happen as a result of global warming is discussed in the scientific community since the 1980s – since Wally Broecker’s classical Nature article “Unpleasant surprises in the greenhouse?” Meanwhile evidence is mounting that the long-feared circulation decline is already well underway. (emphasis and a little clarity added)

To Dr Rahmstorf’s point that the North Atlantic was experiencing a Gulf-Stream threatening record cold while the world was under a pall of record warmth, we need only look at NOAA’s Land-Ocean temperature anomalies map for the winter of 2014-2015 below:

NOAA land ocean temperatuer anomalies

(NOAA Land Ocean temperature anomalies map for 2014-2015 shows extraordinary record cold pool of water south of Greenland in a record warm world. The smoking gun for large glacial outflow and thermohaline disruption in the North Atlantic. Image source: NOAA via ClimateCrocks and MeltFactor.)

Other Concerns Regarding North Atlantic Cooling

Unfortunately, an expanding pool of cold, fresh water in the North Atlantic is not just a threat to ocean health. It also represents a zone of anomalous cold in a region surrounded by atmospheric and ocean warming. As such, it represents a zone of likely expanding atmospheric instability — one involved in the shift of the cold center of circulation from the polar zones and more toward Greenland and Canada. Parcel to the kinds of weather disruptions that have been described in the theories of Dr. Jennifer Francis and during some of the later works of Dr. James Hansen (alluded to in The Storms of My Grandchildren).

As such, cold water bleeding from the great glaciers of Greenland not only poses a threat to ocean circulation, it also poses a risk for generating significant disruptions to atmospheric winds and related weather as well. Ones that could set off increasingly intense storm events in the Northern Hemisphere similar to what was seen for the US Northeast this winter (but likely worsening with time) and the extraordinarily powerful barrage of storms hitting England during the winter of 2013-2014.

Dr. Hansen in his Greenland Ice Sheet Loss: Exponential? paper warned of the potential for continent-sized frontal storms packing the strength of hurricanes under some rapid Greenland melt scenarios by mid-century.

Hollywood dramatizations aside, this is more than enough real world weather and climate trouble to pose serious cause for concern. And as Dr. Rahmstorf, Peter Sinclair, Dr. Jason Box and Dr. Mann allude to the header video — the policy makers were warned well in advance.

Links:

A Nasty Surprise With the Greenhouse

What’s Going on With the North Atlantic?

Exceptional 20th Century Slowdown in North Atlantic Overturning Circulation

Unpleasant Surprises in the Greenhouse

NOAA

MeltFactor

Greenland Ice Sheet Loss: Exponential?

Linking Weird Weather to Rapid Warming in the Arctic

Canfield Ocean

Hat tip to Today’s Guest Is…

The Human-Warmed Southern Ocean Threatens Major Melt For East Antarctica

Totten Glacier. A mountainous expanse of ice in the very heart of the greatest accumulation of frozen water on Earth. A bastion of cold containing 11.5 feet worth of sea level rise if it were to melt in total. An accumulation roughly equal to half of all the frozen water in the whole of the Greenland Ice Sheet.

According to a new scientific report out this week, Totten Glacier is under threat of melt. Warm water is swelling up through troughs in the Continental Shelf zone, approaching the ice shelf locking Totten and a vast swath of interior East Antarctic glaciers. As with West Antarctica, this warm water upwelling has the potential to rapidly destabilize an already fast-moving glacier.

Totten Glacier basin

(Totten glacier outflow zone covers a massive region of East Antarctica. An area about equivalent in size to the entire US Southeast region. Warm water is starting to encroach upon an ice shelf locking this great ice mass into its Continental Catchment Basin. Image source: Australian Antarctic Division.)

Totten already hosts one of the most rapid thinning rates in East Antarctica. And, in fact, it was a satellite detection of this very thinning that set off a recent scientific investigation of the glacier’s stability. What the new scientific report identified was a threat that enhanced warm water upwelling from a human-heated circumpolar current would collide with an ice structure that is already vulnerable to melt.

The net result would mean a destabilization and acceleration of one of the greatest ice masses on the planet. Such an event would have far-reaching implications, especially relating to the pace and end state of warming-related global sea level rise.

From the abstract of Ocean Access to A Cavity Beneath Totten Glacier:

Totten Glacier… has the largest thinning rate in East Antarctica. Thinning may be driven by enhanced basal meltingWarm modified Circumpolar Deep Water, which has been linked to glacier retreat in West Antarctica, has been observed in summer and winter on the nearby continental shelf beneath 400 to 500 m of cool Antarctic Surface Water…We identify entrances to the ice-shelf cavity below depths of 400 to 500 m that could allow intrusions of warm water if the vertical structure of inflow is similar to nearby observations. Radar sounding reveals a previously unknown inland trough that connects the main ice-shelf cavity to the ocean. If thinning trends continue, a larger water body over the trough could potentially allow more warm water into the cavity, which may, eventually, lead to destabilization of the low-lying region between Totten Glacier and the similarly deep glacier flowing into the Reynolds Trough. (emphasis added)

At issue are two pathways for this upwelling, warm, deep water to follow:

totten_glacier_labeledpaths

(Topographic map of the Totten Glacier outlet region and nearby seabed. Note the vulnerable water inlets [orange lines], the inland troughs and basins [red highlights and blue topographic signature] and the rather advanced inland extent of the grounding line [white line]. Image source: Ocean Access to a Cavity Beneath Totten Glacier.)

The pathways are identified by the orange lines in the topographic image above. The lines identify underwater valleys that run out to the deeper, warmer waters accumulating on the edge of the Antarctic Continental Shelf region. As the waters rise, scientists are concerned that these troughs will act like channels, funneling a flood of much warmer than normal water beneath the belly of the great glacier.

The result is an instance of ‘global consequence.’ The authors note:

We estimate that at least 3.5 m of eustatic sea level potential drains through Totten Glacier, so coastal processes in this area could have global consequences.

Indeed. If we add in all the other destabilized glaciers around the world to Totten, should it destabilize, you end up with about 26 feet of sea level rise locked in. And that has some pretty staggering consequences when you look at impacts to the world’s coastlines.

This is what 20 feet of sea level rise impact looks like for the US Southeast and Gulf Coasts:

NASA six meter sea level rise SE

(Six meters of sea level rise would permanently inundate many of the major cities along the US Gulf and Southeastern coasts. Areas inundated shown in red. Image source: NASA.)

But, perhaps worst of all, is the fact that some of the world’s longest lasting and most stable accumulations of frozen water are now under threat of melt.

In essence, what we are witnessing is possible initiation of the end of the greatest and oldest ice province on Earth. East Antarctica glaciated 35 million years ago, when atmospheric CO2 levels fell below a range of 500-600 parts per million, and has been mostly stable or growing ever since. Now that region of ice, the most ancient remaining in the memory of Earth, is under threat. With human greenhouse gasses in the range of 484 ppm CO2e (CO2 equivalent) and 400 ppm CO2 and rising, it appears that even the oldest glaciers are under existential threat.

To this point, Eric Rignot noted in a recent interview:

“..the stage is set. You have a submarine glacier and a deep trough. The warm water is not too far from that frontal region and we’ve seen some changes in the glaciers that suggest that something is happening at their base.”

Links:

Ocean Access to A Cavity Beneath Totten Glacier

Hidden Channels Beneath East Antarctica Could Cause Massive Melt

Australian Antarctic Division

NASA

A Glacier Area the Size of the Entire South is Melting Away

Angry Waters: The Human Hothouse vs the Imperative to Preserve Life

Luthiel — the water through stone.  — Luthiel’s Song

“If there is magic on this planet, it is contained in water.” –Loren Eiseley

*   *   *   *

Dear Friends,

Today I will be chatting with Caroline Casey at KPFA Radio, Berkley, FM 94.1 on the Visionary Activist Show at 5 PM Eastern, 2 PM West Coast on the issue of climate change, how it impacts the world’s waters and related geophysical systems, and on the broader impact to the Earth’s life supports.

I invite you to listen or to check out the program here.

As a prelude to the discussion with Caroline, I’d like to also provide these thoughts on the issue of how human movement toward a hothouse state is greatly bestirring the world’s waters:

Water is at the center of the climate change crisis. Too much water in the form of persistent rains, or rains that come all at once — with seasonal rains falling in the span of a month, a week, or even a day. Too much water in the form of sea level rise that has already driven 100,000 people away from their Indus River Delta farms due to salt table rise and flooding. Too much water for my home town of Hampton Roads which sees 77,000 properties in flood prone areas now uninsurable except by FEMA. Too much water for Miami which now imposes a fee (essentially an addition to property tax) to pay for increasingly powerful and elaborate pumps to keep the water out of roads, yards, and basements.

Unitarian Church Norfolk

(Unitarian Church of Norfolk, VA. A place my wife and I attended while living in the region some years back. Due to rising sea levels, the Church now regularly floods at high tide. Image source: Campaign to Move the Church to Higher Ground.)

*   *   *   *    *

Too little water in the form of an ongoing, now decadal, Southwestern US drought. Too little water for the clear cut and rapidly warming Amazon Rainforest and regions south like Sao Paulo. Far too little water for poor Syria which saw a 7 year drought before destabilization. Perhaps too little water for India and Southeast Asia this year as a combined human warmed ocean, strong PDO, and El Nino threaten to weaken or shut down the annual monsoon.

Too much increase in the flows of water from land to air, called the hydrological cycle in science, that increases the rate of evaporation, making droughts more suddenly intense, and increases the intensity of downpours — which is a brutal blow to vegetation and our ability to capture and use water for human efforts. And all that extra water in the airs and atmosphere thickens the lower zones, likely leading to strange changes like the advent of towering, bullying, blocking high pressure systems (Stu Ostro) or contributing to the powerful wind flows from south to north, from tropics to the Arctic (Jennifer Francis).

Angry Waters Calving Glacier Front

(Glacier calving into dark waters. For reference, the glacier front here is hundreds of feet in height. Image source: Norwegian Polar Institute.)

Changes in the way the Earth holds and manages water also arise. The great ice sheets, for so long dormant in their eons old rumbling, have been awakened by heat and are surging toward the oceans in a great melt that has now doubled in size for each of the past five years since the late 1990s. Great flows that have backed up some of the great ocean currents, causing water to slosh up on coastlines, and painting an expanding pall of fresh water over the Southern Ocean. A lid that risks the locking in of oxygen and a shutting down of the life generation process that has made our oceans so vital for so long.

If we were to translate our scientific knowledge into the language of the ancients, we would say now that water — a spirit that is able to hold the greatest heat of any of the elements — has been made angry by our excess and it is now moving about in our world with an increasing fury.

low-oxygen-ocean-zones

(Expanding low oxygen ocean zones is a real killer — first reducing ocean productivity and then becoming a haven for deadly hydrogen sulfide producing bacteria. A low oxygen ocean can rapidly shift into a deadly state known as a Canfield Ocean. Image source: Oxygen Minimum Zones.)

In the far north, water is forming into lens like lakes in the tundra. These heat trapping engines accelerate the permafrost melt and unlock ancient methane, breathing it into the air and contributing to human warming. In some cases, perhaps, rivers upon the tundra have tunneled down through new-found cracks and encountered ancient water-methane. A frozen fire water under high pressure that when warmed appears to have blown up into large eruptive holes. The tundra blow holes we have seen so much controversy over in the news.

Water in the air, in the oceans, in the ice, in and upon the ground is what makes Earth so bountiful and life-rich. But we are adding heat to that water and so we our changing our relationship with both it and the Earth…

*   *   *   *   *

To these points, Caroline asks:

“What must we die to lest we die from?”

Certainly a notion well worth considering at this rather late hour.

Hat tips to:

Eleggua for facilitating this interview!

Kevin Jones for deep and clear thoughts

Warm Storms Rage Through Barents as Arctic Sea Ice Enters 13th Day of Record Low Extent

On March 4, amidst a building polar heat amplification and a strong, thousands mile long, south to north wind and storm flow across the North Atlantic and into the Arctic, sea ice extent coverage for the northern polar region plunged to new record lows.

imageimage

(26 foot wave heights [left frame] and 50-60 mph sustained southerly winds [right frame] in conjunction with warm storm near the ice edge at Svalbard on March 15, 2015. Storms of this kind have been raging up through the Barents delivering powerful, warm southerly winds and immense swells to the ice edge region for at least the past half month. This strong melt pressure and warm air delivery has contributed to record low sea ice extent totals continuing for the past 13 days running. Image source: Earth Nullschool. Data source: GFS.)

Human-forced heat continued to build throughout the Arctic as warm and intensely windy storms churned northward through the Barents, bringing with them powerful swells ranging from 15 to, at times, 40 feet in height. As these great swells ground away at the ice edge, temperatures hit daily anomalies greater than 4 C above the 1979-2000 average on Sunday, March 8 for the entire Arctic region. The next day, sea ice extent, according to NSIDC, plummeted to 14,273,000 square kilometers. A value 303,000 square kilometers, or an area about the size of Arizona, smaller than the previous record low value for the date set in 2006.

Ever since March 4, the Arctic has remained in new record low territory — a period that has now lasted 13 days. Though anomalous warmth has faded somewhat — dropping today to a range of 2.65 degrees Celsius above the 1979-2000 average — sea ice has only bounced back slightly. On March 15, the NSIDC extent measure had inched up to 14,333,000 square kilometers, still about 235,000 square kilometers below the previous record low for the date.

chart(3)

(Arctic sea ice extent as measured by NSIDC drops below previous record low values on March 4 of 2015 [bottom dark blue line] and has remained at record low levels ever since. For reference, previous record low years for March dates include 2006 [pink line], 2007 [light blue line], and 2011 [orange line]. The top dark blue line [1979] indicates how much sea ice extent has been lost during March over the past 36 years. Image source: NSIDC.)

Over the next week, however, these new record lows are more likely to continue to fade as warm Arctic surface temperature anomalies drop to around 1-2 C above average, the Arctic Oscillation shifts toward neutral or slightly negative, and the warm storm track through the Barents is interrupted by cold winds pushing south toward Scandinavia from the pole. Although mid-week warming forecast for Alaska and Baffin Bay may retard any potential rebound somewhat.

For the past two years, Arctic sea ice has experienced a bit of a rebound during the March through early April time-frame. This has appeared to coincide with a restrengthening of the polar Jet Stream as mid latitudes have warmed which, in turn, has weakened meridional patterns transporting heat into the Arctic during winter time. Low angle sunlight entering the Arctic at this time of year has also not yet gained enough momentum to significantly push the ice to melt. So we still have about a 2-3 week window for potential bounce-back before sunlight builds and begins to apply its steady heat forcing to the greatly diminished ice.

AO index forecast

(Arctic Oscillation [AO] index forecast shows dip toward slightly negative or neutral AO status by end week after a rather extreme high in early March, with a return to mildly positive AO values by end month. Positive AO enhances edge melt of sea ice by encouraging storm formation at the ice edge and warm air invasions over the central ice. Image source: NOAA/CPC.)

That said, the ice is quite frail now, even with potential volume rebounds to mid 2000s levels. So even the slight addition of solar insolation may be enough to keep ice coverage values depressed in the neutral or moderately positive Arctic Oscillation regime that is predicted through the end of March. Extent measures maintaining near record lows along the 2006, 2007 and 2011 tracks, or just below, would establish a very low launching pad for a melt season that, lately, has tended to include precipitous declines in ice during the summer months.

The ongoing record low extent status, despite a return to weather patterns that are more favorable for rebound or maintenance, therefore, should be closely monitored.

Links:

NSIDC

NOAA/CPC

Earth Nullschool

GFS

Climate Reanalyzer

Accelerating Global Warming? NASA Shows February of 2015 was Second Hottest on Record

The Earth started out 2015 very hot. A record hot range that some researchers are now saying may be the beginning of a period of accelerated global warming.

***

For the global temperature measure, February of 2015 was another extraordinarily warm month. One more hot month in an unbroken chain stretching all the way back to the mid 1980s. The second hottest February in the whole of the NASA record ever since temperature monitoring began in 1880.

In total, NASA GISS shows February of 2015 topping out as the warmest February of the new millennium at 0.79 degrees Celsius above the 20th Century average. A reading 1.06 C above temperatures measured during 1880. Only February of 1998 was hotter (Of all of the super El Nino year of 1998, only February and June still hold records as hottest months in the NASA measure).

But perhaps most importantly, the average of 2015’s first two months is 0.77 C above the 20th Century. This is just behind 2007 (by just 0.02 C) as the hottest two-month start of any year during the past 135, and likely hotter than at any time during the Holocene and possibly in the past 120,000 years altogether.

Temperature Map February NASA

(Global temperature anomaly map. Image source: NASA.)

Global temperature anomaly analysis by NASA shows extraordinary warmth for much of the Northern Hemisphere. In particular, most of the land mass of Asia experienced far above average readings. Temperatures in this zone measured as high as 8.4 degrees Celsius above average for the entire month — yet one more extraordinary period of departure for a rapidly warming region.

The North American West Coast through to Alaska also showed much warmer than normal readings. A pattern coincident with both a vast pool of warm water in the Northeastern Pacific and a ridiculously resilient ridge of high pressure (and coincident high amplitude wave in the Jet Stream) that has formed for seasonal periods over the region since the winter of 2012-2013.

Abnormal warmth was also pervasive through the tropics, the Arctic, Africa, Australia, sections of East and West Antarctica, and over most Oceanic zones. The only region experiencing colder than normal readings was the Eastern Half of North America. An area in the downward sloping trough of the prevalent Rossby Wave and associated hot-cold dipole pattern that has been so common for North America during recent winters.

Zonal Anomalies Feb 2015

(Temperature anomaly by Latitudinal Zone for February of 2015. Image source: NASA.)

NASA’s zonal anomalies measure shows very strong polar heat amplification, which is a tell-tale of the human greenhouse gas heat forcing, at the Arctic Circle line (66 North Latitude) and continuing on northward. Zonal anomalies peaked at around the 66 degrees North Latitude line in the range of 2.8 C above average for the entire month. Anomalies declined poleward but still maintained 1.5 to 2.5 C above average ratings.

Though somewhat cooler than the Northern Polar Region, the rest of the global also showed above average temperatures in almost all zones. 30-60 North showed readings ranging from 0.5 to 2.5 C above average, the tropics maintained about a +0.6 C above average range, 30-60 South ranged between 0 and 0.6 C above average with a dip in the heat sink and high wind region of the Southern Ocean. The Southern Polar Region showed the only zonal below average reading with -0.2 C between 85 and 90 South, but the entire region of 60-90 South ranged about 0.15 C hotter than average.

Conditions in Context

The main features of the current globally hot February are a weak El Nino in the Central Pacific (declared by NOAA in early March), a strong positive PDO pattern of very warm sea surface temperatures throughout the Pacific and an extreme polar amplification in the region of 60-90 North Latitude.

According to IPCC forecasts and Pacific Ocean warming impact studies, both the El Nino, which has tended to shift more toward the Central Pacific, and the amazing polar amplification are indications of what was expected in a world seeing a rapid accumulation of greenhouse gasses through the mechanism of human fossil fuel emission. The North American Rossby Wave pattern combined with extremely warm temperatures in the West and cold, stormy and snowy conditions in the East, was also predicted as a potential upshot of warmer than normal readings at the pole reducing temperature differentials from North to South and encouraging weakness and waviness in the Jet Stream (Francis). PDO intensification, contributing to a warm water pool off the North American West Coast and coincident mid Pacific El Nino may also have a teleconnection-type (Where large weather patterns reinforce and enhance the formation of other large weather patterns that may be hundreds or thousands of miles removed from the first. Some have poetically referred to teleconnection as an atmospheric dance.) influence with the ridging pattern in the west and the related troughing pattern in the east.

In global climate models, cool pools of water near Greenland and West Antarctica are also implicated in potential trough/Rossby Wave type patterns (severe frontal storms) which may also be influencing the extreme weather seen in the Northeastern US during February. These pools are associated with glacial melt and coincident fresh water outflow. In the North Atlantic, this has implications for global thermohaline circulation. A strong thermohaline circulation is essential for ocean mixing and related ocean health.

Overall, the global temperature disposition, extreme temperature anomaly, and related strange weather patterns are anything but a normal. They are instead indicative of the kinds of extraordinary climates and extreme weather both computer models and researchers have predicted as a direct result of human-caused warming.

Entering a Rapidly Warming World

entering a rapidly warming world

(Even with a rapid draw down in human emissions to RCP 4.5 levels, computer model essays show 40 year average rates of warming will likely accelerate over the next few decades. Image source: Near-Term Acceleration in the Rate of Temperature Change.)

To this point, it appears that some climate models are in agreement that the period of the next few decades are likely to see an accelerated warming trend. Decadal rates of warming, during this time, are expected to accelerate to between 0.2 and 0.25 C per ten years, even if human greenhouse gas emissions are rapidly drawn down. The result would be about 1.4 to 1.6 C worth of warming above 1880s levels by or before 2040. Without a rapid draw-down, and a continuation on the current catastrophic path of fossil fuel burning, recent model essays from Dr. Michael Mann indicate that humans could exceed the 2 C warming threshold by the mid 2030s.

Links:

Near-Term Acceleration in the Rate of Temperature Change

GISS Surface Temperature Analysis

Paleoclimate Implications For Human-Made Climate Change

Warming Arctic May be Causing Heatwaves Elsewhere in the World

The California Weather Blog

Increasing Intensity of El Nino in the Central Equatorial Pacific

Evidence Linking Arctic Amplification to Extreme Weather in the Mid-Latitudes

Greenland Melt — Exponential?

Far Worse than Being Beaten With a Hockey Stick

Earth Entering a New Period of Rapid Temperature Change

Hat tip to Bassman

Unconfirmed Reports of Giant, 1 Kilometer, Methane Crater Found in Siberia

“We have just learnt that in Yakutia, new information has emerged about a giant crater one kilometre (0.6 miles) in diameter,” the deputy director of the Oil and Gas Research Institute of the Russian Academy of Sciences, Vasily Bogoyavlensky, told AFP.

*   *   *   *

Sometimes, when writing a blog about the latest cutting edge climate science, you feel like you’re tracing the footprints of a Godzilla-like monster. One of Steven Pascala’s proverbial ‘climate monsters in the closet.’ This week has been filled with those days. Days when you get the sense that one might have gotten out.

METOP Methane 2359 ppb

(Arctic methane overburden continues. NOAA’s IASI METOP sensor again shows elevated methane readings today peaking at 2349 ppb [average 1819 ppb] with highest levels [pink] concentrated over the Arctic and upper Northern Hemisphere Latitudes in the 18,000 foot altitude layer. Image source: METOP.)

Just this Monday, I penned a narrative analysis of the signs of methane and carbon store destabilization in the Arctic, the various risks involved, and the potential that the methane blow holes we’ve been witnessing may be linked to giant craters previously found on the ocean floor. Craters ranging from 250 meters to seven miles across.

Yesterday, the deputy director of the Oil and Gas Research Institute of the Russian Academy of Sciences (RAS) issued the above statement to the Associated Press, in which he described a newly discovered 1000 meter crater in the Yakutia region. The statement was then circulated in the Guardian and at Physics.org.

The Maw of Yamal Crater
(The Yamal Crater, as seen above, would be miniscule compared to a Yakutia Crater reported by Russian Scientists yesterday. Image source: The Siberian Times via Vasily Bogoyavlensky.)

The statement was a few paragraphs down in a report that announced a likely link between climate change and the seven other methane craters discovered throughout northern Siberia over the past eight months. It provided no additional context, simply reporting a massive crater. One that, if it proves to be a confirmed recent event, could completely reshape the way we look at how thawing lands and sea beds impact sequestered methane and carbon stores in the Arctic.

But there is still quite a lot we do not know about this crater, including its potential age.

The first Crater, discovered in Yamal was just a bit more than 100 feet across and 220 feet in depth. Of all the craters discovered up until yesterday, it was the largest. According to reports from the Russian Academy of Sciences and from the Russian Center of Arctic Exploration, often through the Siberian Times, these craters were likely caused by explosions of methane under high pressure through a top layer of melting permafrost. The reports identified destabilized relic methane hydrate as a likely source of the eruptions, which the scientists are now stating are somewhat similar to volcanic explosions.

Global Temperature Anomalies

(Global temperature anomalies from the University of Maine’s Climate Reanalyzer today shows extraordinary temperature departures in the range of +20 C above average over Yakutia, Russia. A region that has experienced an extraordinary pace of warming coincident with raging polar amplification. Data Source: Global Forecast System Model.)

The new crater is said to be located in a region of Yakutia, which is a Siberian province many hundreds of miles east of the Yamal Crater. Yakutia hosts some of the densest permafrost deposits in the Arctic. It has also experienced extraordinarily rapid warming similar to the Yamal increase of 2 degrees Celsius in just 14 years. Over coming years, the pace of warming is predicted to be equally rapid. Climate models for the region indicate as much as 8 degrees Celsius warming through the end of this Century. The result is that we see Yakutia, as much of Siberia, in a state of very rapid and destabilizing climate change.

Stresses to permafrost due to this raging rate of warming are extraordinary and involve not only permafrost melt and subsidence but also horrific wildfires that individually burn hundreds of square miles. These enormous wildfires are not normal, garden variety infernos. They often alter the weather, forming enormous fire thunderstorms overhead. They have been reported to burn so hot as to ignite the soil itself, incinerating everything to at least three feet of depth. Near surface methane pockets also likely become involved in these fires and the peat-like structure of the permafrost, once thawed, can result in continued basement smoldering long after the surface fire is extinguished.

siberian-fires-july-23
(Massive wildfires belching out immense plumes of smoke on July 23, 2014 in the Yakutia region of Russia. For reference, bottom edge of frame is about 2000 miles. Image source: LANCE-MODIS.)

These massive, fearsome fires are anything but normal. They are directly linked to the rate of warming, permafrost thaw, and carbon store release in Arctic Siberia. And it appears that for Yakutia, which has seen some of the worst of these fires, a rather large scale methane eruption risk — enough to produce 1000 meter craters — may also now be involved as well.

Links:

Concern Over Catastrophic Methane Release
Russian Scientists Say Climate Change to Blame for Mysterious Siberian Craters
More Giant Craters Spotted in Russian Far North
More Siberian Blowholes Found in the Permafrost
LANCE-MODIS
The Siberian Times
METOP

Hat tip to Colorado Bob

Hat tip to Ouse, MD

Scientific hat tip to The Russian Academy of Sciences

Record Warm World’s ‘Weird’ 2015 El Nino Sees Westerly Gales, Growing Kelvin Wave

“The 2015 El Nino is finally here, but it’s weak, weird and late,” said Mike Halpert, deputy director of the Climate Prediction Center last week.

And the current El Nino is certainly an odd bird. According to reports from NOAA and the National Weather Service, the center of highest sea surface temperatures for the El Nino this year is offset westward — coming closer to the date line than it typically does. This is a weird heat disposition for El Nino which is, at least, a mid ocean event and often pushes warming well across the Pacific to South American shores.

image

(Pacific sea surface temperature anomaly [SSTA]. Note the hot water pools off both Australia and North America. These zones are joined by a vast blanket of warmer than average waters arranged diagonally across the Pacific from SW to NE. This disposition includes the warm anomaly along the Equator which is hot enough to reach weak El Nino status. But the disposition of sea surface temperatures throughout the Pacific, with highest equatorial anomalies near the date line and warmer spikes near Australia and the North American West Coast is unusual. SSTA graphic provided by Earth Nullschool. Data Source: Global Forecast System Model and NCEP.)

It’s also late in coming, as typical El Ninos have tended to arrive in full form during late fall or early winter. A Christmas-time warming of waters off the West Coast of South America was a traditional call-sign for El Nino and one that resulted in its name — which is Spanish for “The Christ Child.” Late winter and early spring are more typical times for the formation of deeper warmer water that may trigger an El Nino later in the year but often do not herald a fully-developed event (see What is El Nino? for more related information).

Lastly, the El Nino is currently rather weak — barely meeting a requirement for El Nino from NOAA and still not reaching the threshold that Australia’s Bureau of Meteorology applies.

But despite all this relative oddity, the 2015 El Nino is here. And it appears to be growing.

Intense West Wind Back-burst Coincident with Powerful Cyclone Formation

For earlier this week strong westerly winds began to roar against the typical flow of the trades along the Equator. The west wind back-bursts (WWB) push warmer West Pacific waters eastward and downward, enhancing the sea surface temperature anomaly spikes that fuel El Nino.

image

(Very strong West Wind Back-Burst hosting 85 kph 10 minute west wind at 7.45 South Latitude on early March 11. Image source: Earth Nullschool.)

As of early Wednesday, March 11, these west winds had formed a gale force wall stretching just past the date line from about 5 North Latitude to 10 South Latitude. A gale driven by parallel cyclones — a weaker system to the north (Bavi) and the newly gathering Pam, which may challenge south Pacific records as the strongest storm ever to form in that region. In the above graphic we see a related ten minute sustained WWB of a rather extraordinary 85 kilometers per hour (about 50 mph) along the 7.45 degree South Latitude line.

Strengthening Kelvin Wave in a Record Warm World

Just before the formation of these strong westerlies, sub-surface temperatures also began to spike. A warm Kelvin wave that had already started its run beneath the sea surface, as of March 4, was beginning to show signs of strengthening well in advance of the added shove coming from the vigorous WWB shown above.

Strengthening Kelvin Wave

(A new Monster Kelvin wave? Sub surface temperature anomalies are again entering the far above normal range for the Equatorial Pacific. Image source: Climate Prediction Center.)

Peak temperatures in the wave as of a week ago had hit more than +6 C above average. A heat signature that is starting to look, more and more, like the very powerful Kelvin Wave of early 2014 that belched so much warmth into the atmosphere and likely contributed to both the current strongly positive PDO as well as 2014’s new record high temperatures.

An event that top ocean and atmospheric scientists Kevin Trenberth and Axel Timmerman attribute to signalling a possible start to much more rapid atmospheric temperature increases.

The Kind of Mid-Ocean Event That Some Scientists Say we Should See More of

If this is the case, then what we may be seeing is a slow start to an El Nino that could be much stronger and longer than expected. Last year’s intense Kelvin Wave may have simply been preparation for a slowly building event in conjunction with what was, during December, a record broader warming of the Pacific called positive Pacific Decadal Oscillation (PDO). Some model runs, especially those at Australia’s BoM, appear to have picked up this track.

In addition, NOAA sea surface temperature models now are predicting continued Central Pacific Warming (CPW) in association with the current El Nino over the coming months. If this El Nino continues to progress along CPW warming lines, then it is likely to be more indicative of what Japanese scientists call an El Nino Modoki event:

El Nino Modoki

(Sea surface temperature signature of an El Nino Modoki, which is closer to what we are seeing now, even if the higher temperature levels are currently shifted more toward the Date Line. Image source: Japan Agency for Marine-Earth Science.)

During recent years, some scientific reports have indicated that Central Pacific Warming or El Nino Modoki will be more prevalent as a result of human-caused climate change. Study authors Tong Lee and Michael J McPhaden, in the 2010 paper entitled Increasing Intensity of El Nino in the Central Equatorial Pacific note that increases in Pacific Ocean temperatures are primarily expressed through more intense warming of the central regions:

Satellite observations suggest that the intensity of El Niño events in the central equatorial Pacific (CP) has almost doubled in the past three decades, with the strongest warming occurring in 2009–10. This is related to the increasing intensity as well as occurrence frequency of the so-called CP El Niño events since the 1990s. While sea surface temperature (SST) in the CP region during El Niño years has been increasing, those during neutral and La Niña years have not. Therefore, the well-documented warming trend of the warm pool in the CP region is primarily a result of more intense El Niño events rather than a general rise of background SST.

If so, it seems possible that global warming may well be influencing the rather strange El Nino evolution we are witnessing now.

In any case, Central Pacific Warming El Ninos have a somewhat different impact than Eastern Pacific Warming El Ninos. For one, they tend to ramp up, rather than cool down North Atlantic Hurricanes. They also tend to result in more, not less, drought for the US West Coast. For India, mid-ocean warming of the kind we are seeing now can result in an enhanced disruption of the Asian monsoon — kicking off drought and related food security risks.

Tong Lee and Michael J McPhaden continue by adding:

…. the amplitude of this new type of El Niño has increased in recent decades (Lee and McPhaden 2010). For convenience, hereinafter we refer this new type of El Niño as to CP warming (CPW). Compared with the canonical EPW, the CPW exhibits distinctly different impacts on worldwide climate. For example, the CPW shifts the anomalous convection westward and usually forms two anomalous Walker circulations in the tropical Pacific (Ashok et al. 2007; Weng et al. 2007; Weng et al. 2009). The westward displaced convection was suggested to be more effective in causing Indian drought (Kumar et al. 2006). The CPW increases hurricane frequency both in the Atlantic Ocean (Kim et al. 2009) and western North Pacific (Chen and Tam 2010), and also shifts tropical cyclone tracks in the western North Pacific (Hong et al. 2011).

But the authors’ research doesn’t directly point toward the odd seasonal change we are witnessing now, nor the off-setting of the initial hot pool about 1,500 kilometers further west than even during a typical El Nino Modoki event. For this reason, our ‘weird’ El Nino and equally weird and warm Central Pacific bear close watching.

Links:

El Nino Finally Here, But it’s Weak, Weird, and Late
NOAA
National Weather Service
What is El Nino?
NOAA’s ONI Index
BoM ENSO Wrap-up
Earth Nullschool
Global Forecast System Model
NCEP
Pam at Category 5 Strength
Warming Pacific Drives Global Temperatures
Bad Climate Outcomes
2015 El Nino to Bring Back-to-Back Hottest Years on Record?
Increasing Intensity of Central Pacific El Nino — Links to Climate Change
Japan Agency for Marine-Earth Science
El Nino Declared as Climate Scientists Watch on With Amazement

Hat tip to Phil

Hat tip to Wili

Hat tip to Timothy Chase

Entering the Middle Miocene — CO2 Likely to Hit 404 Parts Per Million by May

The Pliocene. A period of time 2-5 million years ago hosting carbon dioxide levels ranging from 350 to 405 parts per million and global average temperatures that were 2-3 degrees Celsius hotter than 1880s levels. The great ice sheets of Greenland and West Antarctica were feeble, if they existed at all. And seas were about 25-80 feet higher than today.

mlo_two_years

(CO2 hit above 401.84 parts per million on March 9, 2015, and above 403 parts per million on March 10 — levels that test the upper boundary of CO2 last seen during the Pliocene and entering a range more similar to the Miocene. Image source: The Keeling Curve.)

In the context of human warming, the amount of heat forcing we’ve added to the global atmosphere from carbon dioxide emissions alone has been hovering in the range of the Pliocene for the past two decades. A heat forcing that, if it remained steady over a substantial period of time, would almost certainly revert the world to a climate state last seen during that time.

But by 2015, the global human heat forcing from carbon dioxide emissions had begun to exit the period of the Pliocene. Now we are entering a period in which atmospheres are more similar to those seen during the Middle Miocene Climate Optimum — the last time CO2 measures exceeded a threshold of roughly 405 parts per million (see here and here)

The Middle Miocene Climate Optimum occurred between about 15 and 17 million years ago. It hosted an atmosphere in which carbon dioxide levels varied wildly from 300 parts per million to 500 parts per million. Temperatures were between 3 to 5 degrees Celsius hotter than the 19th Century. And sea levels were about 120 to 190 feet higher. During this period, the world was still cooling down from the heat of the Paleocene and Eocene epocs. Carbon was being sequestered. And it was the first time the world broke significantly below a 500 part per million CO2 plateau that had been established during the Oligocene 24 to 33 million years ago.

The great glaciers in East Antarctica were mostly well established, even though their scope was a mere shadow of what we see today. The Greenland and West Antarctic glaciers did not exist. They would have to wait for about another 5-10 million years for the Earth to cool further.

glaciation-since-petm

(Glaciation since PETM. Image source: Dr James Hansen.)

As of March 9, 2015, atmospheric CO2 levels had reached 401.84 parts per million. Already a level testing the Pliocene-Miocene boundary, this measure will continue to increase through the rest of March, on into April, and keep rising until middle or late May. At that point, global CO2 levels will have reached around 404 parts per million. At least the highest levels seen in the last 3 million years and possibly the highest levels seen in 15 to 18 million years.

If the greater portion of this range is correct, then we are now breathing air that none among our species or even our hominid relatives have ever breathed since their setting foot on this world.

But CO2 alone doesn’t tell the whole story. Equivalent CO2 levels (CO2e) including all human emitted greenhouse gasses — methane and a host of industrial gasses — will reach about 484 ppm CO2e this year (see here and here). And that forcing puts us easily within the range of the warmest periods of the Miocene. A brew of heat trapping gasses including exotic chemicals that no creature has likely ever breathed while living on the Earth.

Links:

The Pliocene

Middle Miocene Climate Instability Associated With CO2 Variability

CO2 and Climate Closely Linked During Middle Miocene

Sea Level and Ice Volume Variations

IPCC 2007 Chapter 6 — Paleoclimate

Dr James Hansen

The Keeling Curve

NOAA ESRL CO2 Measure

CO2 Levels for February Eclipsed Prehistoric Highs

A Faustian Bargain on the Short Road to Hell — Living in a world at 480 CO2e

400 PPM CO2? Add in All other Gasses and it’s 478 CO2e

Hat tip to Aldous

For Brazil, Climate Change Has Undone the Rains

For the past two years, a thickening, heating, drying atmosphere over Brazil has become the haunt of one of the worst kinds of atmospheric bullies. A blocking high that has parched an already wounded forest country, shrinking its reservoirs, turning rivers into ribbons, and threatening millions with a lack of access to essential water.

The block feeds on heat and the building inertia of a warming atmosphere (see also Quirky Winds Fuel Brazil Drought). It is a new species of mutant weather animal bred by human caused climate change. Its ilk have ranged the globe setting off terrible droughts in places like Syria, California and Southeast Asia. But perhaps nowhere is the undoing of rain so strange and tragic as it is for water-rich Brazil.

Amazon Rain Forest. The very name conjures the image of lush vegetation, of mists, of rivers of storms riding the thick, moisture-laden airs. A wet interplay of forest and atmosphere that has for centuries reinforced and amplified the cycle of drawing life-giving water down from the skies.

But no more. Human climate change, a regional deforestation mafia, and the ogre of a blocking high pressure system gorged on heat steroids have put an end to that.

Wet Season Ranking

(The rainy season that wasn’t. NOAA map shows much depleted wet season for 2013-2014 and 2014-2015. Image source: NOAA.)

For as of last week, reports from NOAA showed a rainy season 2/3 past and desperately dried and behind schedule (see image above). A ‘rainy’ season in which large swaths of Brazil and the Amazon Rainforest fell into the lowest percentile of years for moisture received.

And the dry 2014-2015 ‘wet season’ comes just following the equally moisture lacking 2013-2014 ‘wet season.’

Will the Rains Briefly Return?

For the Sao Paulo region, at the epicenter of the current blocking pattern and deforestation induced drought, 2014 was the driest year since record keeping began in 1930 (see Drought in Sao Paulo). 2015, so far has only seen slightly more water. And the slight increases in rains have only been enough to push Sao Paulo’s largest aquifer — the Cantariera — to 12.9 percent capacity, even when dead pool volumes are included (without the new dead pool volume, Cantariera would be sitting around 9 percent).

With a little more than a month and a half remaining to a notably stunted rainy season, the Cantariera will be fortunate to hit 1/5 capacity by late April. A situation which could see the most populated region in Brazil desperately shy of water and continuing current rationing at least for the next year.

However, a newly emerging Pacific El Nino may draw back on current moisture flows to the region, putting a lid on late season rainfalls and pumping up the blocking high yet again (see ENSO and Drought Forecasting). If the forecast rains do not arrive and the block again tightens its grip over the region, Sao Paulo could be looking at running out of water for many of citizens over a 4-6 month period.

Megadrought For The Deforest

Regardless of whether a brief spate of rainfall provides new hope for avoiding a complete collapse of Sao Paulo’s water supplies for 2015, the long term situation looks increasingly dire. Added heat from human-caused warming combines with rampant deforestation in Brazil to create a kind of drought death spiral. Already baking under the heat of an equatorial sun, the clear-cut and burned Amazon is now struggling to retain moisture. Understory fires and gradually building heat due to human warming at the rate of 0.25 C per decade for the rainforest provide additional stress to a critical forest region.

amazon-severe-drought

(2013 JPL study found that climate change was weakening the Amazon’s ability to recover from severe droughts like the one seen in this 2005 moisture anomaly capture. Under human caused climate change, droughts become far more frequent and intense. A 2009 study found that 85% percent of the Amazon would likely be lost due to climate change alone at 4 C of warming. Even mild warming of slightly more than 1 C could result in additional losses of 20-40 percent.)

A recent report in The Economist estimates that 30,000 new trees would need to be planted to help rejuvenate the ‘flying rivers’ that continuously feed moisture to the rainforest (a very low number considering the fact that the Amazon contains an estimated 390 billion individual trees divided into 16,000 species). Deforestation, as well, would necessarily have to stop. And even if these two requirements were met, human caused warming would have to be quite mild to spare the Amazon conflagration and conversion to much drier savannah and grasslands.

Given these dire challenges, it must be assumed that Brazil, much like the US Southwest and other regions of the world faces the prospect of potential megadrought over the coming years and decades. So what we are seeing for Sao Paulo now is, sadly, prelude.

Links:

It’s Supposed to be Rainy Season in Brazil, So Where has all the Water Gone?

Quirky Winds Fuel Brazil Drought

ENSO and Drought Forecasting

Drought in Sao Paulo

Climate Change Could Kill 85 Percent of the Amazon by 2100

Severe Climate Jeopardizing Amazon Rainforest

The Amazon Rainforest

Hat Tips:

Andy

Colorado Bob

Kevin Jones

Eleggua

Greg

Concern Over Catastrophic Methane Release — Overburden, Plumes, Eruptions, and Large Ocean Craters

The amount of methane in the Arctic hydrates alone is estimated as 400 times more than the global atmospheric CH4 burden. The question is timescale of the methane liberation: gradual, abrupt, or something in between. Satellite monitoring of methane over the Arctic Ocean is necessary. — Dr. Leonid Yerganov

*  *  *  *

Depending on who you listen to, it’s the end of the world, or it isn’t. A loud and lively debate that springs up in the media every time a new sign of potential methane instability or apparent increasing emission from methane stores is reported by Arctic observational science.

On one side of this debate are those declaring the apocalypse is nigh due to, what they think, is an inevitable catastrophic methane release driven by an unprecedentedly rapid human warming of the Arctic. A release large enough to wipe out global human civilization. These doomsayers are fueled by a number of scientists (usually Arctic observational specialists) who continue to express concern — due to an increasing number of troubling, if not yet catastrophic, rumblings coming from the Arctic carbon store. The Arctic is warming faster than it ever has, they accurately note. And this very rapid rate of warming is putting unprecedented and dangerous stresses on carbon stores, including methane, that have lain dormant for many millions of years. The risk of catastrophic release, therefore, is high enough to sound the alarm.

On the other side are a number of mainstream news outlets backed up by a group of established scientists. This group claims that there’s generally no reason to worry about a methane apocalypse. The methane releases so far are relatively small (on the global scale) and there are all sorts of reasons why future releases will be moderate, slow in coming, and non-catastrophic. The methane store most pointed toward by methane catastrophists — a frozen water methane known as hydrate — tends to self-regulate release, in most cases, acting as a kind of pressure valve that would tend to moderate emission rates and prevent instances of catastrophic eruption (Please see The Long Thaw).

A third group appears to have somewhat sidestepped an otherwise polarized discourse. Outlets like ThinkProgress and others have continued to quietly report observations without drawing conclusions, one way or the other, on the issue of near term methane apocalypse. They point, instead, to what are, admittedly, some rather odd and scary methane rumblings going on near the pole. Among this ‘middle ground’ group are a survey of about 100 researchers who’ve identified a likely carbon release (including both methane and CO2) from the Arctic equaling between 10 and 35 percent of the human emission by the end of this Century (Please see High Risk of Permafrost Thaw). It is a ‘middle ground’ that is troubling enough. For 10-35 percent of the human carbon emission coming from the Arctic is a massive release in the range of 1 to 3.5 gigatons of carbon (with a fraction as volatile methane). If such an emission does materialize, it will equal (on the low end) or exceed the annual rate of environmental carbon release last seen during the PETM — a hothouse extinction 55 million years ago that turned the oceans into killers and forced life on land to shrink in size and burrow to avoid the awful heat and stifling atmosphere of that age.

Regardless of where you stand in this discourse, the Arctic itself continues to provide cause for both debate and appropriate concern.

Methane Overburden

Barrow Methane

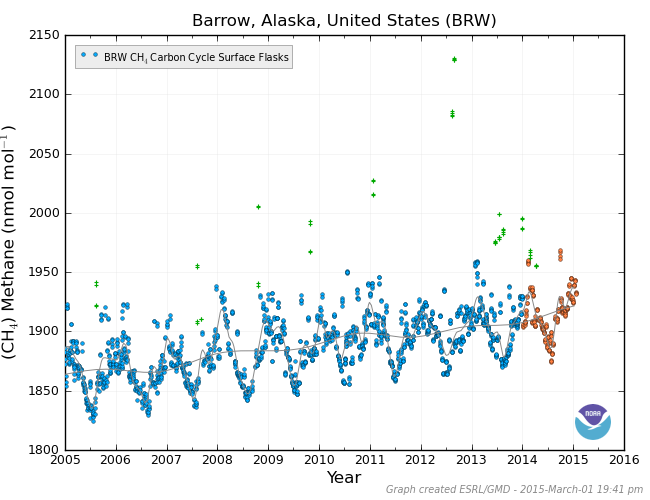
(Barrow surface methane observations by NOAA ESRL show methane readings that range about 60 ppb above the global average. Note the 50 ppb increase over the past decade coincident with numerous ‘outlier’ spikes [green cross hatches] from local sources. Image source: NOAA ESRL.)

Perhaps the most obvious sign that there’s something not quite right going on in the Arctic is a large overburden of both methane and CO2 in the region. Looking at NOAA’s ESRL site, we find that methane levels at Barrow, Alaska (one of just a handful of Arctic sensor stations in the ESRL network) are in the range of 1910 parts per billion. By comparison, NOAA’s Mauna Loa Station, on the edge of the tropics and well away from the polar overburden, records about 1850 parts per billion (ppb).

At current rates of atmospheric methane increase, it will take about 9 years for Mauna Loa to catch up to where Barrow is now. But by that time Barrow may be pushing 1970 ppb or more. In addition, all Arctic stations record numerous anomalous spikes in methane from local sources. The ESRL site lists these spikes as outliers. But, for all the ESRL reporting stations, the Arctic stations are the ones that host by far the most numerous such outliers. The local methane sources, therefore, appear to be quite active in the Arctic. An observation that polar scientist, Dr Jason Box, admits keeps him awake at night.

AIRS_Methane

(Global distribution of methane averaged over 2011 by NASA/AIRS. Note the very high concentrations in the Arctic region. For this map, the highest concentrations occur in the Yedoma region of Russia, a region of multiplying methane emitting tundra melt and Thermokarst lakes [see below]. Image source: NASA/AIRS.)

Perhaps the most reliable way to sample the Arctic methane overburden is to get a full view of it through satellite sensors. The above NASA image taken in 2011 shows a massive methane overburden in the upper latitudes that slowly diffuses southward. Note the highest concentrations in this image are near the permafrost zones in Yedoma in northeastern Russia.

NOAA also provides its METOP array which frequently finds methane concentrations at above 2400 parts per billion at the 10,000 to 20,000 foot level in broad blankets over the Arctic region — especially in the months of September through November and then again in January. Again, these measures are the highest in any region of the globe and they occur directly over the Arctic.

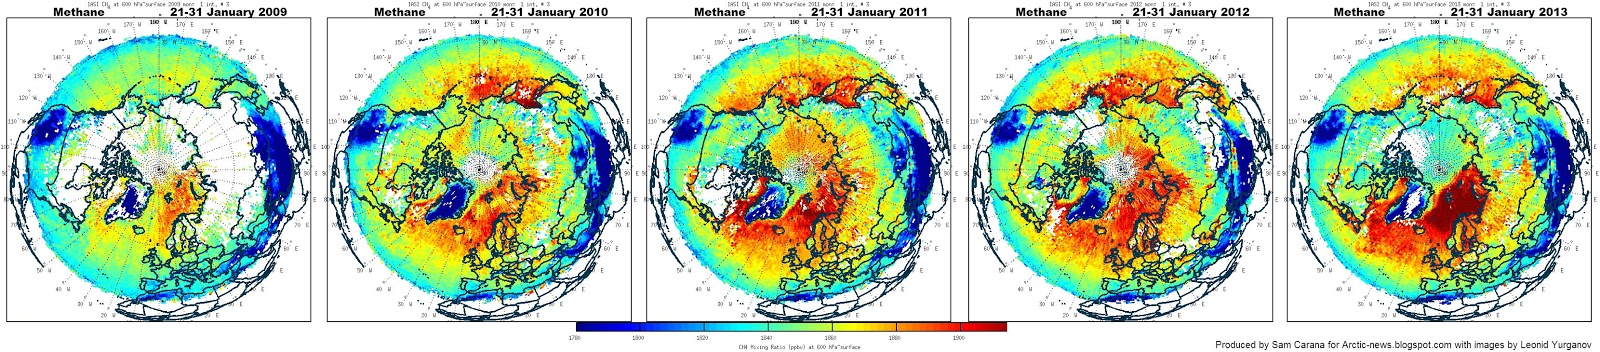
Dr. Leonid Yurgonov uses the AIRS/AQUA satellite sensor to provide a record of Arctic methane overburden. One that is clearly visible here:

methane-jan21-31

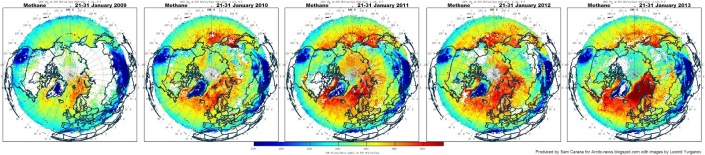
In the above image we see methane measurements at the 18,000 foot altitude above the Arctic and upper latitudes. The progression is from January of 2009 (furthest left) to January of 2013 (furthest right). Orange coloration represents methane readings in the range of 1850 to 1950 parts per billion. Deep red coloration is in the range of 2000 parts per billion. Note the shift from blues and yellows (1700-1800 ppb) to oranges and reds (1850-2000 ppb) during the five years from 2009 to 2013.

So not only does the AIRS sensor show overburden, but it also finds methane build-up over the period measured.

These combined measures alone provide more than enough evidence of a methane overburden in the far northern region together with a rate of buildup that maintains the overburden and leads the global methane measure. Cause for enough concern among Arctic researchers that they have tended to make statements like this:

The amount of methane in the Arctic hydrates alone is estimated as 400 times more than the global atmospheric CH4 burden! The question is timescale of the methane liberation: gradual, abrupt, or something in between. Satellite monitoring of methane over the Arctic Ocean is necessary! — Dr. Leonid Yurganov, AGU, 2012

Steady Increase So Far

But even if we do have both a buildup of methane in the polar region together with what looks like an ominous overburden, we should be quick to point out that the rate of increase, especially on the global scale, has been mostly steady so far.

Under any catastrophic methane release scenario, we would expect Arctic methane to rapidly jump higher, dragging the global measure along with it. In general, we’d expect almost all sensors to pick up the signal of an exponentially ramping curve. And we don’t see that as yet.

To this point, Dr. Yurganov’s statement from the 2012 AGU presentation is informative:

Current methane growth in the Arctic, including 2012, is gradual… If a sudden venting (bubbling) of methane would happen due to intense hydrates destruction, IASI would be able to detect it NRT.

Though there has been a bit of an uptick in global and Arctic methane increase rates during recent years, they have maintained about a 4-7 ppb annual increase since ending a decade-long pause from 1995 to 2005.

It is worth noting, however, that the global methane measure increasing at an exponential rate would be a trailing measure indicator — occurring only in the wake of any catastrophic or large-scale release. So, as a predictor, the global methane measure isn’t very useful.

Thermokarst Lakes 

Which brings us to the key question — what are the leading indicators of major methane releases or of catastrophic releases of the kind some have feared?

Since we have never directly observed one, and since large-scale or catastrophic releases are merely theoretical at this time, we can only point toward evidence of past large scale releases, and an ongoing, but apparently growing, smaller scale release happening now.

The first such related observation may well have come in the form of an increasing methane emission from Thermokarst Lakes. Thermokarst Lakes form when sections of permafrost thaw and collapse, creating a depression. In wet regions, water soon pools within these hollows. Organic material at the bottom of the pool is provided by thawing permafrost. In the anaerobic lake bottom environment, methane is generated as the organic material is broken down.

Over recent years, this increasingly widespread Thermokarst thaw and formation has resulted in a number of Arctic ‘fire lakes’ popping up — lakes whose methane emission is so great that bubble concentrations are high enough to burn. During winter, these bubbles are trapped beneath ice and when released, create an explosive mixture.

Thermokarst Lake

(Methane production in a thermokarst lake. Image source: The Royal Society.)

From the 1970s through the mid 2000s, it is estimated that some regions of the Arctic experienced as much as a 58 percent increase in methane release due to Thermokarst Lake formation alone. An important measure since a number of studies found that Thermokarst Lake formation was one of the primary drivers of methane release from the Arctic at the end of the last ice age.

But as a catastrophic release driver, Thermokarst Lake formation is relatively mild, even if it is capable of pushing Arctic methane release levels higher. As such, the next indicator — a discovery of large methane releases from the ocean floor in the Arctic — was somewhat more concerning.

Oceanic Plumes

For as of 2011 an expedition to the East Siberian Arctic Shelf (ESAS) found massive plumes of methane as large as 1 kilometer across emitting from the shallow sea bed region off Northeastern Siberia. The researchers, Shakhova and Similetov, seemed very concerned that this might be a sign of a potential impending large scale release on the order of 1 to possibly 50 gigatons. The methane stores for the ESAS alone were massive — in the range of hundreds of gigatons. So even a fractionally small release from this source could be devastating. For reference, a 1 gigaton release would more than double the annual methane release from all global human and natural sources. A 5 gigaton release, on its own, would be enough to more than double atmospheric methane concentrations. And since methane traps heat more than 20 times as efficiently as CO2 over a century time-scale, such a release would result in far more rapid warming than previously predicted by scientific bodies such as the IPCC. A very rapid rate of warming that would be extraordinarily difficult for human civilizations to adapt to.

Of course this announcement set off amazing controversy. We couldn’t be certain what the source of this methane was, some said. Was it submerged permafrost methane? Was it hydrate? Was it free gas methane? And how could we be certain that this release hasn’t been ongoing for some time?

If such a methane release was building up to a catastrophic event, what mechanism would be the cause? In other words, how might gigatons of methane suddenly blow up from the sea bed?

arctic-methane-concentrations-sep-nov-2009-2012

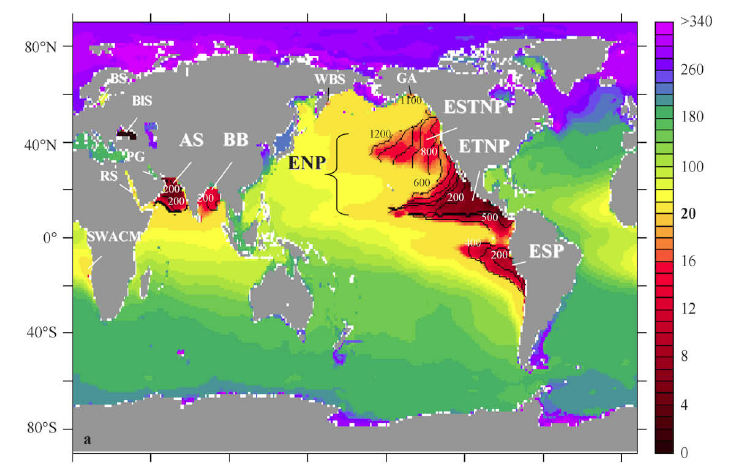
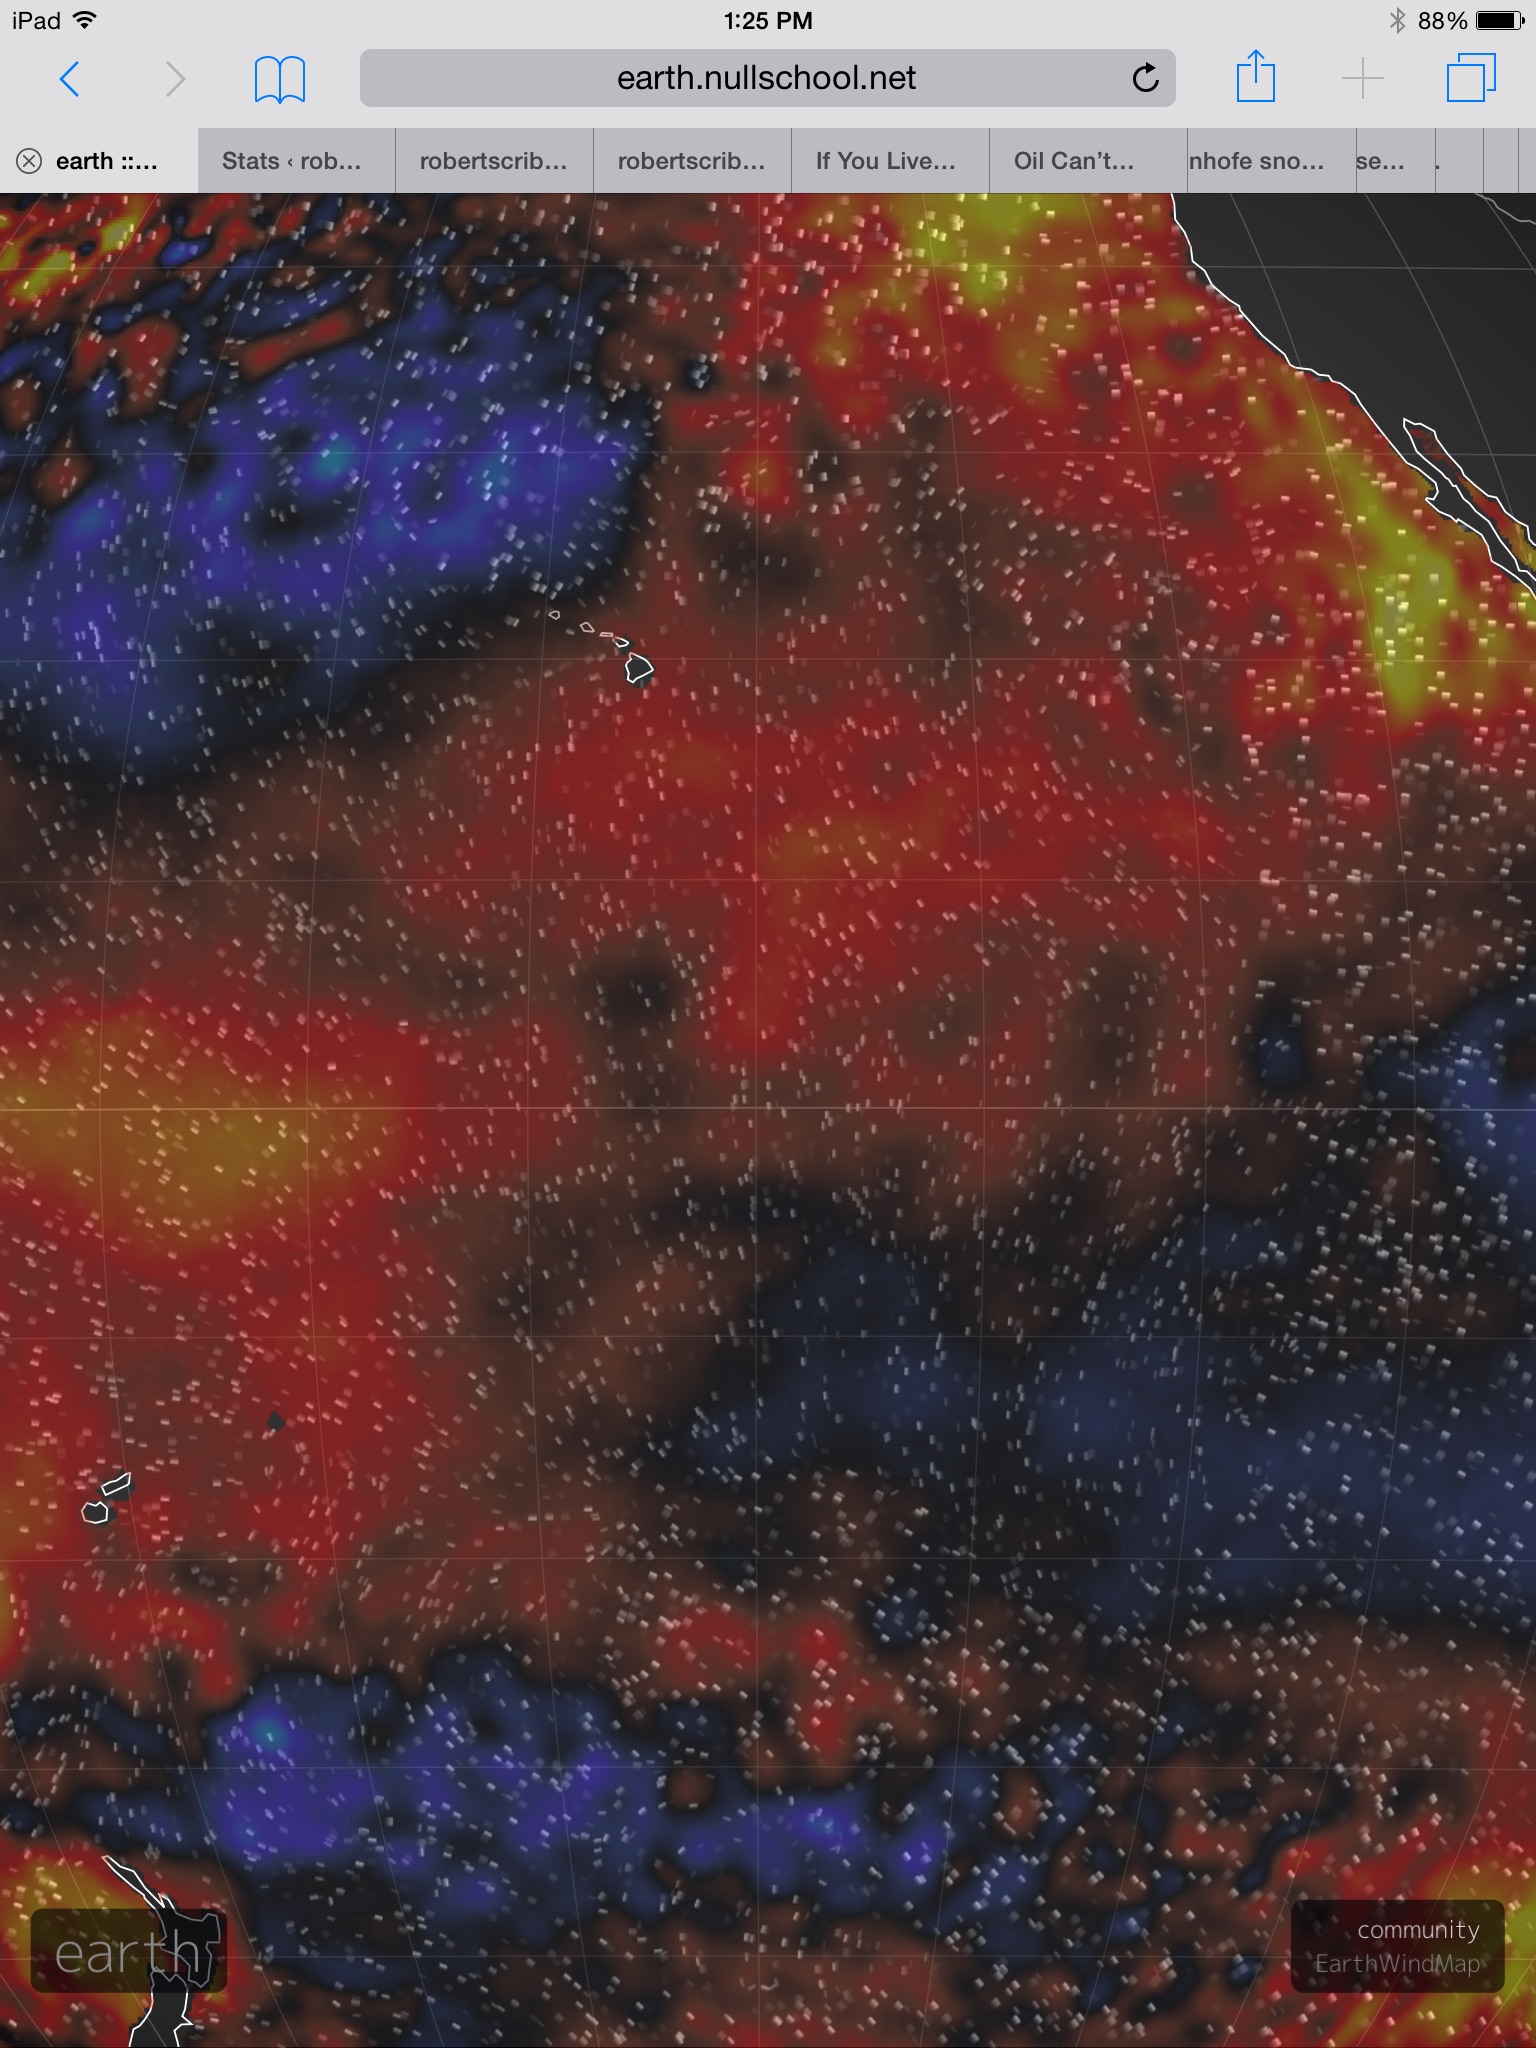
(Lower troposphere methane concentrations over the Kara, Laptev, and East Siberian Seas during September-November of 2009-2012 shows overburden in active oceanic release zones. Image source: Dr. Leonid Yurganov).

This point is worth a bit of further exploration. The issue is that the most unstable form of methane when warmed is the methane hydrate store mentioned above. Methane hydrate is a frozen combination of gas methane and water. It crystallizes into a kind of fire ice under high pressure and in low temperature environments. It typically forms about 200-600 feet below the sea bed as methane bubbling up from warmer regions below contacts seawater, high pressure and cold. If the layer is warmed under human heat forcing, the hydrate thaws releasing its gas. The gas now becomes stored in pockets under high pressure. The gas below pushes against the sea bed above and some of it bubbles out (and these releases are found in the large plumes along the ESAS and elsewhere). But most of it, so far, has remained entombed.

What, then, could cause the large stores of entombed gas releasing from destabilizing hydrate, to break through hundreds of feet of seabed — hitting first ocean water and then atmosphere?

Over the past four years conjecture over this issue has raged on. Swelling at points when Shakhova and Similetov would make a new announcement and then ebbing as a wave of reassurances would rush in from scientific critics and mainstream media.

By summer of 2014 a discovery of new, large-scale plumes in the Laptev Sea by the SWERUS C3 expedition set off another wave of media speculation and controversy. But as the dust settled it became clear that the Laptev sea floor had been added to the list of methane hot spots in the Arctic, following in the footsteps of the ESAS region as an area to watch for potential increasing rates of release.

Tundra Blowholes

In nature, gasses under high and increasing pressure often find pathways for escape. Typically, the escape is gradual — we see this in volcanic regions in the release of magma gasses through cracks in the earth and through vent pathways. And sometimes the escape is far more violent — with hot volcanic gasses blowing away even hill or mountainsides in spontaneous eruption, or bubbling out, en mass, through volcanic lakes to spill toxic plumes over a countryside.

The gas source in question for Arctic methane release — hydrate — is very large. Even at the low end, it is estimated that hundreds of gigatons of the stuff lay buried beneath frozen tundra ground or in ocean stores beneath the seabed. A gigaton is one billion tons. A billion tons of frozen hydrate would cover roughly one cubic kilometer. One cubic kilometer of a flammable gas under high pressure.

And in the Arctic, hundreds of billions of tons lay under rapidly warming permafrost both on land and in the submerged seabed.

Permafrost and Gas Hydrate Methane

(Graphic of permafrost and gas hydrate methane by Carolyn Ruppel. Note that 75 percent of the ESAS sea floor is in the range of 50 meters in depth or shallower and that buried hydrate deposits can be found in the range of 200-300 feet. Image source: Methane Hydrates and Contemporary Climate Change.)

As of 2011, some scientists were warning that we were seeing a slow release from some of this submerged hydrate store in the ESAS. By 2014, the potential slow release had expanded into the Laptev Sea.

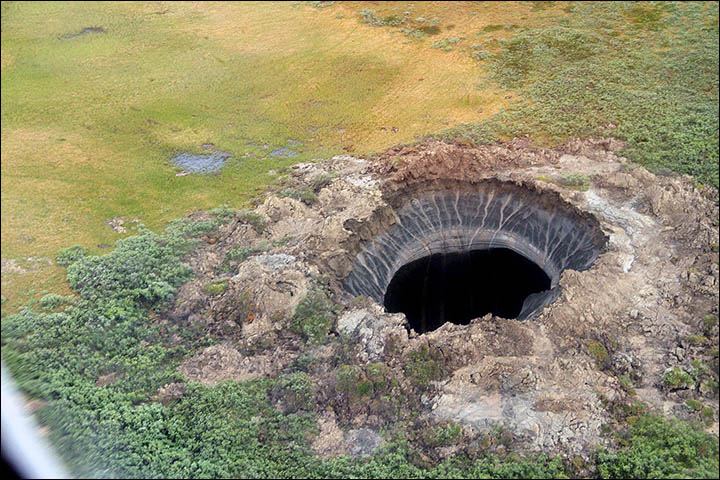
But that year, 2014, also saw something else. A potential catastrophic release of methane. For in the frozen region of Yamal, Russia the earth near a remote Siberian village began to destabilize. Soon after, according to eyewitness accounts, the area began to smoke. Then, with a bright flash, the ground erupted.

When the smoke cleared, a massive crater was found where only flat, frozen tundra was there before. A giant plug of frozen earth had been ejected violently. And all that remained was an ominous gray-black crater.

Yamal crater

(Yamal Crater as seen from the air. Image source: The Siberian Times.)

Researchers investigating the crater found 10 percent atmospheric methane concentrations at its base.

Overall, it was estimated that about 11 tons of TNT equivalent explosive force was enough to remove this 100+ foot wide and 220 foot deep plug from the Earth. Exploding and burning methane in the range of about 10 tons would have been enough to generate the crater. Gas under high pressure in the hundred + ton range may have been able to explosively excavate this hole.

As a result, the amount of methane in question for this single event was relatively small, especially when one considers the hundreds of billions of tons in the still frozen store.

It appeared that the rapidly warming Yamal territory and a broad region of nearby Northwestern Siberia may be seeing tundra warming extending deep enough to begin to destabilize pockets of relic hydrate. The hydrate in some of these pockets was beginning to thaw and catastrophically erupt to the surface.

By early 2015 a total of seven primary craters and scores of secondary craters of this kind had been discovered throughout this section of Siberia. Local Russian authorities were very concerned — moving seismographs into the area to monitor ground stability in a region that includes one of their largest natural gas developments.

A large upheaval of this kind in the wrong place would easily rupture a pipeline or destroy sections of a gas production operation. But the deeper irony was that continued gas production in this region was contributing to a problem that may well be making the ground far, far less stable and setting up the risk for even larger-scale eruptions.

For the Yamal crater wasn’t important due to the relative size of its methane release — the release was very small in the global context. A mere drop in an ocean of greenhouse gasses being emitted now by humans. It was important due to two other, and perhaps more stark, reasons.

The first was the very violent nature of its release — an eruption similar to that of a volcano — represented a severe geophysical upheaval that was all too likely triggered by a rapid human warming of the tundra. This kind of release, as the Russians in the region were quick to realize, represented a danger to both inhabitants and to infrastructure.

But the second reason is, perhaps, more important. It is the fact that the Yamal crater may well be evidence of the kind of mechanism for catastrophic methane release some of the more conservative scientists have been demanding. It’s possible, then, that the Yamal crater is in microcosm, what a truly catastrophic methane release might look like on the much larger scale. And the critical question to ask here is — could there be a connection between the methane blowholes we are now observing in the Arctic and a number of mysterious and gigantic craters discovered on the sea bed around the world?

Giant Craters on the Seabed

In 2013, marine geophysicist Dr Bryan Davy from GNS Science found what may be the world’s largest gas eruption craters on the seafloor about 310 miles east of Christchurch, New Zealand.

The craters, which the researchers called ‘pockmarks,’ formed in an active gas zone along the ocean bottom. They measured from 250 meters to 7 miles in diameter and about 300 feet deep. With the largest crater able to encompass all of lower Manhattan.

Giant Craters in the Seafloor off Christchurch New Zealand

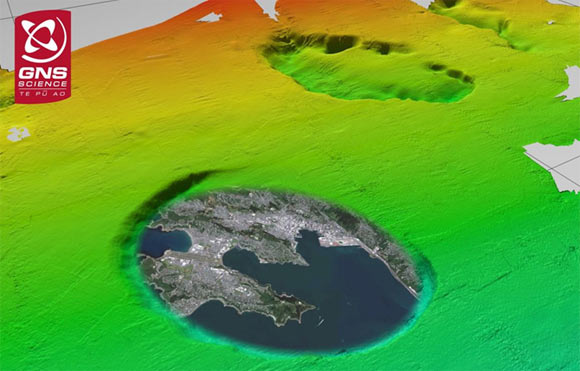
(Giant craters off Christchurch New Zealand are thought to have formed due to large gas eruptions during previous episodes of sea bed warming. Could human warming set be setting off something similar for the Arctic? Image source: Mysterious Giant Crater Like Structure Found Near New Zealand.)

The craters are thought to have formed during ice ages when sea levels lowered off New Zealand causing the sea bed to warm and gas hydrate to thaw. Eventually, the gas is thought to have erupted into the surrounding water with a portion bubbling up into the atmosphere.

GEOMAR seismic records indicated active gas pockets beneath the crater zones. Dr Joerg Bialas, a GEOMAR scientist noted:

Gas release from the larger pockmarks may have been sudden and possibly even violent, with a massive volume being expelled into the ocean and atmosphere within hours or days.

The 300 foot depth of the craters touched the hydrate stability zone even as their large size indicated that massive pockets of the gas lifted away large sections of sea bed suddenly and violently. It’s the kind of rapid destabilized gas release that may well represent a worst-case Arctic warming scenario.

Cause for Appropriate Concern

So the question must be asked — is the Yamal crater physical validation of a catastrophic methane hydrate release mechanism that has circulated, as theory, through the geophysical sciences for decades? One that involves large eruptions that displace massive sections of earth and seabed during a violent release process. Are the Siberian methane blowholes smaller examples of what can happen on a much greater scale? And does the methane overburden in the Arctic, the documented increasing Thermokarst Lake release, the sea bed methane release in the Laptev and ESAS, and the new formation of methane blow holes in Yamal in the context of a rapidly warming Arctic tundra and sea bed (seeing unprecedented rates of warming) represent a growing risk for this kind of release?

Under even a ‘moderate’ 1 to 3.5 gigaton Arctic carbon release rate by end century given by the survey of 100 Arctic scientists, there will likely be more than enough potential freed methane to include large scale catastrophic releases similar to the kind seen off New Zealand and elsewhere (250 meter to 7 mile wide cratering events).

In this context, the issue is not one of ‘apocalypse now’ or ‘apocalypse not.’ That framing is all wrong. This issue is one of how much or how little geophysical upheaval and related methane release we will see — and how soon. One of how rapidly humans can stop making the situation even worse, by drawing down their own catastrophic emission rates as rapidly as possible.

There is, therefore, more than enough cause for appropriate concern and continued monitoring of what appears to be an ongoing destabilization of Arctic carbon stores — large enough to represent a variety of hazards both terrestrial and atmospheric.

Links:

High Risk of Permafrost Thaw

NOAA ESRL

NASA/AIRS

The Royal Society

Yedoma Thermokarst Lake Formation Increases Tundra Methane Release by 58 Percent

Methane Hydrates and Contemporary Climate Change

The Siberian Times

Meltfactor: Dragon’s Breath Hypothesis

AGU 2012 Meeting: Atmospheric Methane Over The Arctic Ocean

Mysterious Giant Crater Like Structure Found Near New Zealand

Scientific hat tips to Dr. Leonid Yerganov, Dr. Gavin Schmidt, Dr. David Archer, Dr. Igor Semiletov, Dr. Natalia Shakhova, Dr. Carolyn Ruppel, Dr. Jason Box, Dr. Peter Wadhams, Dr. Bryan Davy, Dr Joerg Bialas, SWERUS C3, GEOMAR and The Russian Center of Arctic Exploration

“Dramatic Thinning” — Arctic Sea Ice Enters Record Low Territory as Northern Polar Region Heats Up

The Arctic sea ice is melting. It is melting far more rapidly than ever expected.

This loss is measured in the form of square kilometers melted, in the form of ice thinned, in the form of new, blue water visible. Yet it is a loss beyond mere numbers and measures. A loss that has a profound impact to the Earth and its climate systems.

Weather patterns, the rate of warming in the Arctic, the rate of tundra melt, seabed warming, and carbon store release. The rate of glacial loss in Greenland. All are impacted by sea ice loss and related ocean warming.

And today, we mark another new record low. The most recent in a long series, with likely many more thinning ice days to come.

*   *   *   *

Earlier this week there were indications that Arctic sea ice extent may begin exploring new record low values in the Wednesday through Friday timeframe. And the March 4 measure finds NSIDC values sliding below previous records for the date set just 8 years ago.

Ever since Monday, extent values have been falling by an average rate of 10,000 square kilometers each day. A steady progression of warm air fronts through the Barents coupled with well above average temperatures in the Bering and near Alaska region have generated heat pressure along the ice edge and well into the Central Arctic.

As of today, we have extreme temperature departures in the range of +20 degrees Celsius above average in the Barents northward through to the polar zone. From the Bering through Alaska and into the Southern Beaufort near the Mackenzie Delta departures are in the range of +5 to +20 C above average.

global surface temperature anomaly March 5

(Polar amplification seen ramping up today in the GFS model analysis provided by Climate Reanalyzer. Exceptional warming of +20 above average occurred in vulnerable sea ice edge regions as extent values dropped to new record lows. Image source: The University of Maine’s Climate Reanalyzer)

These two hot spots, together with another warm pool over Greenland have shoved the Arctic, as a whole, into the +2 C range. A rather high departure that is only forecast to worsen in the GFS model summary over the coming days.

The added warmth, wind, and waves in these ice edge regions drove these extent losses and now, as of Wednesday, values had fallen to 14,383,000 square kilometers. By comparison the previous record low for the day in 2006 was 14,411,000 square kilometers, so the new record is 28,000 square kilometers lower. An area approximately the size of the State of Maryland. 2011 now comes in as third lowest for the day at 14,451,000 square kilometers or 68,000 square kilometers above the 2015 value.

Go back 30 years and the contrast is even more stunning with 1979 extent values for March 4 at 16,514,000 square kilometers. This places the new record fully 2,131,000 square kilometers lower than sea ice extent measures for the same date 36 years ago. A total loss of ice coverage roughly equal to Greenland (2,166,000 square kilometers).

chart(2)

(Sea ice extent for March 5 of 2015 [bottom blue line] drops to record low levels in the NSIDC measure. The other record low years for the date — 2006 [pink] and 2011 [orange] — are provided for reference along with 1979 [top blue line]. Image source: National Snow and Ice Data Center.)

But given the current time of year, a period where ice at low levels has tended to rebound, and given the fact that we are facing growing warmth in key ice edge regions, there is risk that record losses will continue to mount over the coming days.

GFS forecast models show warm fronts continuing to advance along a very strong south to north wind pattern stretching across most of the Atlantic. A wind pattern that today pulls tropical air off the underbelly of a high pressure system just north of Jamaica, funnels this warm air north and eastward over the currents of the Gulf Stream, dumps the flow into a raging low pressure (at 950 mb) just south of Greenland which then shoves the flow into a gale raging north of Scandinavia and south of Svalbard. A strong warm frontal boundary following in the wake of the most recent warm air invasion that, yesterday, swept past the pole.

It’s a meridional pattern stretching from 20 North Latitude in the Tropical Atlantic all the way to 90 North Latitude at the pole. One that features a contiguous frontal boundary stretching from Yucatan Mexico to halfway between Svalbard and Iceland along a daisy chain of lows south and east of Greenland. A flow that is complicit in both melt along the borders of the Barents and ice thinning in the Kara and on past the 80 North Latitude line in the Arctic Ocean.

image

(Amazingly vast frontal system and meridional pattern stretching from the Gulf of Mexico and Caribbean, across the North Atlantic and on into the Arctic. Reference point at 55.6 N and 34.6 W shows storm force winds proceeding almost due south to north. Screen capture in real time at 2:51 PM EST March 5, 2015. Image source: Earth Nullschool. Data  Source: Global Forecast System Model.)

This fire hose of warm air pouring up from the Atlantic will intensify over coming days as it fills the bowl of the Barents with heat, which GFS is predicting will balloon northward over the pole. By Sunday the temperature departures are predicted to peak in an extreme +4 C for the entire Arctic.

Most of the heat fueling this departure will come from the warm air invasion over the Atlantic Ocean zone. A secondary, but also very intense temperature departure is predicted to emerge along the Jet Stream ridge pattern stretching to the Mackenzie Delta region. There temperatures will also show isolated spikes in the +20 C above the 1979-2000 average range.

For the sea ice, such departures are very bad timing — hitting vulnerable regions hard just prior to traditional melt season start and possibly developing a rather low launching pad for the 2015 melt season. As such, there is high risk for continuing and expanding record lows for sea ice extent over at least the next five days.

Arctic heat spike

(Global Forecast System Model surface temperature anomaly forecast for Sunday, March 8 shows polar amplification ramping up to an extraordinary +3.99 C for the entire Arctic. Note the extreme positive temperature departures in a very large zone north of the Barents and in the Central Arctic Basin as well as the somewhat smaller but still extreme area of much warmer than normal temperatures over the Mackenzie Delta region. Image source: The University of Maine’s Climate Reanalyzer.)

New Record Lows Amidst Dramatic Thinning

The most recent record lows and threat of these low measures deepening come amidst new scientific reports finding an ominous and extreme thinning of sea ice in the Central Arctic Ocean near the pole. The study found that between 1975 and 2012 Central Arctic Sea Ice thinned from 11.7 feet to 4.1 feet.

Such thinning represents a loss of fully 65 percent of the sea ice volume for the Central Arctic Ocean over this period. But yearly average sea ice thinning paled in comparison to losses seen during September. For that month, sea ice thickness plunged from 9.8 feet to merely 1.4 feet — a stunning drop of 85% over the 37 years of measurements.

Study Author Ron Lindsay of the Applied Physics Lab at UW notes:

“The ice is thinning dramatically. We knew the ice was thinning, but we now have additional confirmation on how fast, and we can see that it’s not slowing down.”

Axel Schweiger, a polar scientist and contributor to the UW study added:

At least for the central Arctic basin, even our most drastic thinning estimate was slower than measured by these observations.”

A 1.4 foot average sea ice thickness for September is very thin. Tissue paper thin when it comes to sea ice. And the 4.1 foot yearly average isn’t much better. A fragile skein vulnerable to the continued assault of elemental heat we keep driving into the Arctic. Given this major loss, noted fragility, and ongoing exploration of record low values, risks for blue ocean events in this region are on the rise.

*   *   *   *

UPDATE: On March 5, 2015 new record extent lows deepened in the NSIDC measure. By that date extent measures had fallen another 25,000 square kilometers to 14,358,000. The drop deepens losses and widens the gap between 2006 (second lowest on record) and 2015 to 74,000 square kilometers — or an area roughly the size of South Carolina.

Conditions — major heat build up along the ice edge zones, especially in the Barents region — continue to favor suppressed and reduced sea ice levels over the coming days. Updates on this evolving sensitive situation near the start of melt season will continue.

Links:

National Snow and Ice Data Center

The University of Maine’s Climate Reanalyzer

Global Forecast System Model

Earth Nullschool

Arctic Sea Ice Thinning Dramatically

Arctic Sea Ice Flirts with New Record Lows

Hat Tips:

Scientific Hat tip to Ron Lindsay and Axel Schweiger

Scientific Hat tip to the UW applied Physics research team

The Arctic Sea Ice Blog

Kevin Jones

Colorado Bob

2015 El Nino to Bring Back-to-Back Hottest Years on Record?

For the past six months, the Pacific Ocean has been very, very warm. A vast and unsettling expanse of record heat building from the tropics on through the mid lattitudes and into the Arctic.

Sea surface temperatures across a broad swath of ocean from the equator on north and eastward have consistently measured between 0.5 and 5 degrees Celsius above average. A lazy reverse C pattern of heat stretching from the equator running up along the west coast of North America and then re-curving westward just south of the polar zone.

It is a pattern that is indicative of a well developed positive phase Pacific Decadal Oscillation. A kind of pattern that results in very warm sea surface temperatures for much of the Pacific. And a pattern that tends to favor the formation of El Nino.

As of December 2014, PDO values had climbed to their highest on record. And with these high sea surface temperature values related to PDO, the Pacific also seemed to be quietly settling into what, at first, appeared to be a mild El Nino.

Chances For 2015 El Nino Rise

The key value for El Nino is a measurement for sea surface temperatures along a region of the Central Equatorial Pacific known as Nino 3.4. Stretching from about 160 West to 120 West Longitude, this expansive zone of ocean waters below Hawaii tends to warm with the onset of El Nino.

image

(Nino 3.4 zone in center of frame on the Earth Nullschool Sea Surface Temperature anomaly map for March 4, 2015 shows warm waters again building in the Central Pacific. Averages in the zone for this date are around +0.75 C above normal. Note the + 2 C hot pool just to the western edge of the zone [orange-yellow coloration] and the +4 C hot pools [yellow coloration] off the US West Coast. Image source: Earth Nullschool. Data Source: Global Forecast Systems Model.)

The threshold NOAA uses to determine El Nino is a sea surface temperature anomaly for this area of +0.5 degrees C above average. And ever since September of 2014, sea surface temperatures have been hovering above the +0.5 C line.

NOAA’s determination for El Nino requires 5 three month average periods in which Nino 3.4 exceeds this mark. And it looks like, so far, four out of five of those periods have met the El Nino requirement. September, October and November (SON) averaged +0.5 C. October, November and December (OND) averaged +0.7 C. And November, December and January (NDJ) averaged +0.7 C. With all weekly measures for February coming in near or above January values, it appears the DJF value will post somewhere near +0.6 C (please see NOAA’s Weekly ENSO Status Report).

Even if March values dropped to +0.4 C, a weak El Nino would emerge in the Pacific during Spring of 2015. However, sea surface temperatures for this zone are not falling as we enter March. They are instead ramping higher.

New Warm Kelvin Wave Forming

For beneath the Central Pacific a new pool of warm water is forming. It is rising to the surface, providing yet another shot of heat to an equatorial region teetering on the threshold of El Nino. A new Kelvin Wave that carries with it more than enough energy to tip the scales for a 2015 event:

El Nino Kelvin Wave

(Warm Kelvin Wave again forming in the Pacific. This event will likely be enough to push 2015 into El Nino. Image source: NOAA/CPC.)

The Kelvin Wave will slowly rise to the surface, elongate and transfer some of its latent heat to the sea surface and atmosphere. Driving this Kelvin Wave along are west wind backbursts that today were in the range of 25 mph sustained with gusts to 35. These gusts are continuing to drive warm water eastward and downward, providing more energy for the Kelvin Wave as well as any emerging El Nino. A set of winds that could well grow stronger as a weather pattern know as the Madden Julian Oscillation (MJO) is predicted to ramp up, bringing stormy weather and more counter trade wind air flows across the Western Pacific equatorial zone.

These combined factors have spurred Australia’s Bureau of Meteorology to post a renewed El Nino Watch. NOAA is also showing a heightened chance for El Nino, with a near 60% probability for the event emerging late winter or early spring.

Meanwhile, some models for the Nino 3.4 region show continued warming along with a heightening El Nino throughout 2015:

2015 El Nino

(BoM Nino 3.4 sea surface temperature anomaly (SSTA) prediction model shows El Nino building throughout 2015. Note that the Australia BoM SSTA threshold is +0.8 C for Nino 3.4 while NOAA’s threshold is SSTA in excess of +0.5 C for seven months running. Image source: Bureau of Meterology.)

Back-to-Back Record Hot Years?

The +1.9 C peak and rising prediction for Nino 3.4 in the above graphic is indicative of a relatively strong El Nino by mid November of this year (for reference, the 1998 Super El Nino peaked at around +2.3 C for this region while 2010 peaked at +1.5 C). But even a far milder El Nino would likely have far-ranging consequences, especially in a world that has been pushed to keep warming and warming by the massive human fossil fuel emission.

All that heat again building along the equatorial Pacific would likely shove the Earth’s oceans and atmospheres again above record thresholds. And that would mean that 2014’s record as the hottest year for the Earth’s surface may only stand for but a few seasons more.

The risks for another record hot year for 2015 are, therefore, again rising.

UPDATE:

As of March 5, 2014, NOAA has now officially declared weak El Nino conditions for the Equatorial Pacific. Please see this related discussion LINK.

Links:

Bad Climate Outcomes

NOAA’s Weekly ENSO Status Report

NOAA/CPC

Australia’s Bureau of Meterology

Earth Nullschool

Global Forecast Systems Model

Madden Julian Oscillation (MJO)

Hat Tips:

Colorado Bob

Phil

Scientific Hat tip to Kevin Trenberth and Michael Mann

Wili

If You Live in Arizona, Salt River Project Wants You Shackled to Fossil Fuels For Decades to Come

Remove all the empowerment. All the individual benefit and pride that comes from owning your own energy-producing resource. Remove all the financial benefit — all of the increasing opportunities for middle class families to cut energy costs, to increase property values, and to expand their economic opportunities. Remove all the added benefit of expanding US energy independence — both for the US nation and for individuals.

Remove it all, and you still end up with the staggering singular opportunity that home solar energy generation provides — to cut individual and family carbon emissions through electricity generation to net zero.

Arizona-Solar-Energy

(Solar neighborhoods like these are popping up all over Arizona. Monopoly utility Salt River Project wants to stop that through the imposition of fees. Image source: GOYO.)

It’s a staggering empowerment in that it gives each and every homeowner the opportunity to say no to a future in which the world is dragged further and further into a global warming nightmare. It’s a right. In essence, a basic human right, to be given a choice to avoid such a terrible outcome and to play a personal role in making responsible choices for the future benefit of ourselves, our spouses, our children.

And, just a few days ago, a major Arizona utility — the state-sanctioned monopoly Salt River Project — did everything they could to take that choice away from homeowners. To shackle them, for decades, to devastating, carbon-emitting energy sources.

The Salt River Project — Green Washed, Carbon Fueled

The Salt River Project is an old, mostly smoke-stack driven, utility. Having existed for more than 100 years, it now provides power for more than 1 million customers — primarily in the Phoenix metro area.

Of the power SRP generates, about 85 percent comes from dirty sources. Though hydroelectric dams are among its assets, though solar energy accounts for 120 megawatts of its generation, though wind accounts for about the same, SRP is primarily powered by fossil fuel sources. It owns stakes in nine massive fossil fuel generating stations — half of which are coal, the other half gas. As a result, SRP is responsible for many millions of tons of carbon emissions each year. All emissions it generates and dumps into the atmosphere — scot-free of costs for the harm it is continuing to inflict on the world’s atmosphere, oceans, glaciers, and weather.

Coal power plant SRP

(The Four Corners coal power plant and associated strip mine — one of many coal plants operated wholly or in part by SRP. SRP’s stifling of renewable energy adoption by homeowners would ensure the continued use of dirty plants like this for decades to come. SRP pays nothing for the harm plants like these inflict on the global climate system. Image source: High County News.)

But all this damage doesn’t come without its own share of greenwash. The Salt River Project touts goals of reaching 20 percent renewable capacity by 2020. It also hosts a home solar project which funds 12.5 megawatts of solar energy capacity for the current year (May 1 2014 to April 30 2015). A rate of adoption that would take 300 years to remove its fossil fuel generation even if energy consumption levels remained flat.

At best, given the amazing achievements of renewable energy on cost, ease of use, and access (especially for wind and solar), the energy transition efforts by Salt River Project (SRP) can be described as foot-dragging. An effort far too paltry and slow to be an effective mitigation to the damage resulting from human-caused climate change.

The glacial pace of energy transition for this massive utility is bad enough on its own. But, even worse, SRP has leveled one of the most heinous attacks on individual renewable energy ownership now ongoing in the United States. And it is with this action that it has basically nullified even the paltry progress it has made toward reducing carbon emissions from its own generation sources.

A State-Supported Monopoly Assaulting Home Solar Ownership

For as of this year, SRP has decided to levy a $50 monthly fee (we could well call it a fossil fueled tax of 600 dollars per year) on home solar owners for use of grid services. The fee directly targets home solar users for discrimination, penalizing them for their choice of power source.

The fee is so high as to have stifled solar energy adoption in the Salt River Project territory. Last year, users in the SRP grid region installed nearly 40 megawatts of home solar energy (four times that proposed by SRP). This year, installations could have hit as high as 60 megawatts or more — equaling half the total SRP solar generation capacity installed within just one year.

But rumor of the fee alone was enough to snuff out new solar adoption. The monthly rate of installation swiftly fell from more than 600 homes per month last year, to less than 10 per month this year.

Though Salt River Project is not alone in adding ‘grid maintenance fees’ for solar energy users, it is the first to set the fee high enough to stifle solar energy adoption. Other fees range from 5-25 dollars per month — well less than half what SRP charges and the net effect has not been so great as to reduce solar adoption. Arizona Public Service, for example, leveled a 5 dollar fee and home solar adoption has continued at the rate of nearly 8,000 per year in its region of control.

Homeowners in the SRP region simply have no other choice. SRP is the only grid services provider. And its policies, as a government-private partnership, are sanctioned by Arizona state legislation. SRP has thus used its monopoly status to snuff out individual solar adoption in its area of operation. And this, in itself, is an egregious stifling of the individual rights of energy choice and energy freedom.

Lawsuits, Massive Public Backlash

Salt River Project’s suppressive action is already very unpopular. At the board meeting in which solar fees were assigned an angry crowd of over 500 people gathered. As SRP announced decisions on solar fees, they were met with loud boos from constituents.

But the stifling of public solar adoption hasn’t just inflamed the grass roots — it’s also bringing some of the heaviest hitting solar corporations and public alliances into the ring. Today, Elon Musk’s Solar City Corporation joined Solar Alliance (a solar interest consortium) in suing SRP for anti-trust violations. The Solar City statement is one of historic significance and reads as follows:

Last Thursday, [SRP] approved a new pricing plan designed to punish customers who choose to go solar. Under the new plan, SRP customers who generate their own power have to pay additional ‘distribution charges’ and ‘demand charges’ that other SRP customers do not. These discriminatory penalties add up to hundreds of dollars per year, and make a competitive rooftop solar business impossible within SRP territory . . . SRP has sabotaged the ability of Arizona consumers to make this choice if they happen to live in SRP territory. We can already see the intended effects: After the effective date of SRP’s new plan (December 8 of last year), applications for rooftop solar in SRP territory fell by 96%. (Emphasis Added).

Recent filings by Solar City and Solar Alliance are likely the first of many. For SRP’s action is so egregious as to materially impact anyone who previously desired or planned to install solar, effectively removing their economic ability to do so.

Such removal of choice is anti-competitive by nature and will likely end up with SRP facing off not only against environmentalists, Tea Party activists interested in individual energy choice, solar leasers, installers, financiers and homeowners alike, but also against the US Department of Justice’s Anti-Trust Division.

Like SRP, many utilities hold but often do not so punitively wield monopoly powers over their regions of control. The current struggle by SRP to suppress home solar energy adoption highlights a potential abuse of power by many utilities going forward. Utilities are, therefore put on notice, solar energy providers and users will not be bullied by fossil fuel special interests into reducing adoption rates. Any actions to suppress adoption are anti-competitive and amoral. They will be challenged accordingly.

Links:

Arizona’s New Solar Charge ‘Unsupportable by any Economic Analysis’

Solar City Sues Arizona Utility for Antitrust Violations

Rooftop Billing Issues Far From Settled

The Salt River Project: Commons

Arctic Sea Ice Flirts With New Record Lows Dragging Global Coverage Inexorably Down

It’s another winter of far above average temperatures for the Arctic.

Warm air has risen — south to north — over both the North Atlantic and Pacific. It has ridden through the Bering and Barents seas. And it has invaded an Arctic sea ice pack that is far, far more fragile than it has ever been in modern human reckoning.

image

(A parade of warm fronts predicted to run up through the North Atlantic and Barents between Greenland and Northern Europe and on up into the Arctic Ocean on Thursday, March 5. The warm fronts are indicated by regions of perpendicular wind flow across the meridional pattern running northward from the Eastern Seaboard of North America and on into the Arctic. It is a pattern we’ve seen frequently throughout the winter of 2014-2015. One that has resulted both in Arctic warming and extreme polar vortex excursions. Image source: Earth Nullschool. Data Source: Global Forecast Systems Model.)

The winds have been fed by the warmest ocean surface temperatures ever seen in the aftermath of the hottest year on record (2014). They have pushed against ice packs off Irkutsk in Russia. They have driven ice northward and melted it throughout the Bering. And they have pushed 10-20 foot waves against the ice along the coasts of Greenland, in the Strait near Svalbard, and in the Barents west of Novaya Zemlya.

Near Record Low Arctic Sea Ice

This warm air influx has had a strong effect on the sea ice. Even in the far north near the pole, sea ice has been occasionally observed to thin this winter, reaching 80-90 percent concentration in a broad patch just south of the pole. Marked thinning for an area from which thicker, multi-year ice has undergone an extended retreat and 2 meter thick ice is now the mainstay. A mere shadow of ice for a region that once featured great hills and mounds of stable ice bounded by bridges between the North American and Asian Continents.

Now, over the greatly thinned and reduced ice, periods when temperatures have neared or even exceeded the point at which sea ice melts (28 F) have become more and more common in a broad wedge covering the Arctic Ocean between Novaya and the pole itself. When combined with the warm waters continuing to invade the Arctic Ocean from the flanks and from below, it’s enough to have again pushed sea ice to near record low extents for this time of year:

chart

(Arctic sea ice extent for March 1 of 2015 shown by the purple line sandwiched between the orange line [2011] and the pink line [2006]. Yesterday’s sea ice extent was second lowest in the record with 2006 being the lowest and 2011 running in as third lowest for the date. 2012 [dotted green], 2007 [light blue] and 1979 [dark blue] were added for reference. Image source: NSIDC.)

At the current measure of 14,450,000 square kilometers, that’s well less than what we’ve seen during previous decades. More than 2,000,000 square kilometers, or about an area the size of Greenland, less than 1979’s extent for March 1, for example.

And the total could well go lower — testing new record ranges for early March. For the Arctic is about to see another major influx of warm air.

Starting tomorrow and through Saturday, warm southerly winds will ride up into both the Bering and through the Barents side of the Arctic Ocean east of Novaya Zemlya. The warm air influx will be strongest through the Barents region, pushing temperatures as warm as 30 F to withing 200 miles of the North Pole:

image image

(Forecast for Wednesday finds 30 F temperatures riding up through the Barents and deep into the Arctic Ocean to within 200 miles of the North Pole. Note that similar temperatures appear in Ohio on the same day in the second frame. Image source: Earth Nullschool. Data source: Global Forecast Systems Model.)

For comparison Ohio, many hundreds of miles to the south and well outside the Arctic, will see the same reading at the same time. It’s another major warm air influx that will again drive against the ice pack. A continuation of a decades long assault that will bring with it further threat of record lows in Arctic sea ice. One that could set the 2015 melt season up for a rather low launching pad if the major gains seen during this time of year in 2012, 2013, and 2014 don’t manage to materialize.

NASA Study Finds 35,000 Square Kilometers of Sea Ice Lost Each Year Globally

As Arctic sea ice faces the potential for new all-time lows, a recently released NASA study puts these losses in a global context.

This important broader assessment shows that both Arctic sea ice loss and global sea ice loss since 1979 has followed an unequivocal trend of thinning and recession. This ongoing loss is despite the fact that Antarctica has seen some minor gains in sea ice extent during that same period.

Claire Parkinson, author of the study, noted:

“Even though Antarctic sea ice reached a new record maximum this past September, global sea ice is still decreasing. That’s because the decreases in Arctic sea ice far exceed the increases in Antarctic sea ice.”

A graphic illustration of sea ice trends shows how rates of global and Arctic decline compare when adding in the slight and far more gradual sea ice gains occurring near Antarctica:

polar_trend_graphs_1979-2013

(NASA Polar Trend Graph shows Arctic, Antarctic, and combined global sea ice trends. Note the slight gain for Antarctica as compared to a precipitous fall for the Arctic even as the global trend shows a marked downswing. Image source: NASA.)

Massive losses in the Arctic are likely due to the fact that the sea ice there sits upon a warming ocean surrounded by warming continents. By contrast, Antarctic sea ice sits in the Southern Ocean whose surface waters are often cooled both by winds and by an increasing outflow of cold, fresh water from the melting Antarctic glaciers. Factors that serve as a minor surface counter-trend to the larger warming signal. A signal, that for Antarctica, is driving an assault of warm water at the ice sheets from the depth of hundreds of feet below the ocean surface.

Overall, the Arctic has lost of an average of 2 million square kilometers since 1979. Antarctic gains of about 700,000 square kilometers are enough to result in a global loss of around 1.3 million square kilometers over the period. That’s equal to about 35,000 square kilometers lost each year or an area the size of the State of Maryland.

Finally, it’s important to note that recent studies have shown (as hinted at above) that sea ice gain around Antarctica is being driven by cold water and ice berg outflows ramping up as the great glaciers of Antarctica increase their melt rates. The melt, which is driven by a pool of warm water expanding hundreds of feet beneath the ocean surface and at the base of ice sheets and ice shelves is creating a kind of heat conveyor which spreads cool water along the surface even as it pulls more warm water in from underneath.

So it appears even the slight ice gain for Antarctica has a connection to human caused warming. One that is even more ominously linked to an exponentially ramping rate of land ice loss from Antarctica itself.

Links:

NSIDC

NASA: Global Sea Ice Diminishing, Despite Antarctic Gains

Earth Nullschool

Global Forecast Systems Model

Expanding Arctic Sea Ice is Flooding Warning Bell

Cryosat Shows Rate of Antarctic Land Ice Loss Doubled During Last Decade

Hat Tips:

The Arctic Sea Ice Blog

Anna

Dnem