Starving Sea Lion Pups and Liquified Starfish — How We’ve Turned the Eastern Pacific into A Death Trap for Marine Species

As of late January, the news reports were coming in hot and heavy. Baby sea lions were dying in droves. More than 15,000 of the pups were already lost due to starvation. And with each passing week, more than 100 of the emaciated, beleaguered, hopeless animals were washing up on California shores.

The pups staggered across beaches, wandered into vacant lots, or tottered, disoriented, along roadways. Refugees all to some unspeakable disaster. Orphans lost or abandoned by parents unable to provide them with even the most basic of sustenance.

Starving Sea Lion Pups

(Starving sea lion pups taken in by the Marine Mammal Center in San Francisco. Image source: WTSP.)

Marine rescue centers, volunteer centers, and even animal shelters were inundated by a flood of desperate, dying animals. Their organs were shutting down. They could barely breathe or walk. The future generation of the more than 300,000 sea lions living along the US West Coast taking a severe blow from a deadly killer lurking in West Coast waters.

By late February more than 1000 sea lion pups had flooded the California Marine Mammal Center. Hundreds more found their way into local and ad-hoc shelters. The number was so great that all support systems for the animals were overwhelmed. Persons finding and seeking help for the dying pups were, more often than not, turned away due to lack of support and rescue resources.

It was like the scene out of some heart-wrenching sci-fi disaster movie. And everyone kept asking the same question — what could cause this?

Mass Sea Lion Deaths for Three Years Running

This most recent spate of sea lion pup deaths and strandings comes after years of the same. News media currently reports the event in isolation — as if 2015 were the only year for such a thing to happen. But the truth is that this crisis has been ongoing now since at least 2013, with an earlier episode in 2009-2010 preceding the current chain of related events.

The 2013 event was so severe that in the end 70 percent of the 50,000 sea lion pups born that year had died. The 2014 event was rather less severe, accounting for ‘only’ twice the normal loss rate. But 2015 has so far been so deadly that even 2013’s staggering number of sea lion pup losses could be exceeded.

The multi-year event represents such a heavy blow to sea lions that marine organizations have declared the entire current young generation under threat of being wiped out.

Adult Sea Lions, Otters, Starfish, Birds and other Marine Creatures Involved

But the story doesn’t stop at young sea lion deaths alone. From May through August of last summer, reports were flooding in of mass adult sea lion, otter, and bird deaths due to what appeared to be exposure to some form of toxin.

The animals would wash up on the beach or drop out of the sky. They would show signs of convulsions. Autopsies of the deceased animals revealed shrunken hippocampus, brain and heart lesions.

The same marine mammal center that is now taking in over 1,000 baby sea lion pups this summer took in 751 adults suffering from these signs of toxic poisoning. Simply put, the adults died this past summer and now the pups are starving.

Further down the food chain, creatures living in bottom water zones were also suffering and dying. Fishermen off Oregon had to go further and further afield to fill nets. Near shore fishing lines came up empty except for crabs scurrying up the lines as if in an attempt to escape from danger below.

And in 2013, thousands upon thousands of starfish began to turn to white clumps. A freakish instance of mass star fish death that continued inexorably through 2015.

A Victim of Sea Star Wasting Syndrome

(A victim of Sea Star Wasting Syndrome. Image source: Crosscut.)

The star fish would succumb to a strange wasting illness. An illness that would ultimately waste whole swaths of multiple starfish species (20 separate starfish species and millions of animals are now thought to be involved). Entire regions saw their starfish populations dwindle to zero. As with the mass sea lion deaths, marine researchers were both stunned and befuddled.

Perhaps even more disturbing is that the various species deaths just keep on coming — with no apparent end in sight.

A Hothouse Serial Killer

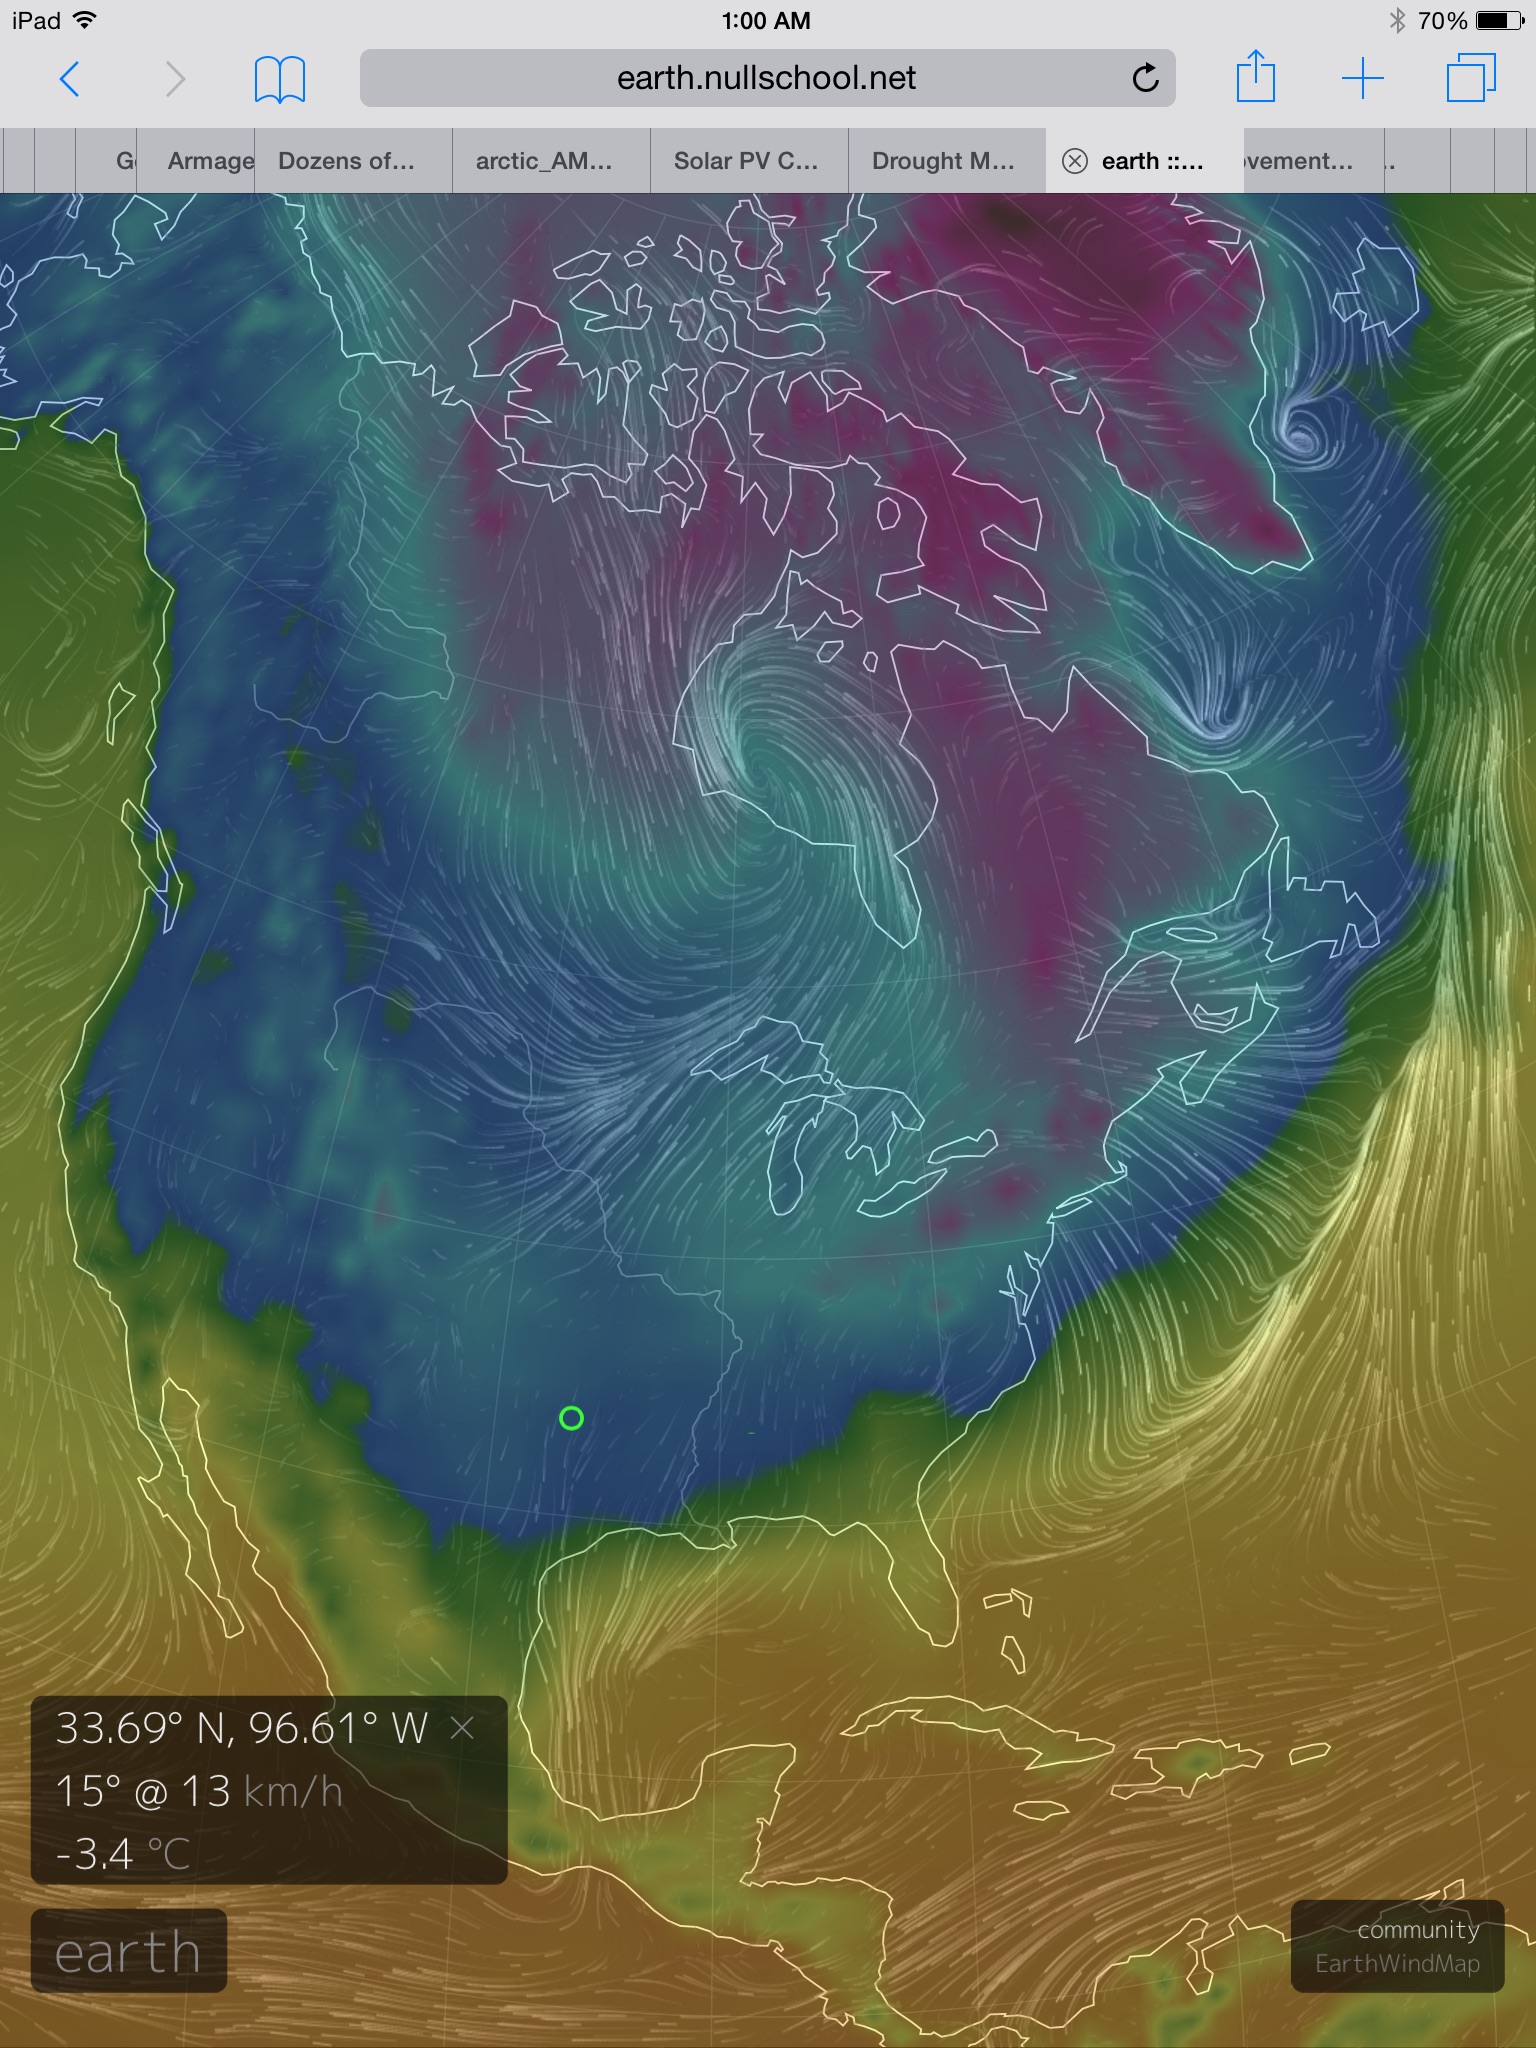
Just off shore, a warm wind runs from south to north over the increasingly wasted waters. Warm airs born of warm waters, providing us with clues for the cause of this ongoing mass death event. For the seas off the US West Coast have reached record levels of warmth — a level of ocean surface heat that flared with the most recent El Nino in 2009 and 2010. A warming that has been building steadily ever since mortality events began their incessant march in 2013.

image

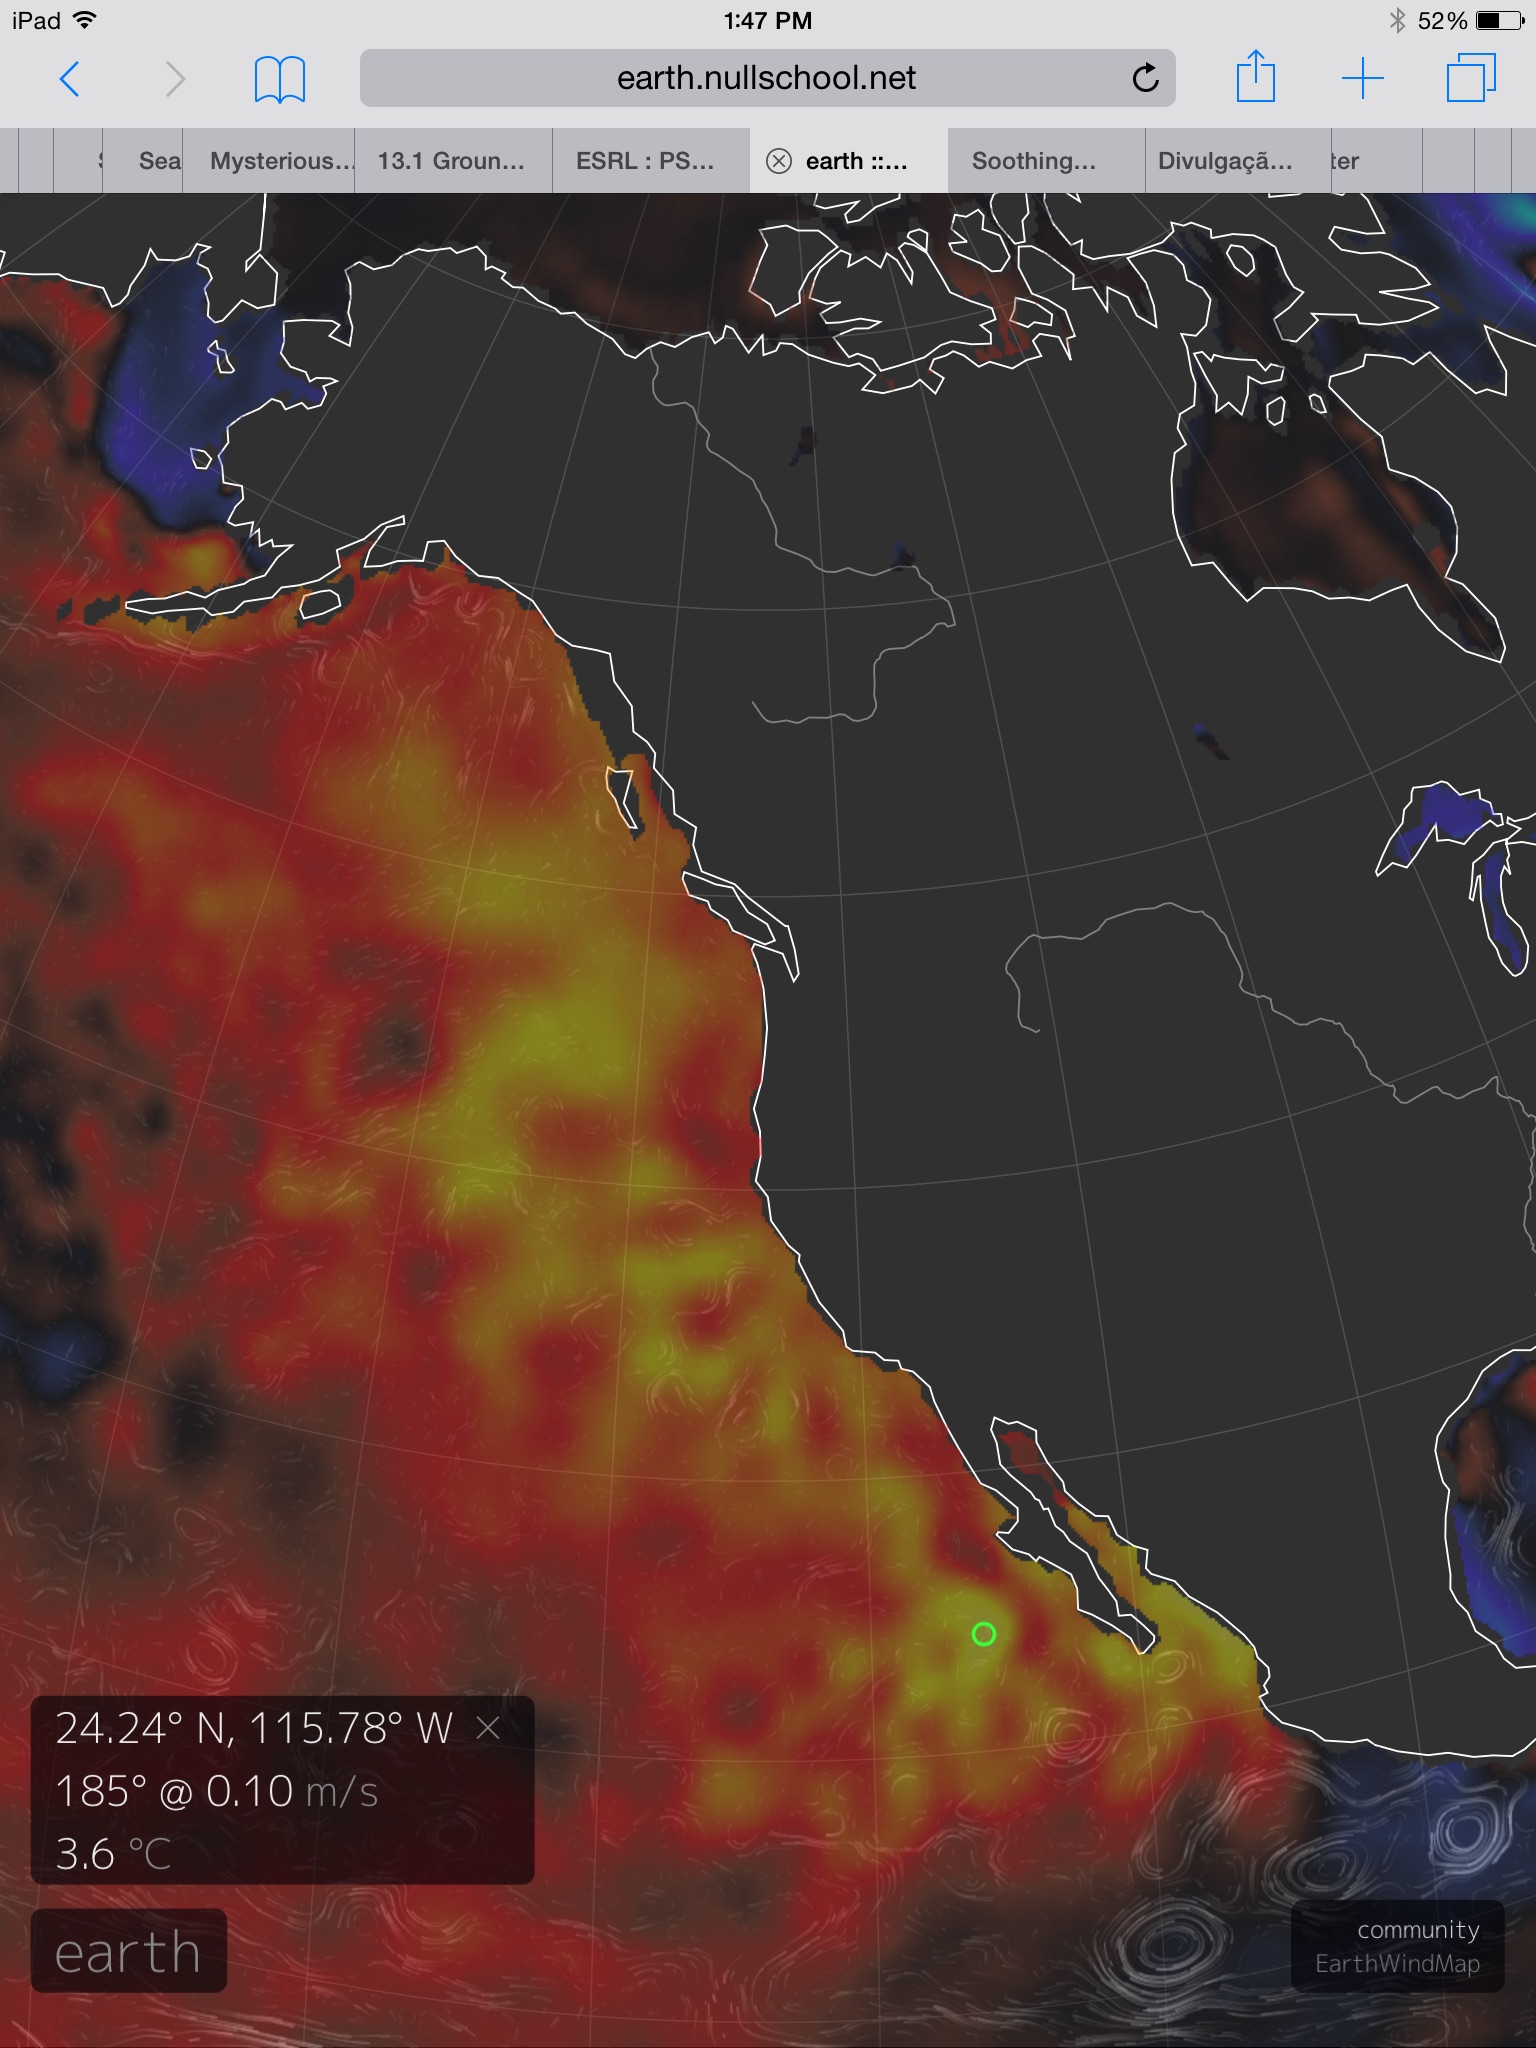
(Sea surface temperature anomaly map for February 27, 2015 depicting very large swath of much warmer than average sea surface temperatures running along the West Coast of North America through to the Bering Sea. Such widespread surface warming contributes to numerous detrimental changes to ocean health. Image source: Earth Nullschool. Data Source: Global Forecast System Model.)

Now a broad swath of surface water ranging from 2-5 C above average blankets an entire oceanic zone from Alaska to Mexico.

Such excess heat may seem innocuous at first blush. A little extra warm water may seem pleasant to the casual observer. But what seems pleasant actually conceals a deadly threat.

Warm surface waters spreading over the ocean can serve as a kind of lid. The warm water prevents cooler water from upwelling toward the surface, mixing nutrients and refreshing the water’s oxygen levels. This shut down of overturning is a dangerous oceanic condition called stratification. And it can level a severe blow to almost all creatures along the marine food chain. Plankton become less productive. Low oxygen zones expand, killing the slow-moving bottom creatures all while driving the mobile fish to more productive waters. In the warmer waters, toxic algae blooms become more prevalent. Harmful microbes, which are culled during influxes of cold water, thrive and multiply, posing a disease threat to all marine species. Finally, in the deeper reaches off the coasts of Washington and Oregon, the already oxygen-poor zones, zones rife with methane from hydrate venting, begin producing a deadly seep of hydrogen sulfide gas.

The living sea has now become a killer. And all it took was a little extra added heat to lock west coast waters in an expanding zone of warm water and low oxygen marine mortality.

Low Oxygen Ocean Zones

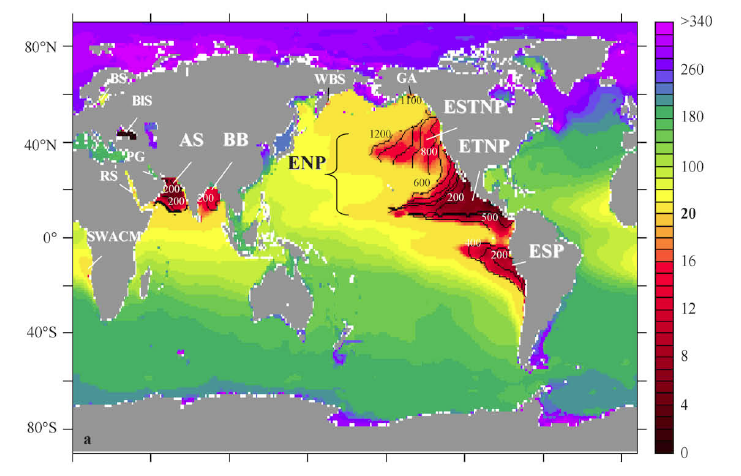
(The signature of ocean stratification expansion — low oxygen zones. Note the large and expanding region of low oxygen in the Eastern Pacific. For reference, high oxygen is shown in greens, blues and purples, low oxygen shown in oranges, reds and black. Image source: AMOP’s Study of Oxygen Minimum Zones. Image date: 2013.)

As a result we have the proliferation of the sea star wasting illness. An illness that would usually be contained by the seasonal influx of cooler waters. So too do we have instances of sea lion adults consuming fish, mullusks, and shellfish contaminated with domoic acid — a toxin produced by algae blooms in warm waters. And lastly, we have the overall stress on the food chain due to low oxygen and productivity which has driven sea lion food sources so far off shore that females are too exhausted after hunting to feed their pups.

More Dangers to Come

The recent mortality events mirror ocean warming episodes which caused similar die-offs at the end of glacial periods. Then, as now, warming robbed waters of oxygen and productive mixing, causing stress to numerous species.

However, the current pace of human warming is much more rapid than the warming periods that occurred at the ends of the ice ages. In addition, under business as usual human carbon emissions, the deadly, low-oxygen ocean zones are expected to expand, eventually covering the majority of the world ocean system. It’s a transition to a stratified ocean that will make the current west-coast die-off look like a minor prelude by comparison.

Hydrogen Sulfide Eruption off Namibian Coast

(Hydrogen sulfide eruption off Namibian coast on February 15, 2015. In Namibia, anoxic bottom waters host hydrogen sulfide producing bacteria. Runoff rich with organic material feeds these bacteria as they produce more toxic hydrogen sulfide gas. During upwelling events, the hydrogen sulfide is brought to the surface where it is visible as a florescent green or black slick. Under stratified and Canfield Oceans, more and more regions are capable of supporting deadly hydrogen sulfide production. Currently, the Baltic Sea, Offshore Namibia, the Chesapeake Bay, and Offshore Oregon are known to host broad regions of hydrogen sulfide producing bacteria in anoxic dead zones. Only in Nambia do these zones occasionally reach the surface waters, so far. Image source: Earth Observatory/NASA.)

Eventually, if CO2e levels exceed 800-1000 parts per million, a transition to an even more deadly state called a Canfield Ocean is increasingly likely. And a Canfield Ocean is a powerful killing machine. Implicated all the previous hothouse extinctions, this killer, during the Permian Extinction, was likely primarily responsible for the deaths of 95 percent of species in the ocean and 70 percent of species on land. For the oceans eventually filled up with deadly toxins (primarily in the form of hydrogen sulfide gas) which then vented into the atmosphere.

It’s a very deadly ocean state we want to avoid at all costs. And we should view these very troubling instances of ocean species mortality along the North American West Coast as a warning to stop warming to oceans as swiftly as possible.

Links:

 Here’s Why Hundreds of Sea Lion Pups are Washing Ashore in California

Researchers Find Warmer Waters Increase Sea Bed Methane Emissions

Surge in Marine Mammal Strandings on US West Coast

On California Coast, Biotoxins Cause of Deadly Sea Lion Siezures, Seafood Scare

Unprecedented Sea Lion Mortality Along California Coast Associated With Anomalous Ocean Conditions

Pelagic Zone: Commons

Global Warming May Boost Dead Zones in Oceans

Eastern Pacific Oxygen Minimum Research

Starving Sea Lion Pup Rescued on San Fransisco Boulevard

Sea Star Wasting Continues: Will King of the Rock Fall?

Pacific Rocky Intertidal Monitoring: Sea Star Wasting Syndrome

When the Stars all Go Out Along the Coast

Hydrogen Sulfide Eruption: Namibia

Earth Nullschool

Global Forecast System Model

Hat Tips:

Colorado Bob

Lief Thurston

Bad Climate Outcomes — Atmospheric Warming to Ramp up as PDO Swings Strongly Positive?

Last year, quietly and without much fanfare from the mainstream press, the Pacific Ocean underwent a powerful shift. A shift from a state in which cooler surface waters absorbed atmospheric heat, to a phase in which surface water warming caused ocean heat to be transferred to the world’s already warming airs.

The shift was heralded by a powerful oceanic Kelvin Wave. One that brought warm water up from the depths and spread them across the Pacific Ocean surface. Ever since that time, warm Kelvin Waves have continued to refresh this surface water heat pool.

monster-el-nino

(Major Kelvin Wave that heralded a switch to strongly positive PDO values for the Pacific. Image source: NOAA/ESRL)

And so the Pacific Ocean surface warming continued throughout 2014.

By December, Pacific Decadal Oscillation (PDO) values, a measure directly tied to this warming, hit a new all-time record level of +2.51. That’s the highest and hottest PDO value since record-keeping began in 1900. One that only backed off slightly into January at +2.45 in the preliminary measure.

It’s a major swing in Pacific Ocean surface temperatures to a phase where more heat is dumped into the atmosphere. One that is causing some scientists to warn that a new period of rapid atmospheric warming may just be getting started.

image

(Sea surface temperature anomaly map shows very warm surface waters dominate much of the equatorial, eastern and northern Pacific in a signature that is strongly characteristic of a powerfully positive PDO on Thursday, February 26 2015. Image source: Earth Nullschool. Data Source: Global Forecast Systems Model.)

PDO and The Multi-Decadal Heat Pump

Pacific Decadal Oscillation (PDO) is a periodic change in sea surface temperature states in the Pacific. One that is thought by many oceanic and atmospheric researchers to have a strong influence on global weather and temperature variability.

In the negative state, PDO tends to encourage La Nina events which also coincide with a downswing in global temperatures as the vast Pacific waters take in more heat. In the positive state, PDO tends to encourage El Nino events which result in the great ocean belching heat into the air on a grand scale — pushing atmospheric temperatures higher.

All things being equal, this natural variability would pan out — marking upswings and downswings in a global average. However, human fossil fuel burning and related greenhouse gas emissions have bent this curve upward by trapping more and more heat in the lower atmosphere. So the case is now that during positive PDO phases, in which more El Ninos occur, atmospheric warming has tended to ramp drastically higher. And, consequently, during negative PDO phases, atmospheric warming has tended to merely slow down even as oceanic warming sped up.

You can see this speeding up and slowing down in the below graphic provided  by Weather Underground:

PDO vs global temperature change Weather Underground

(Global temperature change since 1900 vs phases of positive PDO [1925 to 1945 and 1975 to 1998] and negative PDO [1945 to 1975 and 1998 to 2014]. Image source: Weather Underground. Data Source: NOAA.)

In the era during which global temperatures have been increasingly driven by human greenhouse gas emissions, four phases of PDO have been recorded. Two were positive, two were negative.

In the first positive PDO phase during 1925 through 1945, global average temperatures jumped upward by about 0.5 degrees F (+0.25 F per decade). This initial surge in atmospheric warming abated as global temperatures remained roughly steady during the negative PDO period of 1945 to 1975 (+/- 0 F per decade). But by 1975, PDO values were positive again and the period through 1998 showed a rapid warming of about 0.8 F over 23 years (+0.4 F per decade). After the super El Nino of 1998, PDO values again trended negative as atmospheric warming continued at a somewhat slower pace of about +0.15 F per decade.

Global Warming and Related Ills to Ramp Up?

This underlying trend should be cause for serious concern.

The first issue is that we see warming now during negative PDO decades where we only saw cooling or zero warming before. Given the present rate of warming in the range of +0.15 F per decade during periods in which the Pacific Ocean is taking on atmospheric heat, one could expect the next positive PDO phase to see decadal warming in the range of +0.55 F or higher (or by about 1 C in 20-30 years).

Such a rapid pace of warming could challenge the fabled 2 C ‘point of no return’ before 2050 (for reference, we are at about +0.85 C above 1880s values now). And it is for this reason that some scientists are now starting to sound alarm bells.

In the recent Weather Underground commentary penned by Jeff Masters, Kevin Trenberth, an NCAR scientist and one of the world’s foremost experts on ocean temperature dynamics, noted:

“I am inclined to think the hiatus [in global temperature increases] is over, mainly based on the PDO index change. If one takes the global mean temperature from 1970 on, everything fits a linear trend quite well except 1998.”

NOAA global surface temperature anomalies

(Global surface temperature anomalies. Image source: NOAA.)

Though Trenberth does not explicitly spell out the potential for an overall warming acceleration, he does point toward a return to the +0.29 F per decade trend line seen since 1970. Meanwhile, Matthew England of the University of South Wales warned in the same Weather Underground commentary that any post ‘hiatus’ warming would be likely to be very rapid.

Dr. Michael Mann, a climate scientist of considerable fame both due to his Hockey Stick tree ring study and due to his ongoing success fighting off smear campaigns launched by climate change deniers, recently put together climate model assessments that showed world temperatures exceeding the 2 C threshold by 2036 under business as usual greenhouse gas emissions. To reach such a high reading so soon would require in excess of 1 degree Fahrenheit warming over each of the next two decades. And such a rate of warming would be very rapid indeed, unprecedentedly rapid and well outside the linear trend line from 1970.

Michael Mann today made related comments at Realclimate on the more recent oscillations in Pacific Ocean sea surface temperature:

There is the possibility that internal, natural oscillations in temperature may have masked some surface warming in recent decades, much as an outbreak of Arctic air can mask the seasonal warming of spring during a late season cold snap. One could call it a global warming “speed bump”. In fact, I have… Given the pattern of past historical variation, this trend will likely reverse with internal variability, instead adding to anthropogenic warming in the coming decades. That is perhaps the most worrying implication of our study, for it implies that the “false pause” may simply have been a cause for false complacency, when it comes to averting dangerous climate change.

To these points, it is worth noting that any rate of warming above 0.3 F (0.2 C) per decade is extraordinary and terrifying. Such a rate is enough to achieve post ice age warming of 4 C in merely 2 centuries where it took 10,000 years to achieve such warming before. Warming at 0.4, 0.6 or 1 F per decade would be both drastic and devastating to current climates, geophysical stability, weather stability, glacial stability, water security, food security, and ocean health. In the current world, already warmed by about 0.85 C above 1880s levels any acceleration to current warming is a rather bad outcome on top of an already dangerous situation.

Links:

Are We Entering a New Period of Rapid Global Warming?

Climate Oscillations and the Global Warming Faux Pause

NOAA’s National Climate Data Center

NOAA’s Earth Systems Research Lab

Monster El Nino Emerging From the Depths?

Far Worse Than Being Beaten With a Hockey Stick: Michael Mann Climate Model Shows 2 C Warming by 2036

Global Warming Speed Bump? The Answer May be Blowing in the Wind.

Earth Nullschool

Global Forecast Systems Model

Hat Tip to Colorado Bob

Hat Tip to Bassman

Solar in the Desert — PV to Bury Fossil Energy on Price Before 2025

DCIM101GOPRO

(Sunlight in the Desert. Dubai solar park produces electricity at 5.98 cents per kilowatt hour, displacing a portion of the UAE’s natural gas generation. By 2025, solar systems that are less expensive than even this cutting-edge power plant will become common. By 2050, large scale solar, according to Agora, will cost less than 2 cents US per kilowatt in sun-blessed areas. Image source: International Construction News.)

*   *   *   *

Anyone tracking energy markets knows there’s a disruptive and transformational shift in the wind (or should we say sun?). For as of this year, solar has become cost-competitive with many energy sources — often beating natural gas on combined levelized costs and even edging out coal in a growing number of markets.

Perhaps the watershed event for the global energy paradigm was the construction of a solar plant in Dubai, UAE that priced electricity for sale at 5.98 cents (U.S.) per kilowatt-hour. Even in the US, where grid electricity regularly goes for 9-12 cents per kilowatt-hour, this price would have been a steal.

But the construction of this plant in a region that has traditionally relied on, what used to be, less expensive diesel and natural gas generation sources could well be a sign of things to come. For though solar can compete head-to-head with oil and gas generation in the Middle East now, its ability to threaten traditional, dirty and dangerous energy sources appears to be just starting to ramp up.

Solar’s Rapid Fall to Least Expensive Energy Source

A new report from Berlin-based Agora Energiewende finds that by 2025 solar PV prices will fall by another 1/3, cementing it as the least expensive energy source on the planet. Further, the report found that prices for solar energy fall by fully 2/3 through 2050:

Solar to be least expensive power source

(Solar is at price parity in the European Market now and set to fall by another 1/3 through 2025 according to a report by Berlin-Based Agora Energiewende.)

In Europe, solar energy already costs less than traditional electricity at 8 cents (Euro average) per kilowatt hour. And at 5-9 cents, it is currently posing severe competition to energy sources like coal and natural gas (5-10 cents) and nuclear (11 cents). But by 2025, the price of solar is expected to fall to between 3.8 and 6.2 cents per kilowatt-hour (Euro), making it the least expensive power source by any measure. By 2050, solar energy for the European market is expected to fall even further, hitting levels between 1.8 and 4.2 cents per kilowatt hour — or 1/4 to 1/2 the cost of fossil and nuclear power sources.

These predictions are for a combined market taking into account the far less sunny European continent. In regions where solar energy is more abundant, the report notes that prices will fall to less than 1.5 cents per kilowatt-hour. That’s 2 cents (US) for solar in places like Arizona and the Middle East come 2050.

IEA Shows Solar Ready For Battle Against Carbon-Emitting Industry

Already, solar energy adoption is beginning a rapid surge. As of this year, it is expected that 52 gigawatts of solar capacity will be built. But as prices keep falling this rate of build-out could easily double, then double again. By 2025, the IEA expects that solar PV alone could be installing 200 or more gigawatts each year. And by 2050 IEA expects combined solar PV and Solar Thermal Plants (STE) to exceed 30 percent of global energy production, becoming the world’s largest single power source.

Solar Parking Lot

(Parking lots and rooftops provide nearly unlimited opportunities for urban and suburban solar panel installation. Image source: Benchmark Solar)

Considering the severe challenges posed to the global climate system, to species, and to human civilizations by rampant carbon emissions now in excess of 11 gigatons each year (nearly 50 gigatons CO2e each year), the new and increased availability of solar energy couldn’t come soon enough. We now have both an undeniable imperative to prevent future harm coupled with increasingly powerful tools for bringing down world fossil fuel use and an egregious dumping of carbon into the atmosphere and oceans. But we must implement these tools — wind, solar, EVs, efficiency, biomass, geothermal, biogas, tidal and others — as swiftly as possible if we are to have much hope for avoiding the worst impacts of human-caused climate change.

Links:

Solar Energy Emerging as Cheapest Power Source

Solar at 2 Cents per Kwh

Solar Seen as Unbeatable

Dubai Solar Bid Awes Energy Market Players

Siberian Permafrost Methane Shows Growing Eruption: Number of Global Warming-Induced Craters Now Estimated at 20-30

Siberian Crater Locations

(Siberian methane crater locations. In total, 7 methane blow holes with features similar to the Yamal Crater have now been discovered. Unofficial reports from observers on the ground have local scientists placing the likely count now at between 20-30 original craters with many more secondary craters. Image source: The Daily Mail.)

*   *   *   *   *

The ground smoked for hours. Then, with a great flash and an enormous boom, the land exploded. When the smoke cleared, all that was left was a great, black hole. Ejected earth lay scattered around it — sheer sides plunging into the permafrost like some gigantic, gaping gun barrel.

This was the scene last summer in Yamal, Siberia — a region of extreme northern Russia.

Mysterious Holes Emitting Methane Gas

Speculation about the cause of this mysterious hole became rampant. It looked like a sink hole, except for the ejected material surrounding it. Some said it was a pingo. But pingos weren’t known to form due to explosions.

Teams of scientists rapidly descended upon the hole. And there they found high readings of methane at the hole’s base — in the range of 10% concentration, which is a very explosive level for the gas. At the base of the hole they also found evidence of hydrate. A form of frozen water-methane that is quite unstable unless kept under high pressure and low temperature.

The initial conclusion of the Russian scientists was that relic hydrate sealed beneath the previously flooded Siberian permafrost had been destabilized. Eventually reaching an explosive concentration, it then erupted from the ground.

Discovery of this methane crater spurred a sweep of the area. Almost immediately, two other craters with similar features were discovered. And throughout fall and winter, both ground searches and satellite reconnaissance identified still more.

Methane blow hole lake surrounded by small craters

(Newly discovered methane blow-hole found by satellite observation. In the top frame we see tundra absent the newly formed hole. In the bottom frame, we find the hole forming a lake [B2] surrounded by 20 or more ‘baby craters.’ Image source: The Siberian Times.)

Now, according to recent reports in the Siberian Times, a total of seven craters with features similar to the Yamal eruption have been pinpointed by observers. Just one of these craters (shown above) hosted about 20 smaller ‘baby craters’ surrounding it. In this instance, a large methane store below the permafrost is thought to have explosively displaced a shot-gun pattern of frozen soil sections before filling with water.

Most of the craters, like the one above, were observed to rapidly fill with water even as they continued to emit methane. In many instances, the methane emission was visible as bubbles on the newly formed lake surface.

Bubbles from Methane Crater Lake

(Bubbles from suspected methane crater lake as seen by an observation aircraft. Image source: The Siberian Times.)

Additional reports from reindeer herders have led these same scientists to believe that in the range of 20-30 of these methane eruption holes are likely to exist in this region of Northwestern Siberia.

A Problem of Relic Hydrates Facing Rapid Warming

The fact that reindeer herders keep discovering new holes and that the first Yamal craters discovered earlier this year were recent events have led local scientists to believe that the eruptions are a new phenomena for Siberia. There, temperatures have warmed by a stunning 2 degrees Celsius within the mere span of 14 years. A very rapid rate of warming that is putting severe stress on the geophysical stability of this Arctic region.

Last night, as polar amplification again ramped up, we saw an example of this very rapid warming with locations in Yamal, Russia experiencing -3.1 C temperatures as of 1 AM Eastern Standard Time. A very warm measure for this region during winter time — representing an anomaly at least 20 degrees Celsius above average. For reference, North Texas, an area far south of the Arctic Circle, experienced similar readings (-3.4 C) at the same time:

imageimage

(Side-by-side frames showing 1 AM EST temperatures in Yamal Russia [left frame] and North Texas, US [right frame]. Location in the frames is indicated by the small green circle. Temperature, wind speed and direction, and grid location are given in the lower left hand corner. Image source: Earth Nullschool. Data Source: Global Forecast Systems Model.)

In other words, it was colder in North Texas last night than it was in Yamal, Siberia near the 70 degree North Latitude line beside the Arctic Ocean.

This extremely rapid warming is thought by Russian scientists to have destabilized zones of relic hydrate trapped beneath the permafrost. There, the methane gas bonded with water to form a kind of methane ice.

Sandwiched beneath frozen permafrost, the hydrate remains stable so long as temperatures and pressures are relatively constant. Any increase in warmth — either through geological processes working below the hydrate, or from changes at the surface causing permafrost to melt and warmer, liquid water to contact the hydrate — would result in increased hydrate instability.

Yamal Crater Wall

(The Yamal Crater as seen by Russian Scientists who investigated the scene last summer. The crater’s structure and surrounding ejecta was indicative of an explosive outburst. Image source: The Siberian Times.)

In some cases, the gas would very rapidly liberate from its frozen traps forming increasingly high pressure pockets beneath the permafrost. If these pockets reach 10 percent methane concentration, they become very explosive and can be ignited when in contact with a catalyst or ignition source. The result, either due to very high pressure or ignition, is plugs of permafrost exploding from the ground as the gas erupts to the surface.

Conditions in Context

It is important to note that the amount of methane liberated by these initial eruption events is likely rather small — when considered on the global scale. However, what we see in Siberia now may be part of a growing and ominous trend.

First, we do not know the size of the potential methane store that could be liberated in such an explosive fashion. And the question must be asked — if we are looking at such rapid warming of methane hydrates in shallow sea and former shallow sea regions, what scale eruptions could we potentially experience in the future? Could very large sections of hydrate go critical? Areas possibly covering hundreds or thousands of square meters or more?

The Russian scientists seem very concerned. And, ironically, it is for the future safety of their oil and gas infrastructure, which sits atop what is potentially a rapidly destabilizing zone. A zone that could see explosive eruptions of the ground beneath pipes, equipment and extraction fields. (One would think that the Russians would also begin questioning the continued exploration and production of oil and gas considering its contribution to the dangers they are now identifying. But that level of wisdom appears absent in the recent assessments.)

Second, it appears that these methane eruptions provide pathways for ongoing release. Not all of the gas in the relic hydrate is initially liberated. And the structures that remain apparently release methane gas for some time — as is evidenced by continued high methane concentrations found at crater sites and by observed emissions from crater lake surfaces.

In essence, if this is a growing trend, then it is a rather unsettling one. Especially when one considers that it is just a single instance of many possible amplifying carbon feedbacks set off by a very rapid human warming. Particularly, the explosive land and ocean floor-altering nature of this specific carbon feedback makes it especially troubling. For it encompasses the very nature of a catastrophic upheaval.

In the end, the question must be asked — is Siberia sitting atop a methane volcano that is being prodded to rapid wakening by high-velocity human warming?

Links:

Dozens of New Craters Suspected in Northern Russia

Are Siberia’s Mysterious Craters Caused by Climate Change?

Earth Nullschool

Global Forecast Systems Model

More Siberian Craters Prompt Urgent Call For Investigation

Hat Tip to James Cole

Hat Tip to Wili

Hat Tip to Colorado Bob

Another Blow to Antarctic Glacial Stability as Larsen C Ice Shelf Cracks Up

Larsen C rift

(Northern edge of Larsen C Ice Shelf is at significant risk of breaking off as a massive rift continues to open within it. The above image shows the rate of rift propagation since November of 2010. Image source: Cryosphere Discussions.)

There’s a 30 kilometer long and hundreds foot deep crack running through West Antarctica’s massive Larsen C ice shelf.

It’s a rift that now stretches from the Weddell Sea — where winds and currents have driven human-warmed ocean waters to up-well along the ocean-contacting faces of the great Antarctic ice sheets — and deep into the interior of this 49,000 square kilometer and 600 to 700 foot tall block of ancient, floating ice.

Over the past few years this rift has been rapidly advancing at a rate of about 2.5 kilometers each year.  Given that the rift has already traversed more than half of the Larsen C ice shelf calving face, a very large break-up could now occur at almost any time.

Larsen C Destabilizing

This evolving situation now threatens to destabilize the entire Larsen C ice shelf — resulting in major losses to a very large block of ice that has been a permanent feature of the Antarctic coastline since at least the last interglacial period 150,000 years ago. Such rapidly evolving risk was the subject of a February 5 communication by a group of glaciologists warning that “significant threats” to “Larsen C ice sheet stability” now existed.

The report notes:

In a change from the usual pattern, a northwards-propagating rift from Gipps Ice Rise has recently penetrated through the suture zone and is now more than halfway towards calving off a large section of the ice shelf (Figs. 1 and 2). The rate of propagation of this rift accelerated during 2014. When the next major calving event occurs, the Larsen C Ice Shelf is likely to lose around 10 % of its area to reach a new minimum both in terms of direct observations, and possibly since the last interglacial period (Hodgson et al.2006)

Connecticut-Sized Break-up Possible

Large ice shelf break-ups have been occurring along the Antarctic Peninsula since the 1970s. As human warming advanced and the heat sink of the southern Ocean increased bottom water temperatures along the Antarctic perimeter, many of the far northern ice shelves and an increasing number of ice bodies closer to the Antarctic interior have lost significant portions of their mass.

Now, Larsen C is at risk of an even worse break-up. For the predicted 10% loss to Larsen C would equate to about 5,000 square kilometers — or an area roughly the size of Connecticut — floating off into the Southern Ocean:

Section of Larsen C vulnerable to break-up

(Larsen C Ice Shelf map with the new rift indicated in red and the potential calving face outlined in blue. Note the previous calving fronts in 1975 and 1988. Image source: Cryosphere Discussions)

It would be yet one more major ice loss for the region, and perhaps a new record loss for an area that has frequently seen Rhode Island sized chunks of ice (around 1,000 square kilometers) break off into the warming world’s seas.

The report goes into further detail about the importance and vulnerability of Larsen C, stating:

The Larsen C Ice Shelf is the most northerly of the remaining major Antarctic Peninsula ice shelves and is vulnerable to changes both to ocean and atmospheric forcing (Holland et al., 2015). It is the largest ice shelf in the region and its loss would lead to a significant drawdown of ice from the Antarctic Peninsula Ice Sheet (APIS). There have been observations of widespread thinning (Shepherd et al., 2003; Pritchard et al., 2012; Holland et al., 2015), melt ponding in the northern inlets (Holland et al., 2011; Luckman et al., 2014), and a speed-up in ice flow (Khazendar et al., 2011), all processes which have been linked to former ice shelf collapses (e.g. van den Broeke, 2005).(Emphasis Added).

Conditions in Context

As mentioned above, during recent years we have seen numerous ice shelves and ice sheets begin to destabilize. In addition, two ice shelves — Larsen A and Larsen B have already completely disintegrated due to human-caused warming.

Larsen C may be most immediately at risk, but the leading edges of the Ronne-Filchner Ice Shelf, The Pine Island Glacier, The Ross Ice Shelf, and the Amery glacier have all shown rapid seaward acceleration. Further, various studies of these increasingly vulnerable ice shelves have shown substantial basal melt coincident with a floating of the ice sheets off grounding lines, leading to a retreat of the anchor points landward.

Major Antarctic Ice Shelves

(Antarctica’s major ice shelves. Image source: Commons.)

Sea-facing ice sheets and ice shelves serve to anchor the great interior glaciers of Antarctica. Loss or destabilization of these anchors would result in more and more rapid flow of land ice into the Southern Ocean. It is for this reason that the destabilization and shattering of ice shelves like Larsen C can have serious implications for the rate of sea level rise over the coming decades.

Overall, nearly 200 feet worth of sea level rise is locked in Antarctica’s glaciers and we are, through a heating of the world’s oceans, ice, and atmosphere, pushing these glaciers to melt and move in an ever-more dramatic and world-altering fashion.

Links:

Newly Developing Rift in Larsen C Ice Shelf Presents Significant Risk to Stability

Shrinking Ice Shelves and The Pine Island Glacier

Commons: The Larsen C Ice Shelf

Hat-tip to Colorado Bob

Wildfires Amidst Winter Snow on Russia’s Baltic Shores

firesandsnow
(The Aqua satellite captured this image on Feb. 17, 2015 of multiple hot spots scattered throughout the Kaliningrad Oblast, Russia landscape. Credit: Jeff Schmaltz, MODIS Rapid Response Team. )

On Wednesday, NASA posted the above satellite shot indicating an outbreak of numerous wildfires along a Baltic Sea coastal lowland that is among a furthest western holdings of current day Russia.

The shot displayed a relatively significant outbreak of more than 20 hot spots in a temperate deciduous forest zone bordering the oxygen-starved Baltic Sea. NASA sensors pick up anomalous warm spots and link them to fires when smoke plumes are also present. For reference, the fire outbreak zone depicted above occurred in a region roughly 120 by 60 miles in size.

Temperatures in the region have ranged 3-5 C above normal — putting it around the freezing mark for most of the past week. The warmer than average weather hasn’t however, precluded snowfall, which has lent a thin covering to the area despite a relative dryness as storms have tended to track either north or south this year.

It is this dryness and a persistent wind off the Baltic which may have helped to ignite the recent outbreak of wildfires. NASA’s Rapid Response Team posted the shot, but they provide no details as to the cause of these wildfires. Winter fires are typically rare, but last year saw dry winds setting off blazes in Scandinavia, so this year may be showing an anomalous repeat.

This story will be monitored for further clarification as winter wildfires are an anomalous event that can often be linked to human-caused climate change.

Links:

LANCE-MODIS

Fires and Snow in Central Europe

Mangled Jet Stream + Global Warming + Hot Atlantic Water = Boston Buried Under 8 Feet of Snow

If you deny that warmer ocean temps -> greater snowfall w/ coastal winter storms, you are not a climate denier. You are a physics denier. — from the Twitter feed of Dr Michael E. Mann, Climate Scientist

*  *  *  *

Boston just experienced its snowiest month on record and, yes, it really is climate change, stupid. In essence, as Michael Mann notes above, it’s a matter of oceanic and atmospheric physics.

Consider the fact that the ocean surface is warming at an unprecedented rate. Consider also the fact that this observed warming is resulting in a number of powerful south to north flows of air over ocean regions and toward the polar zone.

Over the past month, these powerful warm air flows pushed strongly into both Alaska and Svalbard — causing 20-30 C above average temperatures in regions of the Arctic along the 70 to 80 degree north latitude lines. For Alaska, the warmth was so prevalent and intense that it forced the Iditerod sled dog race to be moved 300 miles north for want of snow and ice. On this past Sunday night in Svalbard, just above the 80 degree north latitude line, temperatures were a balmy 1.2 degrees Celsius. An extraordinary above freezing reading in a land where temperatures during this time of year are typically 20 to 30 degrees Celsius below that mark.

image

(Anomalous above freezing temperatures in the land of winter dark and chill. Also note the very powerful south to north air flows originating from the 30 degree north latitude line and terminating in the Arctic near 70 to 80 north. These flows exist in both the Pacific and the Atlantic — hugging the coastal zone and flowing strongly northward along a reoriented storm track. Image source: Earth Nullschool. Data source: Global Forecast System Model.)

All this warm air moving north must have an impact. And that impact is to leave Greenland and the eastern North American Continent as the remaining refuge for cold Arctic air that would typically amass over a rather thick pack of sea ice. But that sanctuary for cold is increasingly frail and unstable. For the ice is thinner and itself rests upon waters that are warming. So the cold instead moves to land and to land ice — both bodies with physical properties better able to keep cold during the long winter dark.

So the cold flees its previous habitat in the far north near the pole and instead dives about 1,500 miles south over Greenland, Eastern Canada and the US. In the upper atmosphere, this pattern is reflected by a huge trough in the Jet Stream. One that has been repeatedly identified by the crackerjack research of Dr. Jennifer Francis.

image

(Very high amplitude Jet Stream wave pattern with strong ridge in the west, very deep trough digging through Eastern Canada and the Eastern US, an a return to the strong ridge pattern over the North Atlantic. Image source: Earth Nullschool. Data source: Global Forecast System Model.)

Such a powerful hot-cold dipole in the atmosphere results in extraordinary atmospheric instability. The deep trough alone would be enough to send storm after storm hurtling toward the Northeast US. Storms born of a fury of Arctic cold coming into collision with oceanic moisture from the Gulf of Mexico and the Atlantic.

It is a pattern that has been fixed in place for a month running. One that has delivered storm after powerful storm to the US northeast along a screaming storm track. And one that has slammed these storms into an unprecedented wall of warmth and moisture.

For not only have warm air flows invaded the Arctic resulting in a highly anomalous displacement of cold air southward for an extended period of time. But ocean warmth in a region of the Atlantic just off Boston has provided extraordinary fuel for these storms once they arrive.

For we have observed sea surface temperatures just off Boston in the range of 8-11 C above average for most of the months of January and February:

image

(Sea surface temperature anomaly map by Earth Nullschool. Note the highlighted region shows an extreme temperature departure of 11.1 degrees Celsius above average. Data Source: Global Forecast Systems Model.)

For reference, a sea surface temperature anomaly of 2 C or higher is considered to be a rather strong departure. The 11.1 C anomaly in the above image is, for lack of a better term, simply off the charts. In rough translation, this amounts to surface waters in the range of 65 to 70 degrees Fahrenheit only about 200 miles or so off the Massachusetts coastline. A coastline regularly seeing temperatures in the range of 0-28 degrees F. The result is a 40-70 degree temperature departure over a very short distance. By itself, this extreme temperature differential would be an amazing storm generator. But the differential alone only tells half the story.

The other half is a powerful explosion of moisture off this much warmer than normal water. A massive mushrooming of moisture just off the coast. And when this very heavy bank of moisture collides directly with displaced onrush of cold and dry air, the amount of snow that is squeezed out can be staggering.

Record-breaking staggering. 8 feet for Boston in one month staggering.

As Michael Mann so saliently noted, you’d have to be a physics denier to not understand the role of ocean warming in either the warm air invasion of the Arctic in the Oceanic zones, the related displacement of cold air over the eastern half of the North American continent, or the fueling of extraordinarily powerful winter storms along the Northeastern Coast of the US.

And to this point, I leave you with the equally salient thoughts of Bill Nye from his twitter feed:

Bill Nye

“Would this guy get fired, if mentioned, just mentioned a possible connection, to ?” — Bill Nye.

Links:

Michael Mann and Bill Nye Want You to Know Boston’s Epic Snowfall is Tied to Global Warming

Global Forecast Systems Model

Earth Nullschool

Bill Nye’s Twitter feed

Dr Michael E. Mann’s Twitter feed

Scientific hat-tip to Dr. Jennifer Francis

Hat tip to Eric Thurston


Something Rotten With The Climate — January 2015 Comes in As Second Hottest

Hot off the heels of a new global temperature record in 2014, January of 2015 hasn’t missed a beat. Global warmth still rages, as bestirred as a Shakespearean prince outraged at loss and betrayal of a once-constant and steady father.

The month, as many, many months preceding, continued to display a reckless accumulation of heat.

*   *   *   *

According to NASA GISS, January was 0.75 C above the global 20th Century average, or about 0.95 C above 1880s levels. This departure is somewhat above previous second hottest year place-holders — 2002 and 2003 — which both showed an angry 0.71 C rise. It is, however, behind the record-holding January of 2007 which at 0.93 C above the 20th Century average remains the hottest month in the total global surface temperature measure. The first of many to make attempts on the 1 C departure level.

January 2015

(Global Temperature anomaly map as provided by NASA GISS.)

Spatial assessment of hot and cold anomalies showed much of the world with hotter than normal temperatures. In the Northern Hemisphere, cooler temperatures were primarily confined to the Northeastern US, Eastern and Northeastern Canada, and a region through Baffin Bay, Eastern Hudson Bay, and the adjacent Canadian Archipelago. In Austral zones, the heat sink of the Southern Ocean continued to display resilience as near-Antarctic regions also showed slightly cooler than normal departures.

But these were the sole significant zones showing cooler than normal weather. In contrast, a broad belt ranging from the tropics through the sub-tropics showed +0.5 to 2 C temperature departures. But the Northern Hemisphere again showed the most significant heat with Northwestern North America, Asia and Europe all showing extreme temperature anomalies in the range of 2 C to 8.1 C above average.

Arctic amplification also reared over the Beaufort Sea and through the Northern Polar zone with heat anomalies in excess of 2 to 4 degrees C above average and with numerous days in which the entire Arctic displayed +3.5 C or higher departures.

zonal anomalies

(GISS zonal temperature anomalies.)

Zonal anomalies also revealed this trend with a region from 50 to 60 North Latitude showing temperature departures in the range of +2.8 C across the entire Latitudinal belt. Meanwhile, the region of 80 to 90 North was under nearly as strong a departure of +2.5 C above 20th Century averages for that zone. By contrast, the only zonal region with below average temperatures was beyond the 60 degrees South Latitude Line and averaged a rather minor departure of about -0.4 C.

Conditions in Context

The second hottest January on record comes after a Century-long warming trend in which temperaures have risen by an average of about 0.85 C above 1880s levels and about 1.1 C above a low point that occurred around 1910.

Land Ocean Temperature Index

(Global Land-Ocean Temperature Index — GISS/NASA.)

This warming is about a 20 times faster pace than at the end of the last ice age. During that time, it took 10,000 years for the Earth to warm by about 4 degrees Celsius. Over a single Century, we have achieved the equivalent to 1/5 post ice age warming on top of 1880 levels. It is also worth noting that recent record warm years in 2014, 2010, and 2005 occurred absent the kind of very strong El Nino that occurred in 1998. Most notably, for 2014, no El Nino was declared at all.

Which shows that for the climate, there is something indeed rotten in Denmark — and everywhere else for that matter.

Links:

NASA’s Global Surface Temperature Analysis