Human Hothouse Found to be California Drought Culprit as Ridiculously Resilient Ridge Reasserts

This is an event that is more extreme than any in the observed record, and our research suggests that global warming is playing a role right now. — Stanford Scientist Noah Diffenbaugh

****

Last week, a strong storm over-rode a powerful high pressure ridge that has been deflecting moisture-loaded weather systems northward and away from the US West Coast for the better part of two years. Though some precipitation did grace the northern and mountain stretches of the drought-stricken state of California, it is no-where near enough to alleviate an epic 21+ month long drought. A drought borne of a blocking pattern that began during the winter of 2012-2013 and now threatens to extend to the end of 2014 and, possibly, beyond.

In the wake of the storm, the powerful ridge reasserted — again delaying hopes that a parched California would at last begin to receive at least a normal allotment of rain.

Blocking Ridge Oct 6, 2014

(Euro Model forecast shows the ridiculously resilient ridge [RRR] strongly in place off the US and Pacific Northwest coasts in the October 6 run. Image source: ECMWF.)

It is a high pressure ridge based blocking pattern that has become so persistent that researchers at Stanford University have given it a new name — the ridiculously resilient ridge or Triple R. And the Triple R, according to those same researchers has climate change based origins.

For this week, Stanford scientists published a new study that found:

The atmospheric conditions associated with the unprecedented drought currently afflicting California are “very likely” linked to human-caused climate change.

Researchers used a combination of climate models and statistical techniques to determine that large, persistent high pressure systems of the kind that have been locking California into perpetual drought are more likely in the presence of high concentrations of greenhouse gasses. They found that the ridge, which has generated year-round wildfires in California and at its peak intensity during January of 2014 stretched from Hawaii all the way to coast of the Arctic Ocean north of Alaska, was a kind of new species of extreme weather far more likely to occur in a human-warmed world.

south-to-north-weather-pattern-alaska

(January 23 of 2014 weather pattern showing a moisture flow diverted from Hawaii to Alaska by the Triple R west coast blocking pattern. Image source: NASA.)

The anomalous strength of the ridge also likely played a role in the powerful polar vortex disruptions that were commonplace throughout the winter of 2014. As the ridge shoved more warm air into the polar zone north of Alaska the cold core of the polar vortex was displaced south and eastward over the Canadian Archipelago and Hudson Bay — driving extreme weather events over the central and eastern US as well as across the Atlantic and on to the UK.

The Researchers found that ridging was the overall and anomalous tendency of the pattern in this region of the northeast Pacific. They observed that the ridge remained strong throughout the winter of 2013, weakened during the summer of that year, then flared into an extreme intensity by January of 2014. Since that time, the ridge has swelled and spluttered, occasionally letting a storm or two pass but still serving as a kind of brutal sentinel to weather systems that would typically make their way to California.

The results of such a human-caused disruption of the climate are all too visible in the most recent US Drought Monitor.

September 23 drought monitor

(Despite tropical storms and the occasional weakness in the Triple R allowing a brief influx of moisture, 100% of California is still suffering from drought conditions with 58% percent of the state under the most extreme level of drought. Image source: US Drought Monitor)

A drought event that is the most extreme in the observed record and that is now linked to climate change by at least three major studies.

From the Stanford Study’s authors:

“We’ve demonstrated with high statistical confidence that the large-scale atmospheric conditions, similar to those associated with the Triple R, are far more likely to occur now than in the climate before we emitted large amounts of greenhouse gases,” Rajaratnam said.

“In using these advanced statistical techniques to combine climate observations with model simulations, we’ve been able to better understand the ongoing drought in California,” Diffenbaugh added. “This isn’t a projection of 100 years in the future. This is an event that is more extreme than any in the observed record, and our research suggests that global warming is playing a role right now.”

Links:

Stanford Scientists: Causes of California Drought Linked to Climate Change

ECMWF

NASA

US Drought Monitor

New York City is Planning to Go Fossil Fuel Free — So Why Not the Rest of the World?

greenhouse-gas-reductions-in-NYC-1-537x356

(New York City plans a number of measures to eliminate fossil fuel use and rapidly build climate change resiliency through 2050 including mass installation of solar energy on roof-tops, major reductions in energy use and increases in efficiency, painting roofs white to reduce the heat island effect, and providing both incentives and enforcement for those living within the city to make an energy switch and control consumption. Image source: New York City.)

As a city sitting at the edge of rising seas and in the path of almost certainly more severe storms, New York City faces the grim prospect of facing the brunt of impacts set off by human-caused climate change. This vulnerability was recently highlighted as Superstorm Sandy flooded 90,000 of New York’s buildings and inflicted 19 billion dollars worth of damages on the city alone.

The storm raced in on tides that were more than 1 foot higher than original New York City designers planned for. And the storm was likely enhanced by a combination of much warmer than normal ocean temperatures and a disrupted Jet Stream pattern that makes it more likely for tropical and polar air masses to come into confluence — increasing the energy potential of hybrid storms like Sandy.

And Sandy may just have been a warning shot across the bow.

Based on the city’s own figures, New York City is facing 4-10 inches of additional sea level rise before 2030 and 11-30 inches of sea level rise through 2050. Stark results of ocean current changes that are piling more water up on the US East Coast as well as an increasing number of destabilized and irreversibly collapsing glaciers in Greenland and West Antarctica that will likely provide ramping sea level rise through both this century and for many centuries to come.

80 Percent + Emissions Reductions By 2050 With The Ultimate Goal to Eliminate Fossil Fuel Use

Faced with these threats, New York City has put together a plan to completely eliminate fossil fuels as energy sources. To greatly increase energy efficiency measures and to shift the city to renewable energy sources entirely. The plan, in total, would reduce New York City’s carbon emissions by 83% below 2005 levels through 2050 with the ultimate aim of eliminating fossil fuel use altogether.

In pursuit of this goal, the city is providing a series of ten year planning measures aimed directly at both public and private energy users. The plans are broad based and set ambitious goals for both reduction in energy consumption and rapid adoption of renewable energy sources. For example, the city itself plans to install 100 megawatts of solar panels on public buildings even as it reduces building energy consumption by as much as 50 percent over the next ten years. Meanwhile the city plans to provide incentives and financing aimed at private solar installations exceeding 250 megawatts over the same period.

Other aspects of the plan include setting up an efficiency and renewables marketplace for the city, ensuring that the benefits of reducing energy costs are shared across the economic spectrum, providing standards enforcement for private buildings, transportation and consumption, and setting in place a scaling series of investments to build city resiliency for the climate-related troubles that are likely to worsen for the foreseeable future even if the world follows New York’s example and rapidly responds to climate change.

To this point, New York City joins New York State, California and the European Union as government bodies now pursuing broad policy goals to reduce the greenhouse gas emissions in their areas of responsibility by 80 percent or more. Responsible actions that should serve as models for cities, states, and nations around the world if we are to have much hope of confronting a growing climate nightmare set off by a reckless and irresponsible broader human-based carbon emission.

Links:

Please Read New York City’s Comprehensive Climate Action Plan Entitled: One City Built to Last

Why You Should Read the City’s Plan to Reduce Carbon Emissions by 80 Percent

New York State Executive Order 24: Climate Action Planning

When it Comes to The Arctic Methane Monster, What We Don’t Know Really Could Kill Us — NASA Model Study Shows Very High Carbon Release Uncertainty

(Can we save humanity from the greatest threat ever? Must-watch video highlights the risks and uncertainties of catastrophic methane release from the Arctic environment.)

After millions of years of ice ages, the Arctic has become a vast repository of fossil carbon.

Over the millennia, layer after layer of carbon-based biological material has been locked away in the frozen soil of the Arctic tundras and sea beds. Some of these stores have simply become entombed within the ice. Others, already turned to methane through the slow fluxes of time, underlay the frozen ground and the chilly Arctic sea-bed floor as a kind of fire ice.

An unstable, flammable, and explosive substance called clathrate.

The stores themselves are massive — containing between 2,000 to 3,000 billion tons or more of carbon. Likely more than five times the amount of carbon humans have already emitted into the atmosphere over the past 150 years. An amount that has already likely locked in about 1.8 C of warming short term and 3.6 C worth of warming long-term.

But a thawing Arctic could set off a chain of events leading to far worse warming to come.

In a cold, ice-age world these carbon stores are no threat. Like a sleeping dragon, they remained dormant in the world’s chill zones — unable to break the seal of the ice. But in a world that humans are forcing to rapidly warm through a pace of greenhouse gas emission at least 6 times faster than at any time in Earth’s billions-years history, we risk a major release of this monstrous carbon stockpile.

A Matter of Methane Feedback

We really don’t know how much heat forcing is required to set off a runaway release of this monstrous pile of carbon. But we’ve already warmed the world by at least 0.8 degrees Celsius and many Arctic researchers believe that just 1.5 degrees Celsius global warming is enough to thaw all the Arctic’s tundra.

Such a thaw would certainly expose the massive tundra carbon store to the elements and to microbial action. Increasing an already significant release of Arctic carbon and greatly contributing to the human heating of the Earth’s atmosphere and oceans through greenhouse gas emissions.

Dragon's Breath Jason Box

(In a recent article on his Meltfactor blog, Dr. Jason Box questions whether local anomalies in Arctic methane data involve mini methane outbursts set off by human-caused heating. Dr. Box also, appropriately questioned whether such releases were signs of a potential and larger release due to the human heat forcing of the Arctic environment. Dr. Box, in a manner similar to our own investigation of the Arctic Methane Monster, metaphorically labels these outbursts ‘dragon’s breath.’ Image source: Meltfactor.)

A few years ago, a group of 41 Arctic researchers suggested that even if we stopped emitting greenhouse gasses rapidly, the Arctic release of carbon would equal about 10 percent of human annual human emissions and would continue for a long time into the future. More ominously, these researchers noted that a failure to rapidly draw down human carbon emissions would result in an annual Arctic release of equivalent to 35% or more of the human emission — putting the world on track for a runaway warming scenario.

But the matter of Arctic carbon release is anything but simple or easy to understand. For a significant portion — possibly as much 1/3 to 1/2 of the Arctic carbon store could release as methane. And methane, on very short time scales, is a very potent greenhouse gas. Over the course of 20 years, methane has a global warming potential 86 times that of a similar volume of CO2. If even a very small portion of the Arctic carbon store were to release as methane over a relatively short period — 1, 5, 10 or 50 gigatons out of a total store measuring in the thousands of gigatons — it could greatly exaggerate the already powerful human warming underway or, in the worst case, set off a runaway heating event similar to that of the great Permian and PETM extinctions.

A Poorly Understood Risk

Unhelpfully, there is nowhere near enough direct observation of the Arctic environment to pin down the current rate of carbon release or the likely increase in release rates over the past few decades. We have studies that show more methane emitting from tundra lakes, for example. We have the Semiletov and Shakhova expeditions to the Arctic Ocean which keep providing higher and higher estimates of the methane emissions coming from plumes on the sea floors of the Laptev and East Siberian Seas. We have studies that show increasing CO2 and methane release from the vast carbon stores of Yedoma’s frozen tundra in Siberia. And we have the more disturbing instances of explosive methane outbursts — likely from rapidly thawing clathrates beneath the permafrost — in the Yamal region of Russia this year that resulted in a dramatic cratering of Siberian tundra.

Arctic Methane Overburden

(Large sea-bed methane release ongoing? The Arctic continues to show a very significant overburden of Methane — hinting at larger releases of methane from the Arctic environment. Last year during October, methane readings over the Gakkel Ridge spiked to 2662 parts per billion — or more than 800 parts per billion above the global average — before diffusing into the atmosphere. The above image shows methane over the same region spiking to over 2,400 parts per billion on September 16 of 2014. Link: Arctic News.)

But these studies and instances focus only on subsections of the Arctic. And, in much the way several blind men investigating the various parts of an elephant might disagree on the overall shape of the beast, we have a similar problem with understanding the total shape of the threat posed by Arctic methane and carbon release.

Dr. David Archer, who has developed various model essays of potential Arctic and sea bed methane release claims that there is essentially zero cause for concern for a large-scale methane release this century. A number of Arctic researchers disagree with the chief of these being Peter Wadhams, Dr Semiletov and Dr Shakhova who all seem very concerned about the potential for a large-scale release soon. A middle ground is populated by a number of researchers like Carolyn Ruppel and Sue Natali from the Woods Hole observatory. These researchers are rationally calling for more data on an issue that is all-too-poorly understood in the science.

NASA’s CARVE Finds Models in Disagreement Over Arctic Carbon Release

This current lack of broader understanding and scientific consensus on the issue of potential Arctic and Earth Systems response to a growing human heating of the atmosphere and ocean was highlighted in last week’s report by NASA’s CARVE study.

The study — aimed at monitoring Arctic Carbon emissions — ran a number of global climate models to try and determine how much carbon is currently being released from the Arctic environment. The study didn’t try to pin down future release scenarios. It just aimed at trying to establish a base line for emissions as they stand now. An understanding required to provide any clear assessment of where Arctic carbon emissions may be going in the future.

The researchers plugged the current spotty Arctic carbon emissions data into 40 global climate models and the models dutifully spit out results that were all across the board. In essence, the models confirmed what we risk analysts already knew — there’s not enough information currently available to provide a clear understanding of potential Arctic carbon release scenarios much less pin down how much carbon is currently being emitted.

From last week’s Science Daily Report:

How much carbon is leaving its thawing soil and adding to Earth’s greenhouse effect? …

A new study conducted as part of NASA’s Carbon in Arctic Reservoirs Vulnerability Experiment (CARVE) shows just how much work still needs to be done to reach a conclusion on this and other basic questions about the region where global warming is hitting hardest.

Lead author Josh Fisher of NASA’s Jet Propulsion Laboratory, Pasadena, California, analyzed 40 computer models of the amounts and flows of carbon in the Alaskan Arctic and boreal ecosystems. His team found wide disagreement among the models, highlighting the urgent need for more measurements from the region…

“We all knew there were big uncertainties in our understanding, and we wanted to quantify their extent,” said Fisher. That extent proved to be greater than almost anyone expected. “The results were shocking to most people,” he said.

Cause For Rapid Reduction in Greenhouse Gas Emissions Now

Ocean-methane-seeps-3

(Ocean methane seeps like these recently discovered vents off the US East Coast and those Discovered in the Laptev Sea by the SWERUS C3 expedition are almost always more numerous and energetic than expected — a likely result of increasing human heat forcing. Such releases almost always include destabilized clathrate stores. Image source: Nature-Geoscience.)

It will take years for scientists to more certainly pin down the risk posed by Arctic Carbon and methane release. A risk that now wraps within it the potential to set off a new Permian type hothouse extinction during the coming 1 to 3 centuries. A risk that, altogether, is likely the most dire risk we’ve ever faced as a species.

As such, we can’t wait for absolute certainty on the scope of that risk. Whether there’s enough sensitivity to set off a large Arctic carbon release at 1.5 C or 6 C warming is moot — because we know that continuing to burn fossil fuels eventually gets us there sooner or later.

So as we continue to research what may well be the greatest environmental threat we’ve ever faced it is entirely prudent to begin a rapid reduction of global carbon emissions with a goal to hit zero carbon and net negative carbon emissions as soon as possible. The risks are simply too great to continue to delay action.

High Risk of Permafrost Thaw

With Few Data Arctic Carbon Models Lack Consensus

Can We Save Humans From the Greatest Threat Ever?

Rate of Methane Release From Tundra Thaw Lakes Increases by 58%

Why We Should Be Paying More Attention to Methane

Hundreds of Seeping Methane Plumes Discovered off US East Coast

Meltfactor

Arctic News

SWERUS C3 Arctic Carbon Study

NOAA Earth Systems Research Laboratory

Climate Science: The Vast Cost of Arctic Change

Arctic Methane Monster Shortens Tail: ESAS Emitting Methane at Twice Expected Rate

Arctic Methane Monster Exhales: Third Tundra Crater Found in Siberia

High Velocity Human Warming Leads to Arctic Methane Monster’s Rapid Rise from Fens

How Much Methane Came Out of That Hole in Siberia?

Rapid Arctic Thaw Could be Economic Timebomb

Hat Tip to Apneaman

Hat Tip to Colorado Bob

Climate Catastrophe: Too Late For Action? Or Just Trapped by a Dangerous Ideology?

(Above video by Democracy Now. Please also take a look at a related video at : Huffington Post Live)

*****

Hopeless.

That’s the state of many environmentalists and ecologists these days when faced with the growing ravages of human-caused climate change and a when confronted with a society that has ignored their pleas for rational societal response for decades.

And who can blame them?

They were the ones who acted first. Who took on vegan diets. Who stopped driving cars. Who stopped using airplanes. Built solar and carbon neutral homes. Who blockaded pipelines and coal plants. Who threw themselves bodily into the ocean in front of massive oil tankers in an attempt to halt their operations.

These individuals acted, they fought, they set the example. And who listened? Who followed in their footsteps? Who understood the cause — the most important of all things — they were fighting for?

Is it any wonder that collections of severely depressed persons crop up with greater and greater frequency? That blogs and whole web communities are dedicated to the notion of coping with what many see to be an inevitable near term human extinction?

Why did so many people turn deaf ears to those fighting for climate action over the long years? And why have so many of us now succumbed to hopelessness?

Perhaps it is well a sign of the terrible time in which we live. A time in which individualism rose to ascendency and crowded out all other views. A time in which any collective action was disparaged to the point that the term collectivism itself became a bad word. We were seen as responsible for only ourselves — but not for each other.

We became members of the church of selfishness and so many of us became blind to the impact of that all too narrow view on the world around us. On our communities, our churches, our cities, indeed our civilizations and ultimately our world.

We thought that by taking on selfishness that we would grow stronger. But, instead, we gave up an essential human strength. We gave up the ability to effectively work together.

But climate change is a problem that no individual alone can solve. A problem that requires the strength of individuals collected together and acting as one.

A raindrop cannot fill a creek bed. But a rainstorm can.

If we are to deal with climate change we must cast off the old constraints and the old views that have trapped us for so long. We must learn to act, not as individuals, but as members of a larger union. As a group that multiplies the strength of our parts. We much collect. We must gather. And we must focus our energies.

In this, Naomi Klein is absolutely correct —

We must first learn to believe that we are worth saving. And, in doing so, to understand that working collectively to halt climate catastrophe is now the most good and needed of things.

(Hat tip to Colorado Bob)

Hothouse Rains for Florida — 40 Year Old Record Smashed by 8 Inch Downpour in Daytona Beach

Increasingly, due to global atmospheric heating, this is the kind of event we’ve seen —

An atmosphere hotter than at any time in at least the past 120,000 years develops a powerful thermal lift. The dense clouds build higher and higher, drawing in moisture from a hydrological cycle that has been intensified by at least 6 percent due to a 0.8 C global heating since the 1880s. Eventually, the heavy moisture loading within the cloud comes crashing downward in a collapsing inundation, resulting in record rainfall.

Almost daily, now, we see new record rainfall events due to this set of hothouse warming heightened atmospheric dynamics. Just one of the increasingly severe weather impacts predicted by climate scientists. And for a broad region of Eastern and Central Florida sitting under a pattern of rainfall that has now persisted for 8 days, yesterday witnessed just such a major inundation.

Heavy Storms Close in On Central Florida

(Powerful storms close in on Central and Eastern Florida yesterday afternoon just prior to another record rainfall event. Image source: LANCE-MODIS.)

Towering storms swept in, puffed up by the hotter than normal waters of the Atlantic and Gulf of Mexico spreading dense, white cloud tops up toward the stratosphere. By late evening, Central and Eastern Florida were hemmed in by the towering cloud deck.

The heavy rains began last night around midnight and continued on until around 7 AM this morning. Dousing sheets of rain swept through Volusia County cities focusing in on Orlando, Port Orange, New Smyrna Beach and Daytona. For Daytona, the previous rainfall record for the day, set in the 1970s at 4.22 inches was shattered as 7.98 inches of rain fell over a seven hour period.

The massive downpour left ten homes flooded and entire neighborhoods shut down as city residents pushed water-logged vehicles to higher ground or gingerly waded through knee to waist deep waters. Nearby Port Orange found itself in a similar situation after a 7 inch deluge flooded numerous roads and neighborhoods even as it completely buried a section of railroad track in flood waters. The flooding storms also uprooted trees and knocked down power lines in the affected region.

As of about 1 PM this afternoon more storms were riding in off the Atlantic Ocean heightening the risk of continued flooding for the already storm-plagued region. River levels were rapidly rising and a flood warning was issued for the larger St. John’s River.

Water vapor florida

(Southeast Water Vapor Imagery. Image source: NOAA.)

As of 4 PM Eastern Time, water vapor imagery and radar showed strong thunderstorm cells just to the southeast of Volusia county and traveling toward the northwest — threatening a second inundation for an already flooded region.

Links:

Heavy Rains Flood Parts of Central Florida

LANCE MODIS

NOAA

Top Climate Scientists Explain How Global Warming Wrecks the Jet Stream and Amps Up the Hydrological Cycle to Spur Dangerous Weather

Global Warming to Drive Increase in Severe Thunderstorm Risk

(Hat Tip to Colorado Bob)

The Good News — 56% of New Energy Installed For First Half of 2014 Was Renewable; The Bad News — 40% Was Natural Gas

New installed Capacity 2014

Good news and bad news. But first, the good news…

For the first half of 2014, a total of 56% percent of newly installed electricity generation capacity within the US came from wind and solar energy sources. In total, that’s more than 3,300 gigawatts of new power from non carbon emitting energy generation for the first six months of 2014 alone.

Solar energy, in particular, saw a major increase from 2013 — jumping 47% in new installed capacity over the same period last year. In total, the US now boasts more than 15 gigawatts of solar energy generation capacity — racing to catch up to US wind generating capacity that now stands at nearly 62 gigawatts.

A majority of new solar power generation came from utility-based projects. But strong new additions in residential solar power also buoyed total additions. The massive leap in new solar capacity was spurred by rapidly falling panel prices combined with much more robust avenues for those seeking to install solar — at the individual, agency, and utility scale. Municipal and institutional solar power generation also saw a substantial leap with government buildings, libraries, schools and churches taking the solar plunge.

Wind showed a substantial recovery from the first half of 2013, which only saw 2 megawatts of new wind after conservatives in Congress spear-headed an assault on the renewable energy production tax credit in an attempt to stymie new alternative energy sources. The blood-letting pushed wind off a track in which it was gaining between 5-10 gigawatts of new power generation annually during 2008 to 2012. Due to falling wind prices and rising gas and coal prices, however, wind appears to be staging a comeback to previous rates of adoption.

Overall, it’s an excellent start to a year that will almost certainly see more major new alternative energy resource additions.

Natural Gas — A Bridge to More Carbon Emissions

As for the bad news, 40% of the new generation capacity came from natural gas…

Natural gas has been promoted as a ‘bridge to clean energy.’ But the fact that each new natural gas plant installation extends the life-time of US carbon emissions is a black eye on this green-washed claim.

It’s true that natural gas emits less carbon when burned than coal. But the ground-water endangering fracking process also leaks a portion of the fracked gas into the atmosphere as methane. And methane is 86 times more potent a greenhouse gas than carbon dioxide over a 20 year time-frame. Adding in the effect of methane leakage makes fracked natural gas as bad or nearly as bad as coal when taking into account the total industrial cycle heat forcing.

In addition, as noted above, continuing to construct natural gas plants now locks the US into an economic commitment to keep burning natural gas far into the future. In this way, on this path, our economy will continue to emit large volumes of carbon well past mid century. And given an immediately imminent and dangerous hothouse warming crisis, we simply can’t afford to keep emitting for so long.

In essence, we should be pushing to have all new energy capacity come from renewables even as we work to shut down existing carbon-fired power plants as rapidly as possible. And the already existing carbon-based infrastructure is massive — composing nearly 430 gigawatts of generating capacity for natural gas and 304 gigawatts for coal. We should be looking at ways to rapidly reduce this massive, carbon-emitting monstrosity. Not continue to add more to it.

In fact, a new research study found that by adding new natural gas capacity, CO2 emissions were increased as the potential for new renewable energy additions were crowded out by competition and as the life-span of fossil fuel based infrastructure was extended. In essence, these common-sense findings are a strong argument for no new fossil fuel based additions at all.

Some of our more rational government officials have paid lip-service to the notion that the US should take a leading role on climate change. And this is a very valuable sentiment. However, real leadership does not involve adding new fossil fuel capacity or seeking new fossil fuel resources. True climate leadership is based in rapidly phasing out the burning of fossil fuels entirely, not locking them in for decades of continued use.

Links:

New US Power in 2014: More than Half Renewable So Far

Memo to Obama: Expanded Natural Gas Worsens Climate Change

US Power Generating Capacity Additions During First Half of 2014

Study: Effect of Natural Gas Supply on Renewable Energy and CO2 Emission


Heat, Wind Ahead of Pacific Storm Spikes King Fire Hazard; Potential Blocking Pattern Shift Underway

King Fire Sep 23

(King Fire Complex fanned by strong, hot southwesterly flow on September 23, 2014 — a rising fire danger through Thursday in advance of an approaching Pacific storm system. Image source: LANCE-MODIS.)

A powerful storm system off the US and Canadian Northwest Coasts may deliver much-needed rains to central and northern California by Thursday — but not before pulling warm, dry winds up from the south in advance of the storm’s approach. The heat and winds, expected to reach 15-25 mph later today, will heighten danger for the over 7,400 firefighters already battling the 90,000 acre King Fire.

As of earlier today, the fire was 35% contained after the army of firefighters, aided by a spate of mountain drizzle, tirelessly worked through the weekend to staunch the blaze. But the new in-rush of hot, dry winds today and tomorrow will fan the still energetic wildfire, increasing the threat to more than 21,000 structures ringing the fire’s edge.

Already, ten people have suffered injuries and 32 structures were destroyed even as 2,700 people are currently evacuated from areas most vulnerable to the still-raging fire. Given the influx of more dangerous conditions, fire fighting personnel will be hard pressed to prevent further damage from an already costly and harmful blaze.

Strong Storm Approaches the Western US

(Strong storm approaches the Western US as the ridge and associated blocking high shift eastward. Change in year and half long blocking pattern? Image source: NOAA-GOES.)

Fire Amidst Record Drought

The King Fire erupted in Central and Eastern California during mid September as century scale drought conditions continued to scorch the state. As of today, more than 50% of the state remains under the most extreme drought level with 100 percent of California suffering from some degree of drought.

This past weekend’s light rains did little to help. However, a strengthening storm track in the Pacific is likely to deliver at least some moisture to Northern and Central California by Thursday. A blocking high pressure ridge that has persisted off the US West Coast for more than a year and a half has also shifted — moving inland toward the Central and Western US. This shift appears to be slowly opening the door to some moisture for California.

Blocking Pattern Shift

(University of Maine Jet Stream modeling shows an eastward shift in the year and a half long blocking pattern and associated ridge over Western North America and the Northeastern Pacific. In today’s graphic, the ridge has shifted into the Central US with associated Rossby-Wave type troughs over both the Eastern US and Eastern Pacific. Notably both troughs now host powerful storm systems in the range of 975 mb and lower. Image source: University of Maine.)

An atmospheric pattern more favorable for El Nino development may also be favoring increased precipitation for California. However, it is still too early to determine whether a pattern favoring drought reduction is firmly in place.

Conditions in Context

Under the current rapid and powerfully enhancing regime of human-caused heating of the Earth’s oceans, ice, and atmosphere, we can expect the US West and Southwest to continue to dry as the storm track shifts northward and as rising temperatures bake more and more of the moisture out of the soil. A significant increase in the occurrence of drought in the US Southwest since the 1970s is likely a part of this larger trend, one that will almost certainly worsen as human-caused climate change intensifies.

In addition, an increasing eccentricity in the Jet Stream associated with Northern Hemisphere polar heat amplification has resulted in far more persistent weather patterns. Dome scientific studies have found that these patterns, associated with powerful Rossby-type wave patterns in the Jet Stream, have appeared with increasing frequency since the mid 2000s. As a result, cooler stormier patterns tend to persist in one region while dry, hot conditions have tended to persist in other regions. This new climate regime appears to be enhancing an already amplified drought pattern for the US West even as it has pumped up storm patterns for regions east and north. It is also worth noting that a number of studies have also found a link between major sea ice losses in the Arctic since 2007 and the intensity of the current California drought.

Links:

LANCE-MODIS

NOAA-GOES

University of Maine

King Fire Update: 2,000 Firefighters add Manpower to those Battling Massive Blaze

Rockefeller Fund Joins Global Movement to Divest Fossil Fuels and Invest in Renewable Energy

Carbon Bubble 2

(Flood Wall Street protesters tote a massive carbon bubble into the center of global capital on September 22, 2014. Image source: Here.)

When you consider all the money and resources going into what many are now calling the carbon bubble, it’s just staggering. Annually, over 650 billion dollars are poured into a 20 trillion dollar monstrosity that, each year, locks in climate changes that are ever more difficult to deal with, ever more dangerous to lives and societies. An investment trend that, if it continues, puts at risk all wealth, the continuance of human civilization and, in the worst case hothouse extinction, much of life on Earth as well. It could well be termed an investment in future devastation. Because that’s what it is.

In total, more than 4.65 trillion dollars worth of the carbon bubble is held in monetary funds invested in fossil fuel industries globally. This massive capitalization provides an ongoing impetus toward climate catastrophe — feeding dangerous new infrastructures and technologies that keep the world locked into a very dangerous fossil fuel consumption regime.

It is, perhaps, the greatest malinvestment in the history of money. For, at one point or another over the years or decades, the continued spending on fossil fuel infrastructure and industry will be revealed for what it really is — an exercise in horrid, self-destructive, futility. And at that point of realization, the investment dollars will inevitably flee and the massive economic structure built around fossil fuels will come crashing down.

The obvious questions to ask in the face of an imminent carbon bubble are — will the world economy be ready for such a jarring shift and, isn’t it better to begin the shift now well before the obvious carbon bubble inevitably bursts?

The Divest/Invest Campaign

As of last year, a variety of groups spear-headed by 350.org began a massive campaign aimed directly at fossil fuel investment dollars. The campaign goal was to lobby investment firms to drop fossil fuel stocks and turn that money toward renewable energy and energy efficiency related firms. And so the divest-invest strategy was born.

The movement took inspiration from historic efforts to monetarily undermine the Apartheid government in South Africa during the 1970s and 1980s. That effort aimed at directly defunding corporations that supported the Apartheid regime and had lasting impacts throughout the struggle for equality there. The new divestment efforts were targeted directly at the investment structures supporting the fossil fuel giants and had the added impact of funneling capital toward efforts directly able to replace these harmful industries.

Flood Wall Street Activist

(Student activist toting Divest Fossil Fuels sign.)

The movement first took root in college campuses and communities around the globe. Students and young people — who stood to see much of the worst effects of climate change — became powerful advocates for shifting university and community investment dollars away from fossil fuels. As the movement grew, faith organizations also took part as a growing number of churches and religious groups around the world actively turned their investment dollars away from activities destructive to a sacred creation.

As of January of 2014, 74 major investment funds associated with these entities had taken part in the divest/invest campaign. By this week, that number had more than doubled to 180.

Included in that number was the prestigious Rockefeller Brothers Fund. An investment group that, ironically, owes its ascendance to fossil fuel dollars generated during the oil and gas boom years of the 20th Century. But the 870 million dollar fund is now moving radically away from fossil energy investment with leading fund trustee Steven Rockefeller citing concerns over a rapidly emerging carbon bubble in the global markets:

We see this as having both a moral and economic dimension, Rockefeller noted in a recent interview with the New York Times.

The Rockefeller Brothers Fund is among the first major Wall Street investment funds to take part in the growing divest/invest movement. But its prestige and reach is bound to put pressure on other charities and firms to follow suit.

Massachucetts Divestment Campaign

(Members of a Massachusetts divestment campaign aimed at removing state pension fund investments in fossil fuels. This group is just one of hundreds now operating globally. Image source: 350.org.)

Overall, funds have now pledged to divest more than 50 billion dollars in capitalized assets from fossil fuel firms and invest that money in alternative energy and fossil fuel replacement efforts. This shift in funding represents slightly more than 1 percent of the total fossil fuel global investment market capitalization. Though small when compared to the total volume of fossil fuel based assets, markets are sensitive to even minor movements in capital flows. And, since the divest/invest effort appears to be snow-balling, a stiff challenge to the monetary dominance of fossil fuels in advance of an inevitable bursting of the carbon bubble may well be in the making.

Links:

The Heirs of Oil Baron John D. Rockefeller are Dumping Fossil Fuel Investments

The 20 Trillion Dollar Carbon Bubble

Rockefellers, Heirs to An Oil Fortune, Will Divest Charity of Fossil Fuels

Fossil Fuel Divestment: A 5 Trillion Dollar Challenge

Measuring the Global Fossil Fuel Divestment Movement

Divestment — A Weapon in the Battle Against Apartheid

350.org: Divestment

Worst Case Carbon Dioxide Emissions Increases Continue — Hitting 40 Billion Tons Per Year in 2013

A new report from the Global Carbon Project shows the world’s machines are belching more carbon dioxide than ever before. The report, which measures global CO2 emissions, found that gases from all sources jumped by more than 750 million tons during 2013 — a 2.3 percent increase in the dangerous hothouse gas over already extreme 2012 emission levels.

In total, 39.8 billion tons of CO2 hit the atmosphere in 2013, up from about 39.1 billion tons in 2012.

Global Carbon Emissions vs RCP Scenario

(Global carbon emissions continued along a worst-case track during 2013. Note that estimated temperature increases are for this century only. For context, it took 12,000 years for the world to warm 5 degrees Celsius at the end of the last ice age. Image source: Global Carbon Project.)

On the current track, global CO2 emissions will double in about 30 years. This pace of emissions increase is along the worst-case path projected by the UN’s IPCC. One that will hit 8.5 watts per meter squared of additional warming at the top of the Earth’s atmosphere and greater than 1,000 ppm CO2 equivalent greenhouse gas heat forcing by the end of this century.

Such a massive increase from human sources does not include amplifying feedback emissions from global methane or CO2 stores such as those now apparently destabilizing in the Arctic. Such emissions could add an additional 20 to 30 percent or greater heat forcing on top of the human forcing, according to scientific estimates, by the end of this century.

The massive blow would be more than enough to trigger a hothouse extinction event — one that could well rival or exceed the Permian (also known as ‘the great dying’) in its ferocity due to the very rapid pace of the human heat accumulation.

IPCC impacts

(IPCC impacts graphic taking into account the RCP 8.5 scenario. Image source: IPCC.)

During 2013, the greatest CO2 emitter by a wide margin was China at nearly 10 billion tons of CO2 all on its own. The US came in a distant second at about 5.5 billion tons with India nearing the 2 billion ton mark and taking the dubious rank of #3 CO2 emitter.

Overall, the pace of emission increase was slightly slower than during 2012, which showed a 2.5% increase over 2011. The lag was due, in part, to slowing economic growth in coal-reliant China. The massive emitter has lately shown trends toward lowering its carbon out-gassing as it half-heartedly pushes for cleaner air and less coal use. The US, on the other hand, showed a jump in carbon emissions as a trend toward greater natural gas usage whip-lashed back toward coal due to higher natural gas prices.

Greater adoption of renewable energy has slowed global carbon emission from absolute worst case levels. However, the pace of renewable adoption and increasing energy efficiency is not yet enough to knock the world off the horrific RCP 8.5 track. Such a switch would require a much stronger commitment from India and China together with an ever more rapid pace of transition away from fossil fuels for the developed world. To this point, both India and China have ominously opted out of a global climate summit to be held at the UN tomorrow. There, 120 global leaders will push for ways to rapidly reduce carbon emissions. But without buy-in from India and China, such measures may well be overwhelmed by increasing emissions from these very large and increasingly heavily mechanized Asian economies.

CO2 minimum september

(Global CO2 concentrations as measured at the Mauna Loa Observatory. Image source: The Keeling Curve.)

Meanwhile, global CO2 levels were hovering near their annual minimum at just above 395 parts per million after hitting a maximum level near 402 parts per million in May of 2014. At current rates of increase, global CO2 is likely to remain above the 400 parts per million concentration year-round within less than three years.

For context, the last time CO2 levels were this high, global temperatures were 2-3 degrees Celsius hotter than they were today and sea levels were at least 75 feet higher. But since humans emit a number of other powerful greenhouse gasses, the global CO2 measure alone doesn’t take into account the entire picture. If all other human heat trapping gasses are added in, the global CO2 equivalent heat forcing (CO2e) is around 481 ppm, which is enough to increase temperatures, long-term by about 3.8 degrees Celsius and to melt more than half of the world’s current ice sheets.

At the current pace of emission it will take less than 30 years to lock in a 550 ppm CO2 equivalent value — enough to melt all the ice on Earth and to raise temperatures by between 5 and 6 degrees Celsius long-term.

As such, the need for rapid transition to renewables together with reduction in harmful consumption could hardly be more urgent. With ever more harmful impacts being locked in with each passing year, the world needed strong global climate policy action yesterday. But action today will be better than waiting another decade or more as the situation continues to worsen.

Links:

The Global Carbon Project

The Global Carbon Budget 2014

World Carbon Emissions Hit Record High during 2013

Global Rise Reported in 2013 Greenhouse Gas Emissions

The Keeling Curve

Global Carbon Project Carbon Atlas

IPCC

“Hey! Ho! Fossil Fuels Have Got to Go!” — World Sees Largest Climate March in History Amidst Mounting Dangers

(PBS expose covering the 2014 Climate March shows that nearly 1,500 organizations including environmentalists, faith-based groups, small business groups, economic and social justice organizations, and student organizations participated in this historic event.)

According to the National Climate Data Center, the summer of 2014 was the hottest in the global record. It was a season of record wildfires, sea surface temperatures far above the 20th Century average, and of record droughts and rainfall events around the globe. And it was a year in which the ability of nations to provide food for the world’s seven billion and growing population amidst a mounting tally of extreme droughts and floods was called increasingly into question.

On Sunday September 24, 2014, the ever-more alarmed people of the world responded.

In New York City, an estimated 410,000 took to the streets to protest the broad failure by global governments and businesses to effectively respond to the growing threat of an ever-increasing fossil fuel emission that is rapidly pushing Earth toward a dangerous hothouse environment. In London, nearly 50,000 protesters gathered as Melbourne, Australia saw 30,000 climate marchers. 25,000 lifted their voices in Paris, 15,000 marched through Berlin, and 5,000 gathered in Rio de Janeiro.

Overall, more than 2,500 protest events occurred in 166 countries around the world. Total participation is now estimated to be more than 750,000 — the largest and most widespread climate protest in history.

Climate March Grist

(Hundreds of thousands gather in New York City for Climate March. Image source: Grist.)

In New York City, the massive march began at 11:30 AM at Columbus Circle near Central Park. More than 550 buses disgorged passengers bearing signs labeled with a variety of apt sayings including: “There is No Planet B,” “Carbon Tax Now,” “Go Vegan,” “This Country has a Koch Problem,” “Never, Never Vote Republican,” and “We Can’t Burn all the Oil on the Planet and Still Live on It.”

The march, which included more than 50,000 students, numerous members of the scientific community, and such notables as Bill McKibben, Ban Ki-moon, Jane Goodall, Vandana Shiva, Sheldon Whitehouse (D-R.I.), Bernie Sanders (I-Vt), Charles Schumer (D-N.Y.), Leonardo DiCaprio, and Al Gore, at times stretched to fully 4 miles in length. Loud chants such as “Hey! Ho! Fossil fuels have got to go!” rocked what many still believe to be the center of global capital.

I Can't believe I'm having to protest this

(Sign speaks for itself, doesn’t it? Image source: Here.)

The rallies came just two days before a global climate summit was scheduled to convene on Tuesday, September 22. The summit, which will include more than 120 world leaders aims to provide more aggressive measures to attack the vast and growing threat of carbon pollution. As of 2013, recent studies showed that human hothouse emissions jumped by another 2.3% — primarily driven by increases in China, India and the U.S. Ominously, both China and India — previous bad actors on climate change due to astronomical increases in coal burning — have decided to opt out of the current climate summit.

A press conference held prior to the climate march drove home the growing plight of millions of people around the world already staring down the face of fossil-fuel inflicted harm. A number that is likely to jump to billions unless our race toward a hothouse extinction is rapidly halted.

peoples-climate-march17

(Is this a game? Image source: Here.)

Stanley Sturgil, a retired coal miner from Kentucky now suffering from black lung made this statement at a press conference before the march:

“Today I march because I want to behold a brighter future. We have destroyed ourselves. We have destroyed our health and I’m here because our political leaders have failed us.”

Marshall Island resident Kathy Jetnil-Kijiner also made this deeply resonant statement:

“We need to act now… We only have one atmosphere and we of the Marshall Islands only have one land we call home. We don’t want to move and we shouldn’t have to move.”

Sadly, if world leaders continue to fail to hear the pleas of their increasingly foundering constituents, residents of the Marshall Islands won’t be the only ones on the move. The migration, under business as usual carbon emissions and an emerging and deadly hothouse world will comprise a majority of the human race.

Links:

Hundreds of Thousands Turn out for People’s Climate March

Summer of 2014 Hottest on Record

Climate Change Summit: Global Rallies Demand Action

Great Photos From the Climate March

Earth Surface During August of 2014 Was Hottest Ever Recorded

The monthly global temperature records just keep falling…

Despite no El Nino declared, an extraordinarily hot global ocean surface keeps dumping heat back into the atmosphere. This transfer resulted in the hottest March-through-May period in the global record and has pushed numerous record spikes in the global measures this summer. By August, according to NASA, the global average had again climbed to never-before-seen levels.

As of yesterday’s report, NASA showed that the Global Land-Ocean Surface Temperature Index had climbed to 0.70 degrees Celsius above the mid 20th Century average and about 0.95 degrees Celsius above the 1880s average. The previous record high for the period was set in 2011 at 0.69 degrees C above the global 1951 to 1980 average.

global temp maps

(Global surface temperature departures according to NASA GISS. Image source: NASA.)

Throughout the world, global ocean surface temperatures showed extraordinary departures above average for the month. Greater variance was experienced over continental land masses and over the polar regions.

Zonal anomalies showed far greater heat amplification near the southern polar region, especially in the region near 80 south latitude. In the Northern Hemisphere the tundra region near 60 north latitude focusing in Northeast Siberia near the methane emitting zone of the East Siberian Arctic Shelf, the region north of the Caspian Sea, and Baffin Bay and Northeast Canada showed the greatest high temperature anomalies. Only the high Arctic and regions in or near the southern ocean showed widespread and significant cooler than average zonal readings.

You can see these zonal anomalies in the graph provided by NASA below:

August zonal anomalies

(Temperature departures by latitudinal zone. Image source: NASA.)

A Catastrophic Pace of Warming

To understand these record high global temperatures, it is useful to consider the broader paleo-climate context. In this context, the global temperature difference between 1880 and the last ice age was about 5 degrees Celsius. So the current temperature departure, driven by human greenhouse gas emissions, is equal to about 1/5 the difference between the 19th century and an ice age, but on the side of hot.

As it took about 12,000 years for the post ice-age warming to occur, the recorded pace of warming since 1880 is about 20 times faster than that period of extreme Earth system change. With the predicted pace of warming expected to increase even further and with ice sheets still covering the surface of the Earth (which greatly help to mitigate the pace of warming spikes), this current velocity of change is both likely unprecedented and catastrophic.

Links:

NASA GISS

Hothouse Rains for Kashmir: Worst Flooding in More Than 60 Years Puts 450 Villages Under Water

Kasmir Floods September 5

(The hurricane over land like signature that has become all-too-common during recent years as the Earth has continued to warm is plainly visible over the Kashmir region on September 5 of 2014. A multi-day flooding event that is now the worst for this Central Asian state in more than 60 years. Image source: LANCE-MODIS.)

On Tuesday, a bank of thunderstorms fed by an atmospheric river of moisture off the Arabian Sea exploded into a mountain of cloud over Kashmir in Central Asia. The rains swept in and continued through Wednesday, Thursday, Friday and Saturday. A terrible flooding rain that has now killed 160 people, forced the evacuation of 2,500 villages and buried more than 450 villages under waters rising high enough to cover the hills.

River flooding has been so intense that flood level gauges have simply been buried, with towns and cities throughout the region facing catastrophic damage. In Srinagar, a Kashmiri city of 1.2 million souls, the situation today was dire. Union Minister Ragnath Singe, visited the scene earlier today but had to cancel an aerial tour due to ongoing severe weather keeping flights grounded:

“If there is so much devastation in the city, I wonder what would be the situation like in rural areas. I want to assure the people and the government of Jammu and Kashmir that the central government stands beside you in your hour of crisis and we extend all necessary help to you,” Singe noted.

The flood toll now includes more than 50 bridges, hundreds of kilometers of roads, and the loss of numerous power plants and sub stations due to inundation. Vast destruction of food crops is also underway, though with the rains still ongoing it is impossible to provide a full tally.

Minister Singe, amid assurances of full-scale mobilization to aid disaster victims and prevent loss of life has made a plea for 25,000 tents and 40,000 blankets to help provide shelter and care for the swelling ranks of refugees from this ongoing catastrophe.

Conditions in Context

Reported Instances of Extreme Weather since 1988
(Reported instances of extreme weather since 1988. Image source: University of Nottingham.)

Human-caused climate change greatly amplifies the conditions that lead to more intense rainfall and flooding events. For each 1 degree Celsius of temperature increase, the hydrological cycle intensifies by 8 percent. So evaporation events and rainfall events grow ever more intense as the world warms.

Though storms, on aggregate, dump 8 percent more rain, and evaporation sucks 8 percent more moisture up from the lands and ground, the uneven nature of weather results in a powerful amplification of extreme events. So what you end up with is both far more powerful severe storm systems and far more intense and rapidly asserting drought conditions.

We see these increasingly more dangerous events now at 0.85 C warming above the 1880s average. And we have locked in about 1.9 C warming this century and 3.8 C long-term warming due to the gasses we’ve already emitted. But continued fossil fuel burning will make the situation considerably worse.

Links:

Jammu and Kashmir Flood Toll Climbs to 160

Jammu and Kashmir Floods are Worst in Six Decades

LANCE-MODIS

University of Nottingham

How Climate Change Spurs Severe Weather

Hat-tip to Colorado Bob

March to Stop Climate Disruption: “This is the Most Fateful Battle in Human History, We Will Fight it Together”

Climate change is more than just an environmental issue. It’s an issue that defines how we live, where we will life, and whether or not our children and our grandchildren will live. For billions of innocent creatures across this world it’s an issue of extinction or continued survival. The human animal included.

It is the most critical justice issue of our time and of all time. For it determines whether or not there is a time after.

We cannot allow the forces now in the process of ravaging our world, the forces that are taking away our future, to proceed unchecked. And so we must send out this wide-ranging call for action. We must light the beacons on the mountains and hillsides and we must call all responsible people together so that their voices will drown out the all too-strong and oppressive forces calling for silence.

We must be heard. Life demands it. Love for our children demands it.

The cause could not be more urgent. For time is swiftly running out.

We must act! We must act! We must ACT!!

Or we will be consigned to the dust by our own and ever-too-violent hand.

Disruption and The People’s Climate March

“This is the most fateful battle in history and we will fight it together!” — Bill McKibben

I urge you all to join me in going to New York for The People’s Climate March on September 21st. And I urge you to join with me in watching what is likely to be the most significant independent documentary film ever released — Disruption — which will begin airing tomorrow (see trailer above).

the wheel of time is empty and the book of life is blank

(Who drew this mysterious and chilling pictogram during Renaissance times? The Wheel of Time is Empty and the Book of Life is blank. Of the triple goddess, the fates, only the Crone and the Mother remain, implying that the Virgin, representing future life, is gone. As for the skeletal Hart, I will leave that riddle to you. …This is a fate that is unacceptable.)

We must send a strong message that we will not longer stand quietly by as our climate continues to rapidly degrade and as our future is swept away. The time to languish in a steadily decaying comfort is at an end. The time to sit by as prospects fall and more of the primordial terrors of the world are unleashed is at an end.

Justice demands that our voices be heard and that our voices be so loud as to turn every ear and so defiant as to demand an answer. The right answer. The only answer to climate change — climate action.

Join with me in fighting to save life, in fighting to save our civilization, in fighting to save history.

Links:

The People’s Climate March

Disruption

Last Chance for 2014 El Nino: Second Kelvin Wave Strengthens in Pacific Amid Favorable Atmospheric Conditions

2014 has been a rough year for El Nino forecasting.

During Winter and Spring, an extraordinarily strong Kelvin wave rocketed across the Pacific. Containing heat anomalies in excess of 6 C above average, this flood of trans-Pacific warmth hit the ocean surface, dumping an extraordinary amount of heat into the atmosphere. The heat helped drive global sea surface temperatures for May, June, and July to all-time record values.

Many forecasters believed that this heat would lead to a moderate to strong El Nino event starting this summer. And, by June, NOAA was predicting that El Nino was 80% likely to emerge some time this year.

But the initial oceanic heat pulse was crushed by a failure of atmospheric feedbacks. The trans-Pacific trade winds, with a few visible exceptions, remained strong enough to suppress El Nino formation. And so it appeared that, by late July, the initial powerful heat pulse providing potential for El Nino had almost entirely fizzled.

Then, a second warm Kelvin Wave began to form even as Southern Oscillation values started to fall.

Second Warm Kelvin Wave Crosses Pacific

(Second warm Kelvin Wave running across Pacific has resurrected the potential for a weak to moderate late 2014 El Nino. Image source: Climate Prediction Center.)

This second Kelvin Wave contains a broad swath of +2 to +5 C anomaly values and is rapidly propagating toward the surface zones of the Central and Eastern Pacific. And though not as strong as the Kelvin Wave that formed earlier this year, the current Kelvin Wave is occurring in conjunction with what appears to be a somewhat more robust atmospheric feedback.

The Southern Oscillation Index, a measure of pressure differences between Tahiti and Darwin, is an indicator of Nino related atmospheric conditions. At consistent values below -8, weather variables tend to favor El Nino formation. And, for the past twelve days, 30 day averages have been below the -8 threshold. If these values extend for much longer, the coincident warm Kelvin Wave and atmospheric conditions favorable for El Nino may well set off this long-predicted event.

Model runs still show a 60-65% chance of El Nino formation before the end of this year and NOAA’s forecast continues to call for a weak El Nino forming some time in late 2014:

El Nino Forecast

(Model Forecast shows 60-65 percent chance of El Nino by November through January. Image source: CPC/IRI.)

It is worth noting that this second warm Kelvin Wave is providing the last chance for El Nino in 2014. So if atmospheric feedbacks fade and sea surface temperatures remain just on the high side of ENSO neutral, then 2014 will close without the incidence of this wide-scale Pacific Ocean and atmospheric warming event.

With weak El Nino, however, there is still a likelihood that 2014 will tie or exceed hottest ever global surface temperature values. A failure for El Nino to form will probably result in 2014 closing as one of the five hottest years on record, given current trends.

Links:

Climate Prediction Center

CPC/IRI

Southern Oscillation Index


To Fear Peak Oil, Or to Pursue it? That is the Essential Limits to Growth Question

On a world in which fossil fuel burning is now in the process of setting off various events of geological scale, one of the things we could well hope for most is a peak in fossil fuel supply. Such an event would force countries and economies to adjust. To abandon business as usual economics and to rapidly shift to approaches that enhance and reinforce lifestyles and energy consumption behaviors that do not radically alter the world’s environment for the worst.

But, unfortunately, as we will see below, there is more than enough oil, gas, coal, brown coal, fracked oil and gas, gas hydrates, tar sands, kerogen and other fossil fuel stores to continue burning for years, decades and perhaps even centuries to come. So to hope for peak fossil fuel use, unless that peak is determined by responsible individual, community, and political action, is a false hope. An end that sets off terrible consequences. Even worse than those difficult to deal with problems we’ve already locked in.

USGS_-_Bazhenov_Formation_Oil_Reservoir

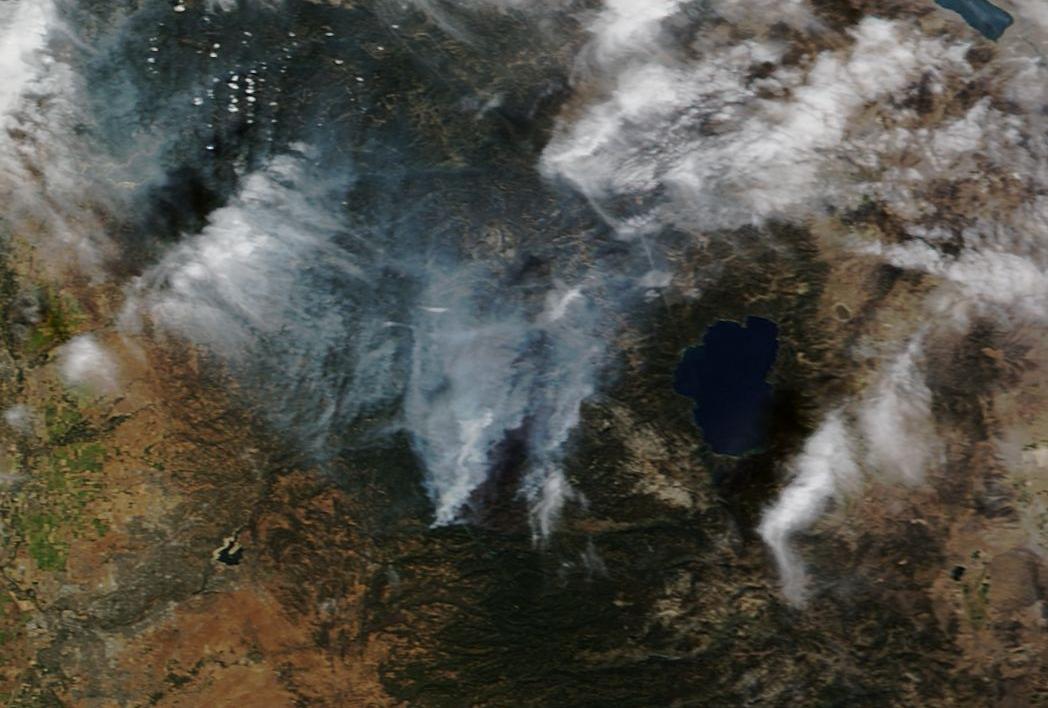
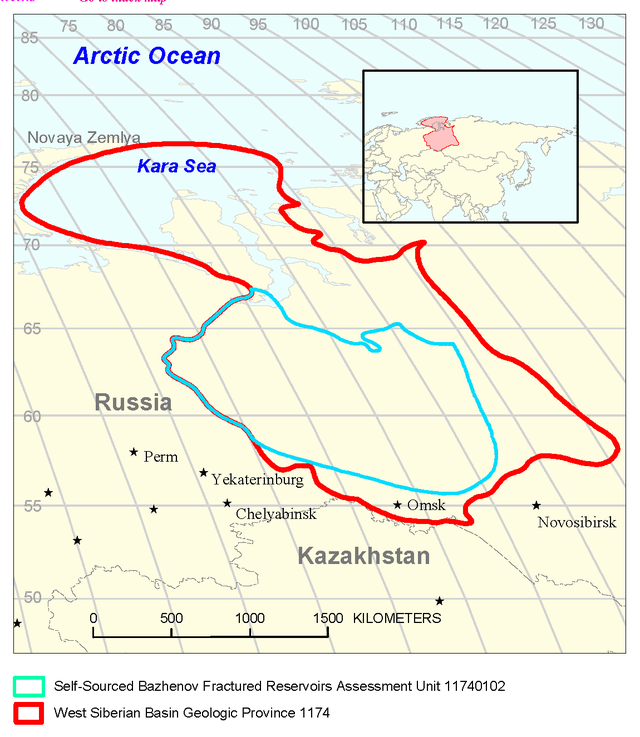
(The Bazhenov Shale Formation. An Arctic oil and gas reserve now accessible due to US driven technological ‘advancements’ in hydro-fracking. This vast pool of tight oil has 1.2 to 2 trillion barrels of oil in place of which 75 to 330 billion barrels are currently estimated to be recoverable [Depending on who is making the estimation — US or Russian Government]. It is, perhaps, not a coincidence that these reserves occur in the same region where troubling methane blow-holes first appeared this summer. It is this massive supply of oil that is being directly targeted by the Exxon-Mobile/Rosneft partnership before sanctions this week put the effort on hold. Accessing this massive carbon bomb would lock in billions of additional tons of CO2 release into the atmosphere while, by itself, delaying a global peak in oil production by years to decades. The consequences of burning this massive fuel source are almost certainly far worse than simply leaving it in the ground. Image source: Commons.)

*****

Back in the mid 2000s there was an oil industry energy consultant by the name of Matthew Simmons. And Simmons had developed a laser-like focus on a massive store of ‘easy oil’ in the deserts of Saudi Arabia. This store was locked in the great oil field called Ghawar. A self-pressurized dome that originally contained about 80 billion barrels of the hothouse gas firewater we call oil. Prick Ghawar with a drill and the stuff just came erupting out. Deceptively clear for all the btus of global atmospheric heating it contained.

At some point, the black magic of Ghawar began to fade. Saudi Arabia started to inject water into the Ghawar well to keep the oil flowing. This required more energy and increased costs. For Saudi Arabia and much of the world, the age of easy oil was coming to an end.

Simmons declared that peak oil was just around the corner. That global oil production couldn’t exceed 85 million barrels per day. And that the new, unconventional sources — locked in tight oil deposits and tar sands — were too difficult to extract. Peak oil analysts declared that the Bakken would never exceed a flow rate of 100,000 barrels per day. And the Eagle Ford Shale basin was just a glimmer in the eye of most analysts. Risks for an imminent peak in world oil supply did seem quite high.

Bakken_Reservoir_fields_in_Williston_Basin

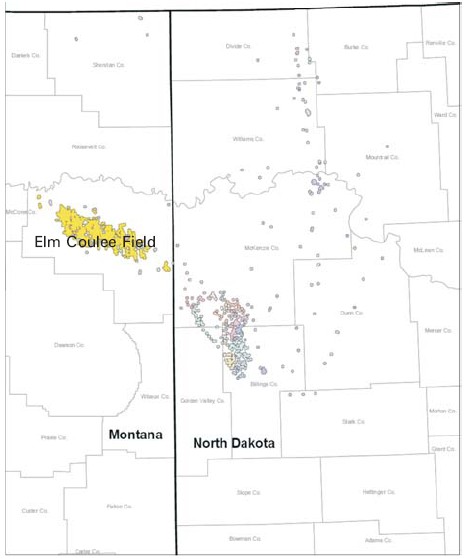
(Map of the Bakken tight shale fields in the Williston Basin. The Bakken is estimated to contain 24 billion barrels of oil of which 7.3 billion barrels are currently considered to be technically recoverable. Image source: Commons.)

For some, for conservationists and those who are justifiably very concerned about the impacts of continued fossil fuel based carbon emissions on the world’s climate systems, the notion of an imminent peak in world oil supply came as welcome news. It would force economies to adjust to new structural and environmental realities and it would help to prevent some of the worst impacts of climate change. Certainly, there were still massive volumes of coal and natural gas to consider. But a peak in world oil production would lead to a variety of consumption reductions as well as help to advance renewable energy technology — so long targeted for delay and denial by oil and fossil fuel interests through their wealthy political backers.

For most market analysts and economists, peak oil was never an object. They believed the magic of market economics would always provide a new resource and that the price signal would be enough to produce more resources of different varieties. But these analysts were somewhat blind to the broader impacts of large governmental movements and of investment or failure to invest in new resources by communities, states, and policy-makers.

In many ways, all of these analysts held somewhat correct views. But contained to their narrow focus, they failed to accept where the others were correct or to see their own short-comings. A vocal portion of the peak oil analysts, led by Simmons, retained a narrow, and primarily easy oil and fossil fuel centered world-view that not only denigrated the effectiveness of new oil technology to over-come any peak oil situation, but also blithely dismissed much of the potential for renewables to take up for new energy production. They held a rigid view that only radically reduced consumption (and related implied wide-scale poverty and collapse back to 19th century standards of living) would result from peak oil and that such reduced consumption and collapse was needed and, indeed, would happen whether we liked it or not. Some conservationists seemed to glom on to the notion that renewables were not a desirable solution and this led steam to the anti-renewables faction.

Though the push for lower consumption from peak oilers and conservationists was somewhat helpful, without the renewable option their world-view led to more implied reliance on fossil fuels through active denial of alternatives. And it left the door wide open for new oil related extraction technologies to come charging in absent any wide-spread renewable energy adoption.

The market analysts were labeled ‘cornucopians’ by the more militant peak oilers or related agitators. In fact, this was a term that seemed to include anyone who supported any technology whatsoever, including sustainability based technical solutions. Contrary to peak oilers, the analysts pushed a view that the supply crunch, at first, wouldn’t happen. And, when they were proven wrong, went about cheer-leading for the new fracking technologies and for opening up the unconventional oil basins.

An outside group of progressives pushed hard for new renewable resources. And, given the opening provided by high fuel prices, they were partially successful, despite the constant attacks coming from renewable energy detractors and in spite of a broad front of oil industry advanced extraction technologies competing in the energy investment sector.

Consequent to Simmons’ warnings, a peak in conventional fuels did happen during the period of 2006 to 2008. Prices rocketed and economies were jarred by the shock. A shift toward more renewable energy and efficiency was driven by the crisis. Consumption fell and the world economy stalled in a combined energy and market derivatives crash. But the market signal and increased prices for energy unlocked technology that lead to the rapid expansion of production in Bakken, Eagle Ford, in Canada’s tar sands and in other far-flung basins around the globe.

EIA_Map_of_Eagle_Ford_Shale_Play

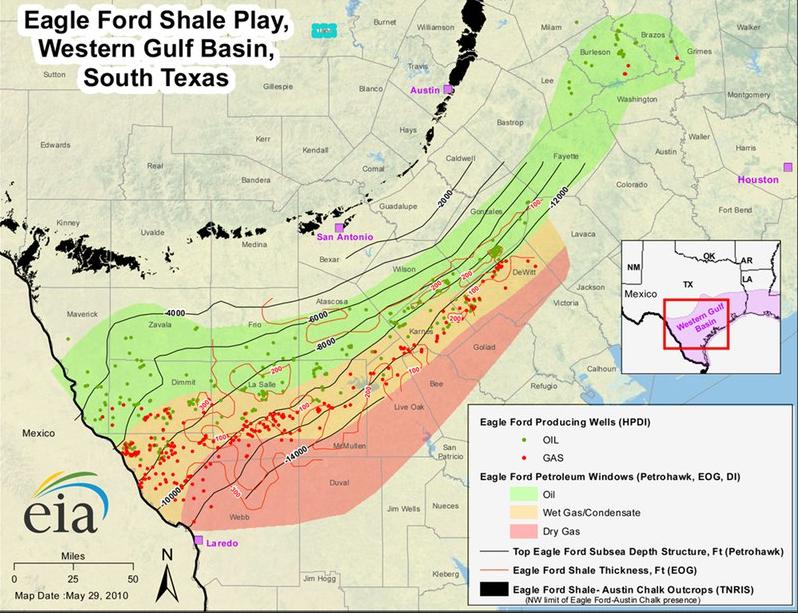
(EIA map of the Eagle Ford shale play in South Texas. It’s a basin that extends into North Mexico and contains an estimated 10 billion barrels of recoverable together with trillions of cubic feet of natural gas. Image source: Commons.)

Today, the wretched energy and carbon intensive and highly polluting process that is fracking now squeezes 1 million barrels per day out of the Bakken formation. It wrings 1.7 million barrels per day out of the Eagle Ford formation. Add this staggering production gain to other fracking and conventional extraction efforts across the country and we find that the United States now produces a staggering 13.9 million barrels of liquid fuels per day.

This makes the US the highest volume liquid fuels producer in the world on the back of a terrible breaking of the ground and increasing extraction of a fuel source that is already in the process of wrecking the world’s climate.

Globally, despite struggling production in the Middle East and elsewhere, production of the firewater continued to rise. Canada’s tar sands production spiked to more than 2 million barrels per day with the Arctic state planning for a jump to 5 million barrels per day by 2030. An ongoing carbon bomb explosion that, by itself, could well be described as a tract of human-generated flood basalt.

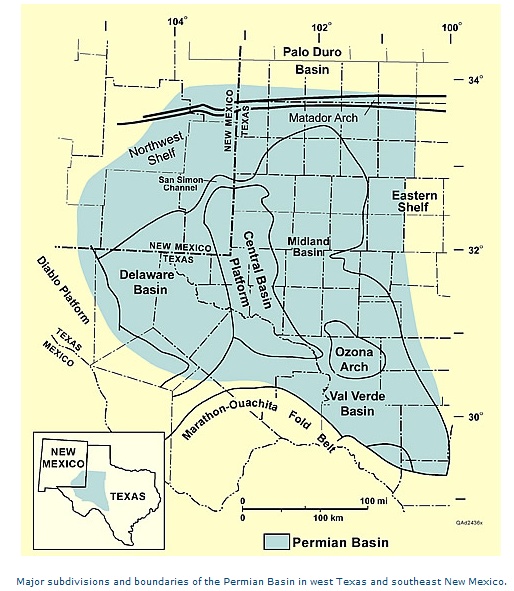
These and other oil sources combined with enhanced extraction to push global daily oil production from 85 million barrels per day during the mid 2000s to approaching 92 million barrels per day in 2014. This on the back of oil reserves additions in the form of tar sands at 168 billion barrels of extractable oil (total reserve at around 300 billion barrels), Eagle Ford at 10 billion barrels of currently recoverable oil (total reserve at 80 billion barrels), West Texas at 30-75 billion barrels of recoverable oil, Bakken at 7.3 billion barrels of recoverable reserves, and many other regions around the world that are now seeing new oil extraction or enhanced oil extraction.

Permian_Basin

(The Permian Basin of West Texas now containing between 30-75 billion barrels of recoverable oil due to climate-endangering fracking technology. Image source: Commons.)

So Simmons was wrong on the issue of oil peaking at 85 million barrels per day, and many peak oil analysts along with him.

And so it goes with the global fossil fuels story. As of 2014 we burn more oil, gas and coal than we ever have and global peak oil has again been removed to some future date. The global carbon emission is now enough to completely overshoot the lower range IPCC emissions scenarios and we are staring down the face of the highly unpleasant middle and worst case ranges. So in this respect, a number of peak oilers were dreadfully wrong — peak oil did not save us from climate change. In fact, bad effects are now locked in and the debate has shifted to whether or not there is enough extractable oil, gas and coal to hit the worst case scenarios.

But if history doesn’t repeat itself, it does rhyme. For now it appears that both Eagle Ford and Bakken, due to the nature of rapid fracked well depletion, will peak sometime during 2016 and 2020. And the peak oilers are now having a bit of a rally, as challenges to global production, many of them political, are also continuing to expand.

On The Verge of a Voluntary Peak

The environmentalists and scientists, thankfully, appear to be on the verge of successfully putting a crimp on Canada’s tar sands production. The US has sanctioned Russian oil production and a massive set of Arctic and shale reserves many times the US tight shale reserve hangs in the balance (a resource of ultimate reserves on the order of 1.2-2 trillion barrels of oil of oil in place). Barriers to fracking are rising and companies, facing a production glut today and investor uncertainty tomorrow, are in the process of consolidation and retraction.

China is pledging to vastly reduce fossil fuel consumption growth and many oil exporters are beginning to wonder if they’ll have a market for their products there. Around the world, the situation is similar as governments and consumers both push for less use of dirty, dangerous, depleting and costly fossil fuels.

In addition, renewable energy and alternatives have never been more widely available. Solar panel costs are down and EROEI is up. Wind power beats fossil fuel generation in most markets even when considering a natural gas glut due to fracking. Electric vehicles continue to become more widely available and CAFE standards around the world keep rising. An expanding movement is afoot to shift diets to less meat intensive ones — thereby pushing for a reduction in both the land and fossil-fuel use footprint of agriculture. And all these changes aim directly at reducing fossil fuel demand and consumption, generating impetus, along with the political movements targeting both new and old sources for an artificial, voluntary peak in fossil fuel flows.

And this is exactly what we would desire, a direct refusal of business as usual economics. A voluntary taking on of responsible action, economic transition, and behavior change needed to reduce and eventually eliminate an extraordinarily damaging carbon pollution. As has been said, the Stone Age didn’t come to an end for lack of stones. And this could well be the case with fossil fuels, if we actively make that choice. Whether or not it happens essentially depends on people’s perception of the need for it to happen.

Fear of Peak Oil as a Means To Force Continuation of Business as Usual

But the voluntary peak is no-where near a pre-ordained certainty. There is an extraordinarily strong array of political forces aimed at both denying the existence of climate-related harm and doing everything possible to extend business as usual fossil fuel extraction for so long as it is economically and technologically possible. To deny the expansion of renewable energy access and to block access to measures that reduce consumption. To, overall, degrade the political will to respond effectively to a climate crisis that is directly linked to ongoing fossil fuel burning.

And one potential political lever for this forced extension is advancing the fear of peak oil. For if people are wrongly led to believe that peak oil is a worse event than climate change, then it is unlikely people will make the changes necessary to transition away from fossil fuels. They, like the climate change deniers, will cling to fossil fuel extraction in the same way passengers unaware of the existence of life-rafts will cling to the upper tiers of a sinking ship.

How does fear of peak oil work? It’s simple.

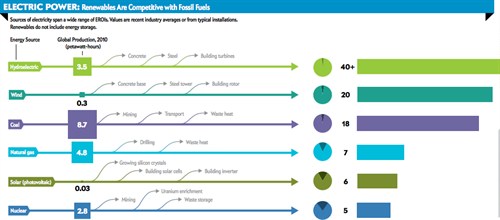
First deny, degrade or ignore any potential value to human civilization for renewable energy sources (this is easy for oil industry folks, because they’ve had years of practice advancing anti-renewables misinformation). This includes using energy return on energy invested (EROEI) figures that are outdated or simply false.

eroi_500x220

(In the EROEI battle, renewables win the electricity production race hands down. From top to bottom: light green = hydroelectric, teal = wind, purple = coal, light blue = nat gas, dark green = photovoltaic solar, and dark blue = nuclear. It’s worth noting that solar pv energy return on energy invested continues to rise and is now estimated at 7 according to newer figures. It is also worth noting that the best energy return on investment for individual vehicle transportation comes from an electric vehicle plugged into a renewables fed grid. Image source: Scientific American.)

Second, declare an extreme supply-side ideology in which only fossil fuels have any practical means to fulfill supply needs. In this view, all farming relies on fossil fuels and cannot trade inputs or flexibly change how food is produced to help ensure resiliency (meat to veg, polyculture agriculture, edible landscaping, individually grown gardens, etc). So if fossil fuels peak, access to food is seen to peak as well.

Third, over-emphasize the value of fossil fuels to all levels of civilization with the implied need for fossil fuel related industry to support civilization.

This mind-set is in direct contradiction to the appeal first advanced by Limits to Growth authors for a transition to a sustainable civilization that did not rely on environment-polluting and resource-destroying energy sources as the basis for its prosperity. In fact, it directly obscures the need for such solutions by placing the notion that civilization is only sustainable so long as fossil fuels are available and that civilization inevitably dies without them.

From LTG:

If society’s implicit goals are to exploit nature, enrich the elites, and ignore the long term, then society will develop technologies and markets that destroy the environment, widen the gap between rich and poor, and optimize for short-term gain.

And it is reliance on fossil-fuel based technology that directly reinforces the vicious cycle that Meadows so eloquently describes above.

The final element of the fear peak oil and cling to fossil fuels mind-set is to, at last, deny climate change and, more specifically, to deny that enough fossil fuels remain in the ground to set off climate change that is a threat to human civilization. And it is in this assertion, that they have excessively over-reached and are baldly incorrect (as many who keep tabs here are well aware).

massive carbon reserve

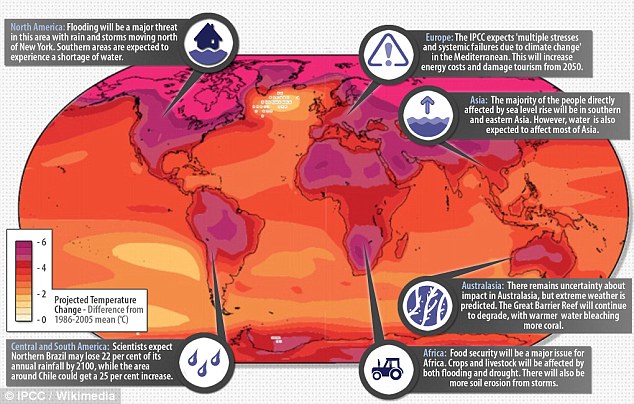
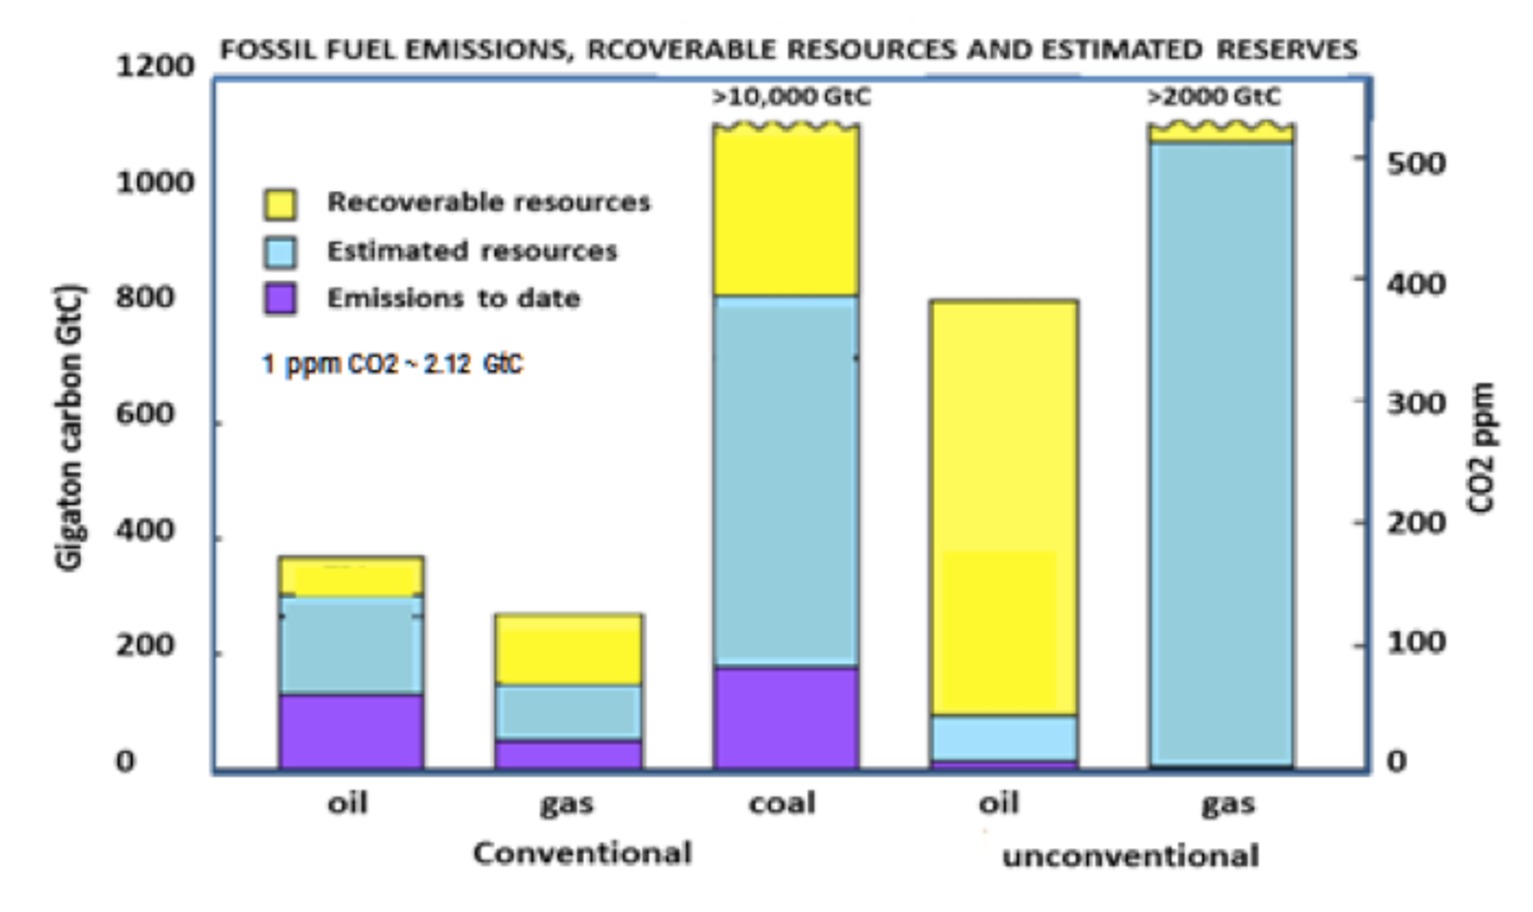
(More and more of a globally estimated 13-20 trillion tons worth of fossil-fuel based carbon are unlocked through advancing extraction technology each year. Is it really a sensible approach to simply wait for such technologies to fail? Image source: IPCC.)

Negative Impacts of Climate Change Now Ongoing, More than Enough Fossil Fuels to Wreck the Climate Many Times Over

So with oil and fossil fuels demand now in trouble due to a broad political and grass-roots response, due to spreading measures that reduce fossil fuel consumption, and due to rapidly expanding ease of access to various renewable energy based technologies, a new Matthew Simmons – type view has emerged.

The view is that Bakken and Eagle Ford are about to peak and with it, North American fossil fuel production will plateau or start falling and that a global peak is in the offing sometime around 2030. As with the Ghawar field focus, the view is likely correct in micro. The fields will probably peak by 2016-2020 and global oil production during the same period will (thankfully) suffer due to a combination of reluctance to invest on the part of oil companies, political constraints that hamper oil flows in Asia and the Middle East, and due to broader conservation measures and alternative energy adoption that begins to put the crimp on world oil demand.

And how we respond to this potential crisis in world oil supply will have far-reaching impacts for both energy and climate going forward. If we see the peak as something we must avoid at all costs, what we will witness is the rapid expansion of fracking in foreign countries to include the exploitation of massive tight fuel resources in Russia and China. We will see the expansion of US oil production through enhanced extraction in the West Texas formation. We will see the barriers to tar sands extraction fall and Canadian tar sands oil rocket to 5 million barrels per day. We’ll see the China syngas operation horrifically expand to an environmental catastrophe to rival that of Canada’s tar sands. And we’ll see the first forays into gas hydrate extraction. We’ll see more coal plants converted to burn brown coal – a massive resource already exploited in conventional coal-poor regions. And we’ll see oil extraction extend into the climatologically violent Arctic.

This expansion will not come without its severe costs. Fossil fuel prices will rise, poverty in many regions will expand. But without some major catastrophic event, net consumption, driven by an ever-expanding fossil fuel and related industry, will continue to increase over at least the next two decades and may well extend beyond 2030 as the massive unconventional resources continue to be tapped. For the political will for reducing such consumption will have been subsumed by fear of peak oil and the alternatives will, again, have been tamped down.

Or, instead, we can embrace peak oil and stop trying to fight off what will inevitably occur over the course of decades or centuries. We can actively decide to change how much and what we consume and we can push hard for renewable energy and broad sustainability measures in agriculture. And through that action we might prevent a portion of the climate catastrophe we have already partly locked in. We can learn not to fear peak oil, but to pursue it, along with the will-full and socially chosen peaking of all fossil fuel sources. We can say goodbye to the age of burning and open a new age where we attempt to deal with the consequences of fossil fuel based industrialism before it’s too late. Before we no longer have the opportunity to.

That’s our choice. But going into it, don’t be comforted with false notions that we don’t have enough carbon sources to wreck the climate. And don’t, for goodness sake, embrace the notion that peak oil is the worst problem we face. Instead, it is a necessary problem. Part of the active and, admittedly, difficult act of changing how we live and of attempting to make human civilization both a more resilient and less harmful beast.

Links:

Bakken Shale Oil Boom

Eagle Ford Crosses 1.5 Million Barrels Per Day in September

US Energy Information Agency’s Short Term Energy Outlook

The Case For a Moratorium on Tar Sands Development

Alberta Energy

West Texas Shale Could Dwarf Eagle Ford

Permian Basin Oil Production

How Many Barrels are in the Bakken?

The Bazhenov Formation

Behind the Numbers on Energy Return on Investment

The Ghawar Oil Field

Limits to Growth

Twilight in the Desert

Hat tip to Pintada (in answer to some of your questions)


It’s All About Fresh Water — Rapid Sea Level Rise Points To Massive Glacial Melt in Antarctica

It’s all about fresh water. In this case, massive freshwater outflows from the vast glaciers covering Antarctica.

This week, a new scientific report published in the Journal Nature found that from 1992 through 2012 freshwater outflow from Antarctica’s massive glaciers exceeded 400 gigatons each year. An immense flood of cold, fresh water. One that helped push sea levels rapidly higher around the Antarctic continent.

But with glacial melt on the rise and with mountains of ice now inexorably sliding seaward, these freshwater flows may just be the start of even more powerful outbursts to come. And such prospective future events have far-ranging implications for sea level rise, global weather, sea ice, human-caused climate change, and world ocean health.

Flood of Fresh Water Drives More Sea Level Rise Than Expected

The researchers discovered the tell-tale signature of this vast freshwater flood through chemical analysis of the seas surrounding Antarctica. The analysis pointed to a broad and expanding fresh water layer over-riding a warmer, saltier current issuing in from the Southern Ocean.

Since fresh water is less dense than salt water, the freshwater layer expands at the ocean surface causing sea levels to rise more rapidly. Meanwhile, the heating of the deep ocean surrounding Antarctica is thought to result in additional thermal expansion of the water column.

The researchers note:

On the basis of the model simulations, we conclude that this sea-level rise is almost entirely related to steric adjustment [changes that effect atomic spacing], rather than changes in local ocean mass, with a halosteric [salt based] rise in the upper ocean and thermosteric [heat based] contributions at depth. We estimate that an excess freshwater input of 430 ± 230 Gt yr−1 is required to explain the observed sea-level rise. We conclude that accelerating discharge from the Antarctic Ice Sheet has had a pronounced and widespread impact on the adjacent subpolar seas over the past two decades.

Antarctic Sea level Trend

(Rate of sea level rise in the seas surrounding Antarctica since 1992. Aggregate sea level rise is indicated in black. Individual seas data is broken out by color. Image source: Nature.)

Previously, increased rates of sea level rise surrounding Antarctica were thought to have been set off by increasing winds around the continent. The winds were thought to push more water up against the ice faces forming a kind of perpetual, low-grade storm surge. But the current finding provides strong evidence that the source of the sea level rise is due to less dense fresh water over-topping saltier waters flowing in from the Southern Ocean combined with increasing heat along the Antarctic sea bed. And, notably, this is not the first study to find increasing freshwater flows spilling into the Southern Ocean. Last year, a KNMI expedition uncovered similar results.

More Evidence of Large-Scale Melt

The study comes on the back of other recent findings showing that warm water invasion at Antarctic glacier bases had led to more rapid than expected melt and destabilization. In May, two NASA studies showed that a broad section of West Antarctica had destabilized and was sliding at an ever more rapid pace toward the ocean (see reports here and here). These findings held stark implications for global sea level rise as large ice regions of Greenland and West Antarctica, containing enough water to raise seas at least 15 feet, are likely already in a state of irreversible collapse.


Regional Anomaly Sea level Antarctic

(Sea level rise anomaly of the region surrounding Antarctica compared with the rest of the Southern Ocean. Red indicates faster than normal sea level rise. Blue indicates slower than normal sea level rise. Image source: Nature.)

This intensifying glacial melt and associated freshwater cap expanding out from the pole has implications — not just for sea level rise, but for sea ice, weather, and world ocean system health.

Impacts For Sea Ice

Large outflows of glacial fresh water may well be involved in the recent observed expansion of sea ice in the zone surrounding Antarctica (see recent related study). Fresh water serves as an insulative cap on the ocean surface preventing warm water from entering the top layer from below. The warm, salty water, in the Antarctic instead pools near the bottom or at the base of the great ice sheets.

Fresh water also freezes at a higher temperature than salt water. So sea ice in an expanding freshwater zone around Antarctica would have naturally higher resiliency even to the rising temperatures now occurring due to human-caused warming. Eventually, however, human heat forcing would overwhelm the ice, but not before a period of related, localized negative feedbacks.

The Iceberg Cooling Effect

The fresh water is a haven for sunlight-reflecting sea ice. It is interspersed with ice bergs from the glacial discharge and the large ice bergs cool the surrounding air. The fresh water layer prevents warm water upwelling from the warm, deep waters surrounding Antarctica. And the leading edge of the fresh water would drive salt-water down-welling along its advancing front. This would push warmer waters toward the ocean bottom, resulting in a kind of heat sink. And this is exactly the kind of dynamic that appears to be ongoing in the Southern Ocean now. These combined impacts are what is known as the ice berg cooling effect associated with large-scale glacial outbursts known as Heinrich Events. And we may well be in the process of setting off one of these geological scale nightmares.

20121230_iceberg_cooling_effect_Hansen_Sato

(Iceberg cooling effect under a mid-range warming scenario when global climate models were set to include the effects of large freshwater outflows from polar glaciers at a fast enough rate to raise seas by 60 cm through 2060 and 144 cm through 2080 [left frames]. Note the cooler zones in the Southern Ocean and North Atlantic adjacent to Greenland. Right frames include mid range emissions/warming scenarios and IPCC projected rates of sea level rise. It is worth noting that the amplifying effects of potential additional ghg release from the global climate system, particularly from Arctic and world ocean carbon stores, are not included in these simulations. Image source: Hansen and Sato.)

For global weather, such events have major implications. Regional cooling in the zone of freshwater outflow would juxtapose regional warming in the southern hemisphere meridional zones. This temperature differential would increase with the strength of the fresh water outflow and the rising intensity of the human-driven warming. The result would be a powerfully intensified storm track. Both the intensified storm track and increased atmospheric moisture loading due to human warming would result in much more powerful weather events than we are currently used to and the potential for catastrophic storms would drastically increase.

Amplifying Feedbacks and a Blow to World Ocean Health

Lastly, the expanding flood of fresh water would result in an increasing stratification of the world ocean system. This stratification would drive warm, salty water toward the ocean bottom and deplete already low oxygen reserves in that region. In addition, the extra heat is more likely to destabilize deep-sea clathrates — releasing methane which will speed in the oxygen depletion of the abyssal waters even as it tips the world ocean system to stop storing carbon and to begin releasing it. A combined feedback that is both an ocean killer and an amplifier to the already extraordinarily powerful human heat forcing mechanism.

Links:

Rapid Sea Level Rise Along Antarctic Margins Due to Increasing Glacial Discharge

Important Role For Ocean Warming and Enhanced Ice Shelf Melt in Sea Ice Expansion

Update on Greenland Ice Sheet Mass Loss: Exponential?

Grim News From NASA: West Antarctica’s Entire Flank is Collapsing

Nature: Human-Destabilized Antarctica Capable of Glacial Outbursts Contributing to Up to 14 Feet of Sea Level Rise Per Century


No More ‘Hiatus’ — Human Emission to Completely Overwhelm Nature by 2030

Keep burning fossil fuels at current rates and you can kiss nature’s influence over temperature good-bye. That’s the conclusion of two recent scientific studies.

*****

Humans are forcing heat trapping substances into the atmosphere at a terrifying pace. We pump out more than 10 billion tons of carbon on the back of about 50 billion tons of CO2 equivalent hothouse gasses into the atmosphere each year. This massive volume is the upshot of an inexorably rising emission starting during the 19th century and continuing to this day. By the end of this century, rates of burning could again increase nearly threefold.

The current, rampant pace of human emission is now at least six times faster than at any time during Earth’s geological past. But on our current path, that rate could exceed 20 times that seen during any of the previous worst hothouse extinction events.

Emission scenarios

(Current rate of annual carbon emissions in gigatons [black dots] compared to IPCC projected scenarios. Note that current human emissions are on the worst case emissions path. Image source: Global Carbon Project.)

This incredible rate of emission was the key factor in two new studies issued this week investigating the possibility of future hiatuses or ‘pauses’ in global warming due to nature-driven variability (see the studies here and here). And what the studies found was that rampant human burning of fossil fuels removed any possibility for hiatus decades driven by natural variability after 2030.

In essence, we are in the process of shutting down nature’s temperature-related influence entirely.

Understanding Natural Cycling Between Warm and Cool Periods

Natural shifts between atmospheric warm and cool spells appear to be primarily driven by how much heat the oceans uptake or expel.

In the Pacific, this rate of heat uptake is driven by the strength or weakness of the trade winds driving across the equator. During periods in which the trade winds are strong, a great volume of air contacts the surface water and more atmospheric heat is driven into the ocean through down-welling. During periods in which the trade winds are weak, the atmosphere-to-ocean heat transfer shuts down even as warmer waters rise from the depths and spread out across the ocean surface. During these times, the ocean is dumping heat back into the atmosphere.

A similar process happens in the Atlantic where salty, warm surface water down-welling transfers atmospheric heat toward the deep ocean. When that process shuts down, more heat piles up at the ocean surface and bleeds back into the atmosphere.

The first of these processes is called Interdecadal Pacific Oscillation (IPO — which is related to ENSO variations) and is thought to be the primary governor of this global natural variability. The second process, Atlantic Multidecadal Oscillation (AMO), is thought to be the lesser of the two forces.

Past Variability in the Global Temperature Record

Even with large-scale human warming proceeding throughout the 20th Century and into the 21st Century, we can see the effects of this natural variability on the global temperature record. During naturally driven warmer periods human-caused warming advances rapidly. During two of the naturally driven cool periods, human forced warming has a set-back, and, during the third, only seems to briefly slow down.

Temps since 1880

(Global temperature record as compiled by NASA. Note how warming has traditionally proceeded in a step-like fashion. Image source: NASA GISS.)

Taking a closer look, we find that the time from 1880 to 1910 saw global surface temperatures falling by 0.2 degrees Celsius as ocean heat uptake increased and IPO went negative. From 1910 to 1940, the IPO driver switched into positive. As the oceans disgorged their heat, the first effects of human greenhouse gas heat forcing became evident as global temperatures jumped by 0.45 degrees Celsius over a 30 year period. From 1945 to 1975, IPO again switched into negative, but this time human forcing was in the driver’s seat and temperatures only fell by around 0.06 degrees Celsius. By 1975, temperatures were again on the rise and through 2002, the heat spike rocketed fully 0.6 degrees C upward.

From about 2002 onward, we enter the current ‘hiatus’ period in which atmospheric warming, during a time when we should have seen cooling, has proceeded slowly despite major natural variability factors pushing for cooler atmospheres and warmer oceans.

Reducing Impacts of Natural Variability

The term ‘global warming hiatus,’ however inaccurate, is a new invention. Its use first cropped up over the past couple of years as human greenhouse gas forced warming seemed to slow somewhat from its rampant upward pace through the 1980s and 1990s. This brief pause in atmospheric warming caused some global warming skeptics to declare an end to human-caused heating. An extraordinary claim in the face of highest ever heat-trapping gas emissions.

But what was really happening was that natural variability, which should have been driving the Earth’s atmosphere to cool, was starting to take a back seat.

For two recent studies, mentioned above, found that natural variability driven temperature change has radically fallen even since the 1980s.

The first study, headed by Masahiro Wantanabe, found that, during the 1980s natural variability was responsible for about 47 percent of the observed global temperature change. By the 1990s, this number had fallen to 37 percent. And as an IPO driven switch should have led to cooler temperatures during the 2000s, Wantanabe finds that the effect of natural variability had again plunged to 27 percent.

The cause for the loss of the temperature driving effect of natural variability, according to global climate model runs, is a stunning rate of human greenhouse gas increase. And a related study led by Nicola Maher found that if greenhouse gas emissions by humans kept rising at ever more rapid rates, the natural variability measure is completely overwhelmed by 2030:

The likelihood of future hiatus periods is found to be sensitive to the rate of change of anthropogenic forcing. Under high rates of greenhouse gas emissions there is little chance of a hiatus decade occurring beyond 2030, even in the event of a large volcanic eruption.

Under the worst case emissions scenario — RCP 8.5 — natural variability is completely subsumed by human warming by 2030. Continuing on this track through 2100 means that the human forcing is so strong that even a volcanic eruption on the scale of Krakatau would not be enough to generate a warming hiatus.

For those considering use of solar radiation mitigation through aerosol inject, this point is a very important one to consider. It is a basis for proof that such mitigation eventually radically fails to reduce greenhouse gas heating effects if levels of emissions are not also drawn down.

Sadly, we are currently on the RCP 8.5 track. But, according to the studies, if humans could somehow rapidly reduce greenhouse gas emissions, the effect of natural variability on climate would be at least somewhat preserved.

Human-Forced Variability

The discussion of natural variability does not include instances in which human heat forcing produces outcomes outside of natural variability. The most obvious of these would be a large glacial outburst event in which enough water is released from Greenland and West Antarctica to raise seas by 1 meter or more this century. Such an event would have a temporary cooling effect that could result in an unnatural hiatus in warming. Such a human-forced variability was not considered in these global climate model studies, but it is worth considering as the strength of the now rampant human heat forcing continues to increase.

Links:

Global Carbon Project

NASA GISS

Contribution of Natural Variability To Global Warming Acceleration and Hiatus

Drivers of Decadal Hiatus in 20th and 21st Centuries

No More Pause — Global Warming Non-Stop From Now On

Hat Tip to Colorado Bob