Before we get into the latest record or near record global heat news, I’d just like to make a brief announcement. Concordant with editorial guidance from The Guardian, I’ll be changing my climate communications to more fully reflect the crisis that is now ongoing. Whenever possible, I’ll be using the words — climate crisis to replace climate change, and global heating to replace global warming.
I’ve already made liberal use of the term human forced climate change — this will change to human forced climate crisis or global heating when possible. In addition, the elevation of linkages between fossil fuel burning — which is the crisis’ primary driver — to present global heating will continue.
(Global heat for April of 2019.)
In my view, this verbiage more sufficiently communicates a necessary sense of urgency. For the climate crisis is upon us now and we are now experiencing more extreme impacts. In other words, we’ve already taken one full turn of the climate crisis ratchet by allowing fossil fuels to continue to dominate our energy systems. We don’t want to experience a second or third full turn and the related terrible tightening.
*****
The climate crisis deepens further…
According to NASA GISS, global temperatures have again jumped into near record hot ranges. Readings from this key global monitor found that April of 2019 hit 0.99 degrees Celsius above mid 20th Century ranges. This is about 1.21 C above 1880s values that bound the start of the NASA monitor. In total, it’s a value that makes April of 2019 the second hottest such month in the 139 year global climate record. And the temperatures we are experiencing now are likely the hottest annual and decadal averages in the last 120,000 years.
(April of 2019 anomalies paint a picture of global heat. Image source: NASA.)
Looking at the NASA temperature anomalies map above we find the greatest departures from typical April averages centering on the higher latitudes of the Northern Hemisphere. This distribution of abnormal warmth is consistent with polar amplification in which relative warming tends to center on the poles as atmospheric greenhouse gas concentrations increase. The ongoing and massive burning of fossil fuels — beginning in the 18th Century and rapidly ramping through the 20th Century — has provided the majority of these gasses. They are pushing the Earth system into the severe warming spike we now see today.
Overall temperature track for 2019 is still behind the record hot year of 2016 (see predicted range by Dr. Gavin Schmidt above). And it appears likely that 2019 will hit in the range of 5th to 1st hottest on record. This year, however, is likely to strike close to or even above 2016 values during some months as the effect of the weak El Nino combined with the larger trend of global heating by fossil fuel burning sets the stage for potential new high temperature records.
(Want to help fight the climate crisis by transitioning to a clean energy vehicle? Get 1,000 to 5,000 free supercharger miles at this link.)
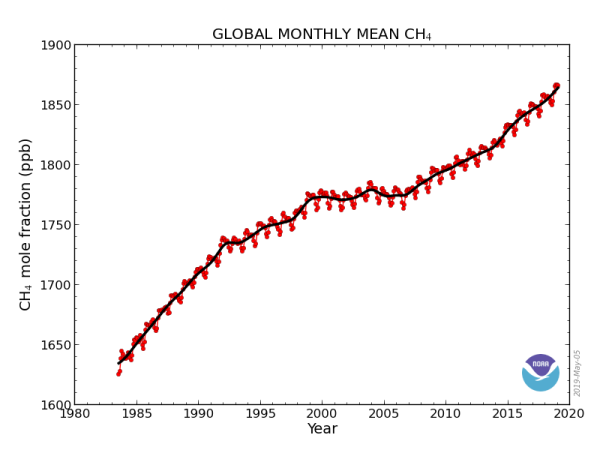
Globally, atmospheric methane levels have been on the rise over recent years. And though the rate of rise is not as dramatic as seen during the late 1980s (yet), the relative rise of atmospheric methane has caused concern among scientists.
Methane is a major heat trapping gas. And it is the #2 driver of human-forced global warming behind fossil fuel burning based CO2 according to NOAA’s Earth Systems Research Lab. It also has an out-sized potential to swing global heat trapping values higher due to the fact that a single molecule of methane can trap around 86 times more heat than a single molecule of CO2 over the same period of time.
(Global trends in methane show a concerning jump in atmospheric values since leveling off in the mid-2000s. A combination of earth environment feedbacks to warming and fossil fuel related extraction, burning and transport activity are primary suspects for this increase. Image source: NOAA ESRL.)
Methane is a much shorter lived gas (one molecule lasts 8 years in the atmosphere while a molecule of CO2 lasts 500 years), and atmospheric concentrations of methane are far, far lower than CO2 (measured in parts per billion, not parts per million), however. Which is one of the reasons why CO2 (primarily from fossil fuel based burning) is the gas in the driver’s seat of the majority of present warming.
Given this context, the new upward swing in methane is troubling for a number of reasons. Which begs the question — where is the excess methane coming from?
One primary suspect is that the Earth System, warmed by fossil fuel burning, is starting to produce its own feedback carbon emissions. The way this works is that warmer wetlands (a major source of methane) become more biologically active and, in turn, produce more methane. Heavier rains might provide more flooded regions in which microbes become productive. And thawing permafrost in the far north may be providing new wetland based methane sources. So the nascent methane emissions could be coming from such varied sources as tropical wetlands (as some experts point out), from thawing and expanding biologically active permafrost zones, from increasing wildfire activity, from increasing methane emissions due to drought, or any combination of the above.
Add in potentially very leaky and large-scale, fossil fuel infrastructure related to gas and legacy infrastructure related to coal and the list of suspects grows very long indeed. A hint at where the larger sources of methane show up, at least at present, is provided by the atmospheric observatories. In particular, I’m going to turn to the Copernicus Atmospheric Monitoring System (CAMS) for this part of today’s discussion:
(Global atmospheric methane hot spots indicated by CAMS.)
What we find from looking at this map is that the highest concentrations of methane presently correspond with the densest collections of fossil fuel based industrial activity. This jibes with findings that 60 percent of the presently elevated atmospheric methane value is due to human activity — leaky gas infrastructure, leaky coal mines, and various human-based farming practices that produce methane (rice farming, cow belches etc). It also highlights the recently discovered fact that fossil fuel based leaks are 60 percent more extensive than previously indicated. Confusing this point is the recent Nature finding that though leaky gas and coal infrastructure were more leaky than expected, the large fossil fuel based infrastructure methane emission was not increasing over time.
So the visible, top-down readings in the CAMS monitor may mask a larger feedback delta, or change, in how the the Earth System itself is producing methane. In other words, the new bump in methane may be coming from a perturbed Earth.
“The most important science question we face now is the question of carbon-climate feedbacks. The question that’s really important is, what’s coming down the road?”
In other words, is the recent methane spike coming from changes to the Earth System driven by the longer term fossil fuel based warming? And if so, how much will it continue to feed back? How much more methane can we expect from tropical wetlands, fires, droughts and thawing permafrost? This is a big question with wide-ranging implications for our climate future.
(Want to help fight climate change by transitioning to a clean energy vehicle? Get 1,000 to 5,000 free supercharger miles at this link.)
One of the longest periods of severe weather in recent history may be on tap for regions of the Central U.S. over the coming week. A zone in which 44 million people live and that covers 18 states is under the gun for severe weather formation for at least the next 8 days. And there are a number of climate change related factors that are contributing to the severe storm potential.
(NOAA’s seven day precipitation outlook shows the potential for flooding rains over large swaths of the Central and Western U.S. The risk for tornadoes and severe thunderstorms will also spike during this time period according to reports from the Storm Prediction Center. Image source: NOAA QPF.)
First, a strong storm track has established over the Pacific Ocean. This storm track is feeding unseasonable levels of moisture and stormy conditions into the U.S. West. These storm impulses are predicted to track eastward, helping to establish the predicted Central U.S. storm pattern over the coming days. Warm ocean surface temperatures in the range of 1-2 C above normal across the Pacific are helping to load this storm track up with higher levels of moisture.
In combination, these factors provide a larger influence on the presently forming severe weather pattern. One that is occurring in an atmosphere that, on net, has been more heavily loaded with the moisture and heat that strong storms feed on. These are aspects of our world — warmed by fossil fuel burning. And for the millions now under the gun from potential storm threats, they face a higher risk of stronger storms because of it.
(Want to help fight climate change by transitioning to a clean energy vehicle? Get 1,000 to 5,000 free supercharger miles at this link.)
The clanking, wheezing, gasping, choking engines of fossil fuel burning are propelling us backwards toward hotter and hotter geological contexts. And with new atmospheric CO2 records shattered this week, it is, once again, time to take stock.
Jonathan Overpeck, dean of the School for Environment and Sustainability yesterday noted:
“We keep breaking records, but what makes the current levels of CO2 in the atmosphere most troubling is that we are now well into the ‘danger zone’ where large tipping points in the Earth’s climate could be crossed.”
One way we can get a sense of how far we’ve crossed into Overpeck’s ‘danger zone’ is by looking at how present atmospheric heat trapping gas levels compare to past climate ages. Taking measure, we find that over the last few days, carbon dioxide levels have spiked to over 415 parts per million. An ominous new record driven by fossil fuel burning that spells more warming and climate disruption for a planet already in crisis.
As a report in LiveScience yesterday noted — the present spike in atmospheric CO2 is unprecedented in the past 800,000 years. A span of time when we are able to directly measure historic atmospheric carbon dioxide due to air bubbles trapped in the ice of ancient glaciers in Antarctica and Greenland.
But as we can see in the above image, 415 parts per million is not only the highest atmospheric CO2 level in the last 800,000 years, it significantly exceeds all historic measures in this time period. The 2nd highest reading came in about 320,000 years ago at around 300 parts per million. 415 parts per million is nearly 40 percent higher than this peak value. It’s more than double the heat-trapping atmospheric CO2 averages seen during ice ages.
We have to go far, far back, much further back, to find a time when atmospheric CO2 values were likely similar to those experienced today. Indirect proxy readings indicate that the last time levels of this heat trapping gas were so high extend not hundreds of thousands, but millions of years.
(Atmospheric CO2 levels are now the highest since the Middle Miocene of 15 to 17 million years ago. Image source: Skeptical Science.)
In fact, we have to push into a period of time about 15 million years ago to see similar atmospheric CO2 readings. In other words, present CO2 levels are comparable to the Middle Miocene climate epoch when global temperatures were 3-4 degrees Celsius hotter than late 19th Century levels. And if we keep burning fossil fuels at present rates over the coming decade, we will keep elevating CO2 by around 3 parts per million each year. This continued activity would put us near the 450 part per million mark in just one decade further solidifying a Middle Miocene to early Ogliocene climate context.
“If you do the math, well, it’s pretty sobering. We’ll cross 450 ppm in just over a decade. [Such high levels of CO2] are likely to lock in dangerous and irreversible changes in our climate.”
What this means is that our continued fossil fuel burning brings with it heightening climate disruption. More heatwaves, wildfires, powerful storms, blows to ocean health, sea level rise, and harm to those living on Earth. The only way to significantly blunt that disruption is to rapidly reduce the fossil fuel based emission and transition to clean energy.
(CO2 hitting 415 ppm in the Mauna Loa Observatory puts us far out on a global warming limb.)
Present energy forecasts show a leveling off of fossil fuel burning over the ten year horizon. But clean energy substitution will have to ramp up considerably to prevent rapidly hitting new major and dangerous climate thresholds — driving not just a leveling off, but a decline in fossil fuel burning.
It is worth noting that adding in other greenhouse gasses such as methane puts us even further over the mark — at around 495 parts per million CO2 equivalent in 2019 and near 550 ppm CO2e within about 15 years if projected fossil fuel burning and extraction continue. However, since methane is a short lived gas, fossil fuel extraction reductions and changes to agriculture could tamp down a portion of the CO2e overshoot.
It’s time to get very, very serious about reducing fossil fuel burning and rapidly building out clean energy. The climate disruption that is coming won’t hold back. We need to pull out all the reasonable stops to prevent it. This is why everything from individual action to climate change focused policies like the Green New Deal are so important.
(Want to help fight climate change by transitioning to a clean energy vehicle? Get 1,000 to 5,000 free supercharger miles at this link.)
According to reports from NOAA, the U.S. just saw its wettest 12 month period since record keeping began 124 years ago. The fact that this stretch of extremely wet weather was preceded by a time of extraordinary drought during the 2010s is also notable. Because it is exactly this kind of swing from one extreme to the next that you would expect in a world being forced to warm by fossil fuel burning.
(Annual precipitation has increased by about 7 percent across the contiguous U.S. during the past Century. This jibes with our understanding of atmospheric physics in which the rate of evaporation and precipitation increase as the amount of atmospheric moisture climbs by 6-8 percent for each 1 degree C of global warming. It’s worth noting that though precipitation is increasing, it doesn’t mean that soils, in general, hold more moisture. This is due to the fact that rising temperatures also increase the rates at which soils dry. And because precipitation and drying are not spread evenly, you tend to get regions and times of preference for more intense storms or more intense drought. Image source: NOAA. Hat tip to Weather Underground.)
In this part 2 of our hydrology and climate change discussion, I’ll take a look at some of the drivers for the extreme swing from U.S. drought to deluge. The first being that overall global surface warming in the range of 1.1 C is having the effect of amping up global evaporation and precipitation rates by 6-8 percent. In the U.S. this larger climate change influence helped to spur the multi-year droughts across the U.S. west as well as severe drought years for the Central and Eastern U.S.
On the flip side of the hydrological spectrum, warmer land surfaces and oceans have helped to fuel storms through increased evaporation of water moisture — pumping more water vapor into storms and enabling convection. For the past 12 months this has manifest in the form of the powerful and moisture-rich Hurricane Florence. It has also generally loaded the dice for powerful storms and flooding rains as a persistent trough swung over the Central and Eastern U.S. during spring of 2019.
(Examining climate change’s influence on the wettest 12 months in the last 124 years.)
The recent 12 month record wet period thus fits into a regime of extremes. What these larger trends mean is that in the future the U.S. is likely to continue to experience bipolar precipitation patterns — with hard swings between deeper dry and more intense wet periods coming to dominate as the Earth heats up.
The primary mitigation for this continuing trend is tamping down human based carbon emissions. And a clean energy transition away from fossil fuel burning is central to that more optimistic prospect.
(Want to help fight climate change by switching to a clean energy vehicle? Get 1,000 to 5,000 free supercharger miles through this link.)
Climate change impacts the water cycle in a number of rough ways. First, at its most basic, for each 1 degree C of global temperature increase you roughly increase the rate of evaporation by 6-8 percent. This loads more moisture into the atmosphere — which can lead to more extreme rainfall events. It also causes lands to dry out more rapidly — which can drive more intense droughts and wildfires.
(Major wildfire outbreak in Mexico fills the Central American skies with smoke. Image source: NASA Worldview.)
This weekend, a state of emergency was declared for 11 counties in Mexico due to furiously raging wildfires. The wildfires have spurred hundreds of firefighters to action even as they blanketed much of Mexico in ash-filled smoke. The smoke has traveled as far north as Mexico City — where officials are urging residents to cover windows with damp rags in an effort to keep indoor air clear.
(The climate state contributing to Mexico wildfires and U.S. severe storms analyzed.)
The wildfires come following hotter than normal temperatures and a long period of drought across Southern Mexico. Persistent high pressure and a stagnant air mass has contributed to the overall heat, drought, and fire regime.
Over the coming days, a warm front moving northward from the Bay of Campeche is likely to push smoke gathering over the Gulf of Mexico into the U.S. These smoke particles could get entangled in a predicted severe storm outbreak later this week. For recent research indicates that smoke particles can contribute to major U.S. tornado outbreaks.
(Want to help fight climate change by trading in your CO2 spewing gas guzzler for a clean energy vehicle? Get 1,000 to 5,000 free supercharger miles through this link.)
Of the two great masses of land ice capable of dramatically raising sea levels and altering hemispheric weather patterns through global warming spurred melt, Greenland is the one closest to home for many humans living on Earth. And as fossil fuel burning keeps dumping more carbon into our atmosphere, Greenland melt continues to dump tens of billions of tons of water into the world’s oceans each year.
(Early bump in Greenland melt may be a blip — or a presage to another above average surface melt during summer. Image source: NSIDC.)
So each spring through summer, we go through a ritual of anxiously monitoring the Greenland ice sheet for surface melt increases. Such monitoring is not without merit. According to recent reports in Nature, approximately 60 percent of mass loss in Greenland is driven by surface warming and melt. And during 2012, a major warming event resulted in practically all of the Greenland ice sheet experiencing surface melt during summer.
(Since surface mass loss is the primary driver of Greenland melt, the summer season is a big deal for the Northern Hemisphere’s largest cache of land ice.)
We haven’t had another melt year like 2012 in the intervening time through today. But we have seen continued net mass loss from Greenland — with the additional 40 percent coming from melt due to contact with warming oceans. In other words, we’re experiencing Greenland melt both at the surface and from below. And, sooner or later, so long as fossil fuel burning keeps dumping greenhouse gasses into Earth’s atmosphere, we’ll see another summer like 2012. Or worse.
So we watch.
For the present year, Greenland surface melt has gotten off to a relatively strong and early start. Melt extent jumped to around 7 percent in early May. A pace well beyond the top 10 percent of recorded melt years for the period in which the spike occurred. And it may presage another summer of ponding spreading across the face of Greenland. But the present mid-May bump is not a fully reliable indicator — as 2017’s melt progression featuring a strong start with a relatively moderate and late peak shows.
Point of reference for 2019, 2018 was a moderately above average surface melt year for Greenland (vs 1981-2010). Meanwhile, 2012 was a record year. Overall, recent years have shown accelerating mass loss for Greenland. Note that images are not set to exact comparative scale. pic.twitter.com/VvA7hvJEpA
— Robert Fanney 🇺🇸🇺🇦 (@robertscribbler) May 13, 2019
For further comparison, we saw some rather strong early melt spikes in March and April of 2012 prior to that record surface melt year. And during 2018, which was only a somewhat above average (1981-2010) melt year, there were practically no melt spikes during March through late May.
A primary driver for surface melt during the present years of record and rising global heat has been the formation of jet stream ridges and strong upper level high pressure systems over Greenland during spring and summer. To point, this year’s recent melt spike coincided with a strong ridge that locked into place during mid April through early May.
Over the next ten days, the atmosphere above Greenland is predicted to fluctuate as highs and lows progress. Temperatures are expected to remain somewhat above average near the surface of the ice mass. Compared to the stronger signal we saw earlier, the indicators here are somewhat mixed — at least for the next ten days. But if the ridge pattern reasserts from late May and on into June — watch out. Then, we could see another big melt spike coinciding with the onset of summer.
(Want to help fight climate change by adopting a clean energy vehicle? Get up to 5,000 free supercharger miles through this link.)
Fossil fuel burning is really ramping up the global heat. And for the typically cold Arctic Ocean coastal region, this means that temperatures are now able to strike into the 80s during mid-May.
Today, a very extreme wave in the Jet Stream produced an elongated ridge pattern that ran far to the north over Eastern Europe. This high amplitude wave brought with it temperatures that ranged up to 20 degrees Celsius (36 degrees Fahrenheit) above normal for this time of year. A heat surge which pushed temperatures to 29 C or 84.2 F near Archangel, Russia.
(Severe heat strikes northeastern Europe as part of an extreme jet stream wave pattern. Image source: WX Charts. Hat tip to Peter Sinclair.)
The kind of jet stream wave that spurred this extreme heat has become common over recent years. It’s an atmospheric feature that some scientists have associated with polar amplification — an aspect of human-forced climate change in which the poles warm faster than the lower latitudes.
During 2019, heat transfer into the Arctic has contributed to near record low and record low sea ice extent values in the months of March, April and May. The wavy jet stream patterns have also been associated with a number of severe weather events. Today’s extreme northern heatwave fits into a longer-term pattern of similar occurrences.
(Analysis of recent extreme jet stream pattern over Eastern Europe.)
Wavy, persistent jet streams have recently been associated with worsening weather — heat waves and wild fires in the ridge zones and severe precipitation in the trough zones. Scientists like Dr. Michael E. Mann and Dr. Jennifer Francis have warned that the associated Jet Stream waves are linked to human-forced climate change and are likely contributors to recent events.
The extreme weather we’re seeing around the Northern Hemisphere, such as heat waves, floods, droughts, and wildfires, is related to an unusual, undulating pattern in the jet stream. The other part of this that’s atypical is that this undulating pattern doesn’t usually hold longer than a few days. But this one isn’t going anywhere. Our work shows that this sort of pattern, which has been associated with many of the most extreme, persistent weather events in recent years, including the 2003 European heatwave, the 2010 Moscow wildfires, the 2011 Texas and Oklahoma drought, and the 2016 Alberta wildfires to name a few, is becoming more common because of human-caused climate change, and in particular, because of amplified Arctic warming.
It looks like 2019 is no exception to the longer-term trend. And we have already seen a number of instances of middle latitude extreme weather contributed to by the jet stream features Dr. Mann mentions above this year.
(Want to help fight climate change by switching to an electric vehicle? Get 5,000 free supercharger miles through this link.)
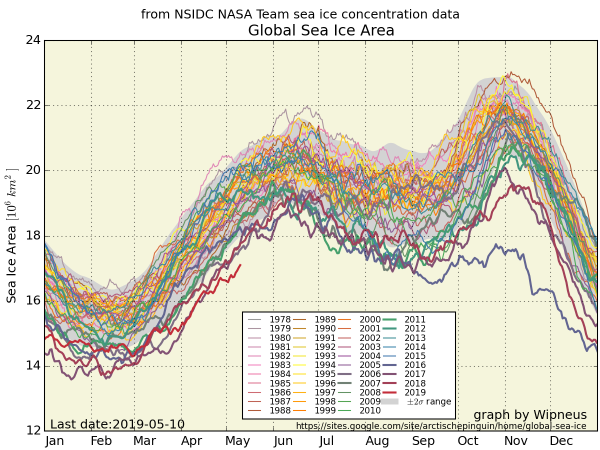
As a weak El Nino combines with continued rising atmospheric greenhouse gas levels to push global temperatures higher in 2019, we are seeing some pretty extreme warming impacts the world over. Just one of these impacts involves sea ice.
(An analysis of factors contributing to global sea ice loss.)
Looking north, we already observe that Arctic sea ice is pretty much tied for lowest visible extent on record in the National Snow and Ice Data Center (NSIDC) measure. According to NSIDC’s Charctic Graph, sea ice extent in the Northern Hemisphere is ranging around 12.465 million square kilometers. This is just slightly above the record low for the date set in 2016 at 12.422 million square kilometers.
To the south, Antarctic sea ice extent has recently slipped into new record low ranges for this time of year. As of May 10th, NSIDC showed sea ice extent near the frozen southern continent in the range of 7.898 million square kilometers or about 200,000 square kilomters below the previous daily record low set in May of 2017. These record lows have occurred on the back of a rather warmer than normal late Southern Hemisphere Fall season.
(Global sea ice graph provided by Wipneus. Date provided by NSIDC.)
Two hemispheres experiencing record low or near record low sea ice conditions over an extended period during April through May of 2019 have now generated a historical period for global sea ice. The result is that recent major global sea ice losses occurring during 2016-2019 are being further solidified. Yet one more aspect of the larger global warming regime enforced by continued fossil fuel burning.
(Interested in fighting climate change on a personal level by switching to a clean energy vehicle? Get up to 5,000 free supercharger miles with this referral code.)
So I’ve got a bit of a background in the field of emerging threats — both as a former military intel analyst and as an editor at Janes Information Group back in the early 2000s. And, in my opinion, the biggest threat facing civilization today is a twofold crisis.
Climate Change and the Failure to Use Clean Energy Crisis
We could easily call this crisis climate change — because these are the effects we see around us in the form of melting glaciers, changing seasonal weather patterns, rising seas and more extreme weather. We could easily call it global warming. Because net energy gain through heat trapping gas increase in the atmosphere is causing the Earth System to warm up.
But that’s just the first side of the problem. The ‘what’s happening’ side. The other side of the problem is systemic. It’s also cultural to a certain extent. And it mainly has to do with how we presently use energy to drive a massive global economic system that supports most of the 7 billion people living on the Earth. More importantly, the driver of the vast majority of the global warming we see (in the range of 80 percent or more) is the direct carbon emission coming from fossil fuel burning and extraction. About thirteen billion tons of heat-trapping carbon comes from this primary source and enters the atmosphere each year.
You could also call the climate crisis a harmful energy crisis. But that misses a bit of the story as well. For back during the 20th Century, competing clean energy sources failed to move to the fore. We knew how to generate energy from the sun and from the wind in a carbon-free manner. And we knew how to store that energy. But, mainly due to the fact that the fossil fuel interests held more political and economic power, these clean energy sources got sidelined. Bringing us to the final way that we could characterize this crisis — the failure to use clean energy crisis.
Setting an Individual Policy for Climate Action
It’s at this point in the discussion that we come down to little ol’ me. What’s my level of responsibility? What can I do as a person to help correct this problem. To not contribute to the failure to use clean energy crisis?
(Optimized for zero emissions. My clean energy Tesla [Clean KITT] recharging at a local solar garage. Planning to purchase a Tesla that’s capable of sucking energy direct from the sun? Get up to 5,000 free supercharger miles through this link.)
This has been a big issue for me for some time. I don’t make a huge amount of money. I’m a writer after all. And my wife works for a not-for-profit. Sure, we are probably better off than some. But when it comes to being able to produce the capital to access 40,000 dollar electric vehicles, or a home where I can charge it in the garage, or the 20,000 dollar plus for solar panels and the other 7,000 dollars or so for energy storage at home, all that stuff may as well have been on the moon with me waiting for an Elon Musk rocket to get me there.
Sure the costs had come down. And sure clean energy was more accessible to me than it was before. But it wasn’t accessible enough. I needed just a little extra push to start to get there.
In all honesty, I really wanted to make the push. As a climate change blogger, I’ve been harassed by anti-clean energy trolls for the better part of 7 years. And you can say what you want, but proving trolls wrong can be a powerful motivator. So I wondered what I could do personally to generate enough capital to afford a primary clean energy platform.
I’m getting a little ahead of myself here. So I’ll just step back and put you in my place during fall of last year. Then, I was looking at a way to individually make a difference for climate change. Sure, we all need to support climate change response policies like Paris, and the Green New Deal. And we, as societies, need to escalate those policies pretty quick if we’re gonna have a real Extinction Rebellion. But as people and individuals, there are things we can do as well to try to correct our failure to use clean energy crisis. We can set our own personal climate policies in place.
For my part, I set a goal to be carbon neutral by 2025. And as a first step, I settled on getting an electric vehicle. I figured I could cut my family carbon emissions on net by about 2 tons per year including all the typical travel my wife and I engage in. But when I started to think about how I could afford something in the range of 35,000 to 40,000 dollars, I stumbled on the notion of rideshare.
Streetfighting Against Climate Change
You see, a local buddy of mine had been Ubering — even as he worked full time as an electrician. He told me that Uber was really flexible (if you decide to rideshare for clean energy, you can help this blog by using my referral code robertf30288ue). Your work hours were entirely yours to control and there was no commute except for the walk out to your car. I decided to look into it. And after a little research, I found that the average income for an Uber driver in D.C. was just short of 20 dollars per hour.
Now you may be smirking at me through your fingers. For a lot of people, 20 bucks an hour isn’t really much at all. But you have to remember that I’m working from a blogger’s/writer’s baseline that is rather short of that. And if I could somehow combine my writing income with an extra 25-30 hours of Uber income, I could make about 2,000 to 2,500 extra each month. This would be more than enough to cover the cost of a new, long-range electric vehicle.
By this point, I had a plan. As many of you who have attempted difficult or ambitious plans before know, the major step is not coming up with a decent idea. It’s executing it. So I set out to, for lack of a better phrase, start busting my tail. This meant that I had to temporarily let go of some of my less lucrative work. Those of you who frequent this blog will attest to the fact that I went dark for a number of months. Mia Culpa! But contrary to one of about a bazillion climate change denier memes — those of us who communicate on the issue of climate change all-too-often don’t make minimum wage back for our time.
So I went dark and worked hard. In doing so, I met a lot of people. And aside from the odd Heritage Foundation pick-up (yes we Uber drivers pick up political org folks in D.C.), I’d say 95 percent of the people I talked to about my project were both concerned about climate change and interested in clean energy advancement. In other words, they were supportive of my goal. Plus they were also pretty geeked out about the potential notion of riding Uber in a Tesla.
As I drove, I also became keenly aware of how expensive it was to operate even an efficient internal combustion engine vehicle like a Hyundai Elantra. The cost of gas alone increased for me by about 250 dollars per month. Add in the new 50 dollar monthly oil change, and I began to get an understanding of how much an electric vehicle could save me later (more on this in a future blog).
How You Can Raise Funds for a Clean Energy Vehicle Through Rideshare
Long story short, after busting my tail, I had enough funds to afford a clean energy vehicle by April. I did this by using the rideshare app Uber. And by saving a portion of the profits to invest in a Tesla Model 3. I have now driven 800 miles in this clean machine. Like so many EV converts, I am never going back.
It is here that we get to the nitty-gritty of this post. How can you make enough money to afford a Tesla Model 3 if you’re strapped for cash like I was? One way is to do what I did — use Uber or Lyft part-time and save the profits for an EV purchase a few months down the road. This works well if you can set aside an extra 10 hours or more per week. And if you have the time, then fantastic! I recommend you give it a shot if you want to gain access to the amazing piece of clean tech that is the Tesla Model 3 and help fight climate change in one go.
(Uber destination trips allow you to pick up riders and earn money through the app while driving to and from work. This is a great way to optimize time and earn money for a clean energy vehicle. Image source: Uber.)
Many of us do not have an extra 10 hours a week or more, though. So I’m going to make this additional time optimization suggestion for rideshare usage to purchase a clean energy vehicle. And this suggestion includes the nifty little Uber feature called destination trips. What the destination trips feature allows you to do as an Uber driver is to set a way-point, drive to that way-point, and take trips toward that destination as you drive.
If you’re a regular office worker type, who makes a long drive to work and back, this has huge potential benefits. What it can allow you to do is turn your regular daily commute into a money-making endeavor. Just log into Uber in the morning, set your way-point to your office, drive the usual rush hour drive, and pick up a few rides in on the way to work. You’ll make about 15-20 dollars or more in an average rush. On the ride home, repeat. Now you’ve got an extra 150-200 dollars per week in your pocket to work with. Counting in future gas saved, that’s more than enough to cover the monthly payment on a Tesla Model 3 SR+.
Full disclosure, this will probably increase the time it takes to get to and from work. So plan accordingly. However, all the time during the work commute has now become gainful employment in the service of the clean energy transition. Nice! Of course, if you have a short commute, then such a plan is less optimal. But for our long commuters, this optimization will both enable you to make money while commuting and turn the tables on typical transport energy usage to fight climate change.
Not too shabby!
Now I know that I haven’t provided every little detail in my post. So if you have any questions about how to employ rideshare to help you purchase a clean energy vehicle and get you off the fossil fuel pollution wagon, I will be regularly checking the comments section below. So feel free to ask any question that you might have.
Thanks so much for stopping in! For the next blog post, I’ll be talking about Arctic sea ice as we haven’t had an update on that subject here in a while. Kindest regards to you all! And if you want a riddle for a near future blog post/Radio Ecoshock interview topic it’s a word with a hidden meaning: Lucina.


