
And so it appears we are living in a time of Monster Kelvin Waves — powerful confluences of Pacific Ocean heat running just beneath the surface — bringing with them the potential for both record global temperature spikes and strong, climate-wracking El Nino events.
* * * * *
Last year, a powerful pulse of sub-surface heat called a Kelvin Wave rippled across the Equatorial Pacific. It shoved sub-surface temperature anomalies into an extreme range of 6 degrees Celsius above average at a depth of 90-130 meters over an equatorial zone stretching out for hundreds of miles. Overall, this heat surge pushed anomalies below the rippling waves of the vast Equatorial Pacific from New Guinea to the Central American Coastline above 1.8 degrees C hotter than average.
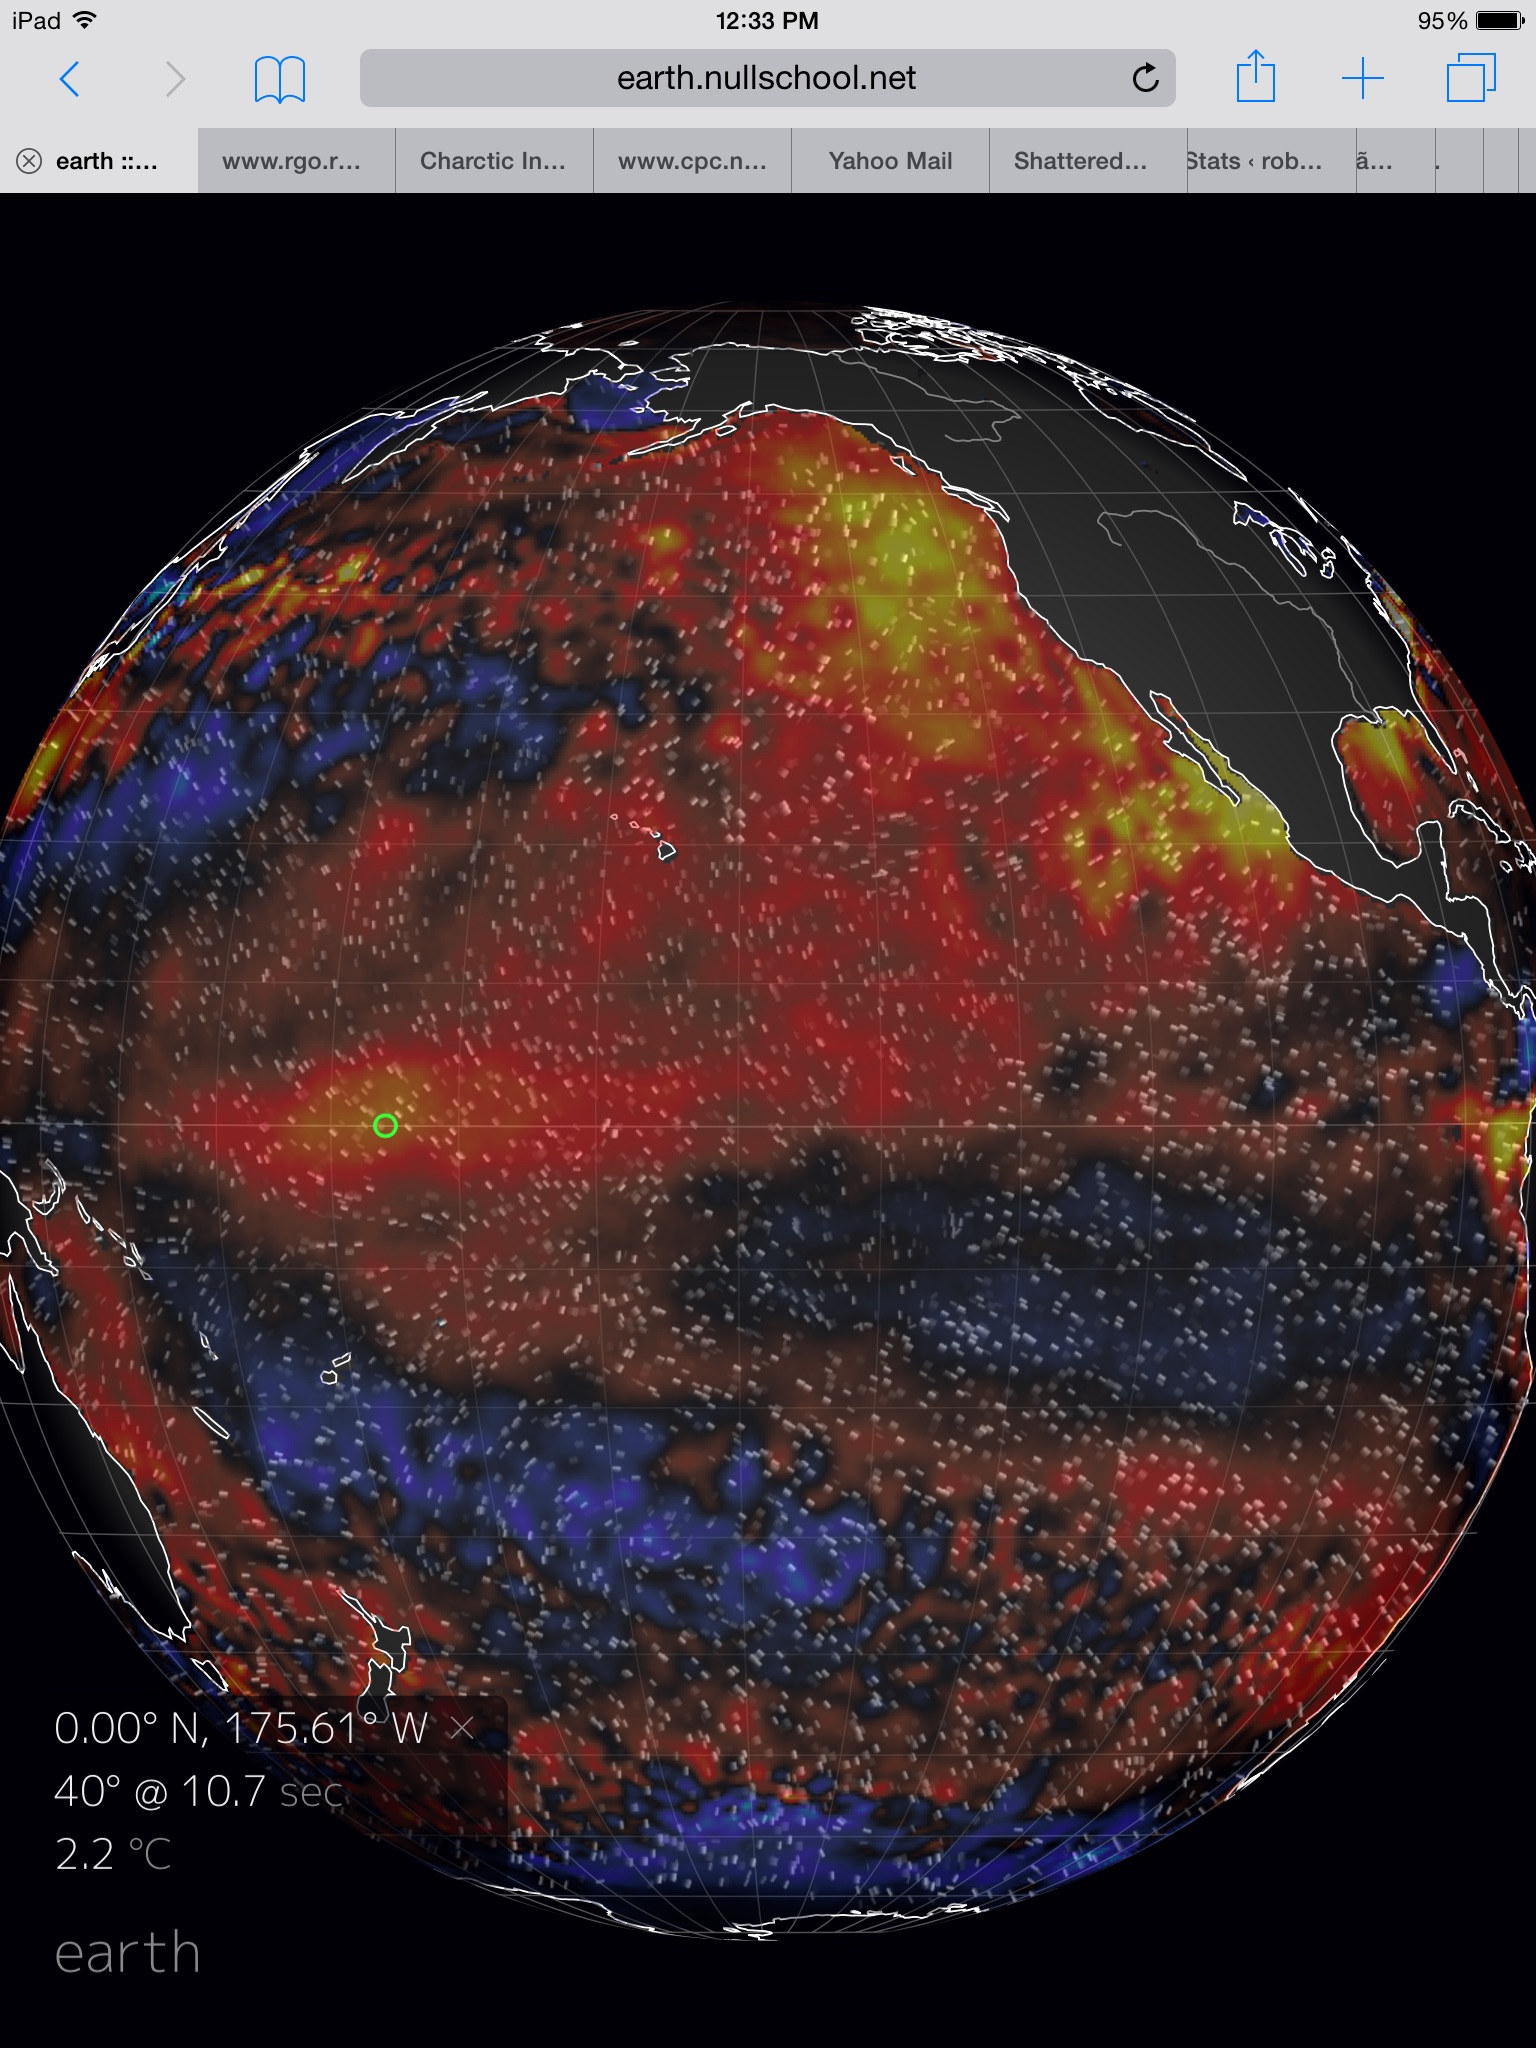
(Building heat in Pacific Equatorial Surface waters on April 9 of 2015 — a sign of a massive pulse of hotter than normal water running at about 100 meters depth. A heat pulse that may be setting in place conditions for a powerful El Nino later this year. Image source: Earth Nullschool. Data Source: Global Forecast System Model.)
This immense heat pulse was enough to shove the equatorial region inexorably toward El Nino status. By September, mid-ocean values were hot enough to have reached the critical threshold of 0.5 C above surface value average. Perhaps more importantly, the Winter/Spring 2014 Kelvin Wave also contributed to record positive PDO values for the Pacific by December of 2014. A surface heat departure that was unprecedented to modern climates. Block-busting ocean warmth that almost certainly spurred 2014 global atmospheric temperatures to new all-time record highs in the current age of human warming.
Monster Kelvin Wave Redux
Now, a second, and equally strong monster Kelvin Wave is again rippling across the Pacific Ocean subsurface zone. A powerful pulse of heat that will reinforce the current weak, mid-ocean El Nino, lend energy to ridiculously warm Pacific Ocean sea surface states, and pave the way for a long-duration equatorial heat spike.
(Monster Kelvin Wave Redux. A second powerful Kelvin Wave is surging across the Pacific Equatorial Subsurface zones, strengthing prospects for both a continued El Nino and for a record hot year in 2015. Image source: NOAA/CPC.)
As we can see in the NOAA CPC rendering above, the current Kelvin Wave is a massive and extraordinarily warm beast of a thing. It encompasses most of the thousands-miles broad Equatorial Pacific with its hottest zone peaking at 5-6 degrees Celsius above average temperatures — a region that stretches from near the Date Line all the way to just west of Central America. At +1.75 C for the entire below-surface equatorial region, the current Kelvin Wave is already approaching last year’s peak values. Values it may well exceed in the coming days.
Overall, the current Kelvin Wave seems to have more connection to the surface environment than last year’s powerful surge. A massive plug of Pacific Ocean heat readying to belch back into the atmosphere.
Some Models Show Potential For Super El Nino
Already, NOAA is upping its forecast chances for El Nino to continue through summer to 70 percent and is placing a greater than 60 percent chance that El Nino will stretch on through late autumn. An upshot from earlier predictions made just a little more than a month ago that El Nino formation for 2015 remained uncertain. Now, we have a rather high certainty that El Nino will continue throughout at least the next 4-6 months.
But perhaps more concerning is the fact that a strong El Nino is again starting to show up in some of the long range models. NOAA’s CFS ensemble shows El Nino continuing to steadily strengthen throughout 2015 reaching overall Nino 3.4 surface values above +2.1 C by October, November and December of this year:
(Top frame shows predicted sea surface temperature anomalies in the critical Nino 3.4 zone exceeding 2.2 C by late 2015. Such an event would be a monster to rival or possibly exceed 1998. The lower frame shows sea surface temperature departures for the entire globe. Note the seasonal spike of 2-3+ C above average for the Eastern Equatorial Pacific. Image Source: NOAA’s Seasonal Climate Forecast.)
The departures we see in this long range forecast are extraordinary — rivaling or possibly exceeding the intensity of the 1998 Super El Nino. An event of this kind would result in powerful ocean and atmospheric surface temperature spikes, catapulting us well beyond the climate range previously established by the 1998 event. Globally, we would be entering new, record hot territory, possibly approaching 1 C above 1880s values for the 2015-2016 period.
Troubling Situation With High Uncertainty
As such, we should consider this to be a troubling situation, in need of close, continued monitoring. To this point, it is worth noting that El Nino prediction during Spring is highly uncertain. Last year’s very strong Kelvin Wave also set off predictions for a moderate-to-strong El Nino event by summer-through-fall. Though El Nino did eventually emerge, it was weaker and later in coming than expected. Now, a new set of conditions is setting up similar, and perhaps, even more intense ocean and atmosphere heat potentials.
Though still uncertain, what we observe now are ocean conditions that raise potentials for both extreme El Nino and human-warming related weather. Powerful ocean heat pulses of the kind we observe now, when combined with an extraordinary human greenhouse gas heat forcing, also increases the likelihood of another record warm year. El Nino associated droughts and heatwaves — particularly for South America, India, Australia and Europe through Central Asia are at rising risk. In the event of mid-ocean El Nino, the risk increases that the 1200 year California drought will continue or even intensify. If the heat pulse shifts eastward, a switch to much heavier rainfall (potentially terribly heavy) could coincide with a breaking of the Ridiculously Resilient Ridge pattern that has warded moisture away from the US West Coast for nearly three years. Extra heat of this kind would also tend to enhance precipitation extremes — more rain when it does rain and far more intense drought in areas affected by heat and atmospheric ridging.
Given the patterns we have observed over the last year, we could expect worsening conditions for some regions (India, Australia, some sections of South America, Eastern Europe) and the potential for a shift from one extreme to the next for other regions (US West Coast). These potentials depend on the disposition and intensity of surface heat in the Pacific, which bears an even closer watch going forward.
Links:
NOAA’s Climate Prediction Center
NOAA’s April 9 El Nino Statement
NOAA’s Seasonal Climate Forecast
Monster El Nino Emerging From the Depths?
Atmospheric Warming to Ramp up as PDO Swings Positive?


beckjeremy
/ April 9, 2015Carly says it was your fault!
http://ponziworld.blogspot.co.uk/2015/04/a-mentally-ill-society-in-profound.html
LikeLike
robertscribbler
/ April 9, 2015That’s right, blame the messenger…
LikeLike
Kevin Jones
/ April 9, 2015Important post, Robert & great to have you back! This sent me to 1998 temp jump. Looks like about .17 C above five year running mean. That added to our current past 12 months of .71: Not good. http://data.giss.nasa.gov/gistemp/graphs_v3/Fig.A2.pdf
LikeLike
robertscribbler
/ April 9, 2015Spot on, Kevin, as always. +0.17 C is a brutal jump for the five year mean. But it does roughly coincide with what some models are pointing toward in the decadal averages for 2010s, 2020s, and 2030s.
LikeLike
Kevin Jones
/ April 9, 2015So if 2015 should jump similarly to 1998 it would put us about 1.25 above decade of 1901-1910! (-.36 of base plus .71–past 12 months plus .17) http://www.columbia.edu/~mhs119/Temperature/T_moreFigs/TsERSST.DecadalMaps.pdf
LikeLike
Gerald Spezio
/ April 9, 2015… and the consequences in terms of climate disruption would be horrific.
Torrential rains in CA, phew?
LikeLike
robertscribbler
/ April 9, 2015You’re talking about a potential for severe, if brief, whiplash for California. The overall trend there is drying.
There is also a potential that the near permanent pool of hot water off the West Coast precludes even a strong El Nino based storm track. This would moreso be the case if El Nino tended more toward mid Ocean.
LikeLike
Gerald Spezio
/ April 9, 2015Kevin, It is frightening to see the decadal graphs literally go bonkers after 1980, & naturally neatly correlate with CO2 pollution of our atmospheric commons – an increase of 60 plus ppm in 35 years, & that is w/o calculating in CO2e.
350 ppm CO2? – fageddaboudit.
LikeLike
Kevin Jones
/ April 9, 2015Not a lot of wiggle room between 1.25C and what’s built in and 2C. Perhaps we can hire NASCAR to install SAFER (Steel and Foam Energy Reduction) Barriers around the Paris summit so delegates won’t be knocked unconscious by the impact of where we may well be by then?
LikeLike
Jacob
/ April 9, 2015More knowledgeable people than I probably know better and can correct me, but …. I get the feeling (down the line) that with what’s already baked in, 2C is already in the rear view mirror and will be great by comparison to whatever final temp setting we actually reach will be.
LikeLike
robertscribbler
/ April 9, 2015Humans will have to learn how to draw carbon out of the atmosphere to hit the 2 C mark. That and a net negative emission within a few decades.
LikeLike
Gerald Spezio
/ April 9, 2015Yabut, “It don’t rain in California in the summertime …”
Unless or except …
LikeLike
robertscribbler
/ April 9, 2015Drought there will almost certainly continue at least through summer. Unless that very powerful monsoon backs up through New Mexico and Arizona. That would be rather odd. More likely, we would see the winter storms that come with a strong El Nino over-riding the ridge pattern. And that could be nasty if we see the kind of eastern equatorial heat some models are predicting by December timeframe.
LikeLike
brian
/ April 15, 2015In San Diego last year it rained in July and August. I have lived here for 10 years and this was the first time I experienced rain in the summer months.
LikeLike
Andy in YKD
/ April 9, 2015Here is an article regarding the warm northeastern Pacific:
http://www.timescolonist.com/opinion/op-ed/comment-the-warm-blob-in-canada-s-pacific-ocean-1.1813909?sthash.r308nNdM.mjjo
NOAA SST anomolies for April 9 here:
“Rapid and non-linear responses” is a quote from the (if memory serves) 1992 IPCC for a 1 degree C temperature rise.
LikeLike
robertscribbler
/ April 9, 2015Most sane scientists wanted to try and set an emissions limit that was compatible with keeping warming to 1.5 C or less. Policy makers and fossil fuel interests pushed that limit back to 2 C, which was beyond stupid. The reason is that scientists were already uncomfortable with 1.5 C and, as you saliently note, saw bad outcomes at even lower levels of increase.
At the end of the last Ice Age it took 2500 years to warm the world by 1 C. We’re doing it in 140 or less.
In any case, that map looks like a ridiculously strong PDO…
LikeLike
Ryan in New England
/ April 10, 2015The arbitrary 2C threshold was a terrible idea from the start. It simply gave policy makers and those in positions of power an excuse to procrastinate (or so they assumed). Now, like stated in a previous comment, 2C is all but guaranteed, and is also guaranteed to be far too high a temp limit to aim for. It’s troubling to think that we are actually on track to blow right through 2C on our way to some unimaginable hell on Earth scenario. With all of this heat in the ocean poised to have a major impact on coming atmospheric temp anomilies, and with it looking as if we could reach the 1C mark above baseline with decades to go until the impact from current CO2e concentrations are felt, I have to admit that I’m not feeling optimistic. And my optimism rivals yours, Robbert. Btw, another great post! Thank you!!
LikeLike
JCH
/ April 9, 2015The last 7 months on GISS is actually .74C. April looks like it might cool a bit, but in four months the 12-month rolling mean could be .80C, and that’s without much of an El Nino.
LikeLike
robertscribbler
/ April 9, 2015And add +0.2 to get a reference for 1880s values, putting us at +0.94 C for 7 month mean.
LikeLike
Gerald Spezio
/ April 9, 2015Andy, I didn’t check, but this is precisely what I recall, although it could have been in a later IPCC release. There is not much question that that they said it along the way.
“Rapid and non-linear responses” is a quote from the (if memory serves) 1992 IPCC for a 1 degree C temperature rise.”
And Robert agrees;
The departures we see in this long range forecast are extraordinary — rivaling or possibly exceeding the intensity of the 1998 Super El Nino. An event of this kind would result in powerful ocean and atmospheric surface temperature spikes, catapulting us well beyond the climate range previously established by the 1998 event. Globally, we would be entering new, record hot territory, possibly approaching 1 C above 1880s values for the 2015-2016 period.
I don’t know any rational observer of this data could argue for a “feasible” return to 350 ppm.
LikeLike
Gerald Spezio
/ April 9, 2015Worst case scenario for CA is the proverbial double whammy – baking through the summer & fall with diabolical deluges next winter.
LikeLike
Colorado Bob
/ April 9, 2015‘Warm blob’ in Pacific Ocean linked to weird weather across the US
Date:
April 9, 2015
Source:
University of Washington
Summary:
An unusually warm patch of surface water, nicknamed ‘the blob’ when it emerged in early 2014, is part of a Pacific Ocean pattern that may be affecting everything from West Coast fisheries and water supplies to East Coast snowstorms. The blob is just one element of a broader pattern in the Pacific Ocean whose influence reaches much further — possibly to include two bone-chilling winters in the Eastern U.S.
Link
LikeLike
Kevin Jones
/ April 9, 2015Colorado Bob et al: My sense is it is the Blob. It is the Arctic sea ice loss. It is the Hole in Global Warming from Greenland fresh water. Thus the Wacky Jetstream. And it is so much more. All under the Big Top.
LikeLike
robertscribbler
/ April 9, 2015Tele-connection between Greenland melt, Polar amplification and Pacific Warming.
LikeLike
robertscribbler
/ April 9, 2015Paging Dr. Francis…
LikeLike
climatehawk1
/ April 10, 2015Thanks, tweet scheduled.
LikeLike
Colorado Bob
/ April 9, 2015Greatest mass extinction driven by acidic oceans, study finds
Date:
April 9, 2015
Source:
University of Edinburgh
Summary:
Changes to the Earth’s oceans, caused by extreme volcanic activity, triggered the greatest extinction of all time, a study suggests. The amount of carbon added to the atmosphere that triggered the mass extinction was probably greater than today’s fossil fuel reserves, the team says. However, the carbon was released at a rate similar to modern emissions. This fast rate of release was a critical factor driving ocean acidification, researchers say.
Link
LikeLike
Colorado Bob
/ April 9, 2015Make sure you have score card, you can’t keep track of the mass extinctions without a score card.
April 9 2015, 1.32am EDT
Triassic mass extinction may give clues on how oceans will be affected by climate change
Just over 200m years ago, the end-Triassic mass extinction killed off more than half of the species of organisms living on Earth’s land and in the oceans. We are only just beginning to understand how this – and the period of runaway global warming that followed – changed the chemistry of open oceans.
Link
LikeLike
Colorado Bob
/ April 9, 2015The concern is that the consequences of rapidly rising atmospheric CO2 levels can be expected to be similar: ocean acidification, oxygen depletion of the oceans, hydrogen sulphide poisoning and disruption of food chains through the killing off of photosynthesisers in the ocean.
LikeLike
robertscribbler
/ April 9, 2015This!!!
LikeLike
robertscribbler
/ April 9, 2015Need more data…
I have Permian at 1/6 rate of human emissions at peak mean. That would include Earth carbon system response (methane/CO2 release from stores).
Also they need to state whether they are looking at declared fossil fuel reserves or likely reserves. And they would need to look at potential release from the massive volume of non fossil fuel carbon store now at risk.
Finally, though ocean acidification is terrible, there are many additional impacts to warming on world ocean systems — lowering oxygen, increasing disease vectors, Canfield Ocean environments (hydrogen sulfide). The last provides a killing mechanism for the 70 percent + species losses on land as well. Ocean acidification does not.
Sometimes, when a study just looks at one thing, they can tend to over-emphasize its role. I think that is a danger with this study. Finally, the way in which the study contextualizes carbon emissions volumes (and provides little in the way of basis data), it may lead to a false sense of security.
Sadly, I’d say the study, at least from a reading of the initial statement, confuses more than it clarifies.
LikeLike
Colorado Bob
/ April 9, 2015The same thing can be said about that “seeping permafrost paper” from yesterday.
LikeLike
Ryan in New England
/ April 10, 2015Also, the sun’s output has been slowly increasing over the Earth’s history, so the equivalent CO2 concentration would have more of an effect in modern times. Please correct me if I’m wrong.
LikeLike
robertscribbler
/ April 10, 2015No, Ryan, you’re right.
LikeLike
Apneaman
/ April 9, 2015Job losses hit hard
Workers at Sanford’s mussel plant in Christchurch are facing tough choices in the coming weeks following a proposal to make 230 staff redundant.
The company plans to close the processing facility due to a drop in the supply of wild spat or baby mussels, caused, it says, by high sea temperatures.
http://www.radionz.co.nz/news/regional/270818/job-losses-hit-hard
LikeLike
Robert Thankyoufornotbreeding Atack
/ April 9, 2015Hi Robert
Being as CH4 is as good as immortal now, in as much as, when a molecule of CH4 ‘degrades’ it is replaced by a new one + a bit more, what would the forcing factor CH4/CO2 be?
The IPCC etc, have an equation that starts with CH4 living for 12 years, which is now clearly wrong.
So I’m trying to find the answer as to what the CH4 reading is while it is CH4, like It doesn’t become CH3.9 when it turns 1 year old dose it?
LikeLike
robertscribbler
/ April 9, 2015I haven’t seen a report yet showing that CH4 residence times have significantly changed. You’d have to substantially degrade the hydroxyl sink for that. The volume hitting the atmosphere continues to rise, though.
CH4 GWP is x34 CO2 over 100 years. Much higher over shorter periods. If you are looking at GWP during residence time it is around 80-120.
CH4 degrading into CO2 is an additional source of greenhouse gas, but is still just a tiny fraction of the amount of CO2 now being emitted by fossil fuel burning.
LikeLike
Colorado Bob
/ April 9, 2015Stop climate change by drinking Coca-Cola says Oz government
Just take the CO2 from power stations and bottle it for the cool, clean taste of salvation
If you want to understand the quality of advice the Australian government wants in the climate change debate, you need only need one passage from page 56 of a new report into the energy sector.
Discussing carbon capture and storage, which currently has “failed technology” status nearly the whole world around, the government’s Energy White Paper (PDF) says:
“If the CO2 can be captured before it is released to the atmosphere it can either be utilised in other products or permanently stored in deep geological formations. Australia has worked closely with other countries which rely heavily on fossil fuels to investigate opportunities to utilise CO2 in products such as carbonated drinks and plastics or to enhance the growth of oil-rich algae in solar bioreactors to produce biofuel.”. [Emphasis added]
Link
LikeLike
robertscribbler
/ April 9, 2015Replacing the emitting infrastructure with renewables actually works. This is just a continuation of the current epic fossil fuel boondoggle. In addition, renewables hold much higher value for societies by increasing water resiliency, reducing health impact, and helping to reduce harm to the, keeling off kilter, climate…
LikeLike
climatehawk1
/ April 10, 2015Agreed. I have a feeling massive subsidies will be required, though, to make emitting CO2 plus CCS competitive with wind and solar, prices of which are falling steadily.
LikeLike
Colorado Bob
/ April 9, 2015NASA scientist Gavin Schmidt: denying climate change is wishful thinking
One of the world’s leading climatologists is about to give free lectures in Victoria and Vancouver
NASA scientist Gavin Schmidt is one of the world’s most recognized climatologists — but he says, he’s tired of hearing from sceptics who still deny climate change is occurring.
“I would wish this wasn’t happening. I wish it was all a mistake and it was all some sort of conspiracy driven by vegetarian-socialists, but it’s not,” he told The Early Edition’s Rick Cluff…………………………….
Gavin Schmidt will be giving a lecture entitled Climate change: Choose your own adventure! at 7 p.m. PT Wednesday at UVic in Victoria.
He will then present another lecture entitled What are climate models good for? at 7 p.m. PT Thursday at UBC Robson Square in Vancouver.
Both lectures will also be webcast live online.
Link
LikeLike
robertscribbler
/ April 9, 2015Yes, because vegan socialists have everything completely wrong 😉
LikeLike
Colorado Bob
/ April 9, 2015Did you read that paper from the Russians about the Yamal craters?
LikeLike
robertscribbler
/ April 10, 2015I saw one from rgo. Is that the one?
I wonder if Gavin has new thoughts on methane issues…
LikeLike
Colorado Bob
/ April 9, 2015“I would wish this wasn’t happening. I wish it was all a mistake and it was all some sort of conspiracy driven by vegetarian-socialists, but it’s not,”
NASA scientist Gavin Schmidt
LikeLike
Robert Thankyoufornotbreeding Atack
/ April 9, 2015Re CH4
86 times worse over 20 years, yet the stuff only hangs around for 12?
And like we agree the concentrations are growing, so the 12 year life span is irrelevant, like it all just doesn’t disappear every 12 years. It wouldn’t matter if it only hung around for an hour,the amount has increased x nearly 3 times the historical average?
letters to IPCC
Hi Rajendra
I am trying to find out the forcing factor of CH4 over C02 in time frames that matter, like what is the forcing factor when the CH4 is only a week old?
This is the question my friend Kevin posed to someone the other day, his explanation is way better than I could manage.
Snip
For more than a year I have been very troubled by the way the relative warming effect of methane compared to carbon dioxide is calculated, the UNIPCC initially assigning a value of 23 times CO2 over 100 years and 72 times CO2 over 20 years, which were subsequently increased to 34 times CO2 over 100 years and 86 times CO2 over 20 years.
I have searched, with no success, for the instantaneous absorption-re radiation value of CH4 versus CO2, and many months ago telephoned (and emailed) Paul Beckwith at the University of Ottawa to discuss the matter; at the time he said he thought it was about 250, but has not confirmed this figure. The decay curves I have seen suggest an instantaneous value for methane of the order of 300 times that of carbon dioxide, and I have seen an unreferenced article by Malcolm Light suggesting a value between 1,000 and 300 times CO2 for times scales that matter.
It seems to me there is something very suspect in the manner in which the IPCC calculates the effect of methane in the atmosphere, in that it treats methane as though it decays to carbon dioxide (which we know it does) and assigns and average value over time for the decay. Yet the concentration of methane in the atmosphere does not decline because every molecule of methane that gets oxidized by the OH ion or OH radical mechanism is replaced by another. Indeed, the rate of release of methane molecules into the atmosphere clearly far exceeds the rate of oxidation, so the concentration and actual mass of atmospheric methane both increase,.
End snip
So far I’ve sent this question out to maybe 30 ‘scientists’, and have had 4 responses,, it is looking like CH4 is 300 – 400 times stronger a GHG than CO2?
Thanks
Dear Dr Rajendra
I understand you mentioned me to a colleague in New Zealand, with regards
to my question on the forcing factor of CH4/CO2, thanks for that.
Unfortunately, I couldn’t quite get my question answered via anyone
associated with the IPCC, but that is par for the coarse so not unexpected.
I will give you my thoughts, I will be happy to be proven wrong.
So here goes, if you are still there 😉
I’ve read several times that ‘we’ are at a worse point than we have ever
been in known climatic history, and during that history it has been
proven that parts of the planet heated up by 16C over as little as 10 years, if
that is close to being true, and we are in a worse situation, then +16C
could be just around the corner.
HOW?
Its the methane that is going to get us, as the last straw, you know
better than me I’m sure how fast the CH4 content is rising in the
atmosphere, (supposedly hit 1.910ppm) being about 1.85ppm at the moment
(unless you know more?) and always increasing, so with that fact in mind
what would the immortal effect of CH4 be compared to CO2?
How about this question?
If you have a tube of CO2 and you fire infrared light through it, what
is the resulting blocking of infrared transmission (absorption and
reradiation) per molecule or per gram of CO2 inside the tube?
Then do the same thing with a tube full of CH4. How much more does CH4
absorb-reradiate than CO2? This was done crudely by John Tyndall 1859
with primitive equipment? What is the answer now that we have lot of
very sophisticated equipment? That is what I cannot find out.
I posted this on a blog site the other day, again I’m happy to be proven
wrong.
> It is looking like it will be all over within the next 10 years,
> currently the environment is the closes to a massive temperature rise
> of no less than 9C, it has EVER been, never before has CO2 gone up so
> fast, never before has there been so much CH4 trapped by the rapid
> thawing ice,never before (to the best of our knowledge) has CH4 gone
> from an 800,000 year average of .7 ppm to 1.85 ppm in as little as 100
> years. NEVER !!!!!!!!!!!!!!
> http://www.planetextinction.com/documents/Methane,%20the%20Gakkel%20Ridge%20and%20human%20survival.pdf
>
> Everything is pointing to us currently at about 1,000ppm CO2/CO2e
> 400 ppm CO2
> 400 – 600ppm CO2e as CH4
> 100 ppm N20 (or some such? I isn’t that smart)
> and someone calculated the negative feed back of the particulates
> (smog) acting like a curtain = about 60 ppm CO2e
> Its the methane, and ‘they’ don’t want you to know, or it is so
> fucking bad they haven’t a clue of how to tell you.
> WASF.
So I think it is way to scary a subject for you guys, or you are under
political pressure to dumb down methane to maintain the bullshit shell
game that is carbon trading?
And you wouldn’t want your US masters, being outed for adding tons of
CH4 to the environment via fracking. And of coarse everyone via coal.
To tell the truth I gave up on the IPCC the very first time I read
something you put out.
Good luck
Regards
Robert Atack
http://www.oilcrash.com
LikeLike
robertscribbler
/ April 10, 2015Time scales that matter for Earth Systems sensitivity are in the range of 500-1,000 + years. So if human methane emissions fall, the 20 GWP is more accurate. However, if methane emissions do not decline, then yes, the point is rather moot (Fracking, in my view, is a terrible exploitation that should be halted as rapidly as possible. But I am also for the rapid cessation of fossil fuel burning as well.)
The 300-1000 value seems quite high to me. If you are looking at an absolute worst case value, you’re probably more in the range of 120. The GWP for methane in the 484 ppm CO2e figure I use is around 35 x. Close to what Dr. Gavin Schmidt recommends. Part of the reason why the lower figures are more practical is due the related water vapor feedback lag.
IPCC has put out good and very helpful work. However, we can well see where it has been constrained by various pressures, mostly on the policy side (and probably directly and indirectly related to fossil fuel special interest influence). That said, if policy makers had actually listened to IPCC — especially to the earlier reports — then we would have all been in better shape.
LikeLike
wili
/ April 10, 2015rs, I think under very large methane release scenarios, your 120x figure may have to be increased by half or even doubled (depending on how high the concentration is) because of depletion of OH radicals. I can’t find the reference to the main reference I’m thinking of right now on this, but here’s something related in the mean time:
“increasing levels of methane from 1X to 200X industrial levels increases the half-life of methane from 8.4 years to 42.5.”
Schmidt, G.A., and D.T. Shindell, 2003: Atmospheric composition, radiative forcing, and climate change as a consequence of a massive methane release from gas hydrates. Paleoceanography, 18, no. 1, 1004, doi:10.1029/2002PA000757.
http://pubs.giss.nasa.gov/abs/sc00100w.html
LikeLike
wili
/ April 10, 2015Ah, here it is. And the high end is not doubled GWP, but rather quadrupled!
” It is shown that if global methane emissions were to increase by factors of 2.5 and 5.2 above current emissions, the indirect contributions to RF would be about 250% and 400%, respectively, of the RF that can be attributed to directly emitted methane alone. Assuming several hypothetical scenarios of CH4 release associated with permafrost thaw, shallow marine hydrate degassing, and submarine landslides, we find a strong positive feedback on RF through atmospheric chemistry. In particular, the impact of CH4 is enhanced through increase of its lifetime, and of atmospheric abundances of ozone, stratospheric water vapor, and CO2 as a result of atmospheric chemical processes”
https://darchive.mblwhoilibrary.org/bitstream/handle/1912/4553/2010GB003845.pdf?sequence=1
“Strong atmospheric chemistry feedback to climate warming
from Arctic methane emissions”
Isaksen et al. 2011
GLOBAL BIOGEOCHEMICAL CYCLES, VOL. 25, GB2002,
doi:10.1029/2010GB003845
LikeLike
robertscribbler
/ April 10, 2015Per Wili —
Well, yes. If you have massive release, then you degrade the OH sink. To get to the x200 value, you need about 1,000 GT as methane hitting the atmosphere. But if you get that kind of surge, methane’s heat amplification efficiency also goes down due to saturation.
Per comment # 2… If the baseline GWP is 20, then 400 percent increase = 100 GWP. However we shouldn’t mix apples and oranges as RF does not directly correspond to GWP.
The low value assumes decline, but there is a bit of a ceiling on the high value.
LikeLike
wili
/ April 10, 2015Not to beat an asphyxiated horse, but four times your 120 figure would give something well within Robert A’s “300-1000” range. But I get the feeling Mr A. is talking about something different here–instantaneous GWP, which, as far as I can figure, is not either really very relevant to real-life situations. But I could be (am quite likely) way out of my depth on this one.
LikeLike
wili
/ April 10, 2015“methane’s heat amplification efficiency also goes down due to saturation”
Yeah, then there’s that.
I’m not clear on how high concentrations have to get for that to be a significant damping factor. Basically, by then we’re pretty well screwed, anyway, is my take.
LikeLike
wili
/ April 10, 2015There’s a good discussion here of the general issue: https://www.skepticalscience.com/toward-improved-discussions-methane.html
LikeLike
robertscribbler
/ April 10, 2015The black body absorption band is not an exact atmospheric match due to absorption competition along the band in atmosphere… Just one other point to consider.
LikeLike
robertscribbler
/ April 10, 2015As an example, the GWP of each additional molecule of CO2 halves for each doubling due primarily to saturation and competition along the absorption band.
It’s worth noting that if IPCC is off by orders of magnitude on CH4 RF, then it is off by orders of magnitude on some other negative RF. I don’t think this is very likely. The 86/34 GWP currently used is probably quite close. The earlier papers assumed 2007 GWP 72/20.
LikeLike
wili
/ April 10, 2015http://www.esrl.noaa.gov/gmd/dv/iadv/graph.php?code=ZEP&program=ccgg&type=ts
Record high methane measurements at Svalbard. (OK, now I’m going to bed.)
LikeLike
robertscribbler
/ April 10, 2015Methane levels for a number of stations have been rising more rapidly lately…
RE GWP vs RF.
RF includes band absorption, competition within the band and yields Wpm2 at the top of the atmosphere.
GWP includes RF, the residence time of the warming gas and expected feedbacks to a given gas. GWP is simplified in that it doesn’t include too much in the way of interaction with other gasses except as it relates to the RF measure.
So if you get x4 RF for an increasing level of methane that’s not something that’s due to the GWP of a single molecule.
LikeLike
wili
/ April 10, 2015I’d have to look more carefully again at the Isaksen paper, but I would be surprised if they hadn’t factored in the saturation effect. Of course, it’s just one paper.
And again, this is just one paper (though these are not exactly lightweights in the field) but it shows somewhat higher values than the standard ones:
Shindell, D.T., G. Faluvegi, D.M. Koch, G.A. Schmidt, N. Unger, and S.E. Bauer, 2009: Improved attribution of climate forcing to emissions. Science, 326, 716-718, doi:10.1126/science.1174760.
((from the note under figure 2)):
“Our calculations for the shorter 20-year GWP, including aerosol responses, yield values of 79 and 105 for methane” (The 105 figure is for both direct _and_ indirect aerosol effects.)
But actually in discussions I’ve read where some of these researchers are talking about their work, they question the usefulness of reducing the complexities of these different forcings to just a number. I think one said it’s like trying to quantify the difference between how bad liver failure versus heart failure is. They both are going to kill you, but in ways whose differences are not best expressed through mere numerical comparisons. And of course they interact…all things I know you know.
LikeLike
robertscribbler
/ April 10, 2015Yes. This jibes with most of what I’ve read on methane — with worst case GWP in the range of 100-120 when other factors are included and the timeframes are reduced to near residence time.
And you’re right. It’s either chickens pecking you to death or eggs bludgeoning you to death. The numbers help get a sense of things and, in my view, probably get the picture right in broad brush but can miss some of the smaller bits.
LikeLike
wili
/ April 10, 2015Thanks for the clarifications wrt to GWP and RF [Global Warming Potential and Radiative Forcing, for anyone else as acronym-challenged as I am ;-/]. I like your final metaphor particularly, dealing as I am now with poultry raising, though on the smallest possible scale.
And just in case I haven’t said it enough recently, you remain an incredible inspiration and a pure joy. : -)
LikeLike
todaysguestis
/ April 9, 2015Rapid global warming may be coming sooner than you think
http://mashable.com/2015/04/09/rapid-global-warming/
LikeLike
Colorado Bob
/ April 10, 2015Many other studies have pointed to a rapid buildup of heat in middle ocean depths across the Pacific Ocean during the past several decades, with a particular speed-up since the late 1990s. Linsley was a coauthor of a study published in the journal Science last year, which found that the Pacific’s middle ocean depths have warmed 15 times faster in the past 60 years compared to natural warming cycles in the previous 10,000 years.
Another recent study published in the journal Nature Climate Change found that, during the next four decades, Earth’s climate is headed for a rate of warming unseen in at least the past millennium. This could be enormously harmful since the rate of warming may be beyond many species’ capacity to adapt to a changing climate.
It will be a few years before it’s clear that the climate has entered a period of higher heat spending or not, but many signs right now are pointing to yes.
LikeLike
TomCobbler
/ April 10, 2015In response to todaysguestis great article, I think now that we are either in the beginning of a positive PDO phase or the end of 15-20 year negative phase. Either way, the hiatus that never really was is over either way. I still think much of the “buried heat” or stored up heat will remain in the ocean although a decent portion will be released by this coming el nino. Either way its the lessening of heat burial in the pacific that will send surface temps to new records in 15/16. It will be interesting to see how the carbon and water cycles respond in the next couple years.
LikeLike
Colorado Bob
/ April 9, 2015Obama Adviser During Recession Is Given New Challenge: Climate Change
Brian Deese’s first job at the White House included churning out economic doomsday scenarios, like how many communities might see unemployment rates hit 25 percent in the event of cascading bankruptcies across the Midwest.
“It was so harrowing,” Mr. Deese recalled of the grim months of recession in the earliest days of President Obama’s first term, when as a 31-year-old Yale Law School student he played a central role on the White House team that executed an $85 billion government bailout of Chrysler and General Motors.
These days the crisis atmosphere is gone and unemployment is at 5.5 percent, but Mr. Deese is still running the economic numbers at the White House on a different kind of crisis that is preoccupying the president. Mr. Deese’s job as Mr. Obama’s senior adviser in charge of climate policy is to push the president’s ambitious environmental agenda to governors, industry executives and international negotiators — while under daily political attacks from Congress and the coal industry.
“It’s not the harrowing urgency of the economy falling off the cliff,” Mr. Deese, 37, said of his new job during a recent interview in his West Wing office, just steps down the hall from Mr. Obama’s. “But it’s the urgency of, ‘We have a limited amount of time left to change the trajectory on a really urgent crisis.’’’
Link
LikeLike
wili
/ April 10, 2015Robert or anyone: Do you think the very high readings coming out of Mauna Loa recently may be related to diminished uptake of CO2 from a warmed Pacific Ocean?
Also, I keep forgetting what the number is for Super El Nino status. Does anyone know? Or is there one? Aren’t we heading for that at this point by the end of the year according to the latest models?
LikeLike
wili
/ April 10, 2015https://scripps.ucsd.edu/programs/keelingcurve/ (403+ and 404+ readings for the last four days)
LikeLike
robertscribbler
/ April 10, 2015We are a bit above baseline for CO2 right now. Pretty strong spike, but not sure if we could call it a signal at this point.
1998 was +2.1 C at peak. I don’t know if there is a delta T value for a Super El Niño, but we could probably call anything in the range of +2 C as something of that caliber.
LikeLike
Gerald Spezio
/ April 10, 2015wili, I have been claiming this for more than two months because I watch Mauna Loa like a bird dog.
I posted it twice at McPherson’s blog.
I think that it is a viable & highly probable hypothesis.
I just wish that it wasn’t true.
Robert’s explication here makes it even more probable.
The consequences would be ghastly.
Going over 1. C that fast is runaway heating – I have never used the phrase global warming, unless I have to quote.
LikeLike
Griffin
/ April 10, 2015At some point wili, the SST’s have got to start affecting carbon uptake. I certainly don’t know when from a scientific standpoint but it would not surprise me at all if we soon read the your observation is right on the money.
LikeLike
wili
/ April 10, 2015The thing is that I would actually prefer this explanation to a certain other one.
If emissions really were flat last year (at least from energy), then we should not expect marked growth in atmospheric CO2 levels this year, it seems to me. Yet we are getting exactly that. This either means that:
>>there was not, in fact, a flat year in energy emissions; or that
>>>the ocean is not absorbing the emissions that there were (and perhaps emitting some??); or that
>>there is some other source of emissions…(that’s what I don’t want to think about)…or that
>>I am missing something absolutely obvious (it would not be the first time ).
).
LikeLike
Gerald Spezio
/ April 10, 2015I posted this yesterday at Edge of Extinction.
April 8th, 2015 at 5:34 pm
Lidia, when I went to your recommended article from “The Conversation,” I noticed that part of the author’s piece used the standard simple Keeling graph for the period ending Dec, 9, 2014 = 398.48 ppm CO2.
Since I had checked it earlier, I knew the Keeling CO2 totals for the period ending Apr. 6, 2014 = 404.35.
I couldn’t miss the glaringly ominous 5.87 ppm increase in CO2 in just 4 short months.
I think that the oceans have had enough & they ain’t gonna take it anymore.
It is more shocking with juxtaposed graphs & the accelerating numbers of our accelerating perdition, but they won’t post.
LikeLike
Griffin
/ April 10, 2015Will the insanse temp anomalies of the US east coast ever get a catchy name?
LikeLike
robertscribbler
/ April 10, 2015Horribly Hot Haline?
LikeLike
Andy in San Diego
/ April 10, 2015East Coast WTF’s?
LikeLike
Griffin
/ April 10, 2015That pretty much sums up my thoughts every time I load SSTA on nullschool.
LikeLike
Colorado Bob
/ April 10, 2015“It’s a wild tyme , I’m doing things that don’t have name yet”
Jefferson Airplane – Wild Tyme
LikeLike
Colorado Bob
/ April 10, 2015The way the world once was-
The Doors – 1967 The Doors Full Album
LikeLike
Andy in San Diego
/ April 10, 2015Great Info Robert, very informative post. Thank you very much.
Another couple of months if it looks like a 98 repeat we could perhaps look to history at that time to estimate outcomes and impacts (ie: India drought, west USA deluge etc…). However, as we are in new territory it would be near impossible to use semi certainties.
We would then look at the deltas on the climatic reaction to try to forecast, very difficult.
LikeLike
Colorado Bob
/ April 10, 2015Andy in San Diego
Buckle your chin strap.
LikeLike
robertscribbler
/ April 10, 2015I am thinking the NE US is going to get slammed looking at the heat differentials map in December. That is a Nor-Easter generating machine in the making. US West Coast is up in the air as hot pool remains. Is a Super El Nino strong enough to beat out the RRR?
LikeLike
Colorado Bob
/ April 10, 2015The Doors – 1967 Strange Days Full Album
LikeLike
Colorado Bob
/ April 10, 2015The Doors – 1968 Waiting For The Sun Full Album
Hello I love you …………………. Won’t you tell me your name?
LikeLike
Colorado Bob
/ April 10, 2015The best of Jim Morrison . The best poet in the last 1,000 years.
LikeLike
Colorado Bob
/ April 10, 2015God did I cry when Ray died. Jim would have been a lost soul if it wasn’t for Ray. On the beach at Venice.
Life is funny ole’ dog.
LikeLike
Colorado Bob
/ April 10, 2015Ray and Jim saw all that we are facing. 48 years ago,
LikeLike
Colorado Bob
/ April 10, 2015These are the most perfect alums anyone ever made.
Nothing comes close.
LikeLike
Colorado Bob
/ April 10, 2015The Doors LA Woman 1971 full album –
LikeLike
Colorado Bob
/ April 10, 2015“But never been so broke, I couldn’t leave town”
Jim Morrison
LikeLike
Colorado Bob
/ April 10, 2015The Doors The WASP Texas Radio And The Big Beat –
LikeLike
Colorado Bob
/ April 10, 2015I want to tell you about Texas Radio and the Big Beat.
LikeLike
Colorado Bob
/ April 10, 2015There’s 3 trillion dollars in play tonight.
Drill baby drill may be done.
LikeLike
Colorado Bob
/ April 10, 2015There’s a lot of ways to attack a 3 trillion dollar enterprise.
LikeLike
Gerald Spezio
/ April 10, 2015The terrific graph won’t post, but if you go to the site you can enlarge it.
The graph is chock full of data.
Graph of the Day: Global carbon dioxide emissions from fossil fuels, 1751-2012
Posted by Jim at Monday, April 06, 2015
Global carbon dioxide emissions from fossil fuels, 1751-2012. Data from CDIAC (cdiac.esd.ornl.gov). Graphic: James P. Galasyn
5 April 2015 (Desdemona Despair) – Recently, there’s been discussion about a possible decoupling between global financial growth and carbon dioxide emissions, so Desdemona decided to check in on recent CO2 emission data.
The Carbon Dioxide Information Analysis Center (CDIAC) maintains a database of fossil-fuel CO2 emissions, which has been updated with preliminary data to 2012.
It turns out that the growth of human carbon emissions is pretty close to exponential, with an R2 value of 0.988 for the default Excel curve fit. The spike in emissions from coal that starts around 2002 is the biggest contributor to recent total emissions.
Given the persistence of the exponential growth over the past two centuries, it seems unlikely that anything in the foreseeable future will bend the curve downward.
You can get the data and related graphs here: Global CO2 Emissions 1751-2010 CDIAC.xlsx.
LikeLike
Robert Thankyoufornotbreeding Atack
/ April 10, 2015I’m looking at the pretty pictures of where the methane is, then the ones showing temperature anomalies ie off the east coast of New Zealand, there are meant to be lots of methane leaching from the ocean and at the same time NZ is 5c degrees above ‘normal’
In the east of Antarctica is another hot spot with a coincidental large amount of CH4
In the past it took something like 10,000 years for CO2 to go from 260 ppm to 400 ppm (right?), that is 833 CH4 lifetimes, and we have done it in 150 ish years, so we face about 800 CH4 lifetimes worth of releases in a very short time.
But why doesn’t the methane just blow away?
LikeLike
todaysguestis
/ April 10, 2015A mega city runs dry – Brazil’s largest city faces it’s worse water crisis
https://www.adbusters.org/magazine/119/megacity-runs-dry.html
Does anyone have any updated statistics on this? I’m finding that the English news isn’t covering this at all.
LikeLike
Griffin
/ April 10, 2015I was wondering the same. That article was chilling.
LikeLike
Mark from New England
/ April 10, 2015That first hand account from Sao Paulo was sobering, especially if written by one of its more wealthy citizens who just took a trip to NYC. Imagine how it is for the very poor living in their shanty shacks.
LikeLike
Andy in San Diego
/ April 10, 2015Here is the water levels for Sapeb (the water company). Shows current reserve levels.
http://www2.sabesp.com.br/mananciais/DivulgacaoSiteSabesp.aspx
I find using google translate with Sao Paolo or Brazil news sites works pretty good.
LikeLike
Greg
/ April 10, 2015Sabesp has been fudging their numbers for some time now. They have every incentive to do so.
The yellow line is the gravity inlet. They must pump water below this line. The actual volume is negative but for the people being lied to they already know as there water pressure is intermittent now and reduced regularly.
LikeLike
humortra
/ April 10, 2015Published yesterday (In Portuguese) –
http://g1.globo.com/sao-paulo/noticia/2015/04/sem-chuva-nivel-do-cantareira-se-mantem-estavel-nesta-quinta-feira.html
“With no rain in recent hours, the level of Cantareira System remained at 19.7% on Thursday (9), even the previous day’s level, according to report of the Basic Sanitation Company of the State of São Paulo (Sabesp).
Of the five other springs that supply the Greater São Paulo, two increased the level (Rio Grande and Rio Claro), two were stable (Alto Tietê and Guarapiranga) and one fell (High Cotia).
Whereas the new measurement that takes into account the dead volume of the total volume, the level increased from 15.2% to 15.3%. The difference compared to the previous method is caused by the new way of doing the calculation (see below).
The Cantareira, which serves 5.6 million people in the metropolitan area, received just over 12% of the rainfall for the month of April, which initiates the driest period. The months with less precipitation will be until September.
The situation is still critical, since only the second coordinate of the dead volume was recovered. On the same day last year, the system was operating at a level of 12.5%, but had more water, as the use of both dead volumes (287.5 billion liters) had not yet begun.”
LikeLike
JPL
/ April 10, 2015I’ve been following this thread, among others:
http://peakoil.com/forums/s-america-s-largest-city-on-verge-of-collapse-pt-2-t70883-420.html?sid=955c3afc77e1e094209994fbac89c0e6
John
LikeLike
Gerald Spezio
/ April 10, 2015R Atack, “But why doesn’t the methane just blow away?”
Where would it blow away to?
Yeah; when it’s not wanted, we throw it away?
LikeLike
Robert Thankyoufornotbreeding Atack
/ April 11, 2015Sorry Gerald I meant blow away from the places it is high in?
I guess the methane coming out of the ESAS is hanging around the ‘polar vortex’ because it is sort of trapped in the middle, well it was when we had a jet stream, Is the high amount of CH4 in this area the main cause of the warming up there?
If the forcing factor is as high as I am ;scaremongering’ could the 2ppm+ Ch4 they are seeing up there be the biggest problem now?
And the same must be true for the high readings in the Eastern Arctic, the CH4 is sort of trapped, but the stuff off the east coast of New Zealand, that might be contributing to the +5C I think we have at the moment(?), why doesn’t it just blow away, like across the Pacific?
LikeLike
Gerald Spezio
/ April 10, 2015The piece about Sao Paulo’ thirst from Adbusters went to the throat, dry mouth, & screeching belly.
BUT, I noticed this line from the suffering author;
“I scroll the photos I took last month on our trip to NYC.”
LikeLike
entropicman
/ April 10, 2015A quick back-of the encolpe calculation would suggest that at the usual 0.1%/day water consumption, the current 19.8% in Cantareira will be back to 5% in 148 days. That is September 5th, just after the close of the Olympics.
LikeLike
entropicman
/ April 10, 2015Spot the idiot. 🙂
The Rio Olympics are in 2016, assuming Brizil has any water left by then.
LikeLike
dtlange
/ April 10, 2015And maybe a SELF EXTINCTION RELAY TRIATHLON medal. Bahh!
LikeLike
Ouse M.D.
/ April 10, 2015The Matrix doesn´t wanna cause a disturbance in the Force…
In the mean time:
+20 C anomaly over the infamous Yamal- peninsula
http://cci-reanalyzer.org/DailySummary/
LikeLike
robertscribbler
/ April 10, 2015There’s been a heat corridor running up over that region for a couple of weeks now. Big pulse this week.
LikeLike
dtlange
/ April 10, 2015Thanks for the post, Robert. All this good news… 🙂
I liked your, “… A massive plug of Pacific Ocean heat readying to belch back into the atmosphere.”
That’s right, and from my ground observations and my knowledge of the present behavior of the atmosphere, that there is, above the PNW, at least, a dense thermal blanket of heat/moisture (Is there a one word term for this?) and particulate. Couple that with the flaccid jet stream, the RRR anchored in place, what you just described, and the unfettered FF emissions — we may be in for the worst, and soon.
###
– On a side note:
Hugo award – George RR Martin says rightwing lobby has ‘broken’ Hugo awards
Novelist says that group orchestrating readers’ votes for conservative ‘swashbuckling fun’ is trying to take ownership of the science fiction prizes
– theguardian-com/books/2015/apr/09/george-rr-martin
LikeLike
robertscribbler
/ April 10, 2015Looking pretty amazingly rough to me DT.
I got a chance to mention some of you guys in a recent interview coming up for Radio Ecoshock. Wanted to say how much I’ve appreciated everyone’s efforts and research. You guys have really helped me become more informed and I wanted to say something about it. I’ll be mentioning more of you in my next interview if I have the chance.
*Rant Starts*
RE Martin…
No surprise at all to me. I hit a glass ceiling when marketing Luthiel’s Song to major publishers — primarily due to conservative leaning agents and editors who ‘don’t like stories of this kind’ and who tended to publish bits by their right-wing buddies. You’ve got to be a blockbuster like Martin or Rowling or have a major platform all your own to get through that crap.
*Rant Over*
LikeLike
dtlange
/ April 10, 2015The surprising strength of ‘rainpower’
Torrential rains inside hurricanes might be acting as a control knob on these giant storms, reducing their intensity by as much as 30 percent, according to a new study.
…The new study finds that inside a hurricane, that tiny amount of friction is multiplied by a gigantic number of raindrops and creates enough power to alter the intensity of cyclonic winds.
LikeLike
dtlange
/ April 10, 2015http://blogs.agu.org/geospace/2015/04/10/the-surprising-strength-of-rainpower/
LikeLike
dtlange
/ April 10, 2015FROM MY AGITPROP VAULT, I SHARE: Smog Bomb Detonation 45 sec
LikeLike
Alexander Ač
/ April 10, 2015Plain crazy in California:
California’s New Era of Heat Destroys All Previous Records
The California heat of the past 12 months is like nothing ever seen in records going back to 1895. The 12 months before that were similarly without precedent. And the 12 months before that? A freakishly hot year, too.
What’s happening in California right now is shattering modern temperature measurements—as well as tree-ring records that stretch back more than 1,000 years. It’s no longer just a record-hot month or a record-hot year that California faces. It’s a stack of broken records leading to the worst drought that’s ever beset the Golden State.
The chart below shows average temperatures for the 12 months through March 31, for each year going back to 1895. The orange line shows the trend rising roughly 0.2 degrees Fahrenheit per decade, just a bit faster than the warming trend seen worldwide.
Seems ALMOST like a point of no return!
Alex
LikeLike
robertscribbler
/ April 10, 2015Hottest year ever. Worst drought ever. And we’re just getting started.
LikeLike
David Bidwell
/ April 15, 2015I believe last year at this time you were sounding the alarm bells over an extreme El Nino event as well, drawing dire conclusions from sips of computer model data. As you point out the models did not have a handle on the event and are very poor at predicting even short term climate variations.Why should we then believe their long term predictions?
Last Years Posts:
Monster El Nino Emerging From the Depths: Nose of Massive Kelvin Wave Breaks Surface in Eastern Pacific
El Nino Update: Monster Kelvin Wave Continues to Emerge and Intensify
LikeLike
robertscribbler
/ April 15, 2015David —
This blog covers areas of climate risk. Last year, we identified the potential for a strong El Nino by year-end due to a strong Kelvin wave and due to early model agreement.
Most El Nino observers at the time predicted moderate to strong El Nino by year end. We highlighted these predictions and provided some analysis of a potential worst case.
Our predictions included the potential for drought in India (we saw it, but it was thankfully less intense than it could have been), a prediction for increased drought in South America (it occurred and was worse than expected) and the potential for drought in Central Asia (which did not emerge). As an outside risk we identified the potential for dry weather along the US West Coast to whip-lash to extreme flood conditions should the RRR be over-ridden by the powerful subtropical jet that tends to ramp up coincident with a strong El Nino.
We also predicted a record warm year for 2014 — which did occur.
For this year, we are highlighting the potential for a very strong El Nino, as we are now seeing some of the long range models indicate. As you note, such a potential is by no means certain. But we should remain aware of the possibility due to such an event’s ability to amplify and worsen the already dangerous weather and climate impacts set off by human-caused heat forcing.
These include worsening drought in South America, worsening drought in Australia, interruption of the Asian Monsoon, extreme drought and fire hazard for Central Asia, and the potential for weather whip-lash (drought to extreme rain) in California.
In the event of a powerful mid-ocean event, we can almost certainly call for continued drought in California, however, together with a strengthening of the meridional flow into the Arctic over the Pacific Ocean zone.
In any case, the current Kelvin Wave will certainly strengthen and lengthen the duration of the current El Nino, regardless of whether the less certain long-range models bear out.
Lastly, I would like to reiterate that any long range prediction or prediction outside the realm of what is understood as traditional climate systems bears with it a lower potential accuracy. That said, it is still worthwhile to take a look at long range potentials, especially when we consider the possible impacts of extreme weather related to human warming.
Best,
–R
LikeLike
dtlange
/ April 10, 2015That’s right, car fossil fuel crazy California (My home for close to 50 yrs, and from which I fled (for health & $ reasons) a couple of years ago.
Always on the coast, I looked to the NW for wind and weather until the winds retreated with the jet stream. After a year in the US SW (NM & AZ — FF crazed and less controlled) I came to the PNW to at least be close to fresh air flow.
Ha! Forget it — the wind is still and the Willamette Valley is one long FF free fire zone with a culture more like the present Ukraine. Though there are many concerned people here, they are outgunned and outnumbered by the crude forces. And none of them will even look up at the sky to check on it. Weather reports are always tied to traffic flow and convenience — not survival, which the weather actually is.
OUT
LikeLike
dtlange
/ April 10, 2015I like the way WaPo and climatologist Nick Bond spoke of the warm water “blob” in the EPAC:
‘Bond and his colleagues found that the warm waters are caused by a ridge of high-pressure air lingering above them, rather than the standard low-pressure system that the Pacific Northwest usually sees in the winter. In normal winters, the low-pressure system helps the ocean water cool off and causes storms all along the West Coast. But the high pressure system made the ocean calmer and warmer…’
– The Pacific Coast just isn’t what it used to be… And it may never be so, again.
OUT

LikeLike
Tom
/ April 11, 2015Hey Alex, why aren’t you attacking the messenger here like Dave Cohen, who you agreed with on his blog smearing Guy McPherson – the only person who was telling the truth about climate change (and now ABRUPT climate change) long before anyone else, and who is only “connecting the dots” for people regarding the scientific papers on the topic?
LikeLike
Phil
/ April 11, 2015Latest PDO values are in:
JISAO March 2015 comes in at 2.00, down from 2.30 in February 2015.
NOAA’s NCDC PDO March value was 1.31, down from 1.54 in February.
LikeLike
David
/ April 13, 2015Robert, I notice that you still promote the Luthiel series that ended in a cliff-hanger several years ago. Do you have any plans on finishing it?
LikeLike
robertscribbler
/ April 13, 2015Absolutely. It’s a matter of getting the rest of the series finishing polish and then committing to a re-launch.
LikeLike