
You wouldn’t generally think of ocean temperatures in the range of 40 to 50 degrees Fahrenheit (5 to 10 degrees Celsius) as hot. But to the great sea-fronting glaciers of Greenland it may as well be boiling.
Greenland Ice Sheet in Hot Water
All it takes is 32 degree F (0 C) water to begin melting the ice. And for each 1 degree increase above that margin, melt rates will dramatically ramp higher. Though a typical summer will push ice to melt at the Greenland seafront ice edge, this year, especially near Baffin Bay, the melt pressure has been extraordinary.
Ever since late June, 40-50 degree F sea surface temperatures have dominated the ice edge zone. For most regions that’s temperatures in the range of 4-11 degrees Fahrenheit (2-6 C) above average. The kind of heat that really risks a rapid melt along the ice margin.
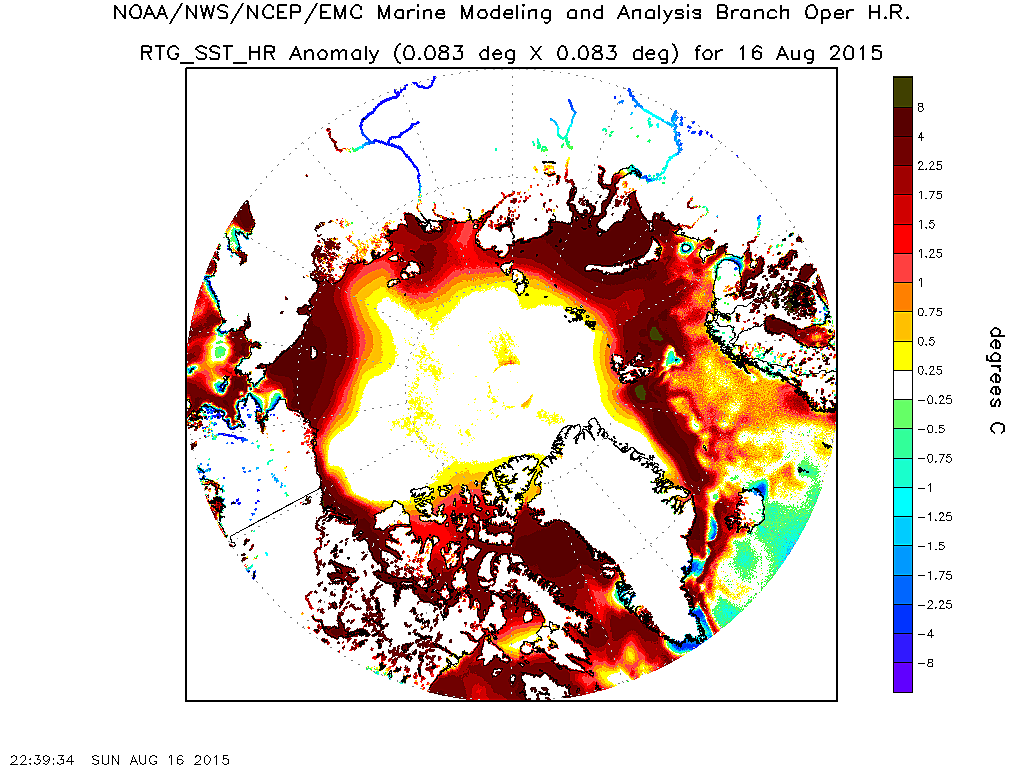
(Sunday, August 16 sea surface temperature anomalies as provided by NOAA.)
A latent heat that sits at the surface, gnawing away at the ice, waiting for a fresh water flood. And when the fresh water does come, that hotter, saltier, heavier water is forced downward beneath the lighter fresh water outflow. At this point, the hotter waters are locked below the surface where they go to work eating away at the glacier base. Notably, the only region within Baffin Bay where we currently see cooler surface water is in the major glacier melt zone near Jakobshavn. It’s an indication that ice melt from a major glacier outflow there is cooling the surface waters even as it pulls the surface heat downward and toward the glacial base.
This glacial melt heat conveyor is the kind of process we are seeing more and more frequently near the great ice sheets as fossil fuel industry has continued its harmful emissions. And, it’s a process that, this week took a huge chunk out of one of the world’s fastest moving ice masses.
Huge Chunk of Jakobshavn Breaks Off
According to reports from The Arctic Ice Blog, the Jakobshavn glacier sent its biggest chunk of ice on record floating off into Baffin on August 16 of 2015. For a glacier that drains 6.5 percent of the Greenland Ice Sheet and that has been known to release icebergs the size of Lower Manhattan, that’s really saying something.
You can see this amazing and rather chilling calving event in action in the August 14 to August 16 satellite imagery comparison developed by Espen Olsen below:

(Jakobshavn experiences what is likely it’s largest calving event yet on Sunday, August 16, 2015. Image source: Espen Olson.)
Here we see the ice-choked Baffin Bay waters rapidly surging inland and taking up more of the Jakobshavn’s traditional outflow channel. What we do not see in this image, but what clearly happened, was that an ice mass hundreds of meters tall and covering an area of about 12.5 square kilometers was shattered into flinders as warming ocean waters invaded the Greenland Ice Sheet. Waters that will deliver still more heat to the ice. Waters that seek for the very heart of Greenland — a below sea level basin topped with 2-3 kilometer tall mountains of ice.
Back in the 19th Century, the Jakobshavn Fjord was half full of grounded Greenland ice. A long tongue of the glacier extended on outward through the channel. As of 2015, the Fjord is now completely full of water and ocean-bound ice bergs. The ocean itself has begun to invade the much larger ice masses beyond the Fjord. The broader inland mass of the Jakobshavn Glacier which is now directly in contact with the rising seas (indicated as Jakobshavn Isbrae on the maps above and below).

(Warming waters from Baffin Bay have driven through the ice in the Jakobshavn Fjord and are now boring into the thicker ice masses of Jakobshavn Ibrae. An impact that has serious implications for global sea level rise. Image source: The Arctic Sea Ice Blog and Espen Olsen.)
The inland-retreating Isbrae itself is a vast field of giant ice sheets. Massive tilting escarpments of luminous ice that, in the current age of fossil fuel forced warming, often cup great 1-3 kilometer long melt ponds in their wildly varied topography. It’s a single region that, in total, may hold about 1.5 feet of global sea level rise locked away in a rapidly melting ice pack. And Jakobshavn is just one of many regions (together containing about 15-20 feet worth of sea level rise) that are currently undergoing rapid melt due to the invasions of warming ocean waters.
Links:


wili
/ August 17, 2015Thanks for another nice and very timely post! (As a logophile, I especially appreciated the inclusion of the word “flinders”!)
So should we expect to see an acceleration from here? Has it crossed a tipping point? Is it now past some kind of grounding line? How much do we know about the bedrock configuration below this feature?
(Sorry for so many questions. rs should not feel responsible for answering all or any of them. Just some points for further discussion/speculation…)
LikeLike
robertscribbler
/ August 17, 2015Once the ocean advances past the narrow channel, more glacial surface area becomes exposed to the warming waters. Basically what you have is a broadening melt head.
Jakobshavn, Petermann, and Zachariae all connect back to below sea level regions in the Central Ice Sheet. For Jakobshavn, it’s a bit complex as there’s a narrow channel that widens into a dual lobed basin. Behind the basin are more below sea level zones — expanding toward the central ice. But these are separated by slightly above sea level regions. Its rapid motion and basal melt flows, however, appear to be eroding these grounding zones.
So the situation is not quite so bad as some places in Antarctica where there’s a reverse slope situation. But much more of the ice is in contact with the water at this point.
(For those who’ve sent editorial suggestions — my thanks, fixes are in).
LikeLike
wili
/ August 17, 2015Thanks for the illumination, as always.
(And one might say in the broader sense that ‘the fix is in’– the climate has been rigged and the outcome will not reflect true justice! https://en.wiktionary.org/wiki/the_fix_is_in)
LikeLike
climatehawk1
/ August 17, 2015Tweet scheduled.
LikeLike
Andy in SD
/ August 17, 2015If you look at the ice berg flow as it comes out of the fjord you can see them heading north. They are being pushed by the same warm water intrusion which is eroding the face and under belly.
This is from yesterday, a nice clear shot of this with no cloud cover.
http://www.arctic.io/explorer/8/2015-08-15/9-N69.25116-W50.75974
LikeLike
James Burton
/ August 17, 2015All the blue melt pools on the glaciers show up beautifully on that clear photo as well.
LikeLike
Andy in SD
/ August 17, 2015Well this is interesting….
Looking at the front face (grounding line) just south of Petermann you can see some severe disintegration.
12 months ago today, you can see that face is relatively intact, dropping some bergs.
http://www.arctic.io/explorer/8/2014-08-16/9-N79.4103-W65.90751
LikeLike
Andy in SD
/ August 17, 2015Now we fast forward 365 days.
The first thing you notice is the emissions of bergs. But look closer (flip between 2014 and 2015). You will see the surface topology of the 2015 image shows depressions, like fingers crisscrossing the surface. 2014 has the same, but less and less intrusive. There are no massive surface lakes causing this. This implies subsurface changes combined with settling. Compare them to 2014. They are endemic near the face, many more than 2014. They look like what one would expect with general fracturing. They also reach much further inland.
Also, look at the shadows on the surface. They are significantly pronounced in 2015. This may imply a steeper slope on the surface as it heads towards the salt water. The shadows within the crisscross matrix are darker, deeper. This can indicate a thinning.
http://www.arctic.io/explorer/8/2015-08-16/9-N79.4103-W65.90751
LikeLike
Andy in SD
/ August 17, 2015At the norther section of that giant ice face, you will see a melt pond. Keep your eye on that depression, and flip between 2014 & 2015. You can see how far that melt pond depression has moved towards the salt water in 12 months.
now, zoom out (2015) and look at the direction that the bergs are floating, north. Warm water flowing up along the Greenland coast is pushing them northward.
LikeLike
robertscribbler
/ August 17, 2015El Nino 3.4 now at +2 C.
So we wait on Bjerknes feedbacks. That hot blob is really going to make this interesting.
LikeLike
robertscribbler
/ August 17, 2015The Northern section of the Petermann does show some losses in these shots, Andy. For those looking at these comparisons, it helps to focus on the glacial ice edge as opposed to the floating sea ice, which can draw the eye away.
LikeLike
Andy in SD
/ August 17, 2015Idea….
Since melt ponds are depressions on the surface of the ice, one could track their movement on satellite images to calculate flow rate (year over year, as well as shorter time spans). This could be automated via image processing software.
LikeLike
robertscribbler
/ August 17, 2015Sounds like a worthy project for a programmer with some spare time, Andy. I bet we could get a pretty good idea through satellite imagery alone of the relative speeds of all the major glaciers. Would be an excellent tool for tracking the key ones — Zachariae, Petermann, and Jakobshavn. And it would provide information that is closer to real time. Right now we rely on studies for updates and those can take years.
LikeLike
humortra
/ August 17, 2015How do others react to this? To this layperson these findings seem diametrically opposed to everything I have read so far. I will be looking for responses from the scientific community.
“On warmer Earth, most of Arctic may remove, not add, methane”
http://phys.org/news/2015-08-warmer-earth-arctic-methane.html
LikeLike
robertscribbler
/ August 17, 2015Not new news. We know that methane trophic bacteria will become more widespread and not just in the Arctic. However, the size of the carbon store is so large that these bacteria alone aren’t capable of dealing with the entire source — much less creating a net carbon sink in the Arctic.
A warmer world seeps out more carbon and the biosphere responds. And at the pace of human forced warming, an added issue is created simply due to velocity. And, part of an additional problem is that these methane trophs also live alongside the hydrogen sulfide producers.
So, yeah, it’s a biosphere feedback. But not one that’s large enough to account for all that carbon.
LikeLike
L Racine
/ August 17, 2015Robert,
Are you aware of the huge sargasso algae bloom covering the Caribbean? Started in 2011.
Video of diving under it (6′ thick), it is really bad… the “new norm”?
USF is doing some research on it but nothing published yet.
Suspicion, nutrients, including CO2, temp and currents (upwelling?).
Link to satellite tracking
http://optics.marine.usf.edu/cgi-bin/optics_data?roi=ECARIB¤t=1
L
LikeLike
robertscribbler
/ August 17, 2015Actually, yes. Andy’s been reporting on this for some time and I’ve been trying to get a piece up on it. The issue is that bacteria is killing the Sargasso Sea seaweed. The dead seaweed is breaking off and being driven by current changes into the Caribbean. More on this later.
LikeLike
Griffin
/ August 18, 2015Oh no. If the sargassum is dying…So much of the life of the Atlantic is born there.
LikeLike
robertscribbler
/ August 18, 2015All the great and majestic things… Forced dependence on fossil fuels is wiping them out.
LikeLike
redskylite
/ August 17, 2015Thanks for sharing this, I have been reading about the invasion but it is the first documentary evidence I have seen. A colleague of mine lives in Barbados and this news has affected the tourism trade, on which they are dependent on there. Sadly he reports that the main tourist beaches are free from the weed and remain pristine, so this news needs handling with care. Peoples livelihoods depend on good reporting.
LikeLike
James Burton
/ August 17, 2015On the flip side, how are the glaciers in Patagonia doing? You never hear much about that end, but I expect they are not so significant in size, but the Andes glaciers are vital water sources. The world wide loss of high mountain glaciers is one of the key evidence points for warming, putting the “Global” into Global warming.
This world wide mountain glacier melt is a point to hammer the deniers with, as if they would listen.
LikeLike
robertscribbler
/ August 17, 2015http://www.antarcticglaciers.org/glaciers-and-climate/glacier-recession/shrinking-patagonian-glaciers/
LikeLike
Robert in New Orleans
/ August 17, 2015A possible dental analogy for what is happening at the Jakobshavn : the cavity has broken through the enamel and nothing but softer dentin blocks the way to the center.
LikeLike
robertscribbler
/ August 17, 2015That’s actually a pretty good analogy. Lots of melt cavities all over these days.
LikeLike
Jeremy
/ August 17, 2015Here in the UK the BBC has run two climate stories in the last week, Scotlands freezing summer and the forest fires in Oregon, Washington & Montana. Blame laid on the jet stream but absolutely no discussion on the reason for the weird weather eg global warming and no discussion of a future it seems to point too. It is a cause that it seems cannot now be spoken now we have a right wing party in government where markets and capitalism are supreme.
LikeLike
Ed-M
/ August 17, 2015Jeremy,
James Hansen predicted a freezing Scotland in his just released paper on how climate change will affect the ice caps (nonlinear melt and pulses).
LikeLike
Jeremy
/ August 18, 2015Ed-M, and that is the problem, a major paper, and apart from a mention in the Guardian there is no discussion in MSM as to the probable affect on the UK, so the vast majority of the population is totally unaware.
LikeLike
Spike
/ August 18, 2015I think some of the meteorologists are set into the mindset of oscillations and natural variance so firmly that they have a hard time dealing with an anthropogenic shifting baseline in which new and extraordinary things are happening. Quite a few are close to denial. And as you say for rightist governments that is pretty much expected behaviour.
LikeLike
Mblanc
/ August 20, 2015I think the BBC is cowed by funding pressures.
On the non-discussion of local implications of Hansen for the UK, the silence is deafening.
LikeLike
Ryan in New England
/ August 17, 2015The image of the receding glacier face up the fjord, and the rapid acceleration is very striking. And frightening to see the sea finally reach the end of the fjord and attack the ice sheet itself.
LikeLike
Abel Adamski
/ August 18, 2015One thing that intrigues me, the shape of Greenland, that ring of “islands” with a deep hole in the middle , Ancient Super Volcanic crater.?, see similar around the Pacific Rim, if so what happens as the central ice mass melts and the weight is no longer pushing down.?
LikeLike
Abel Adamski
/ August 20, 2015An interesting slant on rain and the Greenland ice sheet, also interesting that there was Chinese involvement and it was published in an english language Chinese publication
http://climatecrocks.com/2015/08/20/increasing-rain-events-change-dynamics-of-greenland-ice-melt/
Cyclonic rain events at end of melt season actually lift the sheets and accelerate flow and calving
LikeLike