Pawnee Fire Forces Another State of Emergency for Northern California

Human-forced climate change is driving severe events that local communities are having difficulty recovering from. The primary reason is that the tempo of these events is so high that it allows little time for recovery.

(Another series of intense wildfires, another state of emergency for California.)

This weekend, a large complex of fires erupted in the Lake County region of Northern California. By today, the fires had expanded to cover over 10,500 acres. The rapidly expanding fire has already destroyed more than 22 buildings while forcing 3,000 to flee. Meanwhile, Governor Jerry Brown had declared a state of emergency.

Hot and dry conditions fanned the blazes on Tuesday, increasing concerns that the fires would continue to rapidly spread. Temperatures in Fresno are expected to hit 100 degrees (F) today with readings in Redding likely to hit near the century mark. Meanwhile, a large zone from Death Valley to Vegas to Phoenix is predicted to see temperatures hit 108 to 114 (F) or above.

(Very hot conditions across California are presently elevating fire risk. Already, large blazes have burned numerous buildings and forced hundreds to flee. Image source: National Weather Service.)

These hot, windy conditions will continue to elevate fire hazards across the west — which is bad news for communities beleaguered by the ongoing spate.

During recent years, big swings between heavy precipitation events and hot, dry conditions have fueled larger, more intense wildfires across the U.S. West and particularly in Northern California. Human caused climate change drives these events by adding moisture to the atmosphere which favors heavier storms and by forcing temperatures higher. The result is that vegetation grows and blooms more rapidly during the wetter than normal periods and dries out faster during the hotter than normal periods — generating more dry fuel for wildfires.


Southeast Texas Hammered by 15+ Inches of Rain

It doesn’t take a hurricane or tropical storm to dump massive amounts of rain on southeast Texas these days. Just a wave of tropical moisture from an ocean warmed by human-caused climate change.

(Not a hurricane, but southeast Texas may see 20 inches or more of rain this week.)

Over the past few days, a massive surge of moisture has flowed off the warmer than normal waters of the Gulf of Mexico. This moisture has interacted with a trough dipping down over the Central U.S. to produce prodigious amounts of rainfall. And ever since late Sunday powerful thunderstorms have been firing across the Texas coast.

As of this morning, according to reports from The National Weather Service, between 5 and 15 inches of rainfall had inundated a vast swath stretching from the Texas-Mexico border northward to a Houston area still recovering from Hurricane Harvey’s historic floods. These heavy rains, producing amounts typically seen from a substantial tropical cyclone, have generated major flooding and flash flood warnings across the region. As the waters rise, residents have become justifiably concerned about personal safety and damage to property.

NOAA forecasts indicate that storms expected to continue firing through Thursday, with between 2 and 7 inches of additional rainfall possible. It is worth noting that atmospheric moisture levels over the region are very high. So predicted rainfall totals may be exceeded.

(As of 7 AM, more than 15 inches of rain had fallen over parts of southeast Texas in association with a persistent upper level low and related severe thunderstorms. Heavy rains have continued to fall throughout the day and aren’t expected to abate until at least Thursday. Image source: The National Weather Service.)

During recent years, increased global temperatures have generated more extreme rainfall events for places like southeastern Texas. Warmer ocean surfaces — like those in the heating Gulf of Mexico — evaporate more moisture into the atmosphere. And this moisture generates more fuel for storms — greatly increasing the peak rainfall potential of the most intense storms.

Last year, southeast Texas faced inundation from a number of severe events. A sequence that was capped off by the record-shattering Hurricane Harvey — which tied Katrina as the costliest U.S. storm on record and dumped more than 60 inches of rainfall over parts of the state. Though the present storm event is not likely to reach Harvey levels of extremity, it is a stark reminder that we have entered a new climate and extreme weather regime. One that will continue to worsen so long as we keep burning fossil fuels and forcing global temperatures to rise.

NASA: May Was 4th Hottest on Record

According to reports from NASA GISS, May of 2018 was the 4th hottest in the 138 year global temperature record. This new warmth came as the Equatorial Pacific began to retreat from a cooling La Nina state — which, all things being equal, would have resulted in somewhat cooler than average global temperatures.

(Analysis of global temperature trends based on recent NASA and NOAA reports.)

But all things are not equal. Greenhouse gasses in the range of 410 ppm CO2 and 493 ppm CO2e have created a historically unprecedented heat forcing within the Earth’s atmosphere. As a result, recent global temperatures have consistently exceeded 1 C above 1880s levels and have hit as high as 1.5 C above 1880s levels on a monthly basis and 1.2 C above those levels on an annual basis.

For this May, temperatures were about 0.82 C above NASA’s 20th Century baseline or about 1.04 C above 1880s levels. This was the fourth hottest May in the global climate record despite La Nina influences continuing to maintain hold over the global climate system.

(NASA global anomalies map shows distribution of warmer than normal [yellow to red] and cooler than normal [blue to purple] temperatures across the globe. Note that warmer than normal conditions dominated.)

Overall, the greatest above average temperatures were experienced in the regions of Scandinavia and Antarctica — from an anomaly perspective. Meanwhile, significant trough zones generated counter-trend cool temperatures near Eastern Canada, over the North Atlantic south of Greenland, and across Central Siberia. As we moved into June, some of these zones have shifted or moderated, with cooler air tending to shift closer to eastern Europe in Asia and toward the North Atlantic cool water zone (due to melting Greenland ice) from Eastern Canada.

Looking ahead, NOAA is forecasting a 65 percent chance for a return to El Nino conditions in the Equatorial Pacific by winter of 2018-2019. With atmospheric CO2 hitting near 410 ppm and overall greenhouse gas levels hitting near 493 ppm CO2e, this switch to the warm side of natural variability will again bring with it the risk of record hot global temperatures, should the NOAA forecast bear out. Though we should be clear that El Nino is merely a short term aspect of natural variability that is riding over the long term warming trend generated by human produced greenhouse gas emissions, particularly CO2 emissions from fossil fuel burning.


Accelerating Sea Level Rise is Being Driven by Rapidly Increasing Melt From Greenland and Antarctica

From 1993 to the present day, global sea level rise has accelerated by 50 percent. And the primary cause, according to recent research, is that land glaciers such as the massive ice sheets of Greenland and Antarctica are melting far faster than they have in the past.

(Assessment of factors involved in the presently increasing rate of global sea level rise.)

Antarctica, in particular, is melting much more rapidly — with melt rates tripling in just the last ten years.

The primary factors contributing to global sea level rise include thermally expanding oceans and the melting of ice on land. During the decade of 1993 to 2004, the World Meteorological Organization notes that oceans rose by 2.7 mm per year. During this time, land ice sheets amounted to 47 percent of that rise — or about 1.35 mm. The same report found that from 2004 to 2015, oceans rose by around 3.5 mm per year and that land ice contribution had risen to 55 percent (1.93 mm per year). Looking at sea level measurements from AVISO, we find that from March of 2008 to March of 2018, the average rate of sea level rise accelerated further to 4.3 mm per year.

The net takeaway is that the rate of global ocean rise has increased by more than 50 percent since the early 1990s and that this acceleration has been driven by increasing melt from large land glaciers like those in Greenland and Antarctica.

(Sea level rise contributors as reported by the World Meteorological Organization in its 2017 report on the state of the global climate.)

Over the coming years and decades, this rate of rise is likely to continue to accelerate — surpassing 5 mm per year sometime rather soon, and likely exceeding the 1 cm per year mark by the 2040s through the 2060s. Melt rates will likely increase substantially as we approach the 1.5 C and 2.0 C warming marks. However, the net heat pressure from fossil fuel emitted greenhouse gasses will also drive sea level rise rates. As a result, it is imperative that we work to cut fossil fuel emissions more rapidly and that we pursue a swift as possible transition to clean energy.

May Arctic Warming Event Follow-up — Not So Bad as Predicted, But Worries Remain for Early June

There are many reasons why we monitor Arctic sea ice melt during summer. First, sea ice is a key climate indicator. Second, we are in a period of time where ice-free Arctic conditions are becoming more possible as global temperatures keep rising. And third, falling levels of Arctic sea ice have knock-on effects for a number of climate systems that we all rely on.

(Will we see a warmer than normal early June for the Arctic Ocean? If we do, it could seriously impact the Arctic Ocean’s remaining and thinning sea ice.)

Last week, we pointed out that GFS models were predicting a very warm spike to around 3.5 C above average temperatures for the Arctic come late May. Thankfully, due to the model running a bit hot, such extreme readings did not emerge. However, temperatures over the Arctic Ocean remained about 0.85 C above average overall for the past 7 day period.

Consistent, though somewhat mild, warmer than normal temperatures for this time of year over the Arctic during 2018 are still somewhat worrisome. Recent very warm winter years have experienced ‘saving grace periods’ during May and June in which temperatures near the pole returned to near average or slightly below average.

(Above freezing or near freezing temperatures predicted for most of the Arctic Ocean on June 4, 2018 in the GFS model. Sea ice tends to start melting at around -2 C due to the salt content in surrounding ocean waters. During recent years, the Arctic sea ice has been far weaker and thinner than historic norms. Image source: Earth Nullschool.)

This is not the case for 2018 so far. Temperatures have tended to remain warmer than average for the Arctic Ocean and near the pole throughout May. Moreover, short range forecasts indicate that the critical time period of early June could see continued above average temperatures — providing a potential kick for sea ice losses come late season.

Overall, GFS model runs indicate that temperatures will remain in a range between 0.5 and 1.3 degrees Celsius above average for the Arctic over the next five days. These above normal temperatures pose increased risk for sea ice losses during the crucial June window. June weather tends to greatly influence late season sea ice totals. A warmer than normal June will produce higher numbers of melt ponds and greater impetus for melt to continue with force through July, August, and September. Cooler and often cloudier Junes have tended to protect late season sea ice from hitting new all time record lows.

(Weekly averages for the Arctic Ocean during early June are expected to range near 1 C warmer than normal — extending what has already been a warmer than normal May. Image source: Global and Regional Climate Anomalies.)

2018, so far, has seen a warmer than normal May for the Arctic Ocean. And so we see ice getting swept back behind traditional lines in the Chukchi Sea, in the Beaufort Sea, and in the region north of Svalbard. Peripheral areas like Baffin Bay, Hudson Bay, and the south Kara Sea have seen slower ice melt due to their co-location with trough zones. But it is Central Arctic melt that we should be more concerned about. So we’ll be closely monitoring this region as May runs into early June.


North Atlantic Warm Pool as a Signal of Gulf Stream Slowdown

Over the past few years we’ve seen very warm sea surface temperatures in the Gulf Stream off the U.S. East Coast. This heat traffic jam is an indicator of reduced energy transfer into the North Atlantic. In other words, there’s a strong observational signal that the Gulf Stream is slowing down.

(A much warmer than normal pool of water off the U.S. East Coast juxtaposed to an intense cool pool south of Greenland is a climate indicator of Gulf Stream slowdown.)

The development of a cool pool near Greenland, and associated with Greenland melt, is a further indicator of this trend. Recently, the near East Coast warm pool has enlarged and intensified. Meanwhile, the strength of the Greenland cool pool has also increased even as cold water currents issuing from Greenland appear to have sped up.

As noted above, Greenland melt is a major apparent driver. As glaciers speed up and calve more and more ice bergs, more fresh water enters the region around Greenland. This fresh water acts as a lens which cools off the ocean surface. It also serves as a cap, pushing down-welling water further south.

(Floods of ice bergs from melting Greenland glaciers like Jacobshavn have the potential to produce a climate and ocean circulation train wreck in the North Atlantic. Some indicators show that we are in the early stages of this disruptive process. Image source: NASA Worldview.)

The net effect is that the North Atlantic Ocean Conveyor acts as if a great wrench has been thrown into the works. The region around Greenland cools as areas further south heat up. A scenario that is also likely to generate more intense storms across the North Atlantic and over adjacent lands in Europe, North America and Greenland.

Recent scientific studies indicate that the North Atlantic circulation has slowed down by about 15 percent on decadal time scales. And it appears that this slow-down is showing up clearly in the North Atlantic sea surface temperature profile.

(A severe dipole anomaly for sea surface temperatures has developed in the North Atlantic. This is an observational indicator that Greenland melt is impacting North Atlantic Ocean circulation. Image source: Earth Nullschool.)

The combined indicators point toward serious systemic changes taking place in the region of the North Atlantic. Changes that are having knock-on effects to local climates — like enhancing the deepness of troughs over Eastern North America and lending higher atmospheric potentials that spike storm intensity. Meanwhile, considerable ocean conveyor slow-down risks a serious degradation of global ocean health.

Potential Historic Arctic Warming Scenario in the GFS Model Forecast for Late May

For years, Arctic watchers have been concerned that if May and June ran much warmer than average following an equally severe winter, we could see substantial sea ice losses, severe Arctic fires, and related knock-on global weather effects. This May, temperatures over the Arctic Ocean have run much warmer than average. And in the GFS model forecast, we see a prediction for a historic Arctic temperature spike during late May.

(Discussion of a potentially historic Arctic warming event for late May of 2018. Information for this analysis provided by Climate Reanalyzer, Global and Regional Climate Anomalies, and DMI.)

According to GFS model analysis, temperatures for the entire Arctic region could spike to as high as 3.5 degrees Celsius above average from Saturday, May 26 through Tuesday, May 29th. So much warming, if it does occur, would shatter temperature records around the Arctic and accelerate the summer melt season by 2-4 weeks. It would also elevate Arctic fire potentials while likely increasing upstream severe weather risks to include higher potentials for droughts, heatwaves and severe rainfall events (as we have seen recently across the Eastern U.S.).

The model run indicates three ridge zones feeding much warmer than normal air into the Arctic. The zones hover over Eastern Siberia, Western North America, and Central Europe through the North Atlantic and Barents Sea — pushing wave after wave of warmth into the Arctic Ocean region.

(Three ridges transferring heat into the Arctic are feeding the potential for a major polar temperature spike over the next ten days. Image source: Climate Reanalyzer.)

Over the coming days, this three-pronged flood of warm air could push temperatures over the Arctic Ocean to 2-10 C above average temperatures while Western North America, Eastern Siberia, and the Scandinavian countries could see the mercury climb to 5 to 20 degrees Celsius above average. This translates to 70 to 80 degree (Fahrenheit) temperatures for Eastern Siberia above the Arctic Circle, mid 70s to mid 80s for near Arctic Circle Alaska, and temperatures in the 70s to 80s for Scandinavia. For the Arctic Ocean, it means above freezing temperatures for most zones. Zones that are likely to see more rapid sea ice melt as a result.

Upstream effects include the potential continuation and emergence of fixed severe weather patterns. Extreme heat will tend to intensify for Western North America, while a pattern that favors severe rainfall is likely to remain in place for the Eastern U.S. Meanwhile, South-Central Asia through the Middle East are likely to see very extreme daytime high temperatures. Fire risks will tend to rise from Alberta to the Northwest Territory into Alaska and on through Central and Western Siberia as much warmer than normal temperatures take hold and Arctic lightning storms proliferate.

(Forecast Northern Hemisphere temperature anomaly patterns hint at a hot or unstable late spring pattern for many regions as the pole inters record warm territory. Image source: Climate Reanalyzer.)

It’s worth noting that should such an event occur during late May, it would represent yet another major and historic temperature departure for an Arctic zone that has thus far seen severe winter warming and related loss of sea ice. The concern is that eventually such heating would result in ice free conditions during summer — although when is a subject of some debate.

To this point, it is also worth noting that we should take the present GFS forecast with a bit of a grain of salt. Such amazingly warm temperatures are still 6-10 days away. Forecasts beyond the 3 day are notably fickle. And this particular model has run a bit hot of late. However, it is worth noting that the model has been correct in predicting a much warmer than normal May. And that we have already experienced one historic temperature spike during early May. So a pattern that demonstrates the potential for such extreme warming has clearly taken hold.


Globe Just Experienced its Third Hottest April on Record

According to reports from NASA GISS, the world just experienced its third hottest April on record. Topping out at 0.86 degrees Celsius above NASA’s 20th Century baseline, April of 2018 edged out 2010 as third in the record books despite the ongoing natural variability based cooling influence of La Nina.

(Analysis of present global temperature anomalies with information provided by NASA, NOAA and Earth Nullschool.)

The warmest regions of the world included large sections of the lower Arctic — encompassing Eastern Siberia, the East Siberian Sea, and the Chukchi Sea. In addition, Central Europe experienced much warmer than normal conditions. Notable cool pools included North-Central North America, the High Arctic, and the Weddell Sea region of Antarctica.

A seasonal reinforcement of the Jet Stream helped to keep cold air sequestered in the High Arctic during April. However, this sequestration appears to be weaker compared to recent April-through-June periods as record warm spikes returned to the High Arctic during early May. The result of strong south-to-north heat transfer through various ridge zones in the Jet Stream.

(Third warmest April on record despite La Nina. Image source: NASA.)

La Nina remained the prominent natural variability related feature during April. And the cooling influence of La Nina has tamped global temperatures down a bit following the recent record hot year of 2016. Overall, it appears that global temperatures are on track to average between 1.04 C and 1.08 C above 1880s averages during 2018. These rather high excessions are, of course, caused by atmospheric greenhouse gasses peaking in the range of 410 ppm CO2 (around 491 ppm CO2e) during April, May and June. Representing the greatest concentration of heat trapping gasses on Earth in about 15 million years.

With La Nina fading, its cooling influence is likely to become less acute and global temperatures may again begin to ramp higher by mid to late 2018. NOAA has indicated a 50 percent chance for El Nino formation during late 2018. If 2018-2019 does see an El Nino emerge, global temperatures will likely again exceed the 1.15 C threshold and potentially challenge 1.2 C.

(A warm Kelvin Wave crossing beneath the Equatorial Pacific brings with it the potential for El Nino formation during 2018-2019. If El Nino does form, and with atmospheric greenhouse gas concentrations so high, it is likely that we would see temperatures comparable to the record global warmth of 2016 re-emerge. Image source: NOAA.)

However, it is unlikely that the weaker predicted El Nino, if it does emerge, will force temperatures considerably higher than levels achieved during the strong El Nino of 2016. For that, we will likely have to wait until the early 2020s. But with carbon emissions continuing near record high ranges, temperatures are bound to rise — with the 1.5 C threshold likely to be breached by the late 2020s or early 2030s.

Arctic Ocean Deep in the Grips of May Temperature Spike; Beastly Summer Melt Season on the Way?

The Arctic Ocean as it appeared from space on May 6, 2018. Image source: NASA Worldview.

The Arctic sea ice is presently at its second lowest extent ever recorded in most of the major monitors. However, May is shaping up to be far, far warmer than normal for the Arctic Ocean region. If such high temperatures over this typically-frozen part of our world continue for much longer than a couple of weeks at this key time of year, precipitous summer melt is sure to follow.

******

During recent years there has been much speculation about when the Arctic Ocean will start to experience ice-free summers as fossil fuel related industries pump higher and higher volumes of greenhouse gasses into the atmosphere. In the early-to-mid 2000s, scientific consensus was that melt would tend to be more gradual and ice-free summers would hold off until the final decades of the 21st Century when the world was around 3-4 C warmer than 19th Century averages.

But the Earth System is far more sensitive to temperature increases than the early forecasts expected. Major Arctic sea ice losses surprised the world during September of 2007 and subsequently in the same month of 2012. Now, it is obvious that a pattern of far more rapid sea ice melt has taken hold. And the scientific consensus appears to have settled on a more likely and much nearer date around the early 2030s — when the world will have warmed by about 1.6 degrees Celsius.

(An oddly warm pattern in which above freezing temperatures have come early to the High Arctic is setting up during May of 2018. Content Source: Climate Reanalyzer. Video source: Scribbler’s Youtube.)

However, when it comes to sea ice, nothing is certain at this time. Any single Arctic year in which temperatures spike — particularly during normal melt season — could result in the losses that we once expected to occur much later in time.

There are many factors that will ultimately determine when a summer ice free state occurs. Warm winters are a major one. And the past two years (2017 and 2018) have seen Arctic winters in which temperatures hit some ridiculous high extremes. But another major factor is the set-up to Arctic summer that takes place during the window months of May and June.

Neven, one of our best Arctic sea ice watchers (you can check his blog out here), notes:

May and June are very important for the rest of the melting season. Not only do we now see these warm air intrusions, but high pressure maintains its presence over parts of the Arctic as well (which means relatively cloudless skies -> insolation -> melt onset and melt pond formation -> preconditioning of the ice pack -> melting momentum that gets expressed during July and August, regardless of the weather)… We have to wait and see what happens, step by step, but this isn’t a good start for the ice.

If May and June are unusually warm, particularly over the Arctic Ocean, then the sea ice — which is already greatly weakened — is bound to face an extended period of above-freezing temperatures. If such a period stretches for 5 months from May through September rather than the typical 4 months (June to September), then we are more likely to see the Arctic Ocean briefly flip into an ice-free or near ice-free state for the first time in human history.

(The coming week is expected to feature between 1 and 10 C above average temperatures for locations across the Arctic Ocean. These are very strong warm departures during May. Last week saw similar extreme warm departures. And we are already starting to see sea ice losses pile up. Image source: Global and Regional Climate Anomalies.)

This year, May is shaping up to be much, much warmer than normal for the High Arctic. Already, a large May temperature spike has occurred (see right image below). A temperature spike which is predicted to continue for at least the next ten days.

Not to put too fine a point on it, but this severe warming trend might end up presenting a bit of a problem. The extended period of melt mentioned above may begin in force — setting off a chain of feedbacks that could tip the Arctic Ocean into a far less frozen or even an ice-free state (under absolute worst case scenarios) this year.

To be clear, this is not a forecast that such a condition is bound to occur during 2018. It is just an analysis of underlying trends and a statement that risks are higher if such trends as we now observe continue. Late May could flip to a cooler than normal regime. June could be cooler and cloudier than normal (as happened during 2016 and 2017). And if that happens again, we may be spared.

(Average Arctic temperatures for 2017 [left] and 2018 [right]. The red line depicts the yearly temperature trend. The green line depicts the Arctic climatological average for 1958-2002 [which was already warmer than normal]. Note the big temperature spike in the right hand graph. That’s where we are now. Image source: DMI. For further reference, see Zack Labe‘s composite temperature analysis for the 80 North region.)

However, we are already on a much higher ramp for spring temperatures in the northern polar region than during 2017. And though 2016 saw a slightly warmer than normal spring near the pole, the May 2018 spike already far exceeds anything we saw at that time. So much, in fact, that present temperatures for May 6 are comparable to those typically seen during early June from the 80 degree N Latitude line to the Pole.

This higher ramp and related record warmth is already accelerating melt. Sea ice losses over recent days have greatly picked up and we are getting closer to record low daily ranges. If melt accelerates to a point, the greatly expanded darker ocean surfaces will draw in more heat from the sun’s rays during June — potentially overcoming the impact of the increased early summer cloudiness we have seen during recent years. Such a scenario, if it continues to develop, would be a nightmare from the climate change perspective.

Climate Change Ignores all Borders as Rain Bombs Fall on Kauai and the Middle East Alike

The weaponization of weather language has long been a topic of some controversy in the meteorological press. Peace-loving people the world over rightly try to communicate in a manner that discourages violent conflict. And the term ‘rain bomb’ has taken quite a lot of flak from those with thus-stated good intentions.

However, whether or not the language itself bristles with perceived warlike phrases, the weather itself is steadily being weaponized against everyone and everything living on the face of planet Earth by the greenhouse gasses fossil fuel related industries and technologies continue pumping into the air.

(Bruce Haffner snapped this photo of an extreme heavy rainfall event over Phoenix, AZ during 2016. Climate change has been increasing the intensity of the most severe storms. So we see historic an unusually strong events more and more frequently.)

So I’ll add this brief appeal before going into another climate change related extreme weather analysis — fight climate change, not wars. The opportunity for a peaceful, hopeful, prosperous future for basically everyone depends on it.

*****

Whether you like the phrase or not, more rain-bombs — or extreme heavy rainfall events far outside the range of usual weather norms — keep falling. And most recently the all-time record for the most rain to fall within a 24 hour period was shattered on April 14-15 as nearly 50 inches inundated Kauai, Hawaii. In a separate instance half a world away, late April and early May has seen extreme drought giving way to extreme flooding over parts of the Middle East. Both increasingly extreme drought events and much heavier than usual precipitation events are signals of human-caused climate change. And, lately, these signals have been proliferating.

Rainfall Records Shattered in the World’s Rainiest Place

For the Kauai event, the Washington Post reports that 49.69 inches of rain accumulated at the Waipa rain gauge on Kauai in just one 24-hour period. Though Kauai is the rainiest place on Earth — receiving some 400 inches per year with rain on most days — this single day rainfall was far in excess of even that soggy norm. In total, it amounted to about one and a half months of precipitation for the world’s wettest location falling in just one day.

The previous all-time record for single day rainfall in the U.S. occurred in 1979 in Alvin, Texas during Tropical Storm Claudette. This storm dumped 43 inches over a 24-hour period. The recent Kauai event shattered this record. And it involved no tropical cyclone — just historically high moisture levels over the Pacific colliding with unstable air masses streaming down from the north. In this case, warming ocean surfaces are generating higher levels of evaporation which in turn are feeding extreme thunderstorms all across the Pacific and over adjacent land masses.

(Historically heavy rains flip cars and wreck structures in Kauai on April 14-15. Image source: Lace Anderson and Hawaii News Now.)

Chip Fletcher, an expert on the impact of climate change on Pacific island communities, told the Los Angeles Times:

“The flooding on Kauai is consistent with an extreme rainfall that comes with a warmer atmosphere. Just recognize that we’re moving into a new climate, and our communities are scaled and built for a climate that no longer exists.”

The present record Kauai event has been classified as a 1 in 100 year instance in the context of past climatology. But given present conditions and ever-increasing Earth surface temperatures, this new record may fall within a decade or less as the atmosphere continues to load more moisture and as evaporation and extreme precipitation events steadily increase.

Middle East Hammered by Extremes of Drought and Storm

Half a world away, the Middle East is seeing its own series of weather and climate shocks. The nations of Egypt, Jordan, Yemen, Lebanon, Syria, and Saudi Arabia have been experiencing widespread and long term drought. This drought has, as with the recent Central U.S. event, in large part been driven by rising temperatures. Evaporation plays its role here too as lands dry out more swiftly when temperatures rise.

(A storm sweeping in from the Med brings heavy rains and havoc to a drought-stricken Middle East. Image source: Tropical Tidbits and The Washington Post.)

However, with climate change, you can never discount the hard swing back to heavy rain despite prolonged drying as weather chaos ensues. Such was the situation during the recent week as an intense weather disturbance crossed the Mediterranean and entered the Middle East on April 26th and 27th. The colder air mass tapped high levels of moisture bleeding off the, again, much warmer than normal sea surfaces in the Med. It then dumped this moisture in the form of extreme precipitation over the Middle East.

In Israel, the resulting flash floods swept away ten teenagers as street flooding that was described as ‘epic’ ran through the country’s cities. Waters over-topped sidewalks and rushed into homes and businesses as the heavens unleashed. One to two inch per hour rainfall rates were reported. Meanwhile, in Syria, heavy hail pelted down. Jordan and Egypt were also inundated — with many streets described as impassable due to flood waters. The leading edge of cooler air kicked up a massive haboob — which spread its immense cloud of dust over Saudi Arabia and Kuwait. Over recent days, the stormy pattern continued. Heavy rains overtook parts of Yemen — forcing a dam to burst and washing away dozens of homes and farms.

Two More in a Lengthening Tally

These two events are just the most recent affairs in a much larger and far more widespread pattern of ramping extreme global weather events. Events that will continue to proliferate so long as the world continues to warm. This is the state of affairs that continued fossil fuel burning has brought about. The rain bombs are hanging, enlarging, above us. They are waiting to fall. And the politically-charged denials of their chief manufacturers — oil, gas, and coal — only make the situation worse for us all.

Worsening Prairie Fires: Exceptional Central Heat and Drought Spurs More Oklahoma Blazes

Today, as with many recent days, Oklahoma is experiencing hot, dry, critical fire hazard conditions. And over the past month, historically exceptional drought and hotter than normal weather have spurred a spate of very severe and seemingly unrelenting wildfires across the state.

(The Rhea Fire burned nearly 300,000 acres in Oklahoma during mid-April. This large fire is now 100 percent contained. But blazes continue to break out. Image source: Climate.gov.)

During mid-to-late April, the Rhea Fire scorched 286,000 acres destroying more than 50 homes and killing hundreds of cattle. At about the same time, the 34 Complex fire burned through 62,000 acres and forced many Oklahoma residents to evacuate. For reference, the massive Thomas Fire which burned hundreds of structures in California this past December was 240,000 acres in size.

Unfortunately, severe fire conditions continued through today with 500 acres going up in flames near Pawnee Oklahoma in just the past 24 hours. In total, about 350,000 acres have burned so far this year (an area half the size of Rhode Island), numerous structures have been destroyed and an estimated 2,000 cattle have likely been killed. With severe drought, heat, and extreme fire conditions expected to continue throughout at least the next month, there is little relief in sight.


(The U.S. Drought Monitor shows severe dry conditions expanding across the Central U.S. during early 2018. Long range forecasts show drought continuing or worsening over Central and Southwestern States over the coming months. Image source: Drought Monitor and NOAA.)

The causes of the present fire hazard are quite clear. Throughout fall, winter, and spring, the Central U.S. has experienced both hotter and drier than normal conditions. During recent weeks, drought in this region has become exceptional — the highest drought category provided by the National Drought Monitor. In addition, strong, warm south-to-north winds have tended to prevail over the region. These winds have rapidly fanned many recent Oklahoma fires to massive size.

Over the coming month, this drought is expected to dig in as temperatures warm. And, as a result, fire danger is expected to be quite high for a broad region of the U.S. South stretching from just west of the Mississippi all the way to California.

(Above normal wildfire potential is expected to remain in place for Oklahoma even as risks rise for neighboring states. Image source: NOAA.)

Though spring wildfires do occur across Oklahoma and parts of the plains states, the trend has been for an increasing large fire incidence. This trend, in turn, has been driven by human-caused climate change. For as the U.S. has warmed, the rate of evaporation from soils, vegetation and lakes has increased. This higher rate of moisture loss both intensifies drought and spikes fire risk.

Warming and worsening drought has been a particularly acute set of affairs for Central and Western states. The number of weeks when large fires are a risk has increased from 50 to 600 percent for most of these regions. In other words, if it seems like there are more large fires, it’s because there are. And what we see now are spring prairie fires that are far more intense than they were in the past.

Major Arctic Warming Event Predicted For the Coming Week

It’s been consistently, abnormally, warm in the Arctic for about as long as any of us can remember. But during recent years, the changes — caused by a massive and ongoing accumulation of heat-trapping gasses in the Earth’s atmosphere — appear to be speeding up.

(Far above normal temperatures are expected to invade the Arctic this week. The likely result will be an acceleration of sea ice melt and retreat. Image source: Global and Regional Climate Anomalies.)

This week, two major warm air invasions — one issuing from Siberia and another rising up through the Fram Strait and extending north of Greenland are expected to bring locally 10-20 C above normal temperatures and accelerate early season sea ice melt in an already reeling Arctic.

Consistent Warmth, Record Low Sea Ice

The farthest north region of our world has just come out of a winter during which sea ice extents consistently entered never before seen daily low ranges. With the advent of spring, sea ice measures have rebounded somewhat from winter record lows. However, according to Japan’s Polar Research Division, we are presently experiencing the second lowest daily sea ice extents since consistent measurements began. Meanwhile, Greenland during April saw an odd early bump in surface melt.

Overall, the pattern has been one of consistent abnormal warmth. And over the coming week, a number of warm air invasions will infringe upon the typically cold early May Arctic — testing new boundaries yet again.

(An ice-free Bering Sea, open water invading the Chukchi, and fractured sea ice over the Beaufort are notable features for melt season start during May of 2018. Image source: NASA.)

Much of the heating action this year has occurred over the Bering and Chukchi seas — which have never seen so much ice lost. Already sea ice is greatly reduced through these regions. Open water extends far into the Chukchi — onward and north of Barrow, Alaska. Still further into regions in which sea ice is typically rock-solid during this time of year, the Beaufort is experiencing its own late April break-up. But the areas that are expected to see the greatest warming over the coming days run closer to Siberia and the Atlantic.

Major Spring Warm Air Invasion

Today, a wedge of above-freezing air is invading the Laptev Sea north of Central Siberia. Strong southerly winds issuing from Central Asia are running north into the Arctic Ocean. They bring with them 10 to 20 C above average temperatures for this time of year — which is enough to push readings as high as 35 degrees F (2 C) over what during the 20th Century would have been a solid fringe of the polar ice cap.

Over the next 24 hours, this leading edge of warm air will spiral on toward the East Siberian Sea — bringing above freezing temperatures and liquid precipitation with it.

(5-Day forecast maximum temperatures show considerable warm air invasions proceeding throughout the Arctic. In many cases, temperatures near the North Pole will be warmer than regions far to the south. An impact of the warming world ocean on the Arctic environment. Image source: Climate Reanalyzer.)

But the main warming event for the Arctic this week will occur in the region of the Fram Strait east of Greenland. A strong low pressure system near Iceland is expected to drive wave after wave of much warmer than normal air north into the Arctic. This warm air thrust will bring with it temperatures in some places that exceed 20 C above average. Overall, Arctic Ocean basin temperatures are expected to average more than 2.3 C warmer than normal for the entire first week of May. Such high temperature departures are particularly notable for this time of year — as Arctic thermal variance tends to moderate during spring and summer.

The system will push above freezing temperatures deep into the Arctic — generating a repeat of the strange flip-flop that has become so common recently where temperatures near the North Pole are much warmer than readings further south. Warmer than freezing temperatures will also over-ride coastal portions of northeastern Greenland in yet another odd aspect of the event.

Warm storm effects including gale force winds and waves of 8-12 feet will provide added effect to above freezing temperatures in impacting the sea ice throughout the Fram Strait and northeast Greenland region. Increased insolation due to sunlight spreading over the region will also add to the overall potential for melt.

CO2 is Regularly Exceeding 410 Parts Per Million for First Time in Human History

During May of 2018, average monthly CO2 values will likely range between 411 and 412 parts per million. A new record for a heat-trapping gas that is causing serious damage to both the Earth’s environment and human civilizations.

(Atmospheric CO2 accumulation since 2007 as depicted by this animation of Mauna Loa Observatory CO2 measurements by Robbie Andrew, of the CICERO Center for International Climate Research.)

There’s one word that best describes this — trouble. And in the most simple terms it means that more unprecedented severe weather, ocean health impacts, and sea level rise is on the way.

Exceeding the 410 PPM Threshold

Last year, atmospheric CO2 levels peaked at around 409.7 parts per million during May of 2018. Hitting just shy of the 410 ppm threshold which will be consistently exceeded this year during the annual peak.

This peak comes during April and May following Northern Hemisphere winter due to seasonal loss of tree leaf photosynthesis that converts a large volume of CO2 into oxygen during summer and fall. As trees return to bloom across the large northern land masses, CO2 concentrations periodically drop.

However, due to human fossil fuel burning, the natural CO2 cycle has, since the 18th Century been significantly thrown out of balance. And as a result, the atmospheric concentrations of this key heat trapping gas rapidly ramped higher and are now in a range not seen in 15-17 million years.

(The CO2 measure at the Mauna Loa Observatory shows a hockey stick like spike in CO2 following a relatively stable period of glaciation and deglaciation over the last 800,000 years. Image source: The Keeling Curve.)

As you can see in the image above, the present period has shown an unprecedented and dangerous rate of atmospheric CO2 increase. One that has no corollary in the past 800,000 years. One that is probably unique in its velocity.

High Levels of Heat Trapping Gases Pose Serious Consequences

Such a great accumulation of heat trapping gases results in serious consequences. Present atmospheric CO2 concentrations, if maintained over multiple Centuries are likely enough to warm the Earth by more than 3 degrees Celsius (significantly more than present warming in the range of 1 to 1.2 C). And such high levels of heat trapping gases — ranging above 410 parts per million — are likely enough to melt significant portions of the world’s ice sheets over Century to multi-Century time scales. During the last climate epoch when atmospheric CO2 exceeded 410 parts per million, the Middle Miocene, sea levels were 100 to 170 feet higher than they are today.

(Atmospheric CO2 levels are now the highest since the Middle Miocene of 15 to 17 million years ago. Image source: Skeptical Science.)

Sea level is not the only system influenced by high atmospheric CO2 levels. And everything from storms to drought intensity, to ocean health, to growing seasons, to typical seasonality, to coral bleaching, and including the Earth’s net ability to support life will ultimately be impacted.

Fossil Fuel Burning is the Primary Cause, Renewable Energy the Primary Solution

As mentioned above, record CO2 emissions brought on by fossil fuel burning is driving the unprecedented atmospheric accumulation we see today. During recent years, very rapid rates of annual accumulation near 3 parts per million (ppm) were achieved as a strong El Nino rippled through the Pacific and reduced the ocean’s ability to draw down carbon. The La Nina years of 2017 and 2018 are seeing these rates of accumulation dip back to near 2 ppm or slightly less as ocean drawdowns have periodically recovered. But more El Nino years are on the way and atmospheric CO2 levels will keep rising so long as mass fossil fuel extraction and burning continues.

(CO2 annual growth rates have proceeded in lock step with increasing rates of fossil fuel burning on decadal time scales. Shorter term fluctuations are driven by the ENSO cycle and large volcanic eruptions. Image source: NOAA ESRL.)

The advance of renewable energy and the reduced use of coal has enabled the world to achieve a slower rate of atmospheric CO2 release growth that appears to be reaching a plateau near 11-12 billion tons of carbon per year. This is still an insane rate of release. However, if the world resolves itself, it can begin to rapidly reduce this severely harmful annual belching of greenhouse gasses. Emergent clean energy technologies like wind, solar, battery storage, and electrical vehicles are providing this hope for response. However, rates of adoption will need to be quite rapid if serious and ever-ramping climate harms are to be avoided. Presently high atmospheric CO2 levels exceeding 410 ppm this year represent a serious hazard. One that we fail to fully address at our peril.

Notes:

  1. Human emissions of heat trapping gases is not limited to CO2. Methane and other greenhouse gasses produced by industry have resulted in a net CO2 equivalent forcing near 491 parts per million (CO2e). Though CO2 gain is the primary driver of human forced warming, these other gases have an accumulative impact.
  2. I have used the Middle Miocene as a corollary in this analysis due to the fact that present CO2 levels at 410 parts per million and CO2e levels at 491 parts per million (end 2017) generate a rough boundary for both the top and bottom ranges for this climate epoch. It is worth noting that the human forcing is probably more dangerous than that which occurred during the Middle Miocene due to the velocity at which heat trapping gases are accumulating.

March of 2018 Was the Sixth Hottest on Record

The surface region of the globe continues to cool relative to the record hot year of 2016. Equatorial Pacific ocean surface temperatures have remained near or within La Nina states for much of 2017-2018. And the result has been a slight dip as a part of the longer term warming trend.

But as you can see in the graphic below, post 2016 cooling doesn’t look very cool at all. In contrast, most of the world is still in the grips of record heat. And so long as atmospheric greenhouse gas levels remain so high and continue to rise, this state is unlikely to change. Inevitably, unless the build-up of greenhouse gasses through fossil fuel burning slackens, more global record hot years are on the way.

(March of 2018 was 0.89 C warmer than NASA’s 20th Century baseline or 1.11 C warmer than 1880s averages. Image source: NASA.)

Much of the world experienced warmer than normal temperatures during March despite the relative cool-down — with peak heating hitting as high as 7.4 C above average over the Bering and Chukchi seas of the Arctic. Central through East Asia was also far warmer than normal, as was most of Antarctica. A backing up of the Jet Stream generated cooler than normal conditions over Europe and a persistent trough across the U.S. East Coast produced cooler and stormier weather as well. A cool pool over the Equatorial Pacific was a signature of La Nina — a period of natural variability that tends to drive cooler surface temperatures. But a world at sixth hottest on record despite La Nina isn’t really cool at all.

Extending into Record Warm Territory

Overall, we are still in the process of entering new, record warm territory globally. Ever since 2016, global temperatures have not dipped below the 1 C above 1880s averages range on an annual basis. And it is unlikely that they will ever do so again. At least not until the world’s governments resolve themselves to stop burning fossil fuels and to draw down carbon from the atmosphere.

Presently, in the 2016 to 2020 period, it appears that we are exploring a global temperature range between 1 and 1.2 C above 1880s averages. This is comparable to the lower range of the Eemian climate period (around 120,000 years ago) when the North Atlantic was much stormier than we’re used to and when oceans were between 10 and 20 feet higher than they are today. It is a temperature range that supports both stronger droughts and more severe rainfall. A range that is increasing the peak intensity of the most intense thunderstorms and hurricanes. One that is causing serious damage to corals, that threatens ice free Arctic summers, that is increasing Antarctic and Greenland melt rates, that is threatening water supplies for major cities, and that is causing disruptions to crops — from flooding deltas to less predictable growing seasons.

(2018 may become the coolest year of the late 2010s. However, despite a second consecutive La Nina in the Pacific, it will still be far warmer than the super El Nino year of 1998 — which has been left in the dust as a global marker. Image source: NASA.)

At some point during a coming El Nino — possibly as early as fall of 2018, but more likely by the early 2020s — the 1.2 C threshold range will again be tested. By the late 2020s to early 2030s, it is likely that the 1.5 C line will be crossed. The result will be even more climate damage and disruption than we presently experience.

March of 2018, as the sixth hottest March on record, is just one point in time. One dot on the graph that measures the larger trend of human-forced warming. A dot in a world that is facing down increasing damages due to climate change. A world that is now morally called to act with far greater resolve than we have ever displayed before. We have seen far too many delays. And the hard pass is upon us. Those who rise to the occasion will be the heroes of our age. Those who fail — its villains.

The Increasingly Fragile Pine Island Glacier Just Calved Again

The point where the Pine Island and Thwaites glaciers meet the sea serve as a back-stop restraining most of the great ice flows of West Antarctica. If those backstops were to fail, ocean water would flood inland along a reverse slope and generate a massive and swift out-rush of ice that would ultimately raise the world’s oceans by about 3 meters. And, lately, the evidence is mounting that the backstops are failing.

At Thwaites, just south of the neighboring Pine Island Glacier (PIG), recent research found that the ocean was flooding inland beneath that enormous ice sheet at a rate of up to 400 meters per year. But to the north, there is indication of trouble at the ice surface.

Back to Back Calving Events

Just last September, a massive 100 square mile ice berg calved off the Pine Island Glacier. The event was significant in that it marked the first major retreat of the glacial front in the face of an advancing ocean. Pine Island had already sped up. But the calving face withdrawal inland appeared to mark a new phase for the large glacier.

(Sentinel 1 satellite observations show a rapidly moving Pine Island Glacier calving off another large ice berg. Meanwhile, considerable damage appears to have been done to the glacial front.)

Now, just 7 months later, PIG is calving again. A large, approximately 6 kilometer long, 1 kilometer wide, chunk appears to have broken off into the Southern Ocean and shattered. Meanwhile, to the north and south along the glacial front, rifts appear to have formed.

This recent calving event is significant for a number of reasons. The first is that it’s happening just months after a recent large break-off during 2017. Other recent calving events at Pine Island occurred during 2001, 2007, and 2013. The present 2017-2018 events are back-to-back. The second reason is that the splintering appears to indicate a more fragile ice face. An impression reinforced by the concordant formation of rifts spreading away from the calving zone. The third is that the satellite imagery suggests Pine Island Glacier is moving quite rapidly (Recently, this rate of motion has been 1-2 km per year. However, it’s reasonable to question whether the glacier is continuing to speed up).

Conditions in Context

Present global warming due to fossil fuel burning has now forced the world into a range of temperatures between 1.0 and 1.21 degrees Celsius above 1880s averages. This boundary is similar to that of the lower range of the Eemian 120,000 years ago when oceans where 10-20 feet higher than they are today.

(The tall ice cliffs composing the Pine Island Glacial front have become increasingly fragile and fast moving as they enter the warming Southern Ocean and as that warming water continues to invade inland. Image source: Commons, Pine Island Glacier Calving Front, NASA.)

Under present greenhouse gas forcing and planned emissions, additional warming is in store. Climate models produced by Dr. Michael E Mann indicate that we are likely to hit the 1.5 C global temperature boundary some time between 2027 and 2031 on the current emissions pathway. This predicted warming is significant because analysis of past climates appears to indicate a risk of more rapid rates of sea level rise when global temperatures rise to a range between 1.5 to 2.5 C above past base line averages (see meltwater pulse 1 A).

Since the 1990s, the global rate of sea level rise has proceeded at roughly 3.3 mm per year with an apparent acceleration to around 3.6 to 4.1 mm per year during the 2010 to present time period. Given observed ice sheet instability in West Antarctica, in East Antartica, and in Greenland, there is a serious risk that this rate of rise will continue to accelerate over the coming years and decades. The key question of concern is how much and how soon.

Rapid Sea Level Rise Possible as Ocean Floods into Antarctica at up to 400 Meters Per Year

From west to east and in a growing number of places, a warming ocean is cutting its way deep into Antarctica. Grounding lines — the bases upon which mile-high glaciers come to rest as they meet the water — are in rapid retreat. And this ocean, heated by human fossil fuel burning, is beginning to flood chasms that tunnel for hundreds of miles beneath great mountains of ice.

Such an immense flood has the effect of speeding up glaciers as far away as 500 miles from the point of invasion. It does this by generating a kind of abyssal pit that the glacier more swiftly falls into. And as these watery pits widen, they risk pumping sea level rise to catastrophic levels of ten feet or more by the end of this Century.

(A new study in Nature is the first to survey the rate of grounding line movement around Antarctica’s entire perimeter. What it found was disturbing. A large number of major glaciers are seeing historically rapid rates of grounding line retreat [red arrows] as only a few glaciers show very slow rates of grounding line advance [blue arrows]. Image source: Hannes Konrad et al, Nature, University of Leeds.)

The great ocean invasion is clearly on the march. Not yet proceeding everywhere, the advance is happening in enough places to cause major worry. In West Antarctica, 22 percent of its glaciers are seeing their grounding lines move inland by more than 25 meters per year. In the Antarctic Peninsula, 10 percent of glaciers are experiencing this retreat. And in East Antarctica, where the ice is piled thickest, 3 percent of glaciers are affected by the swift invasion.

The most rapid retreat — at up to 400 meters per year — is presently happening at Thwaites Glacier in West Antarctica. Thwaites alone encompasses enough ice to lift the world’s oceans by 3 meters. And the rate of inland ocean water invasion at this single location is a very serious concern.

(Grounding line retreat is just one of many factors that increase the risk of rapid sea level rise. Ice cliff instability, increased rainfall over glaciers, large floods of water into glaciers from melt ponds that then refreeze and fracture the ice, and a number of other factors all compound as the Earth is heated up by fossil fuel burning. Video source: International Business Times.)

But the issue is not one of single glaciers. It’s one where many very large mounds of ice all around Antarctica are under threat. And in much the same way that a dike risks breaking apart when it is punched through by a growing number of holes, Antarctica’s own flood gates to rapid sea level rise are threatened by each grounding line in quickening retreat. Another such ‘hole’ has formed at the Totten Glacier where the grounding line is retreating at around 150 to 175 meters per year. And Totten could produce another 3.4 meters of sea level rise if it collapsed into the Southern Ocean.

Continuing the dike anology, Antarctica holds back enough water as ice, in total, to lift the world’s ocean levels by an average of 200 feet. By greater or lesser degrees, each retreating glacier contains a portion of the potentially massive flood. And the overall rate of loss in the form of new glaciers going into retreat together with the pace of inland ocean invasion is speeding up.

This new set of research provides a more complete if fearsome picture of Antarctic melt. And though models aren’t yet able to pinpoint how fast sea level rise will be, a growing body of evidence points to greater than previously expected risk for rapid sea level rise this Century. So for the sake of our coastlines and of so many cities around the world, the time to act as swiftly as possible to reduce carbon emissions and their terrible related impacts is now.

Unusually Warm Early Arctic Spring Predicted Following Second Lowest Sea Ice Maximum on Record

After a brief Arctic cool-down late during a much warmer than usual freeze season, sea ice extents tortuously rose out of record low daily ranges during mid-March. This feeble climb was enough to barely hit above 2017’s record low maximum extent. It did not, however, push the Arctic out of its present trend of long term declines. Moreover, we are again set on a very low platform for sea ice as we enter what is predicted to be a warmer than normal start to melt season.

(Arctic sea ice losses are a long term trend that has been in place since the early to mid 20th Century. The recent satellite record captures this ongoing loss due to polar warming and triggered primarily by fossil fuel burning. In keeping with this trend, 2018 saw the second lowest sea ice extent maximum on record. Image source: Zack Labe. Data Source: JAXA.)

Arctic sea ice extent measured by JAXA and depicted above by Arctic observer Zack Labe, hit 13.89 million square kilometers on March 17th. Given the fact that warmer Arctic temperatures are now on the way, this is likely the furthest sea ice will extend in the northern polar region during 2018. By comparison, 2017 sea ice extent maxed out at 13.88 million square kilometers on March 6th of that year. As a result, 2017 just barely beat out 2018 as the lowest maximum extent in the satellite record according to JAXA.

A brief spate of cooler than average temperatures contributed to a short period of expanding sea ice late during freeze season. This cool snap in a much warmer than normal winter overall, has now ended. And the forecast shows that warmer to much warmer weather for late March may well be on tap.

Over the next week and a half, Arctic temperatures are expected to range between 0.2 to 0.8 C above average. This may not sound like much compared to the past winter which experienced long periods of 3-5 C above normal temperatures. However, the transition to spring and summer typically shows a regression toward baseline averages. In other words, since winter is where we are seeing most of the climate change related warming at present, even slightly warmer than normal temperatures during spring and summer can have an outsized impact. Especially following a very warm winter like the one we have just seen.

(The ten day forecast is presently predicting a very substantial Arctic warm-up. If this forecast is correct, it could result in a fast start to melt season. With sea ice extents already near record low levels, this potential is rather concerning. Image source: Climate Reanalyzer.)

Keeping this thought in mind, we are more likely to see slowly mounting sea ice losses over the coming days in various regions. Especially on the Pacific side of the Arctic — which is presently seeing above freezing temperatures running up through the Bering and well into the Chukchi seas. Given such a strong warm wind invasion over a key region of ice, we are very unlikely to see sea ice expansion beyond the present maximum.

Looking at the long term forecast, we find that the Arctic is expected to experience substantial warming — especially for spring. And this warming may serve to accelerate melt beyond typical rates for this time of year. The tendency for Pacific emerging warm winds appears to be in place. And by April 1st, a large plume of abnormal warmth is expected to run up from the Pacific and Eastern Siberian side of the Arctic. This plume is forecast to spread deep into the High Arctic — driving overall temperatures for the zone to 4.1 C above average with local temperatures between 20 and 25 C above average. If the present forecast holds, this unseasonal flow will also result in large regions of the East Siberian Sea experiencing above freezing temperatures for brief periods.

Taken in the greater context, if the predicted warm pattern of the next ten days becomes more of a trend for spring of 2018, then the near record low maximum of 2018 could well be followed by significant losses during melt season. Definitely a trend to keep an eye on.

Polar Warming Spawns More Severe Winter Storms

So there’s a lot of groundbreaking work going on in the climate sciences right now. And a major focus is evidence that winter polar warming events are increasingly connected to blizzards and storms in places like Europe and North America. Storms that are both historically powerful and that occur with greater frequency.

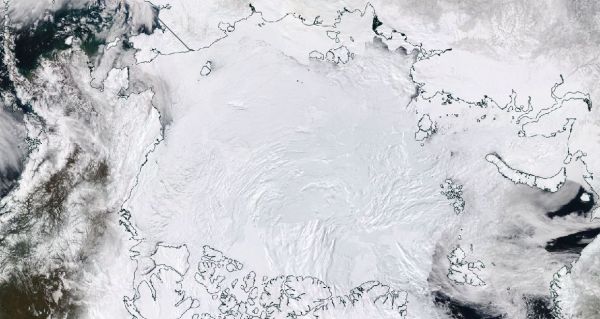
(A historic nor’easter produces major flooding on the U.S. East Coast even as a blizzard pounds the UK in early March. Were these extreme storms linked to human-caused climate change and related rapid polar warming? A new scientific study says — yes. Image source: NASA Worldview.)

A new study led by pioneers in the emerging field of climate change attribution for extreme weather events (including the notable Dr. Jennifer Francis), finds:

Recent boreal winters have exhibited a large-scale seesaw temperature pattern characterized by an unusually warm Arctic and cold continents… Using a recently developed index of severe winter weather, we show that the occurrence of severe winter weather in the United States is significantly related to anomalies in pan-Arctic geopotential heights and temperatures.

In particular, the authors discovered thatwinter storms were two to four times more likely when the Arctic is abnormally warm, compared to when it was abnormally cold (emphasis added).”

Stronger, More Frequent Storms

This is a rather big deal for a number of reasons. First, it’s an observational confirmation of earlier scientific work predicting just these kinds of extreme weather instances due to polar warming and related climate change. Second, it’s another indicator that human-caused climate change is pushing us into a period of much stormier weather for the North Atlantic region during fall and winter.

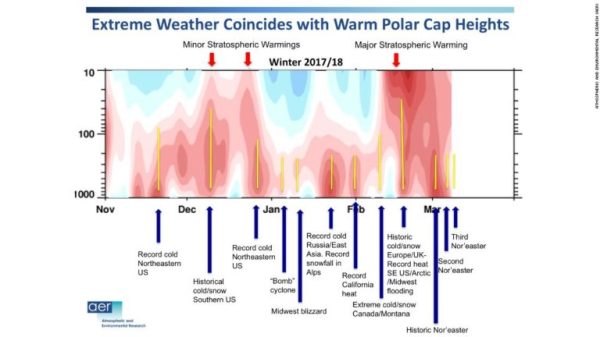
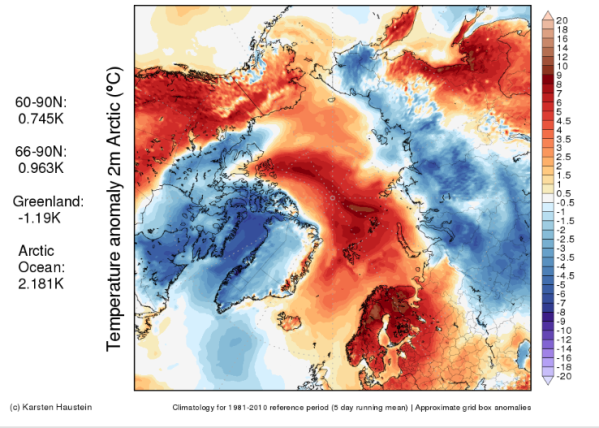
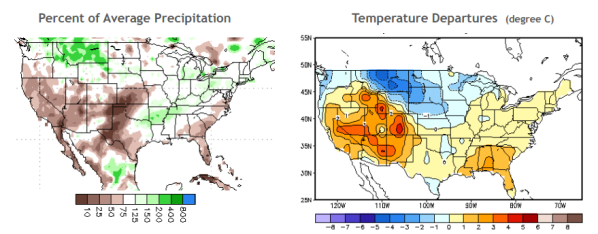
(A new study in the journal Nature finds that winter storms in the U.S. are two to four times more likely when the Arctic is abnormally warm than when it is abnormally cold. Due to human-caused climate change, the Arctic is now warming up at a rate two times faster than the rest of the globe (emphasis added). Image source: Atmospheric and Environmental Research.)

With the new NASA global temperature data set out, I thought we’d take this opportunity to apply a bit of context to apparent stormy changes we see at present in winter weather patterns.

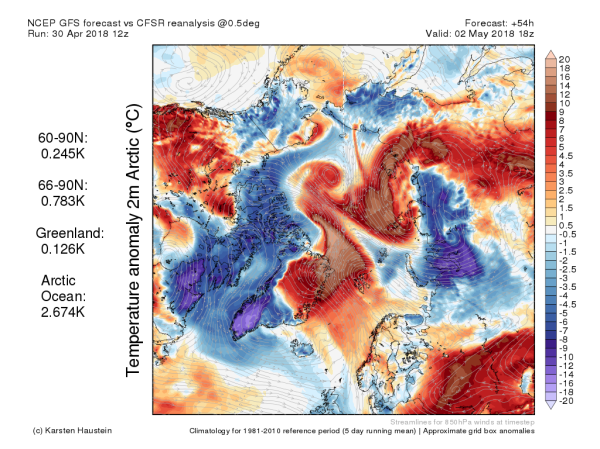
The first bit that I’d like to be crystal clear about is that the Arctic, overall, has become much, much warmer than usual during winter. That this warming spike occurs in the context overall global warming. And that this polar warming is increasingly associated with severe weather events in the middle latitudes and especially over the land and North Atlantic mid latitude zones.

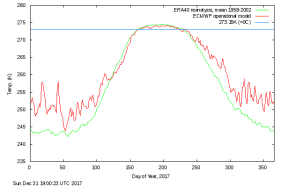
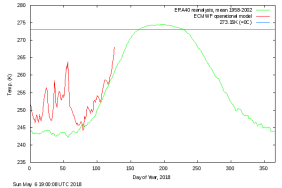
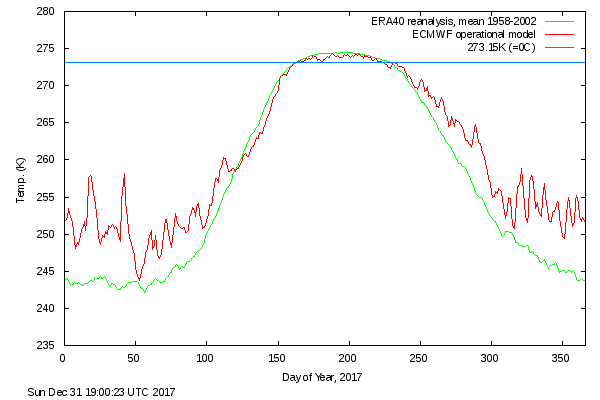
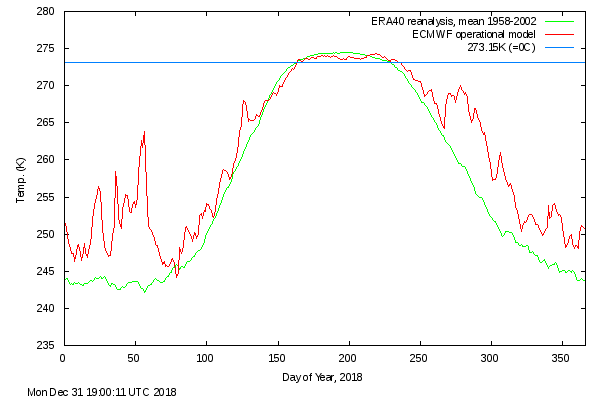
The above graph shows polar temperature anomalies from the surface (1000 mb/2 meter) of the Earth to the top regions of the atmosphere (10 mb/25 kilometers). Along the bottom of the graph, we have a list of extreme weather events. Analyzing the graph we find that major polar warming associated with extreme temperature increases at the bottom of the atmosphere all the way through to the stratosphere correlate with recently more frequent historic blizzards and nor’easters in the regions mentioned.

Polar Warming Flushing Cooler Air into the Middle Latitudes

In previous posts, I used the ground-breaking scientific research of Dr. Jennifer Francis and others as a basis to analyze how energy transfer into the polar zone in the form of heat build-up has generated these extraordinary temperature extremes. How this ramping heat is associated with polar amplification — an aspect of human-caused climate change. And how these warming events can have upstream (Jet Stream) impacts that increase storminess in the middle latitudes.

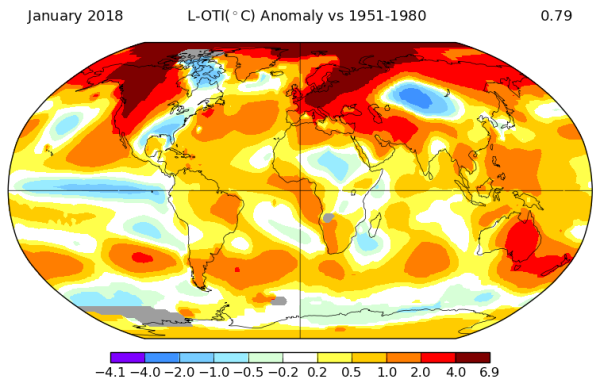
(From January [top] to February [bottom] the pole heats up and extreme weather events ensue. Image source: NASA.)

But let’s take this analysis a step further to look at, as January progressed into February, where it got warmer, where it got colder, and where the big storms fired off.

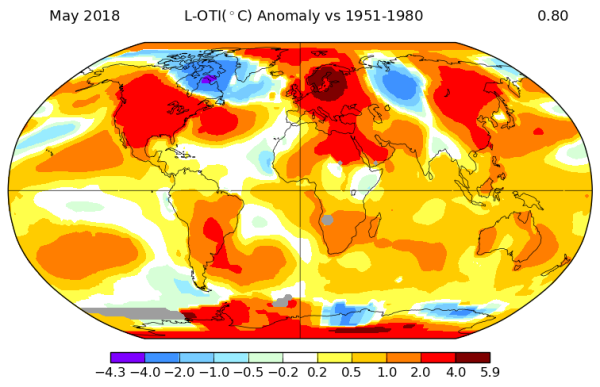
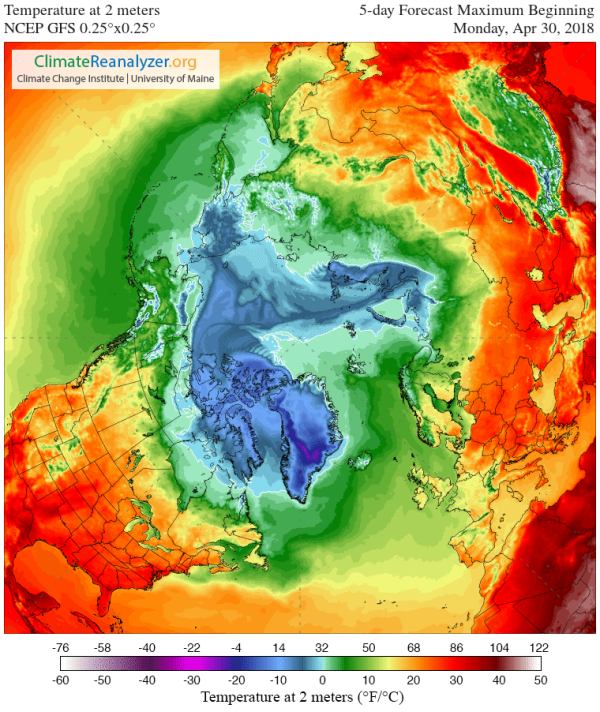
The maps above show global temperature anomalies (NASA) for January (top) and February (bottom). And looking at those maps we find that the polar region heated up significantly from already warm ranges of 4 to 6.9 degrees Celsius above average during January to an amazing 4 to 12.3 C above average during February.

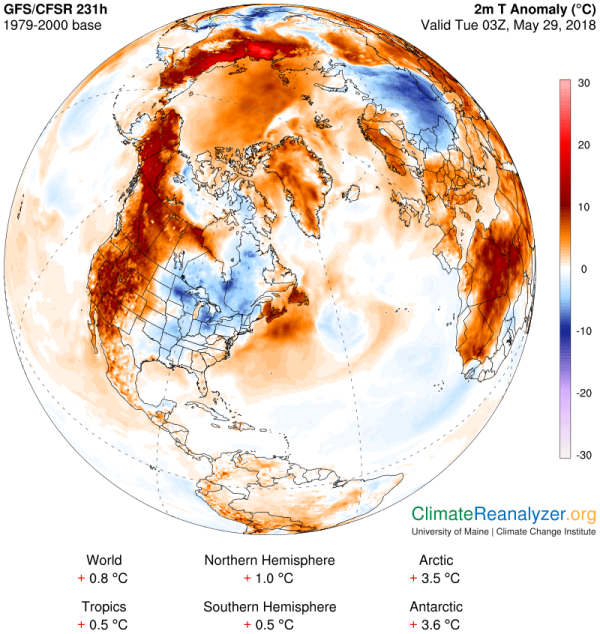
As this relative polar warming increased during February, the NASA maps show that colder than normal temperatures expanded over North America through Canada and parts of the Northern U.S. even as a cold spell began to blossom in Europe. Cold pools that were fed by Arctic air shunting southward as the Polar Vortex collapsed and remnant continental troughs emerged.

NASA’s zonal anomaly measures provide further evidence for this trend.

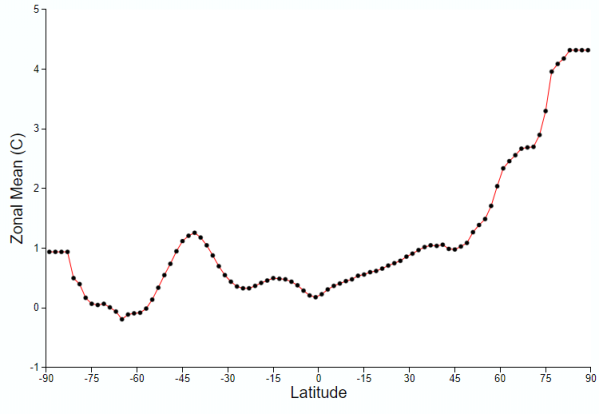
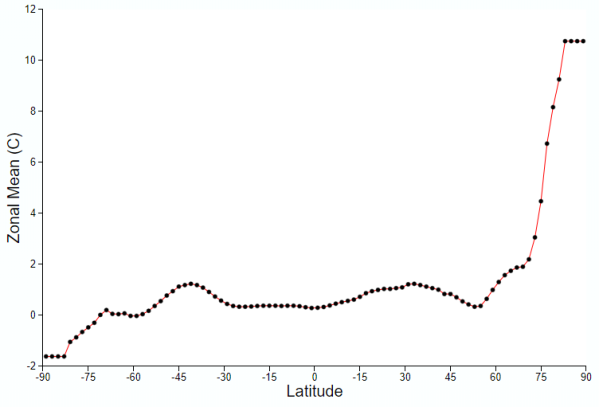
(Major northern polar warming from January [top] to February [bottom] is clearly visible in NASA’s zonal anomalies maps. Note that despite cold air excursions into North America and Europe, most zonal regions are warmer to much warmer than average.)

For here we find that as temperatures spiked from 4.5 degrees Celsius above average in the polar region of 80 to 90 degrees north latitude during January to an amazing 11 degrees above average during February, the region of 45 to 70 N dipped from 1 to 3 C warmer than average to 0.8 to 2.5 C warmer than average.

Note that the zonal middle latitude continental cooling is moderated by both the relatively warmer oceans and by very strong ridge zones running through these regions. But that the trough regions over both Europe and North America produced locally frigid temperatures and related instances of extreme weather.

Putting all these maps together from top to bottom we find that the polar warming events coincided both with mid latitude cooling even as we saw extreme snowfall in Canada and Montana, historic cold and snowfall in Europe and the UK, record flooding in the Central U.S., and record heat along the U.S. East Coast. We also find that the developing deep trough over Canada due to the expulsion of polar air southward in turn produced the succession of instabilities that would later spawn 3 very severe nor’easters off the U.S. East Coast during March.

Of course, all of these severe weather events are happening in the context of months that are around 1 degree Celsius warmer than 1880s averages globally. That January was the fifth hottest on record and that February was the sixth hottest on record during a La Nina that, all things being equal, should cause the world to be cooler than average.

But as we can see clearly here, all things are not equal — human-caused climate change is a big spoiler.

Intensifying Drought Shifts Toward Central U.S.

Last week saw a major increase in drought intensity in the Central U.S. as flash wildfires sparked across Oklahoma. Meanwhile, longer term drought trends remained strong even as the U.S. West Coast saw breaks in the dryness in the form of late winter precipitation.

(Drought expanded across the Central U.S. last week as precipitation deficits there increased. Image source: Drought Monitor.)

A return to severe to exceptional drought across the Western and Central U.S. was one of the hallmarks of the overall warm winter of 2017-2018. Historic drought, which had been suppressed by substantial rains during 2016-2017, appears to have returned — with threat of worsening conditions through spring, summer and fall.

In the Central U.S., the dry pattern reinforced this week which added to already serious conditions. During mid-week, Oklahoma saw the eruption of seven large brush fires as a result of both drought and strong winds sweeping across the plains states. Dry springs can result in fires for this region. However, the recent intensification of droughts brought on by human-caused climate change is spiking fire hazards from the Central U.S. through the West Coast and beyond.

(California snow pack totals remain well below average despite a recent increase in the number of storms affecting the state. Image source: CDEC.)

In California, snow packs are still running well below average, despite a recent wave of storms sweeping through the region. But it’s worth noting that though still much diminished from typical snow depth totals, the present range is now higher than the driest years — 2014-2015 and 1976-1977. So the situation isn’t looking quite so bad as it was a few weeks ago.

In addition, the blocking ridge that had dominated the West for much of the winter has mostly collapsed — allowing more rain and snow-bearing storms to cycle through. Some relatively intense precipitation is expected to fall over central and northern parts of the state later this this week. However, with widespread drought reasserting and with warmer than normal temperatures likely this spring, the increasingly drought-prone state is far from out of the woods.

(Temperatures have tended to remain above average across most of the U.S. this winter even as abnormally dry conditions impacted the Southwest. Image source: NOAA.)

Under human-caused climate change increasingly warm temperatures result in higher rates of evaporation from lakes and soils. This increases drought intensity for many locations around the world. In keeping with this longer-term trend, the winter of 2018 can still be characterized as both warmer and drier than normal for most of the U.S. But the overall drought pattern has shifted more toward the Central U.S. and away from the West Coast with the approach of spring.


Polar Anomaly Flip in an Abnormally Warm World: Arctic to Cool as Antarctica Heats Up

Interesting and concerning climate-change influenced weather in the global forecast for the next ten days.

As the Arctic is projected to cool down, it will open a brief window for sea ice to grow above its present track toward a record low maximum. However, any new edge ice will likely be weak and thin relative to past years. Meanwhile, sections of western Antarctica are predicted to see above freezing temperatures over the next week. And all of these various swings are occurring in a world that is considerably warmer than normal.

Global Context

Today, as with practically every day since I began tracking global weather and climate back in 2012, the world’s temperature averages are warmer than normal. An odd and increasingly harmful warmth that is driven by atmospheric CO2 levels ranging above 405 ppm (490 ppm CO2e). High heat-trapping gas levels that are, in turn, primarily the result of human fossil fuel burning.

(Despite an building cool-down relative to typical temperatures in the Arctic, the globe remains much warmer than average. The most intense hot spots for today hover over Canada, Southern Europe, North Africa, the Middle East, India through China, and Parts of Antarctica. Image source: Climate Reanalyzer.)

The world, overall today, is about 0.7 C warmer than the 1979 to 2000 average. Compared to 1880s, that’s about 1.2 C warmer than a typical late 19th Century day. This warming is considerable. A long term average that is in a range comparable to the Eemian of about 120,000 years ago. In other words, the world we live in today is the hottest its been in more than a thousand centuries.

Looking at the various climate zones, we find that every major region except the Arctic is warmer than average. This is happening as Northern Hemisphere Winter transitions to Spring and as the polar jet stream appears to be reasserting itself a bit after a major polar vortex collapse event during February. A new integral cold air vortex is gathering over Northwest Siberia — which is allowing cooler conditions to again reassert in the Arctic.

Opportunity for Late Season Sea Ice Regrowth

Over the next week, temperatures in the High Arctic are expected to plummet. And for the first time since practically the start of Winter, readings over the Arctic Ocean zone are expected to range below average.

As noted above, the cold pole appears to be asserting in the region of Northwest Siberia. But cold air pushing out into the Barents, North Bering, North Baffin, and Irkutsk regions will afford some opportunity for a sea ice rebound.

This cold air retrenchment is expected to be juxtaposed by significant warming through Northern Canada, Alaska, the Southern Bering, Southern Baffin Bay, Southern Greenland and in a zone just north of Svalbard. This warm pole will likely help retard any sea ice bounce coming from cooler air asserting on the Siberian side — constraining ice growth in a number of edge zones and possibly asserting some counter-cooling melt. We may even see a polynya open up in the Beaufort as temperatures over Alberta rise to above freezing and warm winds drive northward.

As a result of this warm-cold dipole, and the related warmth in certain key ice edge zones, it remains uncertain whether sea ice will bounce enough to overcome an otherwise strongly asserted trend toward a record low Arctic sea ice maximum for 2018. But if such a bounce back were to happen, the opportunity for it to occur will be during this week or next.

Extreme Antarctic Warming

As the Arctic is predicted to cool down this week, the Antarctic is expected to heat up. By late this week through next weekend, a powerful plume of warm air is expected to drive above freezing temperatures across Marie Byrd Land and the Ross Ice Shelf in West Antarctica. As with recent Northern Hemisphere Events, a high amplitude wave in the Jet Stream will drive much warmer than typical temperatures far into what should be a frigid polar zone.

(A major warm-up predicted for sections of West Antarctica will likely produce surface melt as temperatures rise to above freezing. Image source: Climate Reanalyzer.)

This warming event is predicted to be rather intense and last for 2-3 days, with temperatures rising to 25-30 degrees Celsius above average in certain zones.

Such a warm-up would push surface temperatures in some locations to 2-4 C or warmer (up to 40 degrees F) and would likely produce periods of surface melt. These kinds of melt events have been a more frequent occurrence for Antarctica recently. They’re a part of the larger trend of ice mass loss both at the surface and on the underside of sea facing ice sheets as the local ocean has warmed. A primary driver of a noted acceleration in the rate of global sea level rise.

Looking on into next week, a subsequent warming in East Antarctica is expected to push temperatures for the whole Continent into a range approximately 3.5 C above average. This event, however, is not expected to drive significant above freezing temperatures inland, though some coastal areas may see brief departures into these ranges.