
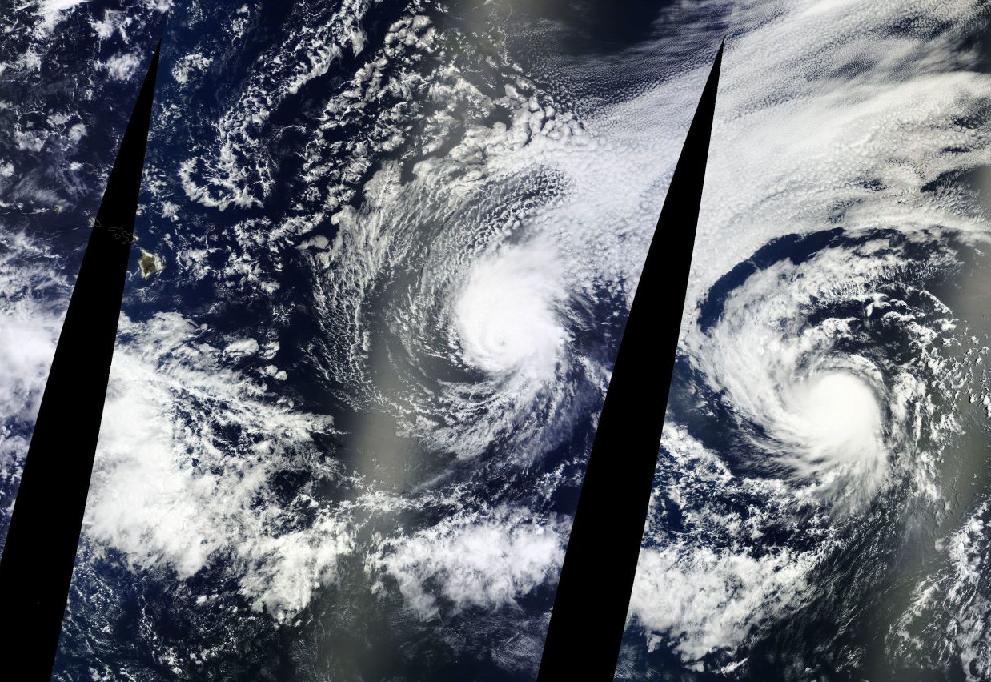
(Iselle [center frame] and Julio [right frame] take aim on Hawaii [upper left] in most recent LANCE MODIS satellite shot.)
The Northern Pacific has been a very hot place this year. Above the Equator and stretching from Asia to the West Coast of North America, very few regions have witnessed below normal temperatures. And numerous very large hot zones continue to dominate off of Central and North America, between Alaska and Russia, and near Japan.
Overall, Pacific Ocean temperatures today are an excessive +0.93 degrees C above the, already hotter than normal, 1979 to 2000 average. And this extra heat, fueled by global warming, provides energy for the propagation of tropical cyclones well outside of their traditional ranges.
For Hawaii, this means falling under threat of two cyclone strikes within the period of as many days.
Hot Pacific Waters Projected to Spawn More Hawaiian Storms
Cyclone strikes in Hawaii are rare. The last time the island state was pummeled by a tropical storm was during the 1992 El Nino. But now it is threatened by not one, but two hurricanes. It is an event that is unprecedented in the entire satellite record. In other words, we’ve never seen this before.
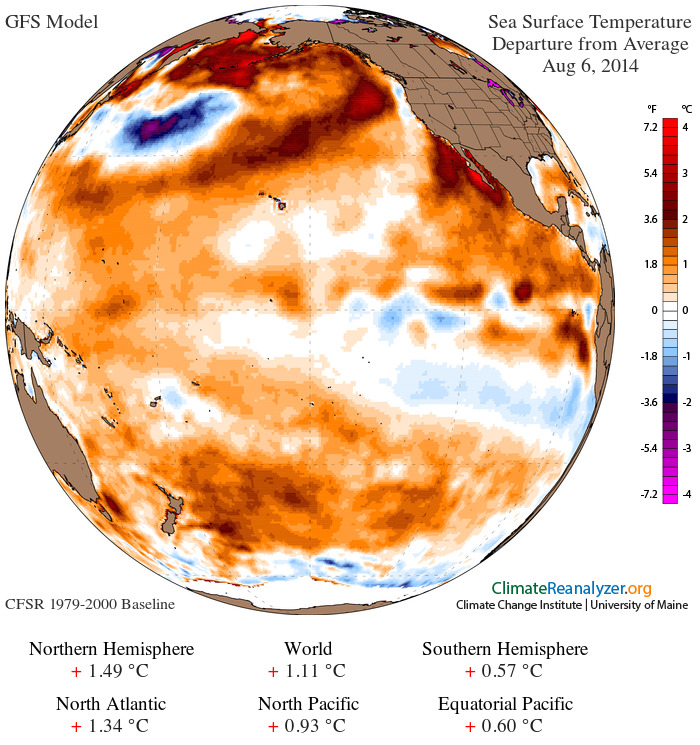
(Global sea surface temperature anomaly on August 6, 2014, shows an extreme +1.11 C positive temperature departure for the globe and a very strong +0.93 positive temperature departure for the North Pacific. Current science shows that warming ocean waters are extending the northward ranges of tropical cyclones, bringing regions like Hawaii under increasing threat. Image source: University of Maine.)
A shift in hurricanes toward Hawaii wasn’t entirely unexpected, however.
In 2013, Hiroyuki Murakami, from the International Pacific Research Center at the University of Hawaii at Mano together with a team of ocean and atmospheric researchers produced a report for Nature entitled Projected Increases in Cyclones Near Hawaii. The study modeled expected increases in Pacific Ocean surface temperature driven by human-caused climate change in the region near Hawaii. What it discovered was a marked increase in storm formation near Hawaii due to warming waters and related atmospheric changes.
The paper notes:
A key factor in projecting climate change is to derive robust signals of future changes in tropical cyclone activity across different model physical schemes and different future patterns in sea surface temperature. A suite of future warming experiments (2075–2099), using a state-of-the-art high-resolution global climate model1, 2, 3, robustly predicts an increase in tropical cyclone frequency of occurrence around the Hawaiian Islands.
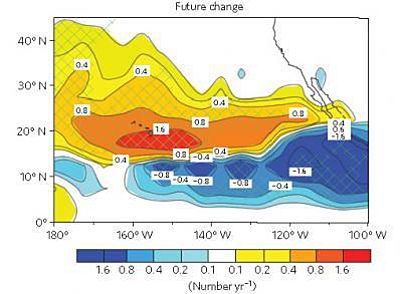
(Change in tropical cyclone frequency between now and 2075-2090 according to model projections produced in the Murakami Paper. Image source: Nature. See Also: Climate Change May Increase Number of Hawaiian Hurricanes)
What these researchers might not have expected was that a very warm Pacific during 2014 might well provide a prelude to what their models were predicting.
Iselle and Julio Barreling On In
For forecasts now show that Hawaii may well be in for a dose of double trouble — an extended period of stormy conditions starting early Friday and possibly not letting up until Monday as the unheard of storm pair barrels on in.
As of the most recent advisory, 85 mph hurricane Iselle was located about 650 miles to the east and southeast of Hilo. Iselle’s present and projected motion toward the west and northwest at around 15 miles per hour is expected to bring the storm, at a strong tropical storm intensity, over Hawaii’s Big Island by Friday. The storm is then projected to pass near the eastern islands before tracking back out into the open Pacific.
Coming directly behind Iselle, Julio is located about 1600 miles east-southeast of Hilo and packs maximum sustained winds of 75 miles per hour. The storm is also expected to weaken to strong to moderate tropical storm status before passing over or near the Hawaiian Island Chain along a track just to the north of Iselle’s path. This would bring the storm near the islands on Sunday, just two days after Iselle.
(Threat cones for Iselle, Julio and Genevieve, all developing in an unusual region near the Central Pacific. Image source: NOAA.)
It’s worth mentioning that a third storm, Genevieve, has also developed in the mid-Pacific within about 1,000 miles of the Hawaiian chain — also in a rather rare region for tropical cyclone formation. Genevieve, however, is not expected to threaten the islands as it tracks westward, taking a long journey toward Asia.
Conditions in Context
These three cyclones generated over warm waters near the central equatorial Pacific. The storms emerged from a convective pattern in a region that typically only shows robust storm development during El Nino.
Though El Nino is not officially ongoing, atmospheric conditions over the past few weeks have become more favorable even as a new warm Kelvin Wave appears to be forming in the waters of the Western Pacific. NOAA still forecasts a weak to moderate El Nino for 2014, but conditions, though somewhat more favorable, remain murky.

(Current sea surface temperatures in the region of Hawaii are a in rather warm and mostly above average range from 26 to 28 C [80 to 83 F], more than enough to sustain powerful tropical cyclones. Generally, water temperatures above 75 F are needed for tropical cyclone formation and strengthening. The primary limiters to both Eselle’s and Julio’s strength remains wind shear, which is expected to reduce both storms to tropical storm status over the coming days. Even so, Hawaii is in for an ongoing period of unprecedented weather. Image source: National Hurricane Center.)
It’s worth noting that a rash of storms in this region is unprecedented in the satellite era and is especially odd considering that ENSO remains neutral. It is very likely that the outbreak is in some way related to the larger Pacific Ocean warming trend associated with human-caused climate change acting together with an El Nino-like development trend.
UPDATE: Due to warm surface waters in the region of Hawaii and somewhat more favorable than expected atmospheric conditions, Iselle is expected to make landfall on the big island of Hawai’i near Hawaii City later today. Expected maximum sustained winds at the time of landfall are near 75 miles per hour.
Hurricane tracking from NOAA brings the storm directly over the Big Island at around midnight after which the storm is predicted to skirt Maui and Oahu:

(NOAA’s most recent projected storm track for Iselle. Image source: National Hurricane Center.)
Links:
Double Trouble: Hawaii Braces For Hurricanes Iselle and Julio
Climate Change May Increase Number of Hawaii Hurricanes
Projected Increases in Cyclones Near Hawai
Hat tip to Eleggua


eleggua
/ August 6, 2014http://www.princeton.edu/main/news/archive/S40/73/39S51/index.xml?
‘Geography matters: Model predicts how local ‘shocks’ influence U.S. economy’
Posted August 6, 2014; 11:45 a.m.
by B. Rose Huber, Woodrow Wilson School of Public and International Affairs
A team of economists including Esteban Rossi-Hansberg of Princeton University’s Woodrow Wilson School of Public and International Affairs have developed a model that can measure the widespread effects of local industry fluctuations such as the one in this fictitious scenario. Gauging the power of these fluctuations, or shocks — which can be positive or negative — could be a useful tool when it comes to designing policies to manage past and future shocks.
…
“Particularly interesting would be the case of Japan, which, as an island, is subject to its share of weather shocks. Such an exercise could assess the medium term impact of such an event on migration, productivity, employment and welfare,” Rossi-Hansberg said. “Each country needs to do its due diligence. The evaluation of policies to relocate production in space, disaster rebuilding efforts or large federally funded infrastructure projects crucially depends on this analysis.”
LikeLike
Colorado Bob
/ August 6, 2014Attacked by a malware virus today very nasty , watch what you click on as updates. to video files. It high jacked Google chrome .
I think the fucking Russians are coming .
I don’t think much of the Russians , they’ve been poor slaves since Vikings showed up.
LikeLike
robertscribbler
/ August 7, 2014Man, sorry to hear about the virus.
RE Russia, things have been interesting since the Ukraine flare up started. We’ve still been using kids gloves. Probably due to all the various partnerships on the line. Relying on them for launch tech is a rather bad idea, in my view.
LikeLike
Mark from New England
/ August 7, 2014“Change in tropical cyclone frequency between now and 2075-2090 according to model projections produced in the Murakami Paper.” – The Big Island is dead center in the zone of more frequent tropical cyclones.
When was the last time a big (Cat 3+) storm hit Hawaii? Does it happen very often (20th century)?
LikeLike
robertscribbler
/ August 7, 2014Only time in the record is 1992 when a cat 4 hit Kuaui.
LikeLike
eleggua
/ August 7, 2014http://www.ecology.com/2014/08/06/global-warming-deniers-desperation/
‘Global Warming Deniers get More Desperate by the Day’
By David Suzuki
August 6, 2014
Dr. David Suzuki is a scientist, broadcaster, author and co-founder of the David Suzuki Foundation. Written with Contributions from David Suzuki Foundation Senior Editor Ian Hanington.
LikeLike
james cole
/ August 7, 2014David has it right about the deniers. What makes them dangerous is the huge supply of money they have to work with and their ability to influence media coverage. They do not need to get time on media to deny as much as they need to shut down all reporting on global warming as it is being observed right now. Media is shameless in it’s lack of coverage of humanity’s most important story to date. Advertizing dollars have silenced both broadcast and print media. In the late 1980’s when science had exposed the global warming threat as real, the newspapers and broadcast media had story after story on this issue. Now forward to the last decade, and silence has fallen on an issue that has exploded on the scene mush more rapidly than the stories of the 1980’s dared predict.
Seems the worse the global warming gets, the more useless most media is.
LikeLike
robertscribbler
/ August 7, 2014Have to agree with you here, James. Excellent Article posted by E. And David flat out nails it.
LikeLike
eleggua
/ August 7, 2014“Fortunately, most people don’t buy irrational attempts to disavow science.
A Forum Research poll found 81 percent of Canadians accept the reality of global warming, and 58 percent agree it’s mostly human-caused.
An Ipsos MORI poll found that, although the U.S. has a higher number of climate change deniers than 20 countries surveyed, 54 percent of Americans believe in human-caused climate change.
(Research also shows climate change denial is most prevalent in English-speaking countries, especially in areas “served” by media outlets owned by Rupert Murdoch, who rejects climate science.)”
LikeLike
robertscribbler
/ August 7, 2014Murdoch’s anti-science media monopoly has really come back to haunt us, wouldn’t you say?
LikeLike
eleggua
/ August 7, 2014http://www.businessinsider.com/r-for-most-of-us-global-warming-has-become-normal-climate-2014-06
‘For most of us, global warming has become ‘normal’ climate
Reuters Aug. 6, 2014
…
February 1985 was the last month when global temperatures were below the 20th century average, according to the U.S. National Oceanic and Atmospheric Administration (NOAA), a leading source of global temperature data.
Meanwhile, the estimated median age of the world population in 2014 is 29.4 years, meaning half are older and half younger, Francois Pelletier of the U.N. Population Division told Reuters.
Taken together, the NOAA and U.N. yardsticks mean the world’s 7.2 billion population has shifted in recent weeks for the first time to a majority born since the last cool month.
……
LikeLike
robertscribbler
/ August 7, 2014http://washington.cbslocal.com/2014/08/06/nasa-climate-scientist-explains-15-year-global-warming-hiatus/
Better just to post the NASA press release.
LikeLike
eleggua
/ August 7, 2014^^^That’s an article on CBS’s DC site, on a different subject.
Did I miss something? Or did you refer to another post ‘awaiting moderation’?
Seems there’re a couple in the queue…
LikeLike
robertscribbler
/ August 7, 2014RE post in moderation.
The CBS source primarily repeated the NASA press release.
RE potential links between PDO switch and so called hiatus decades have been discussed extensively here.
Most scientific evidence points to an increase in the trades driving more atmospheric heat into the oceans over the past 10-15 years. Though the pace of atmospheric warming may have slowed, the pace of Earth Systems warming has not (ocean, ice, air) given most of the findings.
Previous climate estimates included a likelihood of possible atmospheric hiatus decades, but since the mechanism was not fully understood, it was not included in the IPCC GCMs.
Some papers that included PDO or AMO appear to account for the atmospheric ‘hiatus.’ So given what we know now, the changes are most likely driven by the ocean/atmosphere interplay and the ‘hiatus’ periods are actually times in which the deep and mid ocean warm up.
LikeLike
bassman
/ August 7, 2014Robert, This deserves a lot of attention as it relates to one of the biggest unknowns (How much of a negative forcing are aerosols from fossil fuel pollution?). Here is a new press release about a new study of Aerosols and cloud formation.
http://www.jpl.nasa.gov/news/news.php?release=2014-264
Key quote from this NASA release:
“Moreover, they found that the total impact from the influence of aerosols on this type of cloud is almost double that estimated in the latest report of the United Nations’ Intergovernmental Panel on Climate Change.”
This quote was describing a common low-level cloud that forms over the oceans which I assume has mostly a cooling influence compared to other cloud types. How significant might this finding be in terms of the IPCC’s or NASA’s estimate for aerosol forcing? many here know that if aerosols are masking greater warming (higher end of the error bar so to speak) we have probably locked in more warming than 2C since these aerosols will eventually fade out of the atmosphere. And if they don’t, it really doesn’t matter because that means we are still burning dirty fossil fuels well into 2030.
LikeLike
robertscribbler
/ August 7, 2014If you take the aerosols out we’re at the 1.9 C level for this century and the 3.8 C margin long term if you use Hansen’s 6 C ESS numbers derived from paleoclimate.
I prefer to use paleoclimate as base because the aerosol measures are even more uncertain.
Now to read the new findings.
LikeLike
bassman
/ August 7, 2014Thanks for the rapid response. Paleoclimate data would allow you to remove the short term influence of aerosols and focus on the long term influence of CO2 as aerosols would have only come from dust storms and volcanoes in the pre-human past?
Looking back at the IPCC forcing values you sent last month. The uncertainty is huge for aerosols. This paper seems to suggest that we are more at the high end of those values (high negative forcing from aerosols).
LikeLike
robertscribbler
/ August 7, 2014For low level clouds, absolutely, so long as the paper’s findings are validated.
LikeLike
robertscribbler
/ August 7, 2014They find that the intrinsic low level cloud radiative forcing for aerosols is -0.5 watts per meter squares globally.
And man did they bury that headline. I’d think that this will definitely help refine the models and help fill in some of the known gaps in the ECS measure.
They also find that the aerosol influence on low level cloud albedo is twice that of previous estimates.
If confirmed, I’d say these are very important findings. Covers a big gap in the cloud albedo science.
To your last question — yes, this probably means the Earth System is more sensitive to ghg forcing than ECS measures currently indicate. To my view, this isn’t entirely surprising as the paleoclimate evidence has been pointing that way for some time.
Thanks for the link.
LikeLike
bassman
/ August 7, 2014Here is the paywall paper on aerosols. I get the sense reading the abstract that this paper may suggest that aerosols are a big factor influencing surface temps currently. And as James Hansen puts it a “a faustian bargain” This could be significantly worse than what we thought previously. The climate may respond to CO2 much faster without the constant release of Aerosols from Asia and other countries. Think about how many aerosols end up over the pacific ocean from east Asia. This could be masking an enormous amount of warming.
http://www.nature.com/ngeo/journal/vaop/ncurrent/full/ngeo2214.html
LikeLike
robertscribbler
/ August 7, 2014Let me go back to the IPCC numbers and take a look.
LikeLike
robertscribbler
/ August 7, 2014The IPCC cloud adjustment due to aerosols for all clouds from top to bottom of the atmosphere is -0.55 watts per meter squared. So if I’m reading this correctly and the forcing from low level clouds over ocean alone is -0.5 watts per meter squared, then we can probably adjust the total cloud/aerosol forcing to around -0.8 watts per meter squared.
If this back of the napkin is correct then it would imply that aerosols mask about 25 percent of the total human RF addition since 1750, or about 55 ppm CO2e.
Of course this is just on a first reading…
LikeLike
bassman
/ August 7, 2014Thanks Robert. I guess it isn’t a surprising study but it seems to tackle the biggest uncertainty involving aerosols. I would like to see further analysis of Pacific temps and emission rates from Asia to see how much surface warming has been slowed down from this alone before then looking at natural variations.
LikeLike
robertscribbler
/ August 7, 2014That’s a good thought. I’d like to see the effect of low level clouds + aerosols on the Arctic during summer time, as well.
In any case, it’s a good addition that helps refine the data. I think that many rely more on the GCMs to determine sensitivity, and to them this measure will seem very important.
LikeLike
Tom
/ August 7, 2014Hi Robert. According to the Penn State weather service, the waters surrounding HI are cold and will dissipate the cyclones to a much weaker strength before they hit (according to their models). Looking at the map above, indeed the waters are colder. What do you think?
LikeLike
robertscribbler
/ August 7, 2014The waters around Hawaii, and especially to the east, are normally cooler which is one reason why it is so rare for cyclones to strike there.
The waters for the region where these cyclones formed, and near enough to Hawaii, were well above average, enough to shift the storm zone much closer to Hawaii.
The NOAA forecast includes weakening to tropical storm status for both systems as they reach Hawaii, which I included in the above report. Regardless, of these details, a double cyclone strike for Hawaii would be unprecedented in the satellite record and though temps just east of Hawaii are near the 1979-2000 average, they are much warmer than average for the north Pacific and equatorial Pacific over all and most of the waters surrounding Hawaii are hotter than normal.
In any case, calling the waters near Hawaii ‘cool’ is a bit of a misnomer. I have no below average water temps in the region. They are all average, above average, or very high above average (average being the already warmer than normal 1979-2000 period).
LikeLike
robertscribbler
/ August 7, 2014In any case, SSTs in the region of Hawaii are in the range of 26 to 28 C (80-83 F), which is more than enough to sustain a hurricane or a tropical storm even if it is a bit cooler than the storm’s origin points.
Under ideal atmospheric conditions, we could easily have a Cat 3 or 4 due to water temps alone. So that’s not a real limiter in this case.
LikeLike
Greg Smith
/ August 7, 2014How we respond to the emerging Ebola epidemic may offer some partial insights into the future of our world’s handling of the climate crisis. While, of course, very different threats in degree and kind, the psychology of seeing this as a true real and present danger, that is not defined by borders, seems relevant as a case study for the future.
LikeLike
robertscribbler
/ August 7, 2014We’ve responded well to Ebola. There’s no economic and political interest that’s vested in the notion of profits from Ebola.
LikeLike
Griffin
/ August 7, 2014Genevieve underwent rapid intensification in 6 hours. This has (to me) emerged a a clear trend in the Pacific this year. These storms have just erupted in intensity when the conditions are right. It is something to ponder along with the thoughts of Hawaii seeing more tropical systems. More heat energy is nothing to mess with. Many folks do not understand the world of difference between a Cat 1 and a Cat 3 storm. Nearly every quote that I have seen from someone that chose to ride out a Cat 3 was “Never again”. More storms for the islands means huge impacts to the local economy if even a few of those storms strengthen to major status in a given season.
LikeLike
robertscribbler
/ August 7, 2014This model forecast does put them in the firing line.
LikeLike
Peter
/ August 7, 2014A new acronym we’ll be seeing a lot of:
WNSTB
We’ve Never Seen This Before
LikeLike
robertscribbler
/ August 7, 2014That’s a good one.
LikeLike
seemorerocks
/ August 8, 2014Missing from New Zealand’s Ski Slopes This Season? Snow!
http://robinwestenra.blogspot.co.nz/2014/08/a-winter-without-snow-in-new-zealand.html
LikeLike