
According to NOAA’s Climate Prediction Center, July of 2014 was the 4th hottest in the 135 year global temperature record. Land surface temperatures measured 10th hottest in the global record while ocean surface temperatures remained extraordinarily hot, tying July of 2009 as the hottest on record for all years on measure over the past two centuries.
Overall, land temperatures were 0.74 C above the 1950 to 1981 average and ocean surface temperatures were 0.59 C above the same average.
These new record or near record highs come after the hottest second quarter year in the global temperature record where combined land and ocean temperatures exceeded all previous global high temperatures in the measure.
Much Hotter Than Normal July
Few regions around the globe showed cooler than average temperatures during July with zones over the east-central US, in the Atlantic just south of Greenland, and off South America in the Southern Ocean as the only regions showing cooler than normal temperatures. Record warmest temperatures ranged from Scandinavia to Iceland to Northeast Siberia, from California to Alaska to the Northeast Pacific, along a broad stretch of Pacific Ocean waters east of the Philippines and New Guinea, in pools in the North and South Atlantic Oceans off the coasts of North and South America, and in spots from Australia through the Indian Ocean to South Africa.
(Land and Ocean temperature anomalies for July of 2014. Image source: NOAA’s Climate Prediction Center.)
Overall, most of the surface of the Earth featured above average to record warmest conditions, while a minority of the Earth’s surface showed average or below average temperatures.
These new global heat records were reached even as slightly cooler than average waters began to up-well in the critical Eastern Equatorial Pacific region. A powerful Kelvin Wave that initiated during late winter and spring of 2014 failed to set off a summer El Nino and finally faded out, reducing heat transfer from Pacific Ocean waters to atmosphere. Even so, the ocean to atmosphere heat dump was enough to set off two record hot months for May and June and a record hot ocean surface month for July as ocean surface waters remained extraordinarily warm across many regions.
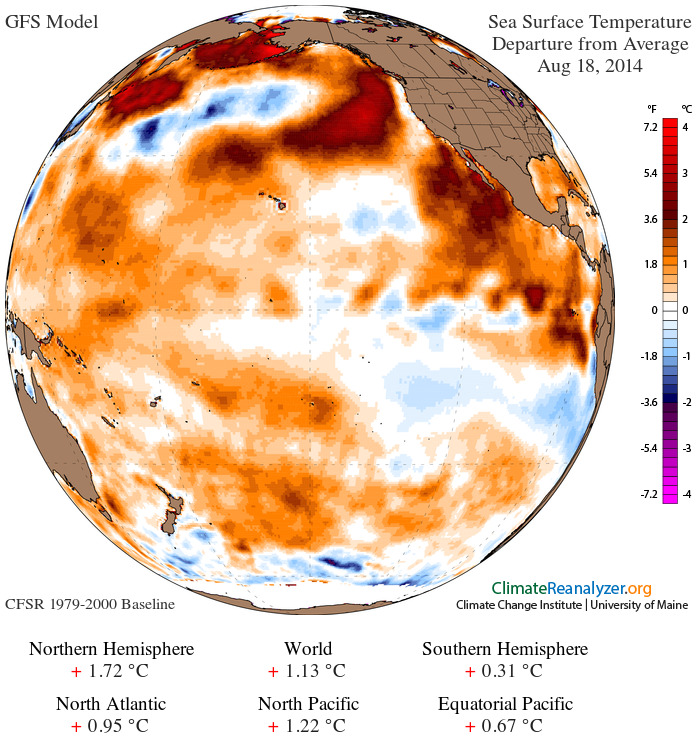
(Ocean surface temperatures remained at or near record hot levels during July and August of 2014 despite a failed El Nino development in the Equatorial Pacific. The above graphic shows global water temperatures for August 18 at an extraordinary +1.13 C above the already hotter than normal 1979 to 2000 average. Image source: University of Maine.)
New Warm Kelvin Wave Begins to Form
Though the atmosphere failed to respond to a powerful Kelvin Wave issuing across the Pacific earlier this year, stifling the development of a predicted El Nino, it appears a new warm Kelvin Wave is now beginning to form. Moderate west wind back bursts near New Guinea initiated warm water down-welling and propagation across the Pacific Ocean during July and early August. The down-welling warmth appeared to link up with warm water upwelling west of New Guinea and began a thrust across the Pacific over the past week.
As of the most recent sub-sea float analysis, anomalies in the new Kelvin Wave ranged as warm as 4-5 C above average:
(New warm Kelvin Wave forming in the Equatorial Pacific. Image source: Climate Prediction Center.)
These sub-sea temps are rather warm for an early phase Kelvin Wave and may indicate another ocean to atmosphere heat delivery is on its way, despite a broader failure of El Nino to form by this summer.
Typically, strong Kelvin Waves provide the energy necessary for El Nino to form. The heating of surface waters due to warm water upwelling in the Equatorial Pacific tends to set off atmospheric feedbacks that perpetuate an El Nino pattern in which waters remain warmer than average in the Central and Eastern Equatorial Pacific for many months. Without these atmospheric responses, El Nino cannot form.
During 2013 and 2014, strong Kelvin Waves forming during spring time were not enough to over-ride prevailing and historically strong trade wind patterns thereby allowing El Nino to emerge.
Atmospheric ‘Hiatus’ is No Halt to Global Warming
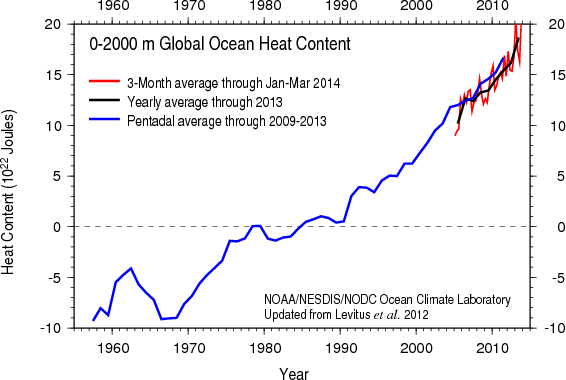
(Global ocean heat content for 0-2000 meters of depth shows inexorable upward trend despite the so-called atmospheric warming hiatus. Image source: NOAA Ocean Heat Content.)
This natural variability, which typically lasts for 20-30 years began around the year 2000 and has continued through 2014. During such periods of negative PDO, we would expect rates of atmospheric warming to cease or even to go slightly negative. Unfortunately, even though PDO has been negative for nearly 15 years, a phase which during the 1940s to 1970s drove 0.35 C of transient atmospheric cooling against an overall larger warming trend, we have still seen atmospheric warming in the range of 0.1 C per decade.
This is bad news. For as ocean heat content is spiking, the transfer from atmosphere to ocean has not been enough to even briefly cut off atmospheric warming. And at some point, the oceans will deliver a portion of their latent heat back to the atmosphere, causing an even more rapid pace of temperature increase than was seen during the 1980s through 2000s period.
In other words, we’ve bent the cycle of natural variability to the point where we see warming, albeit slower warming, during times when we should have seen atmospheric cooling. And all indicators — radiative balance measured by satellite, deep ocean water temperatures, glacial melt, and atmosphere — show ongoing and inexorable warming.
Links:
NOAA’s Climate Prediction Center
NASA: ‘Haitus’ in Global Surface Temperatures Likely Temporary


Mark from New England
/ August 18, 2014Robert,
Great article. Any guess as to when the PDO may switch to positive? Is a delay in the PDO switchover related to the difficulty this El Nino has had forming?
LikeLike
robertscribbler
/ August 18, 2014The PDO indicator flips around just as much or more than El Nino. I guess the appropriate term would be net negative.
For what it’s worth, the PDO indicator has been positive for the past six months.
LikeLike
Mark from New England
/ August 18, 2014How long must the PDO indicator be positive before it’s officially declared as switched over?
LikeLike
robertscribbler
/ August 18, 2014Usually it takes a couple of years for the full system to show effects. So a PDO of net positive for two years or more would do it. You usually get a strong El Nino before each flip (positive/negative). So that may also be an indicator to look for.
LikeLike
Mark from New England
/ August 18, 2014Thanks for the PDO information. Is it possible that this failed 2014 El Nino may ‘try’ to emerge again in 2015? Or, if it starts out as a weak El Nino this fall, could it strengthen in 2015?
LikeLike
robertscribbler
/ August 18, 2014Absolutely. Which is why we should keep an eye on this Kelvin Wave.
I think the Pacific is trying to cough up an El Nino. There’s a huge amount of ocean heat just oozing out all over the place. So there just need to be the right conditions. Probably a very hot Kelvin Wave and/or something to change the atmospheric/ocean dynamic.
You need a very hot Equatorial Pacific to generate the kind of baroclinicity you need if the North Pacific is to remain so hot.
LikeLike
Loni
/ August 18, 2014Robert, is it possible that current climate change conditions have interrupted the historical cycle of El Nino’s to the point where weather anomalies may take their place? If so, what weather events could take the place of that cycle? More Pacific storms perhaps? Lastly, all of that hot water up along Alaska down to California, (the GFS model), is that anomaly going to become the new normal? Does that heat increase show up in the models for the future?
Thanks, as always, great article. My representative in Congress is going to be in the area, and he’s getting a handful of these reports of yours.
LikeLike
robertscribbler
/ August 18, 2014These are good questions and they are tough to answer as ENSO/PDO/AMO science is still relatively new. That said, the kind of warming we’ve seen along the US west coast is considered to be a kind of El Nino precursor. That said, I’m not aware of one that has been so strong and has lasted so long.
The cycle that drives ENSO is a flux between storminess in the Western Pacific and the Eastern Pacific. This flux drives wind and ocean circulation patterns that shift water and heat east to west, west to east, like a see-saw. To drive the system permanently in one direction would take something rather extreme and I don’t think we have a precedent for making that conclusion now.
We typically see ENSO about once every two to seven years with most occuring at 3-4 year intervals. 2009-2010 was the last El Nino year. So we are in the time where we’d expect to see one.
We’ve not seen a gap between El Ninos last longer than 7 years since 1900. So if we fail to get El Nino by 2017 we might need to start looking for causes.
One thing to consider is that the human heat forcing is bound to throw the natural variability system out of whack. So we might well expect a wider range of periodicity for El Ninos as the heat drivers cause the system to swing more wildly.
LikeLike
robertscribbler
/ August 18, 2014Oh, and tell your congressman to support renewables/efficiencies/other climate change solutions/mitigation. We need it all ASAP.
LikeLike
Loni
/ August 18, 2014Thank you for your clear response. Yes, I am fortunate that my Representative Jarred of Northern California
is on the ball, but he is getting this information anyway, along with some of Sam Carana’s efforts, and the recently released 2014 update to their 2007 report, National Security and the Accelerating Risks of Climate Change, put together by 16 retired Generals and Admirals. If you have not read it, it is, as they say it is, from a military point of view, but they harp through out in the need to take action now. Keep the faith there Robert, maybe you and Sam et.al. are starting to see something moving, in no small part thanks to you folks who have been sayin’……………”this could happen!”
LikeLike
robertscribbler
/ August 18, 2014I’m an ex military Intel analyst (yes, libs/Dems do serve!). So, yeah. No prob there. My focus is on climate change as an emerging threat.
Thanks for the rec. I will take a look at the report.
–R
LikeLike
robertscribbler
/ August 18, 2014Looked through my notes and I’ve seen this report. It raises some excellent points.
LikeLike
Colorado Bob
/ August 18, 2014The risk of an exploding glacier is heating up in Iceland
Will lava soon hit glacier ice, unleashing an explosion that would spew ash and steam high in the atmosphere? The Icelandic Meteorology Office (IMO) thinks that the probability of such an event in their country has increased. Through August 16, 2014, the risk level had been at code green – a “background, non-eruptive state.” The IMO has upgraded the risk twice in the last two days, on August 17 to code yellow, and early in the day on August 18 to code orange, indicating that a “volcano shows heightened or escalating unrest with increased potential of eruption.”
http://earthsky.org/earth/the-risk-of-an-exploding-glacier-is-heating-up-in-iceland
LikeLike
Colorado Bob
/ August 18, 2014NOAA provides one of the most closely watched data sets on global temperatures. Another provider, Japan Meteorological Agency, ranked last month as the second warmest July in records going back to 1891.
Read more: http://www.smh.com.au/environment/climate-change/warm-seas-keep-world-on-track-for-a-hot-year-20140819-105m9i.html#ixzz3An4LNCKi
LikeLike
Colorado Bob
/ August 19, 2014Trapped atmospheric waves triggered more weather extremes
08/12/2014 – Weather extremes in the summer – such as the record heat wave in the United States that hit corn farmers and worsened wildfires in 2012 – have reached an exceptional number in the last ten years. Man-made global warming can explain a gradual increase in periods of severe heat, but the observed change in the magnitude and duration of some events is not so easily explained. It has been linked to a recently discovered mechanism: the trapping of giant waves in the atmosphere. A new data analysis now shows that such wave-trapping events are indeed on the rise.
https://www.pik-potsdam.de/news/press-releases/trapped-atmospheric-waves-triggered-more-weather-extremes
LikeLike
Bernard
/ August 19, 2014Looks like someone finally decided to burn some of that pesky woodland in Brazil.
LikeLike
robertscribbler
/ August 19, 2014Damn. Good eye, Bernard. That’s rather disconcerting.
LikeLike
earthfriendrick
/ August 19, 2014The specious nonsense about a hiatus has become a significant distraction. It introduces doubt and that is all that is needed to slow or even forestall action. This is especially true when parts of the US are experiencing a cooler than normal (think broken Jet Stream) summer… All that should be needed is to look at anomalous SSTs and deep ocean heat and folks should begin to panic. Thanks for keeping the focus where it needs to be!
LikeLike
robertscribbler
/ August 19, 2014Climate change denial is all about removing the urgency for action. It’s as sad as it is irresponsible.
LikeLike
Joni Grady
/ August 19, 2014Think how fast Congress would move if DC were in Phoenix instead of the middle of the cool jet stream trough!
LikeLike
robertscribbler
/ August 19, 2014Viciously amplified storm track… DC in the cross hairs if things keep going as they are.
LikeLike
Colorado Bob
/ August 19, 2014South Asia’s economy to shrink by 9 pct due to climate change: ADB
MANILA, Aug. 19 (Xinhua) — Climate change will slash up to 9 percent off the South Asian economy every year by 2100 if the world continues on its current “fossil-fuel intensive path,” the Asian Development Bank (ADB) said Tuesday.
In a groundbreaking report titled “Assessing the Costs of Climate Change and Adaptation in South Asia,” the Manila-based lender said its forecast assumes a 4.6 degree Celsius rise in global temperatures.
Given the uncertainties of climate change, ADB said there is a “slight chance” that annual losses will rise to as high as 24 percent by 2100.
http://news.xinhuanet.com/english/business/2014-08/19/c_133568004.htm
LikeLike
robertscribbler
/ August 19, 2014There’s no wealth destruction machine like climate change.
LikeLike
Andy in San Diego
/ August 19, 2014I was thinking along the same lines as Loni (from No Cal) had above. Is there a known, or
partially explored quantified value(s) for a trailing indicator of heat transfer from the ocean to
atmosphere? I am thinking of time lag, and/or heat transfer amount. Is there historical
precedence for start / stalls (perhaps this is just normal)?
Lastly, is there a known for heat loading in the ocean as related to atmospheric heat loading? Perhaps at some ratio or differential it become harder to load heat to the ocean, or it starts
welling back out. As an analogy, I think of what we are seeing in the jet stream, where a stable differential becomes distorted (just flip it 90 degrees, and make one half of that equation into Ocean).
LikeLike
Andy in San Diego
/ August 19, 2014Wow, the on screen editor sure mashed up my text.
LikeLike
robertscribbler
/ August 19, 2014WordPress is changing their format. It’s kind of a mess right now.
LikeLike
robertscribbler
/ August 19, 2014I think that would be a good series of questions for the modelers. We would need to know relative atmospheric/ocean heat balance at various times in the past and see when things changed. You could plug that information into a larger scale model and you might end up with a predictive figure.
To my knowledge, there isn’t a report that tackles the problem of indicators/prediction/ heat balance tipping points for these kinds of switches but this looks like exactly the kind of thing science should probably tackle.
LikeLike
pintada
/ August 19, 2014So, anyone ready for some good news? The good news is that economic growth at least in the US and Europe is nearly over. In fact, we could very well see a significant decrease in US emissions. This is a continuation of my “systems” diatribe begun below Roberts previous post. Everything is connected.
http://srsroccoreport.com/how-the-u-s-dollar-reserve-currency-dies-slowly-at-first-then-all-at-once/how-the-u-s-dollar-reserve-currency-dies-slowly-at-first-then-all-at-once/?utm_source=feedburner&utm_medium=email&utm_campaign=Feed%3A+SrsroccoReport+%28SRSrocco+Report%29
LikeLike
Tom
/ August 19, 2014Robert, thanks for another informative, though sad, post. Another indication of our unchanging trajectory as a species. Short term la-la land on the way out: that’s some intelligence, wisdom and/or sapience on display . . .
Pintada: thanks – that’s great stuff. Connecting the dots in the economic direction so at least people get a whiff of what’s coming.
CO Bob: good links (as usual) – I saw that one about the volcano threat and was going to post it – you beat me to it. Good job.
LikeLike
robertscribbler
/ August 19, 2014The ‘article’ shows the rich getting richer, the poor getting poorer and somehow this is supposedly good news?
In any case, the US debt crisis is far less dire than it was six years ago. This is basically a non sequitur, as percent GDP debt levels in the US are falling even as US manufacturing continues to make gains (not typical for post recession US). From an economic standpoint, the US/Europe are actually looking pretty amazingly strong at the moment.
Overall, growth is probably going to continue, but remain slow, under current policy positions, for some years to come. Prospects for wage earners will be more constrained primarily due to conservative meddling in the larger policy picture, but far better than during the 2008 timeframe (Pre Obama).
There remains a great potential for the US to continue to gain economic ground and preserve prosperity/reduce income inequality so long as renewables continue to advance at a high rate of adoption, and so long as climate change is properly mitigated. The primary threat to any wealth structure, long term, at this point is climate change, with fossil fuel reliance/inexpensive fossil energy scarcity also providing some resistance.
Growth in economic innovation and efficient use of energy and materials is a good way to support economies long term. Reduction in population and materials consumption is a positive innovation to this kind of ‘growth’ structure where economic growth is based more on improving practices and progress than optimization for exploitation.
In general, the article recycles old memes that really aren’t related to what’s happening now. Even more oddly, a celebration of the notion of a widening gap between the rich and the poor is entirely counter-productive.
LikeLike
Ken Barrows
/ August 20, 2014It is said the debt crisis is less dire, but I am not so sure.
http://research.stlouisfed.org/fred2/series/TCMDO
LikeLike
robertscribbler
/ August 20, 2014Looks like the 2012 report I was referencing is now quite dated.
Seems the most recent CBO report agrees with you:
http://www.cbo.gov/publication/45471
Same choices our political system has trouble making — raise revenues (church of republicans freak out every time this comes up) cut spending (which, if you do it the way the republicans want, keeps tearing the social fabric and makes most people more poor), or both (which could probably be done in a way that wasn’t too damaging if republicans weren’t involved).
We need to find a way to manage this without making the rich richer and the poor, poorer. Otherwise, the high levels of instability and unrest we already see grow worse.
LikeLike
RWood
/ August 19, 2014Another transform of ecological science is standing:
http://motherboard.vice.com/en_ca/read/to-hack-or-not-to-hack-the-planet
I would be interested in descrying the engineers.
LikeLike
robertscribbler
/ August 19, 2014Bad news five ways til Friday. In this case, every day of the working week’s a mad Monday.
The focus will probably be on RF management through aerosol injection, as that’s the cheapest option. And you do get temporary cooling that can be maintained by continuously injecting aerosols into the atmosphere. But there are some rather severe negative consequences including loss of stratospheric ozone (if you use sulfur dioxide) and likely unpredictable weather changes. Eventually, from the point of view of reducing warming, you hit diminishing returns. For example, aerosols only work when the sun is shining, so you get cooler days and summers, but warmer winters and nights. At some point the balance tips back to warming as the practical aerosol reduction level is saturated.
In addition, you need the more expensive atmospheric carbon capture technologies to deal with the larger problem of greenhouse gas accumulation. Unless atmospheric carbon levels fall, you still have the problem of ocean acidification and chemistry changes to deal with, even if you somehow manage to maintain an aerosol shield that reduces warming indefinitely (not likely). The scale would have to be quite extensive and though I support atmospheric carbon capture, it would likely not be possible to get where we need to be without also having large-scale mitigation.
Without mitigation and atmospheric carbon capture, you’re simply kicking the can down the road with RF management. In doing so, you can rapidly end up with a situation where the atmospheric carbon burden is 600 CO2e by mid century and 1000 CO2e by end century. That’s not a situation you can rationally control through RF management alone and even if you could, the ocean situation is now very dire, indeed.
The fossil fuel companies will probably try to claim that RF management is enough. This messaging falls directly in line with their short term thinking/near term profits mindset. The net effect of such a policy would be more carbon emissions and, likely, more warming long term.
Finally, it’s worth noting that the Permian mass extinction event included a very strong aerosol injection via the flood basalt eruptions of the time. And though these additional aerosols did result in temporary and transient cooling, the larger greenhouse gas forcing eventually overwhelmed the aerosol cooling mechanism. It’s also likely that the very large climate swings between hot and cold as the push-pull between aerosols and ghg balanced out was one of the primary extinction mechanisms during the Permian. So we have to ask ourselves, do we really want to simulate these conditions?
As I mentioned above, atmospheric carbon capture will probably be needed. But I am very dubious RE the prospects for aerosol RF management without begging even more tragedy than we’ve already set ourselves up for.
LikeLike
Bernard
/ August 20, 2014Firstly, they deal with the symptoms, not the cause.
Secondly: scale. We actually have lots of experience with geo-engineering. Every event where you increase the concentration of a human-made compound so that it becomes relevant on a planetary scale is geo-engineering. Whether it’s intended is irrelevant. Plastic in the oceans, destruction of ozone by atomic halogens, background radiation, …, and of course CO2.
The first thing they teach us is that such manipulations require vast resources, dedication and a distributed approach. The second lesson is that they have to be profit-driven. But even under those circumstances it takes decades. Even if the majority of the population lends a hand.
CO2 is actually a brilliant one. It requires minimum effort to produce it and the process produces side-effects that can be turned into a profit. It’s also an extremely simple and stable molecule.
Now reverse this thought process. Take one of these proposed geo-engineering solutions and check the following:
– is the compound easy to produce or does it require an intricate chemical process?
– What’s the bottleneck – is there a scarce element involved in the process?
– is it a net-cost or a net-profit to produce?
– can it be distributed easily among the population or will it be released in a limited number of places?
– is it a net-cost or a net-profit to distribute?
– How many decades does it take?
They all break on at least one of these checks.
LikeLike
robertscribbler
/ August 20, 2014They all generate additional costs. The least expensive involves aerosol seeding if the stratosphere, which is probably a 10-50 billion per year expense. You might get a less expensive result through local aerosol/rf. But the end effect is less certain.
I see rf management as a stop gap that will almost certainly have some major negative consequences and result in further delays transitioning away from ghg emissions. Rf management may be worthwhile as part of a larger climate policy that included rapid emissions cessation. But by itself it is likely to do more harm than good, as it provides political cover to further delay action on emissions.
Atmospheric capture is more expensive but probably more useful. The low hanging fruit in this regard would be equipping CCS to all biomass plants which would instantly make them carbon negative.
LikeLike
Mark from New England
/ August 19, 2014Robert,
I recently came across an article somewhere by a physicist (not a climate scientist), who maintains that because solar activity has been low and could remain so for some time, that that may offset most of the atmospheric warming we have in the pipeline for a few decades.
I seriously doubt that is the case, and I seem to recall that in a previous post a few months ago you went through the various forcing trends and how even if solar heat output were to decline a bit (within historical norms), that the human GHG forcing is so much greater that the sun effectively no longer matters in terms of the warming we’re likely to experience this century. If it’s not too difficult, could you provide a link or give a short recap of this situation. Thanks much Robert!
LikeLike
robertscribbler
/ August 19, 2014Here are the various radiative forcing variables given by the IPCC:
You’ll note how small the overall solar rf is.
Here is the solar RF variability due to the solar cycle in watts per meter squared:
You’ll note that the variation between peak and trough is about 1.3 watts per meter squared. With a maximum negative variation from average of about -0.65 watts per meter squared.
So if the sun went through an unprecedented phase of very low activity (with some variation), the negative RF would probably be in the range of 0.5 watts per meter squared during a weakest possible solar period.
Given that the current positive forcing for human ghg is now in excess of 2.23 watts per meter squared (taking into account aerosols) and that we accumulate, under current emissions about 0.3 to 0.5 watts per meter squared of additional forcing each decade, we’d have to have solar activity hit lowest possible levels and maintain there for more than a decade to make up for 10-15 years of human ghg emissions.
This kind of grand minimum is possible, but that’s the maximum possible effect.
Based on sunspot observations, the current cycle is somewhat weaker than normal, but nothing like a grand minimum:
http://en.wikipedia.org/wiki/Solar_cycle_24#mediaviewer/File:Solar_cycle_24_sunspot_number_progression_and_prediction.
We might get a -0.1 watt per meter squared forcing if this slightly lower level keeps up for some time. But given the scale of the broader human forcing, the effect is most likely to be marginal even in the most extreme instances of low solar activity (which we’re not seeing now).
So either this physicist doesn’t know what they’re talking about, or they’ve been reading too much Judith Curry/Anthony Watts/Faux News etc.
LikeLike
Mark from New England
/ August 19, 2014Thanks for that explanation Robert.
LikeLike
Mark from New England
/ August 19, 2014George Marshall’s new book, “Don’t Even Think About It – Why our Brains are Wired to Ignore Climate Change”, is now available. I just finished it and will be writing a review for Amazon by the end of the week, which I’ll link to in this blog.
It’s very good, and I highly recommend it to anyone communicating about AGW and climate change. He’s a very good writer, and its an entertaining and illuminating read. One of his more counterintuitive recommendations is that global warming should NOT be framed as primarily an ‘Environmental’ issue, and he suggests we stop talking about polar bears! But there’s a lot of meat in it, tempeh for vegetarians 😉 which I’ll describe in my longer review.
Here’s the Amazon link, though it should also be available at Powell’s and elsewhere.
LikeLike
robertscribbler
/ August 19, 2014Thanks for this, Mark. I’m looking forward to taking a crack at it.
LikeLike
Colorado Bob
/ August 19, 2014DROUGHTS AND PRODUCTIVITY
The 2006 drought resulted in Australia’s agricultural GDP falling by nearly 30 percent, according to government data, and the country’s weather bureau is forecasting that such events will become harsher and more frequent.
The drought in Queensland alone last year meant farmers in the state recorded their lowest income on record, with the average farmer making a loss of A$77,000, according to government data.
With more than 80 percent of Queensland declared by the state government to be in drought, the outlook for the state’s agricultural producers looks bleak.
The dry weather means that the current wheat harvest for the 2014/15 crop year in Queensland is seen falling to 1.33 million tonnes, the Australian Bureau of Agriculture and Resource Economics and Sciences (ABARES) said in June, 12 percent below the five-year average. And analysts say that figure could fall even more with dry weather seen continuing until October at least.
Cattle farmers in the state, Australia’s largest livestock producing region, are also struggling. Unable to find enough food or water for their animals, farmers have been forced to slaughter their livestock at record levels, pushing prices to all-time lows earlier in the year.
Link
LikeLike
robertscribbler
/ August 19, 2014Wow that is one hell of a report.
LikeLike
John Christian Lønningdal
/ August 20, 2014And still people vote for Tony Abbott, a bonafide climate denier…
LikeLike
Colorado Bob
/ August 19, 2014Jet Stream Changes Driving Extreme Weather Linked Again To Global Warming, Arctic Ice Loss
by Joe Romm Posted on August 19, 2014 at 4:50 pm
Link
LikeLike
robertscribbler
/ August 19, 2014Surprise, surprise.
LikeLike
robertscribbler
/ August 19, 2014Well done Joe, PIK. Looks like the Jet has been mangled since at least 2004.
LikeLike
markus
/ August 20, 2014About the time hadsst3 nh started oscillating http://www.woodfortrees.org/plot/hadsst3nh/from:1960
LikeLike
robertscribbler
/ August 20, 2014I’ve got global sst anom at +1.20 C for today. With no El Nino, that’s a very strong positive surface temp anomaly.
Arctic warming/snow/sea ice link appears pretty strong. 2005 was the first big drop.
LikeLike
Andy in San Diego
/ August 20, 2014Earth Overshoot Day is today.
Today is the day we have used all of 2014’s production of resources from planet Earth. Earth overshoot day moves 3 days earlier each year.
http://www.foreignaffairs.com/articles/141916/carter-roberts/on-borrowed-time
LikeLike
Andy in San Diego
/ August 20, 2014The authors are here.
http://www.footprintnetwork.org/en/index.php/GFN/page/earth_overshoot_day/
Amazingly, I have read in the comments of several articles on this….you guessed it ….. “overuse of resource deniers”.
LikeLike
seemorerocks
/ August 20, 2014It is not often that I get the chance to stop recording the catastrophic changes in weather and climate and get a chance to sit down and reflect on it.
In this regard I wish to record my gratitude for the stirling job you are doing in keeping people informed. My ownly wish is that you had a wider audience.
The following video of Prof Peter Wadhams discussing geoengineering ,came my way
He confirmed something that I had heard from other quarters that seems to place some doubt on the contention that if by some miracle (given the political reality) we were able to reduce carbong levels from their present 400+ ppm that this would help to save us from the effects of catastrophic climate change.
Specifically, he says (if I am reflecting him correctly) that recent research indicates that historical releases of greenhouse gasses condemn earth to a 2C increase in temperature on top of what we have today. We have yet to see the effects of recent or current releases of greenhouse gasses (the 400 ppm we have now).
This implies that we are to see further increases in temperature whatever we do.
That seems to imply that unless we find a way of taking carbon out of the atmosphere and use the risky method of geoengineering (which he calls a ‘sticky tape’), we are (if I can use such an indelicate term), f…ked.
I am a layman, and in no sense, a scientist.
Can anyone tell me that I am wrong about this?
LikeLike
Alexander Ač
/ August 20, 2014No, it it probably correct, though the “warming in the pipeline” due to 482 ppm CO2e (or 400 ppm CO2) is anywhere in the range from 0.5 – 2.5 °C (approximatelly, there are more studies on this) in the short-term (i.e. decades). Of course, we DONT KNOW, if crossing 2°C is dangerous/runaway etc., and by the way, its irrelevant – people are dying of climate change already today.
Alex
LikeLike
John Christian Lønningdal
/ August 20, 2014This is correct, but is also heavily influenced by the amount of aerosols we manage to pump into the atmosphere also these coming years. If the active volcano on Iceland erupts in the middle of this, it will also reduce the warming at least for a couple of years.
Its a classic denier meme these days that CO2 has gone up so fast these past decades, so why not the temperature (the hiatus game). While deniers fail to see that over 90% of the warming goes into the oceans and the correct weather systems must be in place for much of this heat to leave the oceans into the atmosphere. The oceans are in fact the big battery that creates this lag in the effect of CO2. The current CO2 levels are now busy re-radiating much more energy back into the oceans, which will come back and haunt us in 20 years time.
LikeLike
dtlange
/ August 20, 2014This is an interesting bit from RT about atmospheric plankton in space — a symptom of ocean warming and moisture transference? Or old news?
‘Life in space? Sea plankton discovered attached to ISS outer hull.
Russian scientists say they made a “unique” discovery while analyzing samples from the exterior of the International Space Station – traces of tiny sea creatures on the station’s windows and walls. It remains unclear how marine plankton ended up in space.
“[Plankton in] such phases of development is found on the surface of the ocean. It isn’t characteristic to Baikonur,” he explained, referring to Baikonur Cosmodrome in Kazakhstan from where crew and cargo deliveries to ISS are launched.
“It turns out that there are some rising air currents, which settle on the surface of the station”.
http://rt.com/news/181472-iss-marine-plankton-space/
The photo used does add some perspective and scale to the concept.
(And now I am reminded of the Michael Crichton’s “Andromeda Strain”, book and movie were good thrillers.)
LikeLike
John Christian Lønningdal
/ August 20, 2014A lot of life on earth can survive space travel.
“…they can withstand the extremely low pressure of a vacuum and also very high pressures, more than 1,200 times atmospheric pressure. Tardigrades can survive the vacuum of open space and solar radiation combined for at least 10 days.[28] Some species can also withstand pressure of 6,000 atmospheres, which is nearly six times the pressure of water in the deepest ocean trench, the Mariana trench.”
http://en.wikipedia.org/wiki/Tardigrade
Amazing creatures… and they survived all previous mass extinctions.
LikeLike
Andy in San Diego
/ August 20, 2014When I was a kid I thought that using blue green aerosol plankton, Venus could be terraformed by breaking down the greenhouse trap. Yup, kids can be simple.
LikeLike
dtlange
/ August 20, 2014And an imaginative thinker.
LikeLike
robertscribbler
/ August 20, 2014I like the way kids think.
LikeLike
Colt
/ August 20, 2014I don’t see any way that we avoid extinction level temperature rise with all the feedback loops we are creating.
LikeLike
Brian
/ August 25, 2014Hi Robert,
I was wondering if you had any information on changes in arctic ocean temperatures over
the period of the last 40 years. I’ve just seen a study that says the arctic ocean has been cooling slightly over that time and I don’t know what to make of it. Sounds like denier crap to
me but I just don’t know
If you see this, thanks in advance.
LikeLike
robertscribbler
/ August 25, 2014Complete bunk. We’ve seen SSTs increase by about 0.8 C to 1 C for that time-frame. Air temps have increased by about 3 C over the same period.
LikeLike
Brian
/ August 26, 2014Thanks Robert,
The person who was trying to push this on me mixed up SST in the arctic with measurements of temperature in the troposphere. The article is paywalled but he
pulls up Abstracts from denier blogs and ritualistically presents them as proof there is no AGW.
Usually the details are cherry-picked or misrepresented but this one looked legit. Even if so,
it never fails to amaze me how they can pick one study out of the thousands and throw it in your face as if it disproves everything else and then gloat about how clever they think they are. Comical but sad.
Here is the Abstract:
http://www.nature.com/nature/journal/v361/n6410/abs/361335a0.html
LikeLike
robertscribbler
/ August 27, 2014I find the cherry-picking is not just limited to climate change but also includes related topics like the effectiveness of renewable energy sources and related policy driven measures. The effort appears to be aimed at the prevention of large scale awareness and response on all levels. But, yes, the chicanery and charlatan ism is rampant.
LikeLike