
Large 4-9 Foot Waves break on the Outer Banks as another nor’easter is predicted to form. The nor’easter is likely to bring gale force winds and heavy rain to the Outer Banks this weekend.
All posts tagged Ocean warming
OBX Wave Report February 8 — A Big Swell With Another Nor’easter on the Way

Posted by robertscribbler on February 8, 2023
https://robertscribbler.wordpress.com/2023/02/08/obx-wave-report-february-8-a-big-swell-with-another-noreaster-on-the-way/
OBX Wave Report February 3 — 2-3 Foot as Cold Blast Moves In
Strong northwest winds are blowing across the Outer Banks behind a cold front sweeping through. Waves in the range of 2-3 foot likely to be chopped up by northwest winds. Rain moving out and chill moving in for tonight and tomorrow. Big Warm up likely for next week. Larger weather and climate discussion of extreme cold for the northeast to be followed by a shift to much warmer than normal temperatures by Monday and Tuesday and moving on into next week.
Share this:
Posted by robertscribbler on February 3, 2023
https://robertscribbler.wordpress.com/2023/02/03/obx-wave-report-february-3-2-3-foot-as-cold-blast-moves-in/
Why are So Many Powerful Nor’Easters Striking New England?
A major nor’easter is pummeling states from New York through Maine today with heavy snow, near hurricane force winds, and high surf. The storm is expected to dump 1-2 feet of snow over this region even as it pounds coastlines that have already been raked by two other major storms during the past two weeks.
It would be relatively unusual to see one storm of such intensity striking this region during any given March. But as the third in a two-week-long parade of extreme events, the presently intense storm pattern is starting to look more than a little outlandish.
So what the heck is going on? In a couple handfuls of words — influences related to human-caused climate change are spiking East Coast storm intensity while setting in place a general pattern that causes these storms to repeatedly fire.
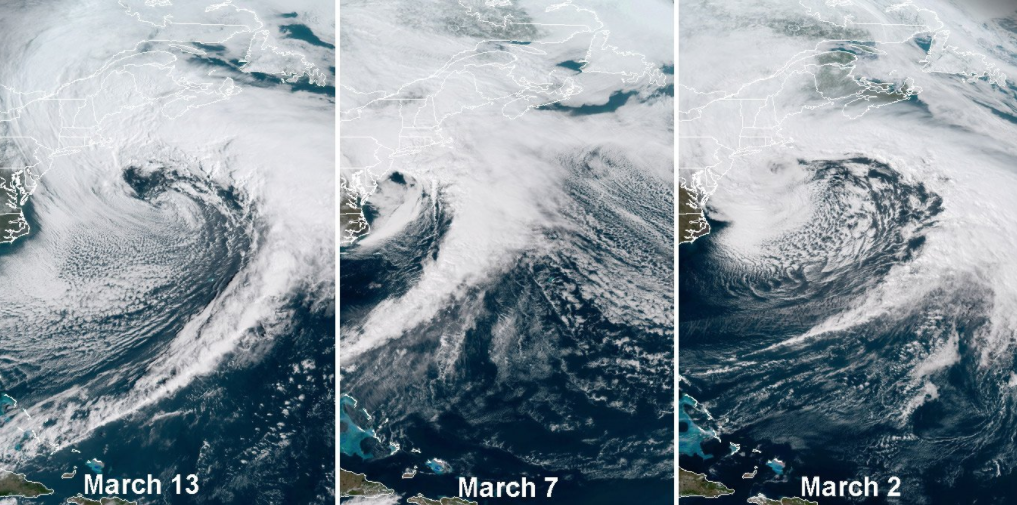
(Over the past 11 days, three major nor’easters have struck the U.S. East Coast. Why have these storms been both so strong and such a persistent feature? Image source: RAMMB/CIRA. H/T to Chris Dolce.)
The Most Recent of Three Powerful Nor’Easters
Presently, the most recent strong storm has an intensity of 970 mb and features winds gusting to hurricane force just off-shore with gusts of up to 69 mph along the coast. Pressures are expected to drop into the upper 960s — making it about as powerful as the system that produced major flooding in parts of New England on March 2nd.
For reference, storm intensity measured by pressure in the range of 970 mb is about as strong as a category 2 hurricane. This is a rough comparison as hurricanes tend to be more intensely concentrated even as nor’easters tend to have broader if more diffuse impacts. But it’s a marker for the high level of atmospheric energy the system is now pumping out and how potentially damaging it could ultimately become.
The storm is thus strong enough to produce record and historic impacts. This is notable enough by itself. But the fact that we have had three systems of similar strength in just 11 days over what is practically the same region is concerning.
(Global warming fuels increased convection as lands waters pump out more heat and moisture. At times, this can result in some unexpected instances of atmospheric pyrotechnics.)
Specifically, on March 7 a 989 mb system raked the same region with gale force winds and instances of intense thundersnow (see above tweet by NOAA). And on March 2nd, a sprawling storm that dipped to around 975 mb generated massive waves and significant coastal flooding.
Atmospheric Train Wreck
Looking for causes, we need to go all the way back to February. At that time, a big polar warming event was taking place. In the upper levels of the atmosphere over the pole, the stratosphere was warming up. But at the same time, surface temperatures at the pole were rising to above freezing. In some locations near Northern Greenland, readings were pushing as high as 63 F above average.
High amplitude Jet Stream waves were eating away at the typically faster polar circulation patterns even as they were helping to inject much warmer than normal air into the Arctic and pull its resident cold air out. Eventually, all this heat running into the various layers of the Arctic atmosphere drove the polar vortex to collapse. This, in turn, resulted in cold Arctic air being ejected south and west into Europe. This massive jet stream dip, in eddy-like fashion produced a large, countervailing high pressure ridge over Greenland.
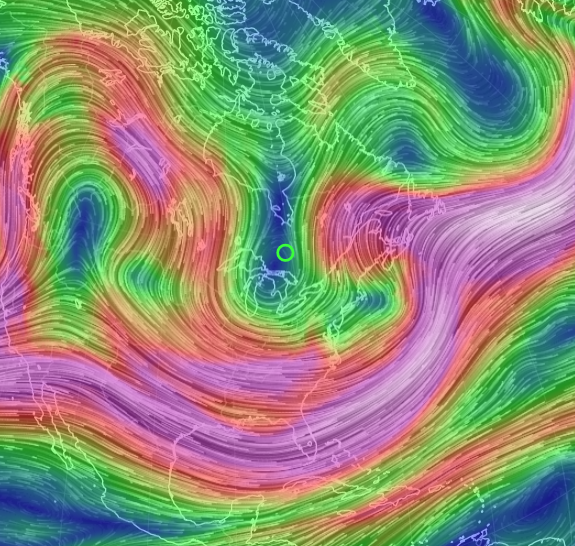
(A deep trough that has consistently lingered over the U.S. East Coast and helped to spawn storm after powerful storm, was initially generated by a very intense polar warming event linked to human-caused climate change. Image source: Earth Nullschool.)
The rippling upper level jumble of winds backed all the way to the U.S. East Coast — forming a deep and persistent trough. The trough funneled numerous disturbances slowly through the region. And it was both the trough’s persistence and depth that enabled strong storms to form repeatedly even as they set off such long-lasting and intense impacts (see Dr Jennifer Francis’s related work on how polar amplification impacts the Jet Stream here).
Much Warmer than Normal Ocean Waters
Though polar amplification — which is another term for how global warming spurs the poles to heat up faster than the rest of the world — helped to generate the upper level features in the atmosphere that would consistently generate storms running across the U.S. East Coast, widespread warmer than normal ocean waters helped to give these storms more fuel.
In the Gulf of Mexico, sea surface temperatures have consistently ranged between 0.5 and 3 C above normal since February. These warm ocean waters contributed to severe floods over the Ohio River Valley at that time by pumping record levels of atmospheric moisture into the storms running south.
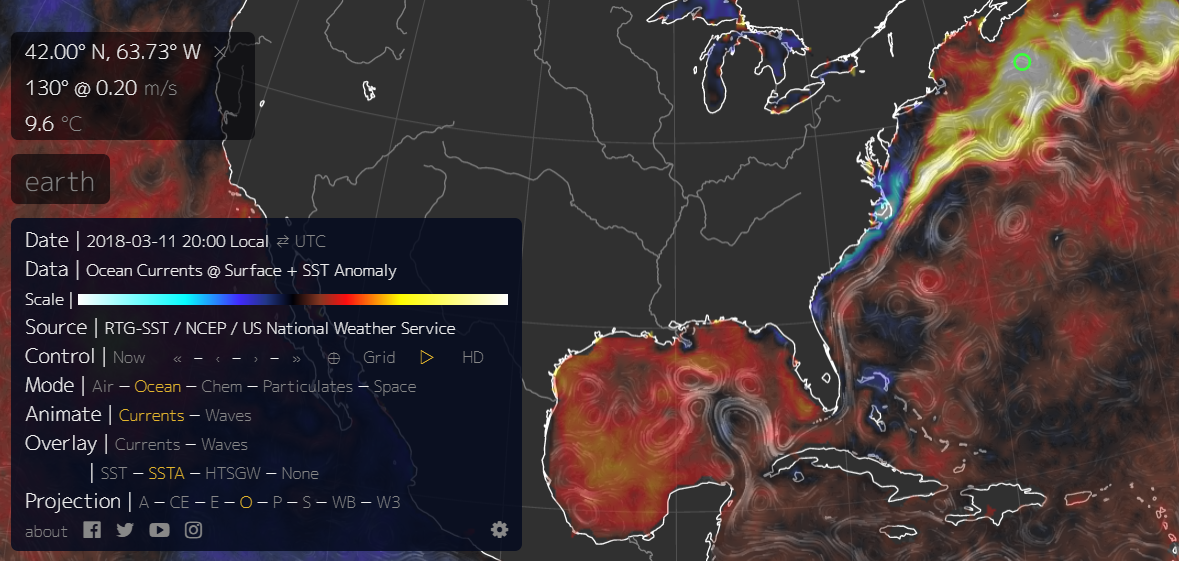
(Much warmer than normal sea surface temperatures dominate throughout the Gulf of Mexico and just off the U.S. East Coast. These warmer than normal waters — warmed by climate change — are providing fuel for the powerful nor’easters of recent weeks. Image source: Earth Nullschool.)
As the Jet Stream dip became more oriented toward the East Coast during March, storms that would ultimately blow up over the Atlantic at first got a big plug of moisture from the extra evaporation flowing off that warmer than normal Gulf. But it was over the Atlantic Ocean that the storms would really start to fire. There, ocean temperatures were ranging between 0.5 and as high as 9 C above normal over parts of the Gulf Stream.
Such very warm sea surfaces provide a lot of fuel in the form of moisture and related convection. And, in particular, we saw some rather amazing instances of convective lift during the recent March 2nd and 7th storms as they tapped that incredible Atlantic Ocean heat and moisture.
Conditions in Context
So to sum up, an extreme polar warming event driven in large part by human-caused climate change set up conditions that generated a persistent trough over the U.S. East Coast. This trough was both deep and long-lasting. As low pressure systems moved into the trough zone, they were able to tap abnormal levels of heat and moisture rising off of the Gulf of Mexico and Atlantic Ocean near the coast in order to bloom to abnormally powerful intensity. Both of these factors — Arctic warming and warmer than normal sea surface temperatures — would not have been as acute or intense without the extra push to the climate system that human forced warming provides. As a result, we are seeing a very strong climate change related signal in the present severe storm pattern.
(UPDATES TO FOLLOW)
Share this:

Posted by robertscribbler on March 13, 2018
https://robertscribbler.wordpress.com/2018/03/13/why-are-so-many-powerful-noreasters-striking-new-england/
2018 to see Third Consecutive Mass Coral Bleaching Event for the Great Barrier Reef?
One point two degrees Celsius hotter than average (1.2 C). That’s the temperature threshold where 50 percent of the world’s corals are likely to die off according to a scientific study written in Nature during 2013.
The El Nino year 2016 was about 1.2 C hotter than 1880s averages. Meanwhile 2017 was about 1.1 C warmer than normal despite a shift toward La Nina.
We are thus entering a very harmful period for the world’s corals. One in which corals are bleaching and dying off at unprecedented rates. The global bleaching event of 2014 through 2017 was the longest lasting and most damaging in the historical record. Many reefs around the world suffered severe losses. Reefs that had never bleached before experienced bleaching and mortality. And this event included severe damage to the majestic Great Barrier Reef of Australia.
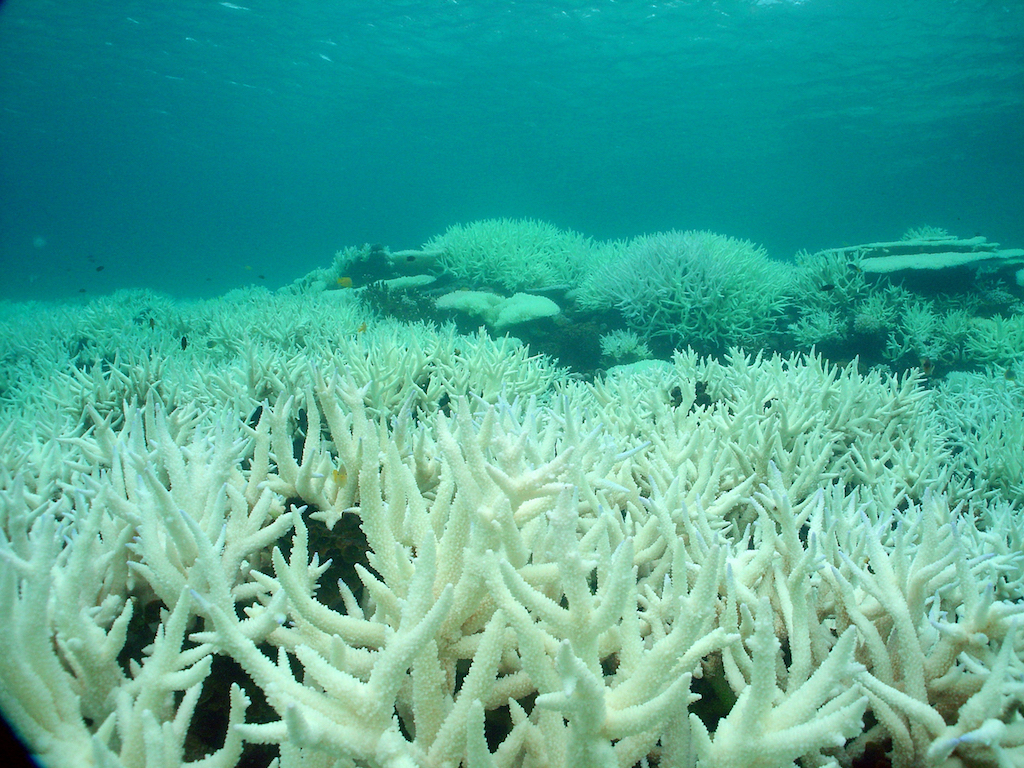
Bleached Staghorn corals on Keppel Island Reef during 2016 event that impacted 93 percent of the Great Barrier Reef. Image source: UNESCO.
Unfortunately, despite an official end to the 2014 to 2017 global bleaching event, ocean temperatures across widespread regions remain at thresholds that are likely to result in stress to corals. And it is arguable that if bleaching were so widespread as it is now in past decades, then the present 2018 period would still be considered a global bleaching event.
Regardless of how we parse official declarations, reef systems are obviously still under stress. Just this past week, reports were coming in that sections of the Great Barrier Reef were bleaching for the third year in a row. The bleaching was rather widespread for this time of year. It was occurring earlier than normal — generating concern that 2018 bleaching could be worse than expected come February and March. It was hoped that the large reef system would be given a bit of respite from the heat. But now that particular hope is in doubt.
Corals around the world are still under threat from extreme ocean heat despite the fact that the 2014-2017 global coral bleaching event was officially ended during summer of 2017. Image source: NOAA.
Corals are one of the many canaries in the climate change coal mine. These organisms are a vital aspect of global ocean health and the reefs they build are the present home for upwards of 2 million species. Humans depend on corals for the food chains they support and for the natural beauty they provide. And a global ocean with less corals provides both less food and support for human beings and for ocean life as a whole.
Because corals are so sensitive to temperature change, it is expected that about 90 percent of the world’s corals will be lost if the Earth warms by 1.5 C. Meanwhile, virtually all of the corals (more than 95 percent) could be gone if the world warms by 2 C. With global temperatures at around the 1.1 C threshold and rising, we are in the danger range for corals at this time. And the world stands at the brink of losing the majority of this vital species with the potential to see 90 percent or more of the world’s corals lost over the next 3 decades under various scenarios in which fossil fuel burning continues.
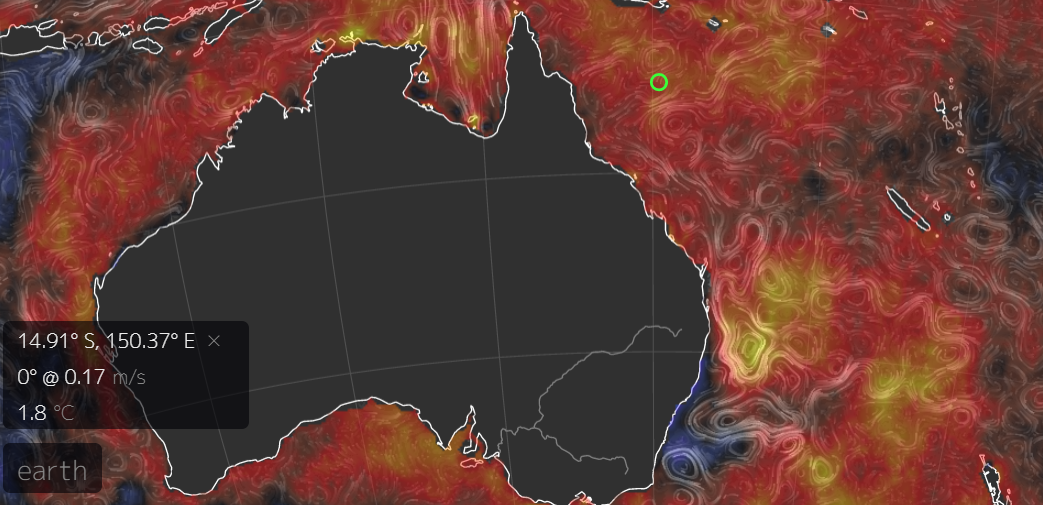
Warmer than normal sea surface temperatures are again threatening Australia’s Great Barrier Reef (GBR). Jan 15, 2018 sea surface temperature anomaly image provided by Earth Nullschool.
Danger to corals is, today, a very immediate issue. And we are in the period of risk and damage now. This reality is highlighted by the fact that what should be a relative respite period for corals is still seeing abnormally high levels of bleaching.
During 2018, La Nina in the Eastern Pacific has generated relatively cooler surface waters in a number of locations. And we would normally expect La Nina to beat back global coral bleaching severity. However, an anomalous hot blob of ocean water between Australia and New Zealand is causing an unusual spike in ocean temperatures for the zone east of Australia (see image above). The result is that the GBR is again at risk.
Early bleaching for the Great Barrier Reef in 2018 is definitely a bad sign. However, scientists aren’t yet stating that this year will see bleaching intensity hitting levels similar to 2016 and 2017. Let’s hope that remains the case. But so long as fossil fuel burning and related warming continues, the road ahead for corals is one of existential crisis.
Share this:

Posted by robertscribbler on January 22, 2018
https://robertscribbler.wordpress.com/2018/01/22/2018-to-see-third-consecutive-mass-coral-bleaching-event-for-the-great-barrier-reef/
The Oceans are Warming Faster than Previously Thought; Rate of Heat Build-up Accelerating
So we keep hearing this phrase in the sciences — faster than we thought. In the context of global warming, it’s not a phrase we want to hear. And when the world’s largest heat sink — the oceans — are warming up faster than we thought, that’s kind of a big deal.
******
According to new research published today in Science Advances, the world’s oceans are warming up at an overall rate that is 13% faster than previously thought. Study authors used a new methodology to gain a more refined picture of overall ocean warming. And the results were unfortunately stark. For in addition to the oceans having gained more heat, the study also found that the rate of ocean warming is accelerating.
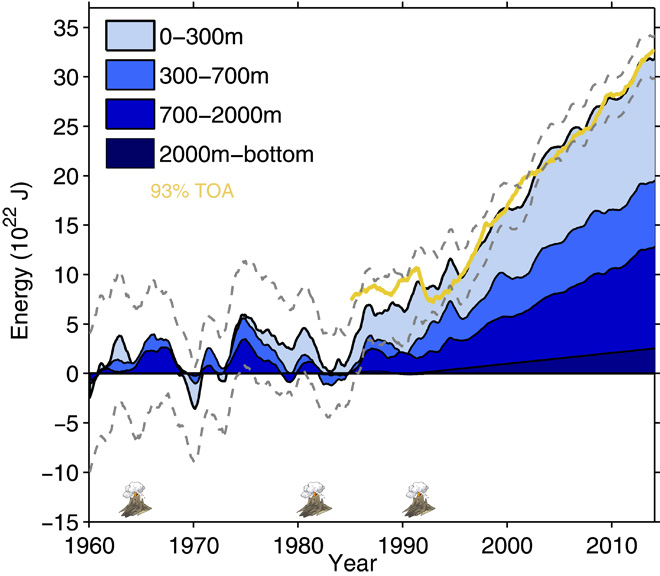
(Total ocean heat gain in the top 2000 meters as found in Improved estimates of ocean heat content from 1960 to 2015.)
This increased rate of warming is rather concerning — especially when you consider the fact that about 90 percent of the total extra heat absorbed by carbon dioxide and other greenhouse gasses produced primarily by fossil fuel burning ends up in the world’s oceans. For this reason, ocean heat gain is probably a better determiner of overall global warming than atmospheric heat gain. And, as a result, what we’re looking at is a world that’s surprising us with the rate at which it is responding to the insults of human fossil fuel emissions.
Serious Systemic Impacts From Ocean Warming
Of course, heat in the oceans produces numerous added impacts to the Earth System. As we’ve seen in Antarctica and Greenland, that heat gain has caused a number of the world’s largest ice shelves and glaciers to start melting from below — increasing concerns about the future rate of global sea level rise. The accelerating heat gain in the world’s oceans is absolutely the primary driver of the ongoing global coral bleaching event that has continued uninterrupted since 2014. More ocean heat means less oxygen — which increases the extent of ocean dead zones. And various sea creatures from starfish to mollusks to walruses to puffins have all seen habitat loss and/or loss of key food sources due to ongoing warming.
Extra ocean heat also both reduces the ability of the ocean to absorb CO2 even as it puts stress on various carbon stores — increasing the risk that a carbon feedback response from the Earth System will emerge to further worsen the rate of global warming.
(This year’s global coral bleaching event is starting to kick into high gear. Famous reefs such as the Great Barrier Reef are now threatened. But coral bleaching is just one of many harmful impacts that result from ocean warming. Image source: Coral Reef Watch.)
Finally, warmer oceans can help to push hydrological events such as instances of heavy rainfall and severe drought to greater extremes. A press release by the study’s authors noted:
…we know the oceans are much warmer now and they contain the memory of climate change. Higher sea surface temperatures are continually reinforced by the extra heat beneath the ocean surface. The oceans are affecting weather and climate through more intense rains. This process is a major reason why 2016 was the hottest year ever recorded at the Earth’s surface, beating out 2015 which was the previous record. Additionally 2015 was a year with record hurricanes, heat waves, droughts, and wild-fires around the world.
Conditions in Context — We Need Rapid Reductions in Greenhouse Gas Emissions Now
Ultimately what this accelerating and higher than expected ocean heat gain means is that we have less time. Less time to achieve a necessary reduction of emissions before various harmful and catastrophic effects from climate change get locked in. Less time to continue coddling a harmful fossil fuel industry, as the Trump Administration has determined to do. And less time to plan to help the populations of people that will inevitably be harmed by the warming that these vastly irresponsible political and economic powers have so far blocked us from preventing.
Links:
Improved Estimates of Ocean Heat Content From 1960 to 2015
Earth’s oceans are warming 13% faster than thought
Hat tip to Jeremy in Wales
Share this:

Posted by robertscribbler on March 10, 2017
https://robertscribbler.wordpress.com/2017/03/10/the-oceans-are-warming-faster-than-previously-though-rate-of-heat-build-up-is-accelerating/
Abnormal Antarctic Heat, Surface Melt, Giant Cracks in Ice Shelves — More Troubling Signs of a World Tipping Toward Climate Chaos
Around its edge zone, and from glacier top to ice shelf bottom, Antarctica is melting. Above-freezing surface temperatures during the austral summer of 2016-2017 have resulted in the formation of numerous surface-melt ponds around the Antarctic perimeter. Large cracks grow through Antarctic ice shelves as warmer ocean currents melt the towering glaciers from below. The overall picture is of a critical frozen region undergoing rapid change due to the human-forced heating of our world — a warming that has brought Antarctica to a tipping point, for such fundamental alterations to Antarctic ice are now likely to bring about a quickening rate of sea-level rise the world over.
Surface Melt Visible From Satellite
During 2016-2017, Antarctic surface temperatures ranged between 0.5 and 1 degree Celsius above the already warmer-than-normal 1979 to 2000 average for most of Southern Hemisphere summer. While these departures for this enormous frozen continent may not sound like much at face value, they’ve translated into periods of local temperatures up to 20 C above average. As a result, measures around Antarctica along and near the coastal zone have risen above the freezing mark on numerous occasions. These periods of much-warmer-than-normal weather have in turn precipitated widespread episodes of surface melt.
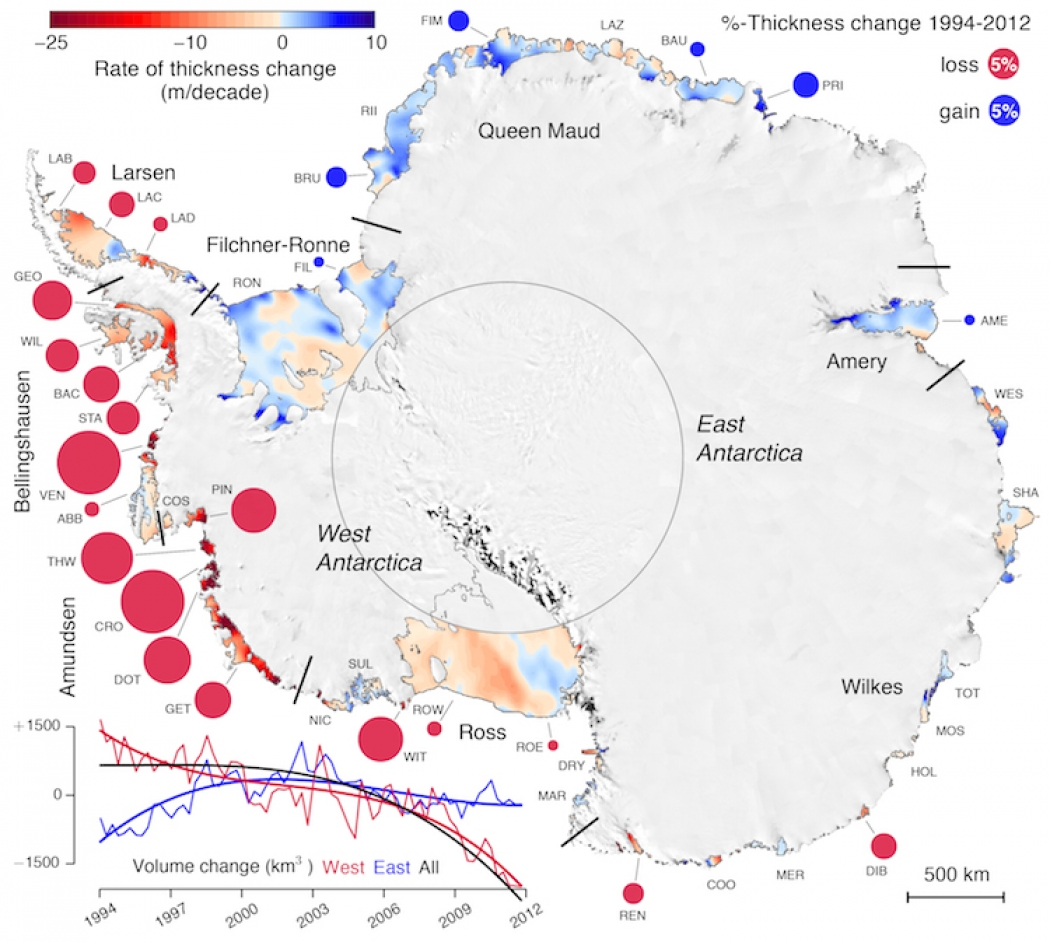
(This Antarctic volume-change melt map, which tracks thinning along various coastal ice shelves from 1994-2012, provides a good geographical reference for ice shelves experiencing surface melt or severe rifting. The Amery Ice Shelf [AME], King Baudouin Ice Shelf [BAU], and the Lazarev Ice Shelf [LAZ], stable through 2012, all showed extensive surface melt this summer. Meanwhile the Larsen C Ice Shelf [LAC] and Brunt Ice Shelf [BRU] both feature large rifts that threaten destabilization. Image source: Volume Loss from Antarctica’s Ice Shelves is Accelerating/Sciencemag.org.)
This year, one region in particular has seen temperatures hitting above 0 C consistently: the valley into which the Lambert, Mellor, and Fisher glaciers flow into the Amery Ice Shelf. There, warming has resulted in the formation of multiple large surface-melt ponds. The below image is a January 22nd NASA satellite shot of an approximate 100-by-40-mile section of this glacial outflow zone. The blue areas are melt ponds, some as large as 3 miles wide and 20 miles long.
The Amery Ice Shelf is one of East Antarctica’s largest. Like many of Antarctica’s ice shelves, Amery is melting, with about 46 billion tons of ice lost from this shelf alone each year. As with other Antarctic ice shelves, Amery’s melt is mostly below the surface, caused by warming ocean waters. However, in recent years, considerable surface melt on Amery’s feeder glaciers likely also contributed to significant volume losses in the shelf.
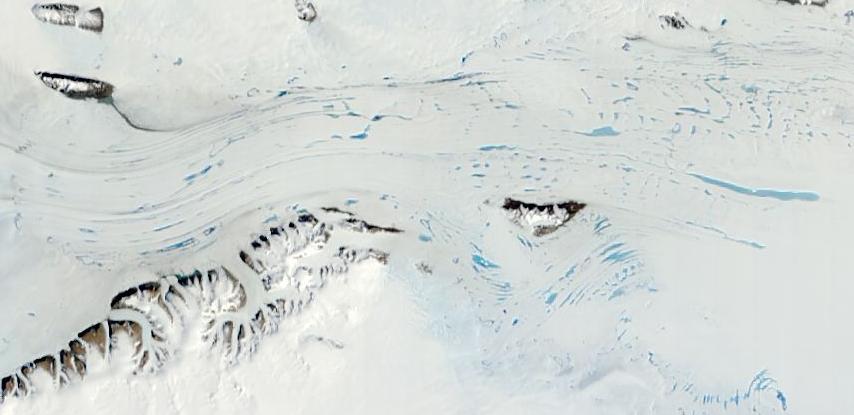
(Large melt ponds up to 20 miles long cover glaciers flowing into the Amery Ice Shelf on January 22, 2017. Image source: LANCE MODIS.)
Surface melt for Amery has become an increasingly prevalent feature since 2013, with 2017 melt for January 22 the most widespread for any of the past five years in this region. East Antarctica rarely saw large surface melt events prior to the 2000s, and this year’s warming and large melt ponds are a considerable feature. While basal warming is often the cause of the greatest mass losses, surface melt can act like a giant wedge driven into ice shelves, helping to break them up. Melt wedging in glaciers can also increase their forward rate of movement as heat content rises and as the points at which glaciers contact the ground become lubricated.
Moving north toward Dronning Maud Land along the East Antarctic coast, we find another region of surface melt ponding on the King Baudouin Ice Shelf. Nearly as widespread and extensive as the melt on the Amery Shelf’s glaciers, the King Baudouin melt is no less impressive and concerning.
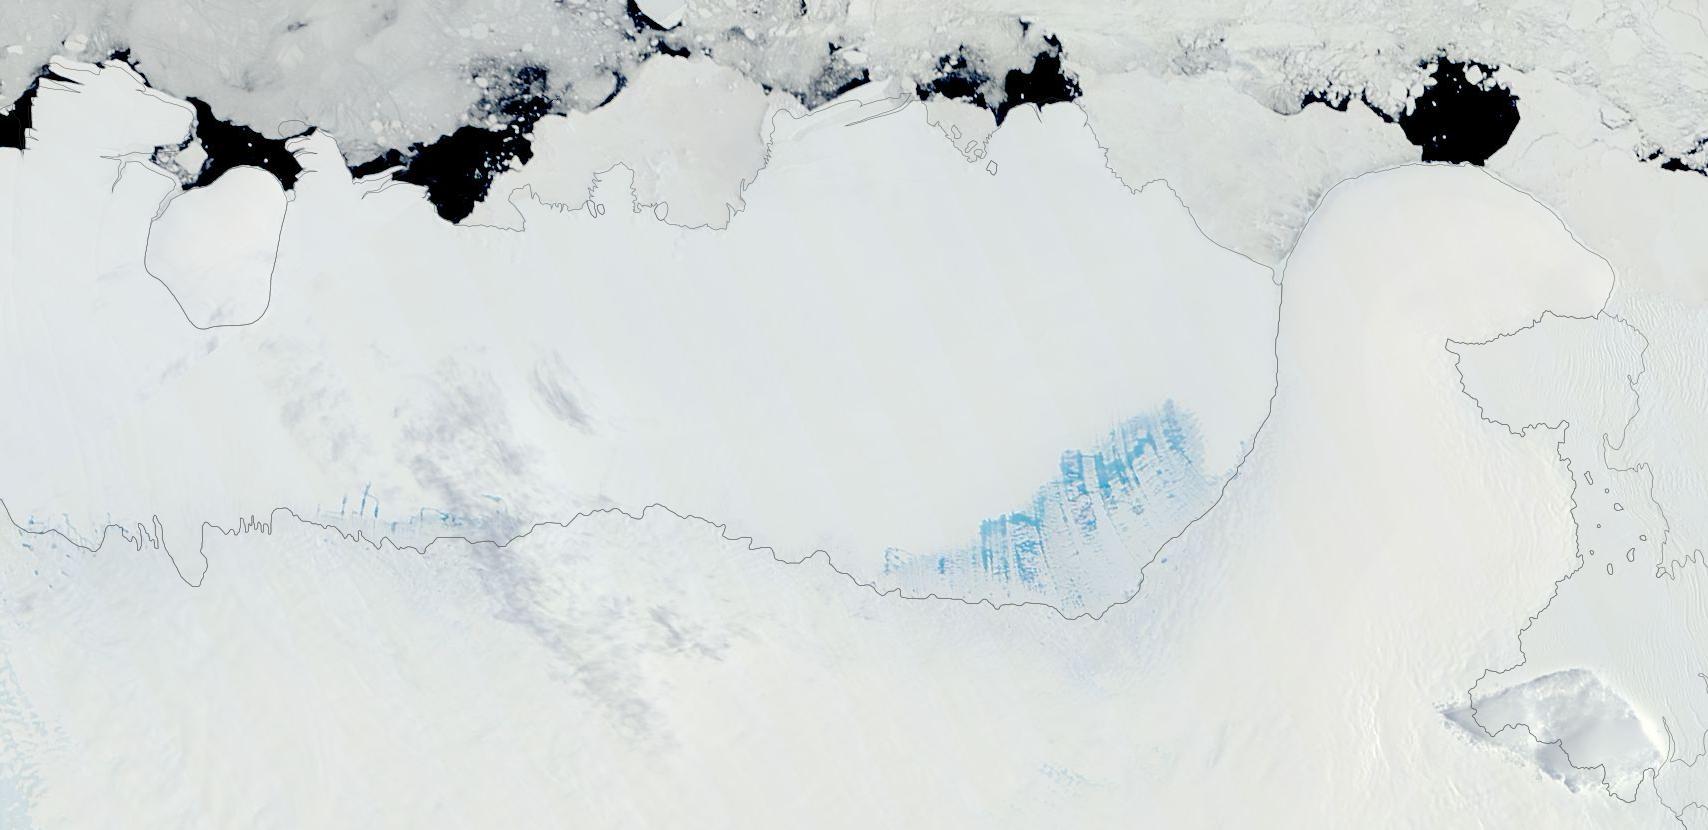
(King Baudouin Ice Shelf shows extensive melt ponding along a 40-mile swath of its southwestern corner in January 2017. Image source: LANCE MODIS.)
The largest melt zone shows nearly continuous ponding along a 40-mile-wide diagonal near the ice shelf’s southwestern contact point with East Antarctica’s mainland. A smaller section of melt appears as light blue splotches about 60 miles to the west of the larger melt zone in the image above (for reference, bottom edge of frame represents about 250 miles).
Unlike glacial surface ponding near Amery, melt on King Baudouin occurs directly over the floating ice shelf. This form of melt adds greater stresses as the heavy pools of water can act as wedges that drive gaps in the ice apart. Past instances of widespread surface ponding have occurred in conjunction with the rapid break-up of Larsen ice shelves along the Antarctic Peninsula. Taking a look at past years in the satellite record, we find that this region of King Baudouin has been susceptible to melt since at least 2013. However, the extent of 2017 melt is the greatest in the record for this time of year.
The next ice shelf to the west of King Baudouin, the Lazarev Ice Shelf, shows extensive melt along what appear to be various rifting features streaming out from an open ocean gap where the ice shelf contacts land:
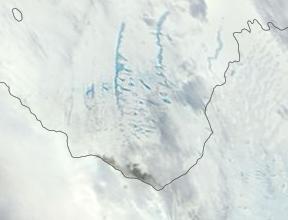
(Ten-mile-long melt ponds visible on the surface of the Lazarev Ice Shelf. Image source: LANCE MODIS.)
Over recent years, the ocean gap — visible as a dark section in center-bottom frame of the image above — has slowly grown larger. There, open ocean water has gradually taken up a larger and larger section of Lazarev’s land-contact point. Meanwhile, from 2013 to 2017, melt ponds have tended to radiate out from this open gap region along rifts in the ice shelf structure during summer as air temperatures have risen above freezing.
This year, melt appears to be quite extensive with two parallel 10-mile-long melt ponds filling in rift features with many smaller melt ponds interspersed. The open ocean gap combined with rifts filling with what is now seasonal melt water gives the overall impression of a rather weak structure.
Ice Shelves Cracking Up
Though regions on or near the Amery, King Baudouin and Lazarev Ice Shelves show the most obvious surface melt features, large melt ponds also formed near the Fimbul Ice Shelf. Ponds also formed during a Föhn wind event near the Drygalski Ice Tongue. Even as such instances of surface melt became a more obvious feature across Antarctica, at least two large ice shelves were run through by growing rifts that threatened their stability.
One such rapidly-expanding rift forced the British Halley VI research team to evacuate their base of operations on the floating Brunt Ice Shelf. This rift, which had until late 2016 been growing only gradually, doubled in length in less than three months. Its gaping chasm threatened to cut the expedition off from the Antarctic mainland and set it adrift at sea — forcing an early evacuation as a precaution.
(Drone footage of Brunt Ice Shelf’s rapidly growing crack. From October through early January, the crack doubled in size from 22 kilometers in length to 44 kilometers. Video source: Antarctic Survey.)
Meanwhile, a large crack that will soon result in a 2,000-square-mile iceberg breaking from the Larsen C Ice Shelf recently grew by another six miles to 100 miles long. The Connecticut-sized ice chunk now only hangs by a 15 to 20 mile thread. With the loss of this very large segment of ice, researchers are concerned that Larsen C may destabilize and ultimately succumb to the fate of Larsen A and Larsen B — breaking into thousands of separate icebergs and floating away into the Southern Ocean.
Signs of Melt, Destabilization as More Above-Freezing Temperatures are on the Way
With so many large melt ponds and melt-related rifts forming in Antarctica’s ice shelves, it’s worth considering that these shelves serve as a kind of door jam holding large glaciers back from flooding into the ocean. And as more ice shelves melt and destabilize, the faster these glaciers will move and the faster the world’s oceans will rise.
So much widespread melt and rifting of Antarctica’s ice shelves is a clear warning sign. And if enough of the ice shelves go, then rates of sea-level rise could hit multiple meters this century.
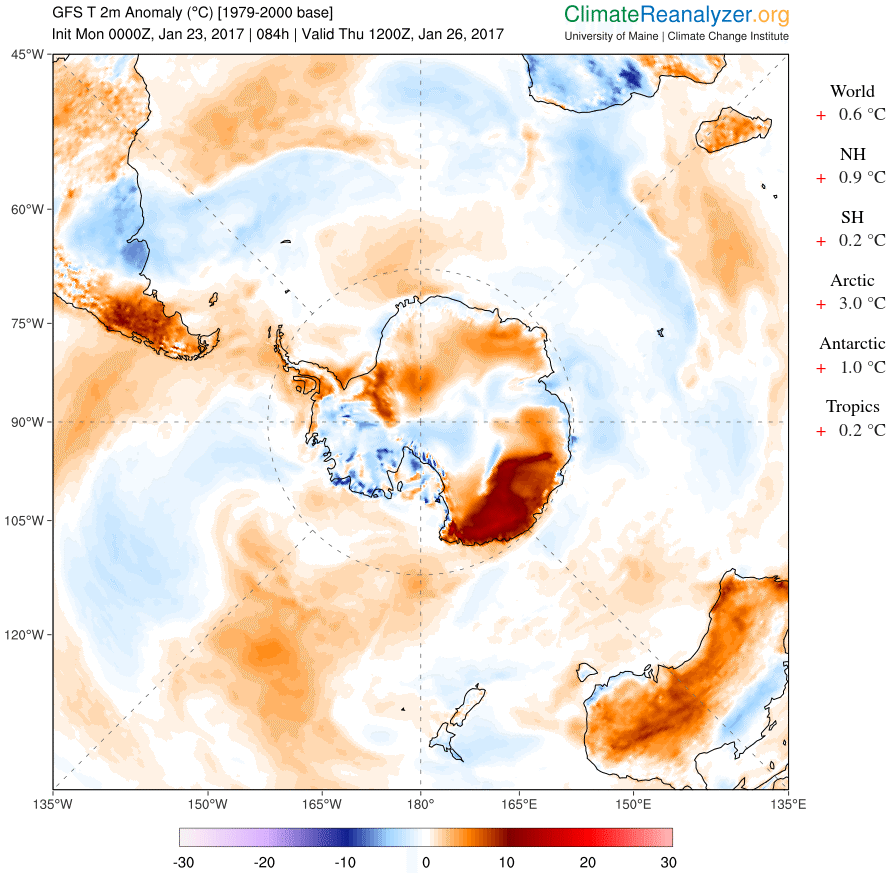
(Many locations along the coast of Antarctica will see 5-15 C above-average surface temperatures this week, a continuation of a strong surface melt pressure for the austral summer of 2016-2017. Image source: Climate Reanalyzer.)
This week, another spate of near- or above-freezing temperatures will run along the coastal regions of both east and west Antarctica, so the amazing atmospheric melt pressure that we are now seeing should continue to remain in play at least for the next seven days as austral summer continues. As for the melt pressure coming from the warming ocean beneath the ice shelves — that is now a year-round feature for many locations.
Links:
Volume Loss from Antarctica’s Ice Shelves is Accelerating
Rapidly Growing Crack in Brunt Ice Shelf Forces Evacuation of Halley Research Station
Larsen C Ice Shelf Crack Just Grew By Another 6 Miles
Did Föhn Winds Just Melt 2 Miles of Antarctic Surface Ice in Just One Day?
Hat tip to Shawn Redmond
Hat tip to Jeremy in Wales
Hat tip to Colorado Bob
Share this:

Posted by robertscribbler on January 23, 2017
https://robertscribbler.wordpress.com/2017/01/23/abnormal-antarctic-heat-surface-melt-giant-cracks-in-ice-shelves-more-troubling-signs-of-a-world-tipping-toward-climate-chaos/
Why the Global Coral Bleaching Event That Began in 2014 May Just Keep Going and Going
From October of 2014 through June of 2016, the world was in the grips of a powerful El Nino. And throughout this event, the oceans spewed back some of the massive volume of heat they’ve been accumulating in their depths due to global warming. As a result, atmospheric and ocean surface temperatures hit new record highs. And during 2016, global surface temperatures will likely average 1.2 C hotter than 1880s levels. This amount of warming is as considerable as it is harmful.
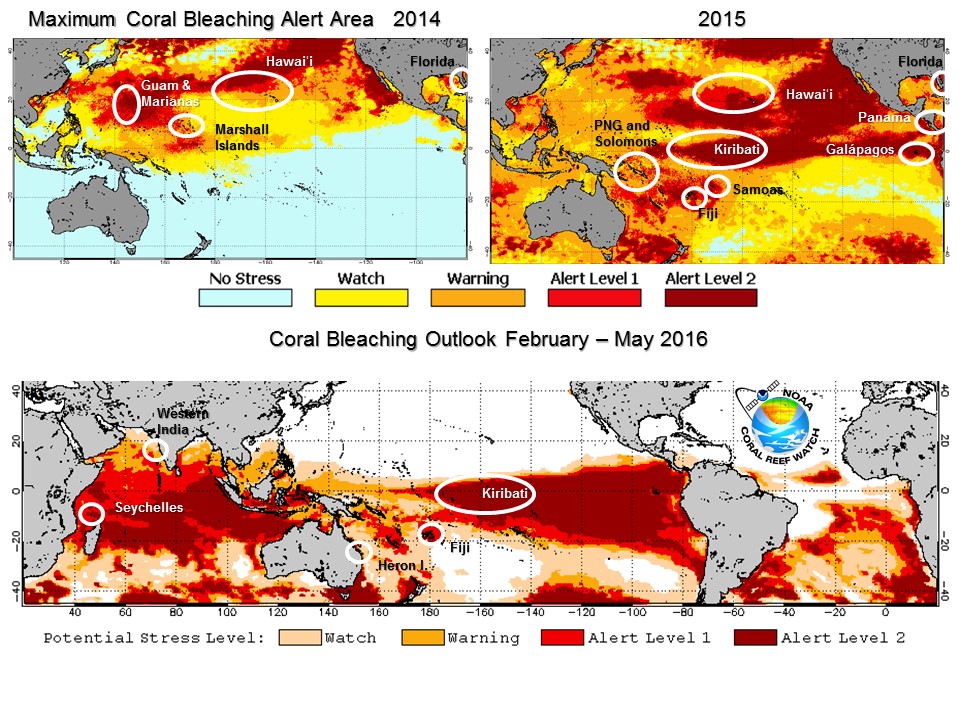
(A global coral bleaching event that began in 2014 continues. It is the longest coral bleaching event on record. But unless oceans somehow cool off, it won’t really end. With only a weak La Nina emerging following a strong El Nino and a record spike in global temperatures, there is some risk that this ongoing event will ebb and flare on a nearly indefinite basis. Continued fossil fuel burning, meanwhile, will continue to add heat to the global climate system — presenting worsening medium and long term bleaching pressure for corals. Image source: Coral Reef Watch.)
The Worst Global Coral Bleaching Event Ever Recorded…
This new record spike in global surface temperatures set off the worst coral bleaching event ever recorded. Around the world, reef systems came under severe stress as sea surface and near surface temperatures exceeded 28-30 degrees Celsius.
Among the hardest hit regions were the reefs of Kiribati. There, sea surface temperatures hit up to 31.4 C on an extended basis. Such hot waters are now expected to have wiped out all but 1 to 5 percent of Kiribati’s living corals. So, for all practical purposes, the reefs of that island republic have been wiped out.
Overall, the event was very wide ranging — impacting corals throughout the Pacific, Atlantic, and Indian Oceans as well as in the Persian Gulf, Mediterranean, and Red Sea. As an example, 95 percent of corals in US territories from Florida to the Gulf of Mexico, Caribbean, and Pacific experienced some level of bleaching.
(A weak La Nina has probably already cooled ocean surfaces as much as they will be cooled during 2016 and 2017. But despite this cooling, ocean near-surface waters are still too hot for corals in many places. Relative, if mild, ocean surface warming should occur as ENSO is predicted to shift into neutral status. If coral bleaching is ongoing through La Nina, then it is unlikely to cease as the global ocean starts to warm again. Global sea surface temperature anomaly image source: Earth Nullschool.)
In Australia, the Great Barrier Reef (GBR) also saw its worst bleaching event on record. There, 93 percent of corals are reported to have experienced bleaching. Meanwhile, about 50 percent of corals have died in the northern section of the GBR. In the media, a controversy has raged over whether or not this event is the start of the great reef’s swansong. To be clear, the GBR was not killed off by the most recent large bleaching event. But it was dealt a very severe blow. With the world continuing to warm as fossil fuel burning remains ongoing, a similar blow could occur as soon as the next El Nino or the one after. And the story for many of the world’s remaining reefs could well be the same.
…Is Still Ongoing…
For after about two years now, and as the world has settled into the periodic natural cooling of ocean surfaces called La Nina, the global coral bleaching event that has so damaged the vital species that build the world’s reefs is still ongoing. Though diminished, and as ocean surface heat backed off during late 2016, NOAA has still identified numerous regions that are high risk for coral bleaching through at least February.
The austral summer is expected to bring bleaching over far-flung regions encircling the southern part of the globe. Thankfully, most of the GBR is only under a bleaching watch for now. But bleaching warnings and alerts abound and, unfortunately, many reefs are likely to see continued die-offs even after El Nino has long since faded.
… And May Just, For all Practical Purposes, Continue
As the current La Nina is rather weak, and as it is predicted to shallow into an ENSO neutral state by spring, it appears that sea surface temperatures may be in the process of bottoming out. Global fossil fuel emissions, meanwhile, continue to add heat to the ocean system. As a result, the coral bleaching pressure that we are seeing during the period of November 2016 through February of 2017, unless we see a resurgence to a stronger La Nina event over the next year or two, could be the minimum we will see over the coming years. And if that is the case, then the coral bleaching event that hasn’t ended for the past two years may not really end at all.
Links:
Share this:

Posted by robertscribbler on November 22, 2016
https://robertscribbler.wordpress.com/2016/11/22/why-the-global-coral-bleaching-event-that-began-in-2014-may-just-keep-going-and-going/
New Study: Climate Change Has Doubled the Number of Category 4 and 5 Storms Striking East and Southeast Asia
The atmospheric-ocean heat engine. It’s a pretty simple mechanism for pumping up the power of storms. But as simple as it is, the results can be devastating when this engine gets revved up by human-forced climate change, according to a new study released Monday in Nature Geoscience.
The Heat Engine in Action
As the ocean surface warms, it heats the local atmosphere. This generates an updraft that pushes higher and higher into the air above. Heat also causes water at the ocean surface to evaporate. This evaporated water is borne up on the winds and air currents rising above the heating water. A low-pressure system forms and the water vapor condenses into clouds which ultimately become thunderstorms. The Coriolis effect gives it all a nudge and the storms and clouds start to spin…

(Pacific Ocean typhoon paths from 1980 through 2005. A new study shows that the destructive power of landfalling typhoons in East and Southeast Asia has increased by nearly 50 percent since 1977. Meanwhile, the number of category 4 and 5 storms striking land has doubled. All impacts due to ocean-surface warming related to human-caused climate change. Image source: Commons.)
The process described above happens every day at the ocean surface. Sometimes these storms form into the powerful cyclones we call hurricanes and typhoons. Under normal global temperature conditions, the kinds and intensities of these storms are what we have generally come to expect. But if you add heat to the Earth System, as we do when we burn fossil fuels and dump carbon into the atmosphere, the whole storm formation process gets amped up — and produces the powerful outlier storms that have become more common over recent years.
Add Human-Forced Warming and End up With More Powerful Storms
The fact that such added heat tends to generate more powerful storms has been a generally accepted part of our understanding of climate science for some time now. However, it was not until recently that this signal of rising storm intensity became visible in the science. Now, a new study published today in Nature Geoscience indicates that’s exactly what’s happening in parts of the Western Pacific.
It’s a pretty earth-shattering revelation with multiple climate change-related findings which are worth reading about in full here. These findings boil down to the following:
- The number of category 4 and 5 storms striking southeast Asia has doubled since 1977.
- The overall destructive power of storms striking this region has increased by nearly 50 percent over the same period.
- This increase in powerful storms has been caused by ocean warming related to climate change.
Standing alone, any one of these findings would be significant. Taken together, they paint a picture of significantly rising risk of storm damage and related loss of life due to climate change in one of the world’s most highly populated regions. In other words, the storms firing and running in to land in this region are not the same as they once were. They have been dramatically altered by the massive volume of greenhouse gasses hitting the world’s atmosphere due to fossil-fuel burning, accumulating over the decades.
The study notes that:
Here, we apply analysis to corrected data and show that, over the past 37 years, typhoons that strike East and Southeast Asia have intensified by 12 to 15 percent… a nearly 50 percent increase in instantaneous destructiveness… with the proportion of category 4 and 5 storms doubling or even tripling… We find that increasing intensity of landfalling typhoons is due to strengthened intensification rates which are, in turn, tied to locally enhanced surface warming on the rim of East and Southeast Asia.
Ramping Storm Intensity
This scientific study helps validate and clarify what many weather and climate observers have already noted during recent years. The destructiveness of storms striking land in East and Southeast Asia is not normal. And, land-falling category 4 and 5 storms are occurring with greater frequency over broader regions.
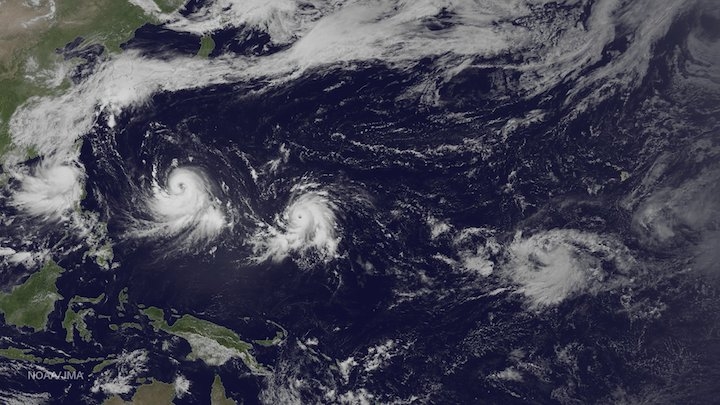
(Four Pacific typhoons take aim on Southeast Asia during July of 2015. A new study finds that the landfall intensity of storms like these is increasing due to human-caused climate change. Image source: NOAA.)
The Western Pacific basin is now capable of producing storms like Haiyan, whose destructive intensity at landfall was mostly theoretical decades before. This increase in intensity has been observed during a period of rapid Earth warming. And with more warming in store, the storms are likely to grow even more intense. From the Nature Geoscience study:
The projected ocean surface warming pattern under increased greenhouse gas forcing suggests that typhoons striking eastern mainland China, Taiwan, Korea, and Japan will intensify further. Given disproportionate damages by intense typhoons, this represents a heightened threat to people and properties in the region.
Links:
Intensification of landfalling typhoons over the northwest Pacific since the late 1970s, Wei, M. and Xie, S.
Asian typhoons becoming more intense, study finds
Share this:

Posted by robertscribbler on September 6, 2016
https://robertscribbler.wordpress.com/2016/09/06/new-study-climate-change-has-doubled-the-number-of-category-4-and-5-storms-striking-east-and-southeast-asia/
Human Hothouse Spurs Longest Coral Die-Off on Record
The big coral die-off began in the Western Pacific as a massive ocean temperature spike built up during 2014. Back then, ocean heat accumulation had hit a very high ramp. A vicious, century-and-a-half long increase in atmospheric greenhouse gasses re-radiated greater and greater portions of the sun’s energy hitting the Earth — transferring the bulk (about 90 percent) to the world ocean system.
(A report out today from AGU finds that the world is now experiencing its longest coral die-off event on record. Image source: AGU.)
By 2015, as one of the strongest El Ninos on record began to extend its influence across the globe, a broad region stretching from the Western Pacific, through the Central Pacific and on into the Eastern Pacific and Caribbean were all experiencing mass coral die-offs. Into early 2016, die-off events again expanded taking in Australian waters and sections of the Indian Ocean off East Africa and Western India.
After 20 months of ongoing coral mortality, we are now in the midst of the longest coral die-off event on record — one of only four such events that the world has ever experienced.
The Fourth Major Coral Die-Off
Researchers have long known that corals are sensitive to changes in ocean temperature. A rise in ocean water readings by as little as 1 degree Celsius above average peaks over the period of a month can be enough to set off a life-threatening condition called a coral bleaching event. According to a recent report in AGU:
The bleaching, or whitening, occurs when the corals expel the symbiotic algae that live in their tissues. Without the algae, corals lose a significant source of food and are more vulnerable to disease. In a severe bleaching event, large swaths of reef-building corals die. This causes reefs to erode, destroying fish habitat and exposing previously protected shorelines to the destructive force of ocean waves.
The typical bleaching threshold for most corals tends to be in the range of 29-30 degrees Celsius or about 84-86 degrees Fahrenheit over an extended period. And with the world ocean surface approaching a range near 1 C above 1880s averages, this threshold is hit more and more frequently — putting corals at greater and greater risk.
(World Resources Institute Published the above video in 2012 as a survey of, then current, threats to global coral reef systems. By 2030, heating of the world ocean system, ocean acidification and global warming related dead zones will provide an extreme existential challenge to the world’s beautiful and diverse coral reef systems.)
Prior to the 1980s, widespread coral bleaching events were unheard of. Though isolated events occurred, the world ocean system had not yet warmed enough to put corals at major risk. However, by the 1980s global ocean temperatures had begun to rise into ranges at which peak ocean warming periods could put corals in the firing line for major, globe-spanning die offs.
The first such major, global coral die-off occurred during the, then record, 1982-1983 El Nino. At the time this event was unprecedented. And it held the dubious standing as the only such event until the 1997-1998 Super El Nino set off a similar, though longer-lasting mass die off. By the late 2000s, global ocean temperatures had again risen — hitting marks high enough to enable a weak 2010 El Nino to set off the third mass coral die-off.
The fourth mass die off began in 2014 prior to the most recent super El Nino — which has only exaggerated and lengthened its impact. It is now the longest lasting coral die-off ever recorded. And researchers expect it to continue on through at least much of 2016 and possibly into 2017.
Corals Entering a Period of Killing Heat
As the oceans are predicted to continue warming over the next few decades, corals are expected to come under ever-worsening stress. A recent report by the World Resources Institute (WRI) found that regions experiencing the current mass die-off were 70-90 percent likely to experience similar events at a frequency of once every two years by 2030. And a much larger region was expected to have a 50 to 70 percent risk of experiencing a bleaching event over a two year time-frame.
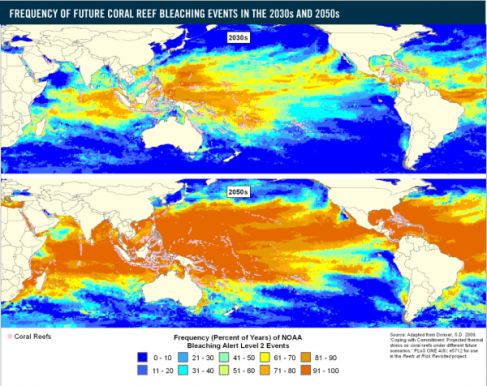
(World Resources Institute in 2012 found that mass coral bleaching and related die-off would occur with extraordinary frequency post 2030. Image source: The World Resources Institute.)
By the 2050s, under business as usual fossil fuel burning, WRI expects that much of the world’s temperate and tropical oceans would experience coral bleaching events bi-annually.
Taking this stark prediction into account we find that the threat to corals over the coming decades will eventually exceed El Nino periodicity and become common during most ocean climate states. The current, likely two year to 30 month, coral die off should serve as a warning for the worse and more frequent hits to corals that will, sadly, be stacking up over the coming decades. Eventually, mass coral die-offs in the continually warming world ocean will become continuous and ubiquitous unless the current trend somehow draws swiftly to a halt.
In addition, given an expanding ocean acidification proceeding southward from the poles and more and more widespread zones of ocean anoxia (areas of water containing very little oxygen), what we are seeing is that threats to coral health are rapidly multiplying due to influences directly related to human-forced climate change.
Links:
El Nino Prolongs Longest Coral Bleaching Event
NOAA: Coral Bleaching Background
World Resources Institute Shows Widespread Coral Bleaching by 2030
Hat Tip to TodaysGuestIs
Hat Tip to DT Lange
Share this:

Posted by robertscribbler on February 23, 2016
https://robertscribbler.wordpress.com/2016/02/23/human-hothouse-sets-off-longest-coral-die-off-on-record/
A Monster 2016 Arctic Melt Season May Have Already Begun
“Hell is empty… all the devils are here.” William Shakespeare — The Tempest.
******
We have never seen heat like this before in the Arctic. Words whose meaning tends to blur due to the fact that, these days, such events keep happening over and over and over again.
Ever since at least the 1920s, the Arctic has been warming up due to a destructive and irresponsible human greenhouse gas emission. And, over recent years, the Arctic has been warming more and more rapidly as those dangerous emissions continued to build on into the 21st Century. Now the Earth has been shoved by those emissions into realms far outside her typical Holocene context. And it appears that the Winter of 2016, for the Arctic, has been the hottest such year during any period of human-based record-keeping and probably the hottest season the Arctic has experienced in at least 150,000 years.
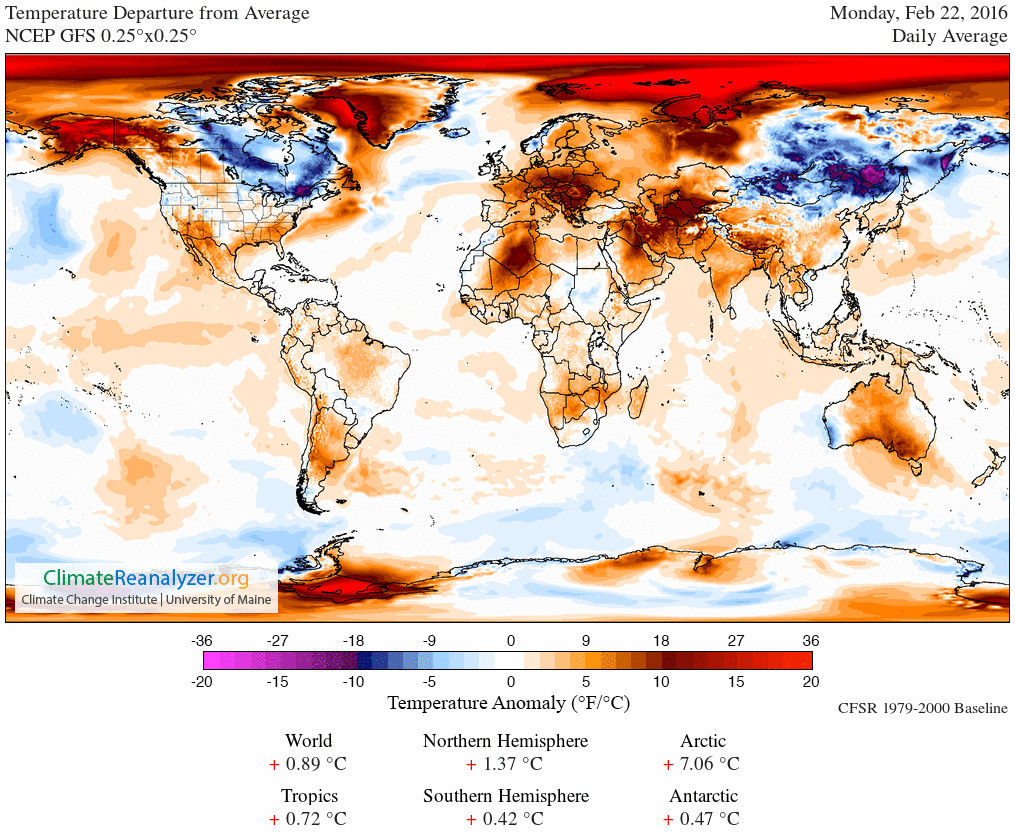
(Climate Reanalyzer hits a stunning 7.06 C above the already hotter than normal 1979 to 2000 baseline for the entire region above the 66 North Latitude Line on February 22nd of 2016. It’s a very extreme temperature departure — one this particular analyst has never seen before in this record. For reference, a 3 C above baseline temperature departure for this region would be considered extraordinarily warm. What we see now is freakish, outlandish, odd, disturbing. Image source: Climate Reanalyzer.)
It’s just the most recent marker on a path toward an ever-worsening polar heat that is becoming all-the-more difficult to ignore or deny. For at current greenhouse gas levels, that polar zone is hurtling toward temperatures not seen in 15 million years. A heat pressure that will push for warming not seen in 20, 30, 50 million years or more, if a nightmarish fossil fuel burning continues.
Nothing in the recent geological past can compare to the danger we are now in the process of bringing to bear upon our world. Not the Great Flood. Not the end of the last ice age. Those were comfortable, normal cataclysms. Human beings and life on this world survived them. But the kind of geophysical changes we — meaning those of us who are forcing the rest of us to keep burning fossil fuels — are inflicting upon the Earth is something entirely new. Something far, far more deadly.
Extreme Arctic Heat Ramps Up Yet Again
At the start of 2016, we find ourselves experiencing a year during which our world is steepening its ramp-up toward this kind of catastrophic global heat. During January of 2016, the Arctic experienced its most extreme temperature departures ever recorded. February, it appears, was at least as bad. Today, daily temperature departures for the Arctic in the Climate Reanalyzer measure were a stunning +7.06 above an already hot 1979-to-2000 baseline (see graphic above).
To put this in perspective, a region larger than 30 million square kilometers or representing fully 6 percent of the Earth’s surface was more than 7 degrees Celsius hotter than average today. That’s an area more than three times larger than the United States including Alaska and Hawaii. A region of the world that includes a vast majority of the remaining frozen Northern Hemisphere land and sea ice. And since an extreme heatwave is typically defined as temperature departures at about 3 C above normal for an extended period of time over a large region — the Arctic appears to be experiencing some ridiculously unseasonable temperatures for this time of year.
(A seemingly unstoppable period of record warmth continues for the High Arctic on February 22nd. Readings for this zone have consistently remained in the warmest 15 percent of readings on up to record warmest readings for each day since January 1, 2016. Image source: NOAA.)
Above the 80 North Latitude line, departures were even more extreme — hitting about 13 C or about 23 F warmer than normal for the entire High Arctic surrounding the North Pole today (see above graphic). Temperatures that are more typical for late April or early May as we enter a time of year when this region of the Arctic is usually experiencing its coldest readings and sea ice extents would normally continue to build.
Unfortunately, today’s extreme heat was just an extension of amazing above average Arctic temperatures experienced there since late December. So what we are seeing is consistently severe Arctic warmth during a season that should be Winter, but that has taken on a character more similar to a typical Arctic Spring. Warmth that is now enough to have already propelled the Arctic into its warmest ever yearly temperatures when considering a count of below freezing degree days.
(Degree Days below Freezing [or Freezing Degree Days, FDD] shows a 670 FDD departure below that seen during a typical year. If the current trend continues, the Arctic may see degree days below freezing lag by between 900 and 1,500 — knocking off about 15 to 25 percent of below freezing days from a typical Arctic year. Note that the departure line steepens rapidly after the first major warm wind event hits the Arctic during late December of 2015 — driving temperatures above freezing at the North Pole for the first time ever so late in the year. Image source: NOAA.)
Freezing degree-days (FDD) or thawing degree-days (TDD) are defined as departures of air temperature from 0 degrees Celsius. The less FDDs during an annual period, the warmer the Arctic has become. Under the current trend, the Arctic is now on track to hit between 15 and 25 percent less FDDs than it experiences during a typical year in 2016.
Looking at the above graph, what we see is an ongoing period in which Winter cold has been hollowed out by a series of warm air invasions rising up from the south. These warm wind events have tended to flow up through weaknesses in the Jet Stream that have recently begun to form over the warming Ocean zones of the Bering, Northeast Pacific, Barents, and Greenland seas. Still more recently, warm wind events have also propagated northward over Baffin Bay and Western Greenland — even shoving warm air into the ocean outlets of a typically frozen Hudson Bay.
Perhaps more starkly, we find a steepening in the rate of Freezing Degree Day loss following the freakish series of storms that drove the North Pole above Freezing during late December of 2015 — the latest during any year on record that the North Pole has experienced temperatures exceeding 0 C.
Arctic Sea Ice Declining Since February 9th
Overall, a rapid heat uptake by the world ocean system appears to be the primary current driver of extreme Arctic warming. Atmospheric heat from greenhouse gas warming swiftly transfers through the ocean surface and on into the depths. During recent decades, the world ocean system has taken in heat at a rate equal to the thermal output of between 4 and 5 Hiroshima-type bombs every second (with some individual years hitting a much higher rate of heat uptake).
Since thousands of meters of warming water insulates better than the land surface and diaphanous atmosphere, this added heat is distributed more evenly across the globe in the world ocean system. As such, ocean warming is a very efficient means of transferring heat to the Northern Hemisphere Pole in particular. The reason is that the Pole itself sits atop the warming and globally inter-connected Arctic Ocean. In addition, the warming surface waters, as noted above, provide pathways for warm, moist air invasions of the Arctic — especially during Winter.
For 2016, these kinds of heat transfers not only resulted in an extreme warming of airs over the Arctic, they have also shoved the Arctic sea ice into never-before-seen record lows for area and extent.
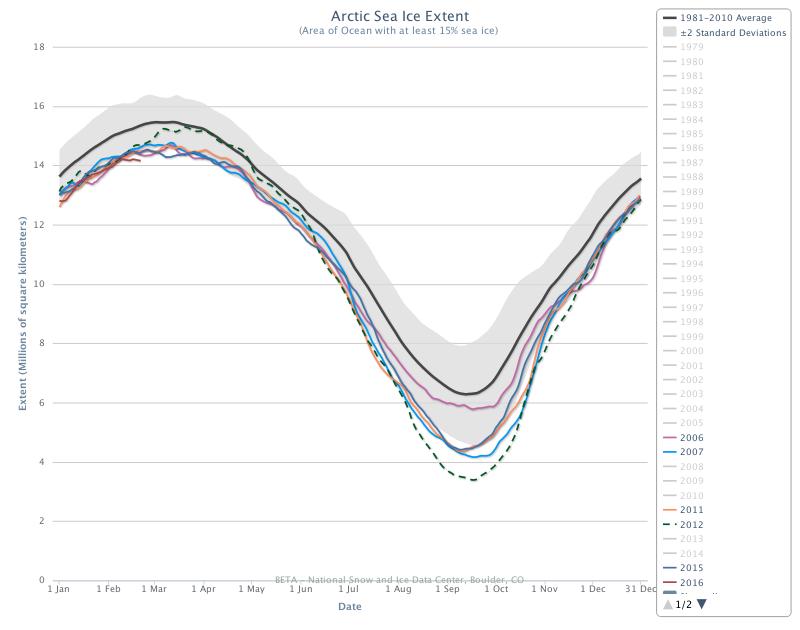
(NSIDC shows Arctic sea ice entering a new record low extent range from February 2 through February 21 of 2016. A peak on February 9 and decline since concordant with record warmth building throughout the Arctic begs the question — did the sea ice melt season start on February 9th? Possible — but too early to call for now. Image source: NSIDC.)
Off and on throughout January, but more consistently since early February of 2016, Arctic sea ice has continued to hit new daily record lows. For Arctic sea ice extent, the record lows entered a streak that has now been unbroken since February 2nd. By the 21st, extent measures had hit 14.165 million square kilometers in the National Snow and Ice Data Center measure. That’s about 200,000 square kilometers below the previous record low extent value for the date set during 2006.
Perhaps more ominously, the current measure appears to have fallen off by about 50,000 square kilometers from a peak set on February 9th. And with such extreme heat driving into the Arctic over recent days, it appears that this departure gap could widen somewhat over the coming week.
Overall, radiation balance conditions for the Arctic are starting to change as well. The long polar night in the Arctic is beginning to recede. Sunlight is beginning to fall at very low angles over the sea ice, providing it with another nudge toward melting. Finally, the greatly withdrawn ice has uncovered more dark ocean surfaces that will, in turn, absorb more sunlight as the Arctic Winter proceeds on toward Spring.
With sea ice declining slightly since February 9, with record warmth already in place in the Arctic, and with the sun slowly beginning to provide its own melt pressure, it appears risks are high that we see a record early start to Arctic melt season. Seven day forecasts do show high Arctic temperature departures receding a bit from today’s peak at around 6-7 C above average to between 4 and 5 C above average by the start of next week. But heat at the ice edge in the Bering, Barents, Greenland Sea and Baffin Bay are all likely to continue to apply strong pressure on sea ice extent and area totals. In addition, recent fracturing within the Beaufort has generated a number of low albedo zones that will face a wave of unseasonable warmth riding up over Alaska during the coming days which will tend to slow rates of refreeze even as Western Alaska’s waters feel the heat pressure of off and on above freezing temperatures.
So it appears we may have already begun, in early February a melt season that will last through mid-to-late September. It’s too early to make the call conclusively, but the Arctic heat and melt trends necessary to set up just such an ominous event do appear to be in place at this time. In other words, “all the devils are here…”
Links:
NOAA: Mean 2 Meter Temperatures North of 80 North Latitude
NOAA: Frequently Asked Questions About the Arctic
Grasping at Uncorrected Straws
The Oceans Warmed by a Rate of 12 Hiroshima Bombs per Second in 2013
Warm Arctic Storm to Unfreeze the North Pole
Congress Members Call for Investigation of Shell over Climate Change Lies
Could Lawsuit Against Exxon Mobile Force Fossil Fuel Industry to Pay for Lies about Climate Change?
Hat Tip to Planet in Distress
Hat Tip to DT Lange
Share this:

Posted by robertscribbler on February 22, 2016
https://robertscribbler.wordpress.com/2016/02/22/a-monster-2016-arctic-melt-season-may-have-already-begun/
Mangled Jet Stream + Global Warming + Hot Atlantic Water = Boston Buried Under 8 Feet of Snow
If you deny that warmer ocean temps -> greater snowfall w/ coastal winter storms, you are not a climate denier. You are a physics denier. — from the Twitter feed of Dr Michael E. Mann, Climate Scientist
* * * *
Boston just experienced its snowiest month on record and, yes, it really is climate change, stupid. In essence, as Michael Mann notes above, it’s a matter of oceanic and atmospheric physics.
Consider the fact that the ocean surface is warming at an unprecedented rate. Consider also the fact that this observed warming is resulting in a number of powerful south to north flows of air over ocean regions and toward the polar zone.
Over the past month, these powerful warm air flows pushed strongly into both Alaska and Svalbard — causing 20-30 C above average temperatures in regions of the Arctic along the 70 to 80 degree north latitude lines. For Alaska, the warmth was so prevalent and intense that it forced the Iditerod sled dog race to be moved 300 miles north for want of snow and ice. On this past Sunday night in Svalbard, just above the 80 degree north latitude line, temperatures were a balmy 1.2 degrees Celsius. An extraordinary above freezing reading in a land where temperatures during this time of year are typically 20 to 30 degrees Celsius below that mark.

(Anomalous above freezing temperatures in the land of winter dark and chill. Also note the very powerful south to north air flows originating from the 30 degree north latitude line and terminating in the Arctic near 70 to 80 north. These flows exist in both the Pacific and the Atlantic — hugging the coastal zone and flowing strongly northward along a reoriented storm track. Image source: Earth Nullschool. Data source: Global Forecast System Model.)
All this warm air moving north must have an impact. And that impact is to leave Greenland and the eastern North American Continent as the remaining refuge for cold Arctic air that would typically amass over a rather thick pack of sea ice. But that sanctuary for cold is increasingly frail and unstable. For the ice is thinner and itself rests upon waters that are warming. So the cold instead moves to land and to land ice — both bodies with physical properties better able to keep cold during the long winter dark.
So the cold flees its previous habitat in the far north near the pole and instead dives about 1,500 miles south over Greenland, Eastern Canada and the US. In the upper atmosphere, this pattern is reflected by a huge trough in the Jet Stream. One that has been repeatedly identified by the crackerjack research of Dr. Jennifer Francis.

(Very high amplitude Jet Stream wave pattern with strong ridge in the west, very deep trough digging through Eastern Canada and the Eastern US, an a return to the strong ridge pattern over the North Atlantic. Image source: Earth Nullschool. Data source: Global Forecast System Model.)
Such a powerful hot-cold dipole in the atmosphere results in extraordinary atmospheric instability. The deep trough alone would be enough to send storm after storm hurtling toward the Northeast US. Storms born of a fury of Arctic cold coming into collision with oceanic moisture from the Gulf of Mexico and the Atlantic.
It is a pattern that has been fixed in place for a month running. One that has delivered storm after powerful storm to the US northeast along a screaming storm track. And one that has slammed these storms into an unprecedented wall of warmth and moisture.
For not only have warm air flows invaded the Arctic resulting in a highly anomalous displacement of cold air southward for an extended period of time. But ocean warmth in a region of the Atlantic just off Boston has provided extraordinary fuel for these storms once they arrive.
For we have observed sea surface temperatures just off Boston in the range of 8-11 C above average for most of the months of January and February:

(Sea surface temperature anomaly map by Earth Nullschool. Note the highlighted region shows an extreme temperature departure of 11.1 degrees Celsius above average. Data Source: Global Forecast Systems Model.)
For reference, a sea surface temperature anomaly of 2 C or higher is considered to be a rather strong departure. The 11.1 C anomaly in the above image is, for lack of a better term, simply off the charts. In rough translation, this amounts to surface waters in the range of 65 to 70 degrees Fahrenheit only about 200 miles or so off the Massachusetts coastline. A coastline regularly seeing temperatures in the range of 0-28 degrees F. The result is a 40-70 degree temperature departure over a very short distance. By itself, this extreme temperature differential would be an amazing storm generator. But the differential alone only tells half the story.
The other half is a powerful explosion of moisture off this much warmer than normal water. A massive mushrooming of moisture just off the coast. And when this very heavy bank of moisture collides directly with displaced onrush of cold and dry air, the amount of snow that is squeezed out can be staggering.
Record-breaking staggering. 8 feet for Boston in one month staggering.
As Michael Mann so saliently noted, you’d have to be a physics denier to not understand the role of ocean warming in either the warm air invasion of the Arctic in the Oceanic zones, the related displacement of cold air over the eastern half of the North American continent, or the fueling of extraordinarily powerful winter storms along the Northeastern Coast of the US.
And to this point, I leave you with the equally salient thoughts of Bill Nye from his twitter feed:

“Would this guy get fired, if mentioned, just mentioned a possible connection, to #climatechange ?” — Bill Nye.
Links:
Michael Mann and Bill Nye Want You to Know Boston’s Epic Snowfall is Tied to Global Warming
Dr Michael E. Mann’s Twitter feed
Scientific hat-tip to Dr. Jennifer Francis
Hat tip to Eric Thurston
Share this:

Posted by robertscribbler on February 18, 2015
https://robertscribbler.wordpress.com/2015/02/18/mangled-jet-stream-global-warming-hot-atlantic-water-boston-buried-under-8-feet-of-snow/
July 2014 Shows Hottest Ocean Surface Temperatures on Record as New Warm Kelvin Wave Forms
According to NOAA’s Climate Prediction Center, July of 2014 was the 4th hottest in the 135 year global temperature record. Land surface temperatures measured 10th hottest in the global record while ocean surface temperatures remained extraordinarily hot, tying July of 2009 as the hottest on record for all years on measure over the past two centuries.
Overall, land temperatures were 0.74 C above the 1950 to 1981 average and ocean surface temperatures were 0.59 C above the same average.
These new record or near record highs come after the hottest second quarter year in the global temperature record where combined land and ocean temperatures exceeded all previous global high temperatures in the measure.
Much Hotter Than Normal July
Few regions around the globe showed cooler than average temperatures during July with zones over the east-central US, in the Atlantic just south of Greenland, and off South America in the Southern Ocean as the only regions showing cooler than normal temperatures. Record warmest temperatures ranged from Scandinavia to Iceland to Northeast Siberia, from California to Alaska to the Northeast Pacific, along a broad stretch of Pacific Ocean waters east of the Philippines and New Guinea, in pools in the North and South Atlantic Oceans off the coasts of North and South America, and in spots from Australia through the Indian Ocean to South Africa.
(Land and Ocean temperature anomalies for July of 2014. Image source: NOAA’s Climate Prediction Center.)
Overall, most of the surface of the Earth featured above average to record warmest conditions, while a minority of the Earth’s surface showed average or below average temperatures.
These new global heat records were reached even as slightly cooler than average waters began to up-well in the critical Eastern Equatorial Pacific region. A powerful Kelvin Wave that initiated during late winter and spring of 2014 failed to set off a summer El Nino and finally faded out, reducing heat transfer from Pacific Ocean waters to atmosphere. Even so, the ocean to atmosphere heat dump was enough to set off two record hot months for May and June and a record hot ocean surface month for July as ocean surface waters remained extraordinarily warm across many regions.
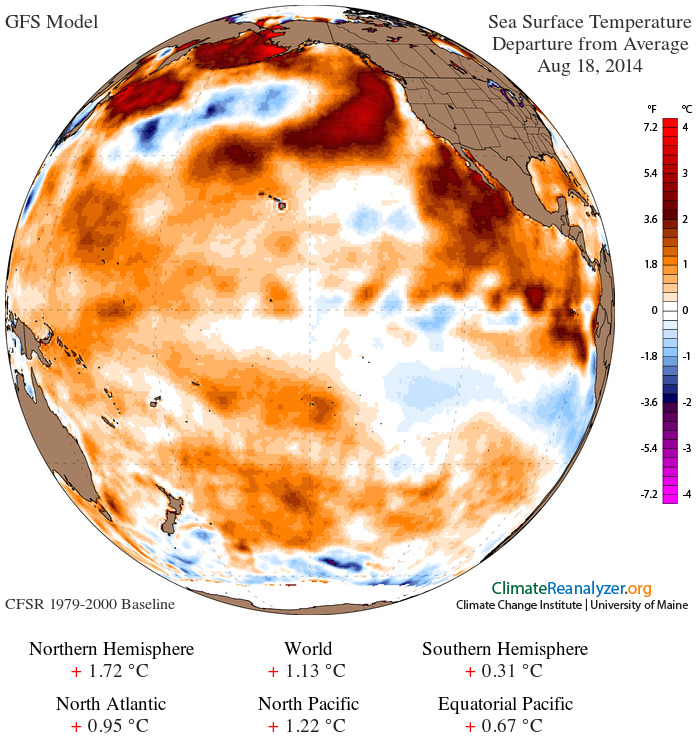
(Ocean surface temperatures remained at or near record hot levels during July and August of 2014 despite a failed El Nino development in the Equatorial Pacific. The above graphic shows global water temperatures for August 18 at an extraordinary +1.13 C above the already hotter than normal 1979 to 2000 average. Image source: University of Maine.)
New Warm Kelvin Wave Begins to Form
Though the atmosphere failed to respond to a powerful Kelvin Wave issuing across the Pacific earlier this year, stifling the development of a predicted El Nino, it appears a new warm Kelvin Wave is now beginning to form. Moderate west wind back bursts near New Guinea initiated warm water down-welling and propagation across the Pacific Ocean during July and early August. The down-welling warmth appeared to link up with warm water upwelling west of New Guinea and began a thrust across the Pacific over the past week.
As of the most recent sub-sea float analysis, anomalies in the new Kelvin Wave ranged as warm as 4-5 C above average:
(New warm Kelvin Wave forming in the Equatorial Pacific. Image source: Climate Prediction Center.)
These sub-sea temps are rather warm for an early phase Kelvin Wave and may indicate another ocean to atmosphere heat delivery is on its way, despite a broader failure of El Nino to form by this summer.
Typically, strong Kelvin Waves provide the energy necessary for El Nino to form. The heating of surface waters due to warm water upwelling in the Equatorial Pacific tends to set off atmospheric feedbacks that perpetuate an El Nino pattern in which waters remain warmer than average in the Central and Eastern Equatorial Pacific for many months. Without these atmospheric responses, El Nino cannot form.
During 2013 and 2014, strong Kelvin Waves forming during spring time were not enough to over-ride prevailing and historically strong trade wind patterns thereby allowing El Nino to emerge.
Atmospheric ‘Hiatus’ is No Halt to Global Warming
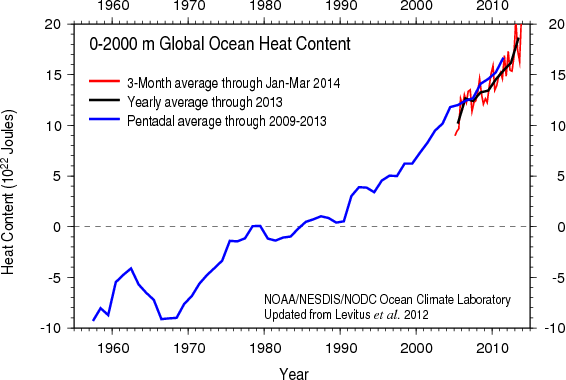
(Global ocean heat content for 0-2000 meters of depth shows inexorable upward trend despite the so-called atmospheric warming hiatus. Image source: NOAA Ocean Heat Content.)
This natural variability, which typically lasts for 20-30 years began around the year 2000 and has continued through 2014. During such periods of negative PDO, we would expect rates of atmospheric warming to cease or even to go slightly negative. Unfortunately, even though PDO has been negative for nearly 15 years, a phase which during the 1940s to 1970s drove 0.35 C of transient atmospheric cooling against an overall larger warming trend, we have still seen atmospheric warming in the range of 0.1 C per decade.
This is bad news. For as ocean heat content is spiking, the transfer from atmosphere to ocean has not been enough to even briefly cut off atmospheric warming. And at some point, the oceans will deliver a portion of their latent heat back to the atmosphere, causing an even more rapid pace of temperature increase than was seen during the 1980s through 2000s period.
In other words, we’ve bent the cycle of natural variability to the point where we see warming, albeit slower warming, during times when we should have seen atmospheric cooling. And all indicators — radiative balance measured by satellite, deep ocean water temperatures, glacial melt, and atmosphere — show ongoing and inexorable warming.
Links:
NOAA’s Climate Prediction Center
NASA: ‘Haitus’ in Global Surface Temperatures Likely Temporary
Share this:

Posted by robertscribbler on August 18, 2014
https://robertscribbler.wordpress.com/2014/08/18/july-2014-shows-hottest-ocean-surface-temperatures-on-record-as-new-warm-kelvin-wave-forms/
Global Sea Surface Temperatures Increase to Extraordinary +1.25 C Anomaly as El Nino Tightens Grip on Pacific
On May 22nd, 2014, global sea surface temperature anomalies spiked to an amazing +1.25 degrees Celsius above the, already warmer than normal, 1979 to 2000 average. This departure is about 1.7 degrees C above 1880 levels — an extraordinary reading that signals the world may well be entering a rapid warming phase.
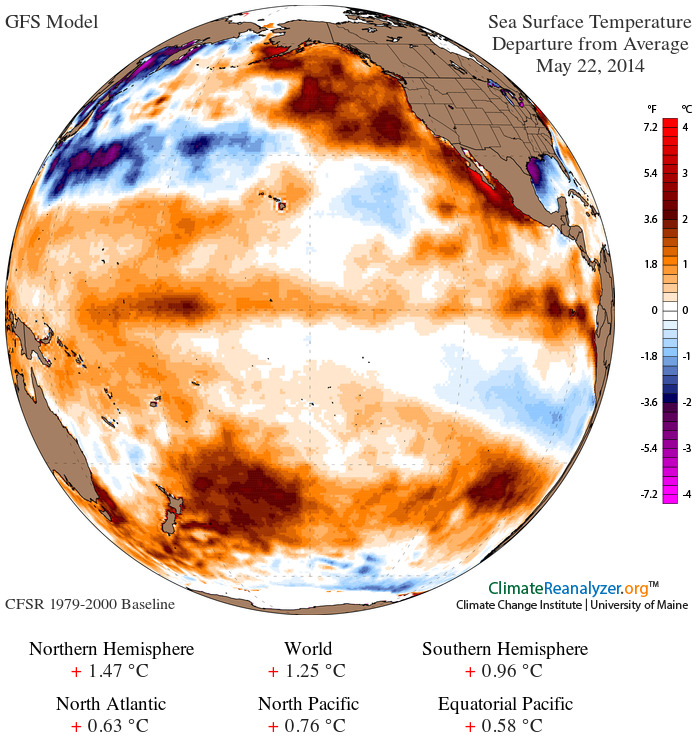
(Global Sea Surface Temperature Anomalies per GFS Model on May 22, 2014. Image source: University of Maine.)
It is very rare that land or ocean surface temperatures spike to values above a +1 C anomaly in NOAA’s Global Forecast System model summary. Historically, both measures have slowly risen to about +.35 C above the 1979 to 2000 average and about +.8 C above 1880s values (land +1 C, ocean +.6 C). But since late April, sea surface temperatures have remained in a range of +1 C above 1979 to 2000 values — likely contributing to NOAA and NASA’s temperature indexes hitting first and second hottest in the climate record for the month. During May, ocean surface heating entrenched and expanded, progressing to a new high of +1.17 C last week. As of this week, values had exceeded +1.2 C and then rocketed on to a new extreme of +1.25 C (See Deep Ocean Warming is Coming Back to Haunt Us).
Should such trends continue, and with little more than a week left for this month, May of 2014 is likely to set a new record for global surface temperatures. And with El Nino continuing to tighten its grip on the Pacific, potentials for new all-time record high global temperatures for 2014 keep increasing.
(NOAA’s Climate Prediction Center found that April of 2014 tied April of 2010 as the hottest in the climate record. During this month, very few regions showed cooler than average conditions for the month while broad swaths of the globe were covered in warmer than average or record warmest temperatures. It is worth noting that 2010 was also an El Nino year. Image source: NCDC.)
Regions currently showing much warmer than normal sea surface temperatures include a broad swath of extreme +1 to +4 C readings from Baja California northwest toward the Bering Sea, an expansive zone of +1 to +3 C readings from the coast of southern South America and across the Pacific Ocean to New Zealand and Australia, almost the entire far South Atlantic between the East Coast of South America and the West Coast of Africa with very hot +1 to +4 C anomalies, almost the entire sea ice edge region in the Arctic with +1 to +4 C readings including a hot spot near the Nares Strait showing extraordinary +3 to +4 C departures, and two large areas of the Equatorial Pacific — one west of New Guinea and the Solomon Islands and the other off the West Coast of South America — showing +1 to +3.5 C departures.
Significant cooler than normal areas are confined to the Northwest Pacific and a stretch of the Gulf of Mexico off Texas. Another cool zone off of Greenland is likely the result of regional surface water cooling due to ongoing and increasing glacial melt, north wind bursts pushing sea ice out of Baffin Bay, and an expanding zone of fresh surface waters flowing from West Greenland into the North Atlantic.
Overall, the global ocean surface is very, very hot, likely near or above all-time record high temperature departures.
El Nino Continues to Tighten Grip on Pacific
Trends toward El Nino continued in the Pacific with the current strong, high-temperature Kelvin Wave persisting through its upwelling phase. By May 18, +3 C or higher temperatures had reached the surface off Western South America with +4, +5 and +6 C readings only about 25-60 meters below. Upwelling from 140 East Longitude to 130 West Longitude and down-welling off the coast of South America also continued to flatten the 20 C isotherm, providing a west-to-east pathway for warm water propagation.
(May 18 Kelvin Wave Monitoring by NOAA’s Climate Prediction Center.)
Over the past week, Nino zones showed either maintained temperatures, very slight cooling, or surface temperature increases. The Nino 4 zone in the Central Pacific remained at +0.8 C even as the key Nino 3.4 zone in the East-Central Pacific showed slight cooling to +0.4 C. Nino 3 in the Eastern Pacific continued to warm, hitting a +0.6 C positive anomaly. Meanwhile, readings directly off the coast of South America rose to a rather high value of +1.3 C.
Trade winds remained weak or ran west-to-east along the equator. Though no strong counter-trade west winds were visible over the past seven days, numerous areas of weak west winds emerged. Overall, the trades in this large zone were confused and erratic, harried by the development of low pressure system after low pressure system along the equator.
These conditions show an ongoing trend toward an ever-more-likely El Nino by Summer-to-Fall of this year. Sea surface and near surface heat content at high to very high levels during the ‘cool’ upwelling phase of the current Kelvin Wave hint at a Pacific Ocean prepping for a strong El Nino event should favorable weather conditions continue. Extraordinary global sea surface temperature departures in the draw up to this potentially severe event show how sensitive the global system is to any El Nino type warming or movement toward a change in Pacific Ocean temperature states.
In short, global temperatures appear to be on a hair trigger to rise.
Links:
Deep Ocean Warming is Coming Back to Haunt Us
NOAA’s National Climate Data Center
Share this:

Posted by robertscribbler on May 22, 2014
https://robertscribbler.wordpress.com/2014/05/22/global-sea-surface-temperatures-increase-to-extraordinary-1-25-c-anomaly-as-el-nino-tightens-grip-on-pacific/
Ocean Heat Spikes and Atmospheric Rivers: Two Thousand Homes Destroyed in North Afghanistan Floods
The ocean-atmosphere system might well be described as an intricate pirouette between the forces of heat and moisture. Warming and cooling over the ocean and atmosphere alter the rate at which rains fall or lands dry. This interplay, called the hydrological cycle, is a primary governor the world’s weather, playing an integral part in both storm formation and dry spells alike.
As the Earth has warmed by about .8 degrees Celsius since 1880, this cycle of evaporation and precipitation, of drought and deluge at the extremes, intensified by about 6% on average. But this increase was uneven, pushed to even greater abnormalities when both the Earth’s atmosphere and ocean surface experienced periods of either strong warming or relative cooling. It was from this combined uneveness and overall warming trend which arose a number of increasingly severe and dangerous weather events.
Most recently, on April 22nd, global ocean surface temperatures hit a very high +1.12 degrees Celsius above average temperature anomaly (vs the 1979 to 2000 average). This warm pulse pumped both heat and moisture into the world climate system. During recent years, major ocean warming episodes have coincided with intense periods of extreme rainfall and drought around the globe. So when anomalies hit severe levels last week, risks rose that atmospheric rivers of moisture and related extreme rainfall events would intensify.
By April 24, two entrained storm systems had erupted from the much hotter than normal Mediterranean Sea casting their long, dark shadows over Western and Central Asia as they began a tortuously slow march toward North Afghanistan:

(Entrained storm systems which produced the Afghanistan Floods on April 24, 2014. Afghanistan is beneath the hurricane-like swirl of cloud in the lower right image frame. Note the second entrained storm system just west of the Black Sea. Image source: LANCE-MODIS.)
The result was a three-day-long rain event that destroyed over 2,000 homes in North Afghanistan impacting 10,000 families and resulting in the loss of 180 souls. Severe losses also extended to crops and livestock over a broad region of this Central Asian state as victims were forced to abandon farms and villages.
The inundation left many besieged by a violent swirl of raging waters spurring Afghanistan security forces to activation as helicopters were used to ferry stranded people to higher ground. Jawzjan provincial police chief Faqer Mohammad Jawzjani made this plea as the most recent Afghanistan weather disaster stretched resources to their limits:
“We have carried 1,500 people to safe areas of neighboring districts by helicopter. We need emergency assistance from the central government and aid agencies.”
Jawzjani’s pleas for assistance were echoed by local government officials throughout the stricken region as many more people remained isolated and without immediate help.
Afghanistan’s rugged terrain is particularly vulnerable to intense rain events. High volumes of rainfall channel through steep ravines and build up into large, wave-like flood pulses in Afghanistan’s heavily populated valleys. Low-lying homes constructed of mud and rock also often lack resiliency and are in danger of either collapse or inundation during severe storms.
As the Earth continues to warm under a relentless human greenhouse gas forcing, it is likely that both severe drought and rainfall events will continue to grown in frequency and intensity. Unfortunately, it is those who are most vulnerable — the poor and those who have contributed the least to the rapidly intensifying climate shock — who will bear the first and heaviest impacts.
Links:
Flash Floods Kill More Than 100 in Northern Afghanistan
How Global Warming Mangles the Jet Stream and Amps Up the Hydrological Cycle
Ocean Temperatures Hit Extraordinary +1.12 C Temperature Anomaly on April 22
Hat tip to the ever-vigilant Colorado Bob
Share this:

Posted by robertscribbler on April 28, 2014
https://robertscribbler.wordpress.com/2014/04/28/ocean-heat-spikes-and-atmospheric-rivers-two-thousand-homes-destroyed-in-north-afghanistan-floods/
Doomed Pine Island Glacier Releases Guam-Sized Iceberg into Southern Ocean
Science has confirmed it. Human-caused warming is killing Antarctica’s massive Pine Island Glacier (PIG). And this week’s release of a chunk of ice larger than Guam into the southern ocean is just one of the many major losses that will occur as part of what is now an inevitable demise of one of the world’s greatest glaciers.
(CNN provides this stunning NASA imagery sequence of the break-off of B-31, a 12×24 mile iceberg from the, now doomed, Pine Island Glacier.)
Heat-Charged Blow to The Soft Underbelly of Antarctic Ice Shelves
As human greenhouse gas emissions caused the world’s oceans to warm, upwelling currents delivered a portion of that heat to the continental shelf zone surrounding Antarctica. A fortress of ice, numerous glacial ice shelves thrust out from this frozen land and drove deep into the sea floor. Ocean-fronting glaciers featured submerged sections hundreds of feet below the sea surface.
The warming currents encountered these massive ice faces, eroding their undersides and providing pathways for ocean waters to invade many miles beneath the glaciers. These invasions subjected the vulnerable ice shelves not only to the heat forcing of an ever-warming ocean, but also to wave and tidal stresses. The reduction in grounding and the constant variable stresses set the glaciers into a rapid seaward motion.
Antarctica’s most vulnerable glaciers lie along its western out-thrust. Two, Thwaites and the Pine Island Glacier, have recently seen very rapid increases in forward speed. Of these, the Pine Island Glacier, according to a recent study, is undergoing the process of an irreversible collapse. What this means is that the glacier’s speed of forward motion is now too great to be halted. Inevitably, even if the climate were to cool, the entire giant glacier will be launched into the world’s oceans where it will entirely melt out.
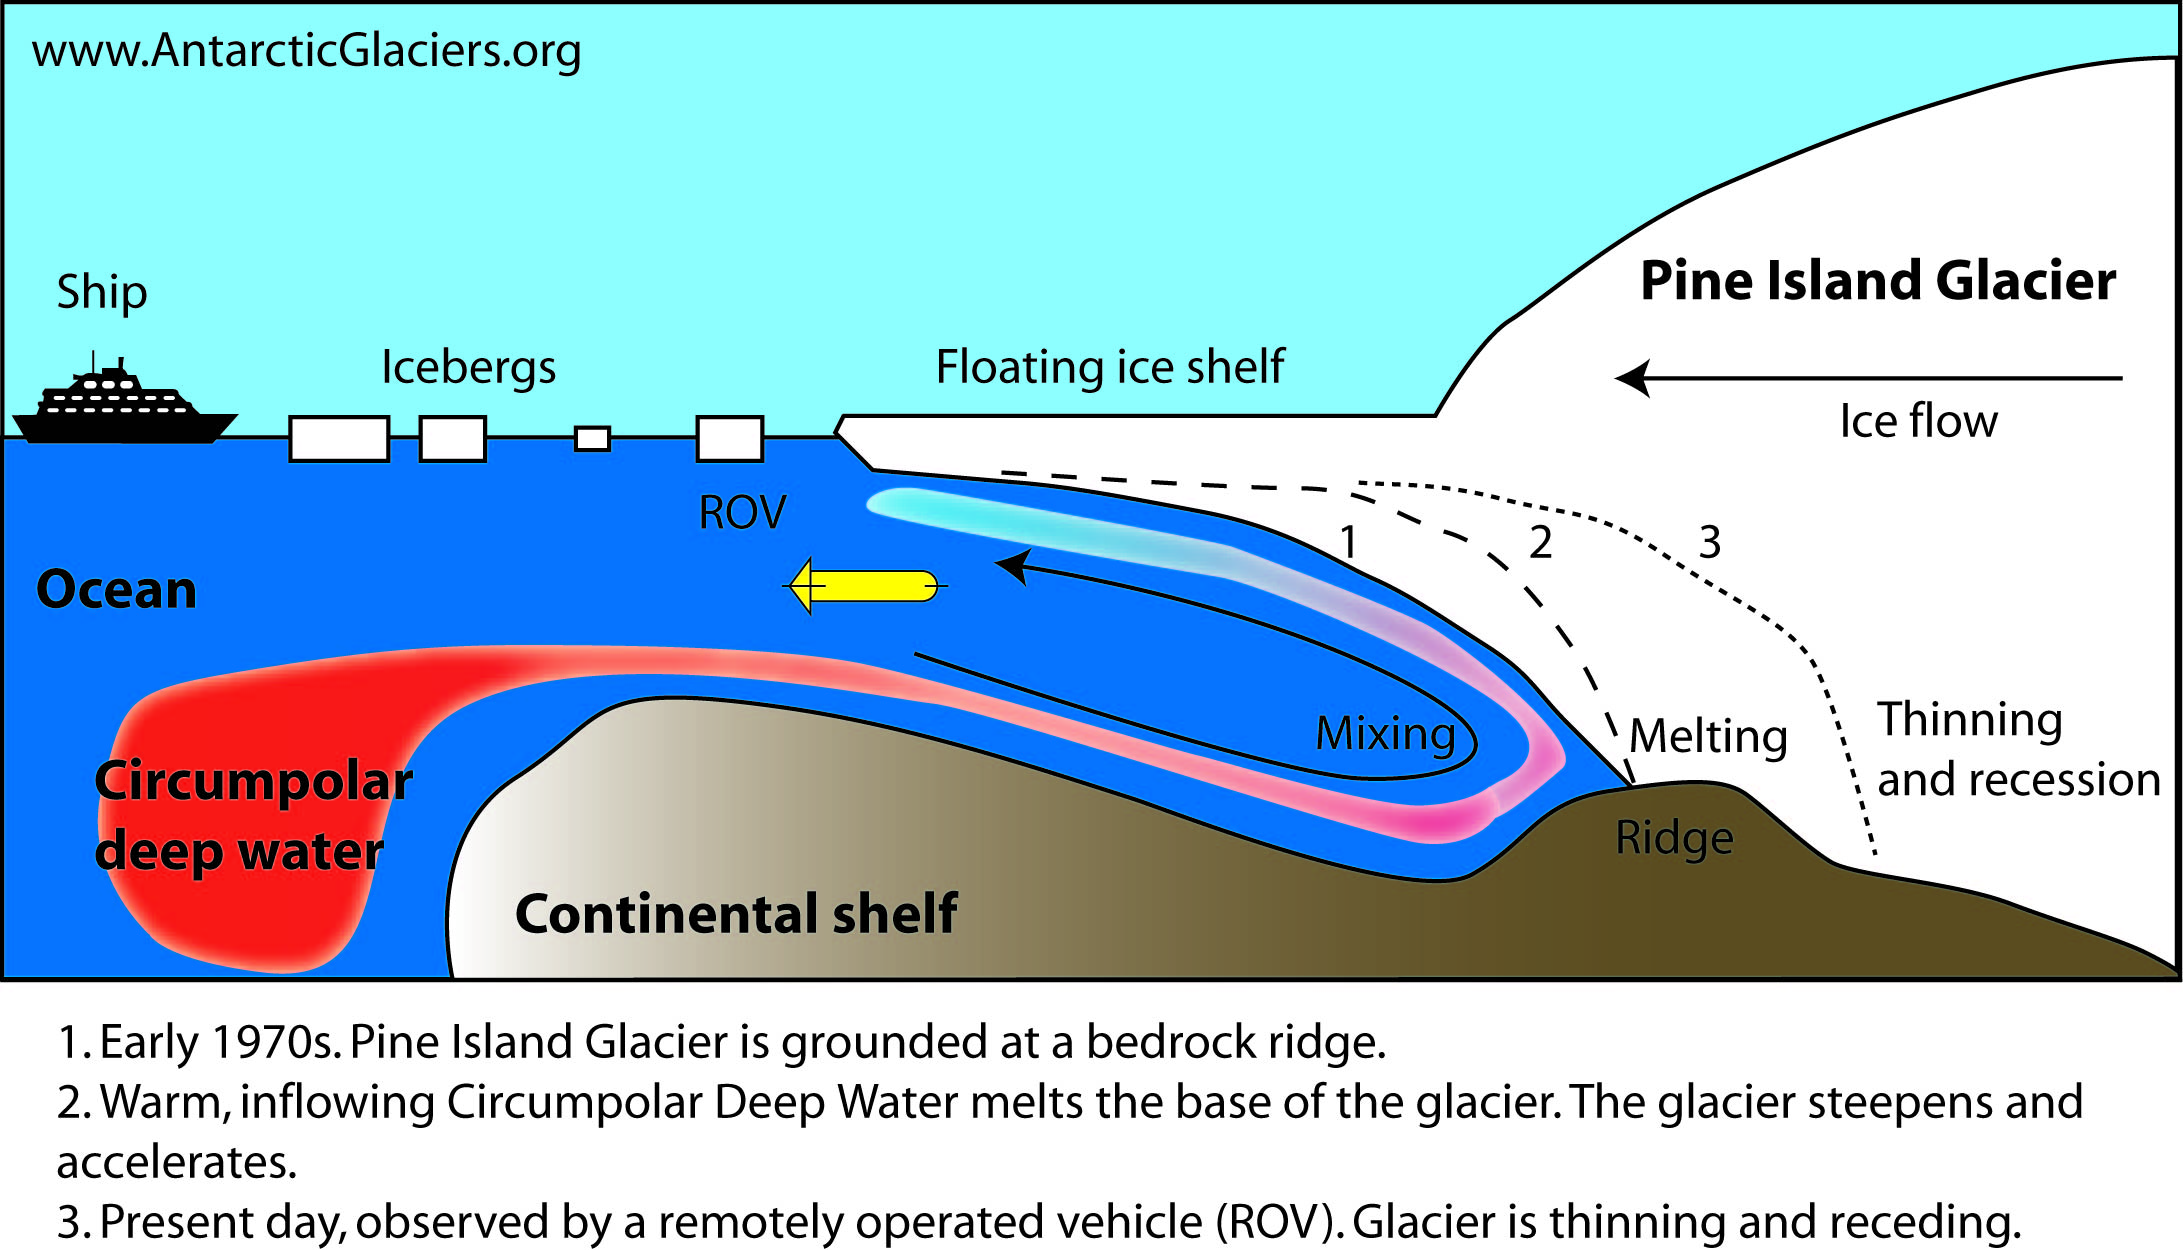
(Pine Island Glacier underwater melt dynamics. Image source: Nature)
Guam-Sized Chunk of Ice to be One of Many
The Pine Island Glacier is massive, covering a total area of 68,000 square miles and, in some locations, rising to over 2,000 feet in height. It represents 10% of all the ice in the West Antarctic Ice Sheet, holding enough liquid water to raise sea levels by between 1 and 2.5 feet all on its own. And the now destabilized PIG is bound to put added stresses on the adjacent Thwaites glacier together with almost the entire West Antarctic ice system.
Over recent years, PIG’s forward speed has accelerated. Increasing forward velocity by 73 percent from 1974 to 2007. Surveys made since that time show an even more rapid pace. By January of this year, studies were finding that PIG had entered a sate of irreversible collapse. So it is little wonder that enormous chunks of ice are breaking off from this massive glacier and drifting on out into the Southern Ocean.
As of early this week, the immense ice island dubbed B31 measuring 12×24 miles in size (nearly 290 square miles), slid off its temporary grounding on the sea bottom and began its journey out into the Southern Ocean. There it will remain for years, plaguing the world’s shipping lanes as it slowly disintegrates into a flotilla of icebergs. It is just the most recent event in the now ongoing decline of PIG. And we can expect many, many more major ice releases as this vast Antarctic glacier continues its dive to the sea.
Links:
Humongous Iceberg Slowly Drifts Away From Antarctica
Scientists: Warming Ocean, Upwelling Make an End to Antarctica’s Vast Pine Island Glacier
Retreat of Pine Island Glacier Controlled by Marine Ice Sheet Instability
Hat tip to Colorado Bob who’s been tracking PIG since 1994
Share this:

Posted by robertscribbler on April 24, 2014
https://robertscribbler.wordpress.com/2014/04/24/death-throes-of-pine-island-glacier-release-guam-sized-iceberg-into-southern-ocean/
2013 4th Hottest Year on Record, Deep Ocean Warming Fastest, NASA, NOAA Find No Pause in Long-Term Warming Trend
(Global temperature anomalies for 2013. Image source: NOAA)
With the readings coming in for 2013 — atmosphere, ocean surface and the deep ocean — it becomes increasingly obvious that anyone saying planetary warming has slowed down is clearly misinformed.
Criticisms of the misinformed aside, according to reports from NOAA’s National Climate Data Center, 2013 was the world’s 4th hottest on record since temperature measures began in 1880. All this despite ENSO conditions remaining neutral in the Eastern Pacific and deep ocean heat content continuing to rapidly rise while sucking a portion of that heat out of the atmosphere.
The NCDC measure found numerous regions in which temperatures were the hottest ever recorded including a large swath of Australia, a broad stretch of the Pacific Ocean adjacent to New Guinea and the Philippines, an area larger than Texas at the heart of the Asian Continent, and multiple other locations ranging from south of Svalbard to East Africa to the Indian Ocean to the Northern and Southern Pacific. Aside from these record hot zones, over 70 percent of the land and ocean surface measured came up either hotter than average or much hotter than average while 28% of the globe experienced average temperatures and less than 2% of the Earth’s surface experienced cooler than average temperatures.
Notably, no regions of the globe saw record coldest temperatures and the only zone coming up cooler than normal cropped up in the Southern Ocean just north of Antarctica.
NASA found 2013 to be the 7th hottest on record and the 2nd hottest non El Nino year on record.
Helpfully, NASA also put together a graph of global temperature averages as measured since 1950 showing that atmospheric warming has continued unabated despite much false and inaccurate press coverage of a ‘global warming hiatus.’
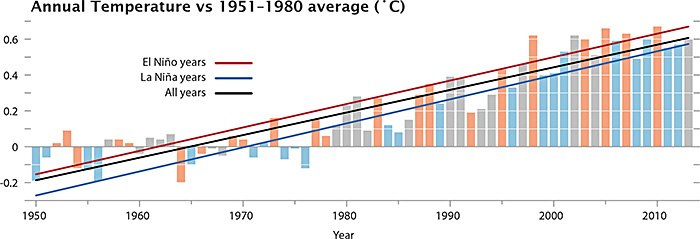
(GISS temperature measurements with trend lines for El Nino, La Nina and all years. It’s worth noting that this temperature graph indicates no pause in warming since 1950. Instead, what we see are inexorable global surface temperature increases. Image source: NASA GISS)
Deep Ocean Warming Measures Far More Dire
Recent news reports have also falsely claimed that more heat going into the deep ocean, as measured by NASA, NOAA, the Trenberth study, and others, is an indication of lowered global climate sensitivity. To the contrary, a warming ocean contains two very dire consequences that, if set into play, could both enhance warming, and create an ecological nightmare for first the oceans and finally the surface world.
The first, a growing risk of subsea methane release, is greatly enhanced by a rapidly warming ocean. We have covered the risks and consequences of methane release (both seabed and terrestrial methane) in numerous posts over the past year. For your convenience I’ve linked them below. But, suffice it to say that a warming ocean puts at risk the more rapid release of hundreds of gigatons of methane, an amount that could greatly amplify the already powerful and ongoing signal of human warming. More worrisome, initial indications show that at least some of this methane is already destabilized and venting into the world ocean system and atmosphere.
The second consequence involves growing ocean hypoxia and anoxia as the oceans warm, become more stratified and as major ocean current systems are disrupted and altered. Growing ocean hypoxia and anoxia results in, among other terrible impacts, ocean sea bottoms that are less and less able to support a diversity of life and that, more and more, come to support dangerous hydrogen sulfide producing bacteria.
A third consequence includes the basal melting of ocean contacting ice sheets. Such melting has already destabilized the massive Pine Island Glacier which, according to a recent scientific study, is on the path to an inevitable collapse into the Southern Ocean.
Yet, according to these excellent graphs produced by Larry Hamilton for The Arctic Ice Blog, world ocean heat content has been rising by leaps and bounds over the past few years, especially in the deep ocean where warming puts at risk the most dangerous of outcomes — methane release and anoxia.
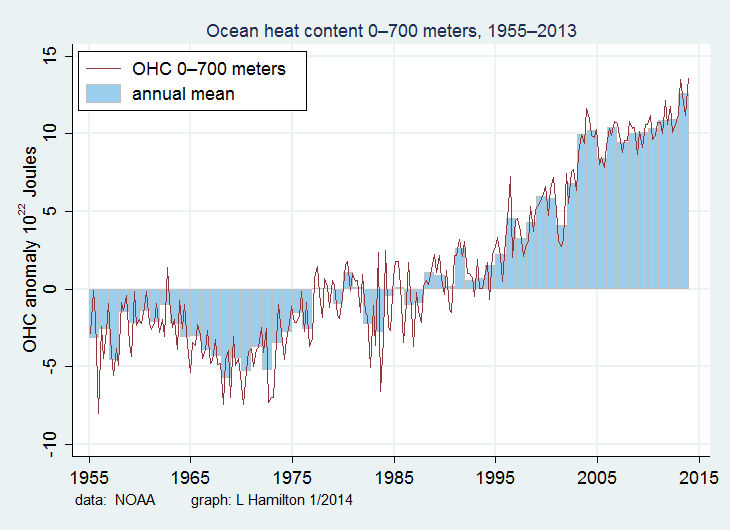

(Image source: L Hamilton. Image data: NOAA. Produced for The Arctic Ice Blog. Note the extraordinarily steep slope indicating deep ocean warming since 1985.)
The top graph shows ocean heat content increases in the first 700 meters of ocean water. The bottom graph shows ocean heat content in the first 2000 meters of ocean water. Note that ocean heat content gains for the deep ocean (2000 meter graph) are more rapid by 25% than heat content gains in the shallower ocean. Meanwhile, both graphs show a very rapid accumulation of heat, especially through recent years during which the so-called global warming hiatus was in effect.
If we could find a place to put the majority of heat from human-caused climate change, the deep ocean would be the last place any sane ecologist would look. Warming the deep ocean is a worst-case disaster in the making. It puts added stress on methane hydrate stores and it pushes the very dangerous consequences of ocean stratification and anoxia along at a much more rapid pace.
These are not optimistic measures. In my view, this is much closer to an absolute worst case.
Mixed Outlook for 2014
Early indications for 2014 show an increased chance of La Nina for the first three months of the year. That said, ocean surface heat in the Eastern equatorial Pacific appears to be on the rise, especially in areas closest to coastal South America.
(Image source: NOAA)
Should ENSO tip the scale to El Nino, it is almost certain we will see a hottest year on record for surface temperatures during 2014. Should conditions remain neutral or tip to La Nina, we’ll still likely experience a top ten hottest year on record (atmosphere) even as ever more heat is transferred to the deep ocean.
Links:
NASA Finds 2013 Sustained Long-Term Warming Trend
National Climate Data Center Global Analysis
Larry Hamilton CA The Arctic Ice Blog
The Arctic Methane Monster Continues its Ominous Rumbling
Arctic Methane Monster Shortens Tail
The Arctic Methane Monster Stirs
Through the Looking Glass of the Great Dying
Awakening the Horrors of the Ancient Hothouse — Hydrogen Sulfide in the World’s Warming Oceans
Warming Ocean, Upwelling to Make an End to Pine Island Glacier
Share this:

Posted by robertscribbler on January 22, 2014
https://robertscribbler.wordpress.com/2014/01/22/2013-4th-hottest-year-on-record-deep-ocean-warming-fastest-nasa-noaa-find-no-pause-in-long-term-warming-trend/
Worst Heatwave in 140 Years Turns Deadly After Scorching China for More than a Month; Forecast Predicts No Relief
Heatwaves — they’re a regular risk of summer. But this year has seen a rash of particularly vicious and anomalous instances. As the Arctic baked under numerous heatwaves in which temperatures shattered the 90 degree (Fahrenheit) mark, as the US experienced some of its worst southwestern heat ever recorded, as the UK experienced record summer heat and wildfires, and as Spain sweltered as temperatures soared above 40 degrees C (above 104 F), China was experiencing its own version of a global warming amplified scorcher.
The worst heatwave in 140 years smothered about 1/3 of China, a sprawling area covering about 3 million square miles. At the heat epicenter, Shanghai, a region inhabited by 23 million people, saw daytime temperatures above 35 degrees C (95 F) for more than 25 days during July of 2013. On July 26th, Shanghai experienced an all-time record high of 106 degrees Fahrenheit (42 C), a level not reached since record keeping began in 1873.
Shanghai also reported ten deaths and far more numerous heat injuries for the month, as the hot weather intensified this Wednesday, while dozens of deaths have been reported over a large, scorched area of south-coastal China.
Throughout this week, China has been issuing its second highest national heat alert. This level requires the establishment of a 24 hour emergency operations center in order to provide emergency response and support capabilities for the hardest hit areas. The highest alert level is so extreme that China has never used it. Unfortunately, as the human-caused warming trend continues, it seems ever more likely that such a high heat category will have to be put in use.
Those living in Hangzhou, a region located about 100 miles to the southwest of Shanghai, may have already thought officials should have used such a marker as temperatures soared to above 104 degrees Fahrenheit (40 degrees C), for six out of seven days over the past week. Meanwhile, Xiaoshan saw a new all-time record high temperature of 108 degrees Fahrenheit (42.2 degrees C) on Tuesday. The coastal city of Ningbo saw temperatures hit 109 degrees F on July 26th, the highest temperature ever recorded for a coastal city in all of South-East Asia.
In what has become a kind of macabre ritual in widening areas of the world affected by extreme heat, Chinese residents laid out shrimp and eggs to fry over scorching road surfaces. More ominously, the extreme heat threatened crops even as it baked rivers and lakes setting off massive fish kills from heat and anoxia. In some regions, the fish kills were so extreme that an estimated 60 percent of all fish were lost (normal summer heat may result in 5-10 percent fish losses in affected regions).
In order to protect crops and fish, China has engaged in a cloud seeding effort in hopes of spurring rainfall over scorched areas while it is urging localities and fish farmers to pump new water into ponds and rivers to enhance oxygen levels and reduce fish losses.
Heat dome, coastal flow, very high wet bulb temperatures
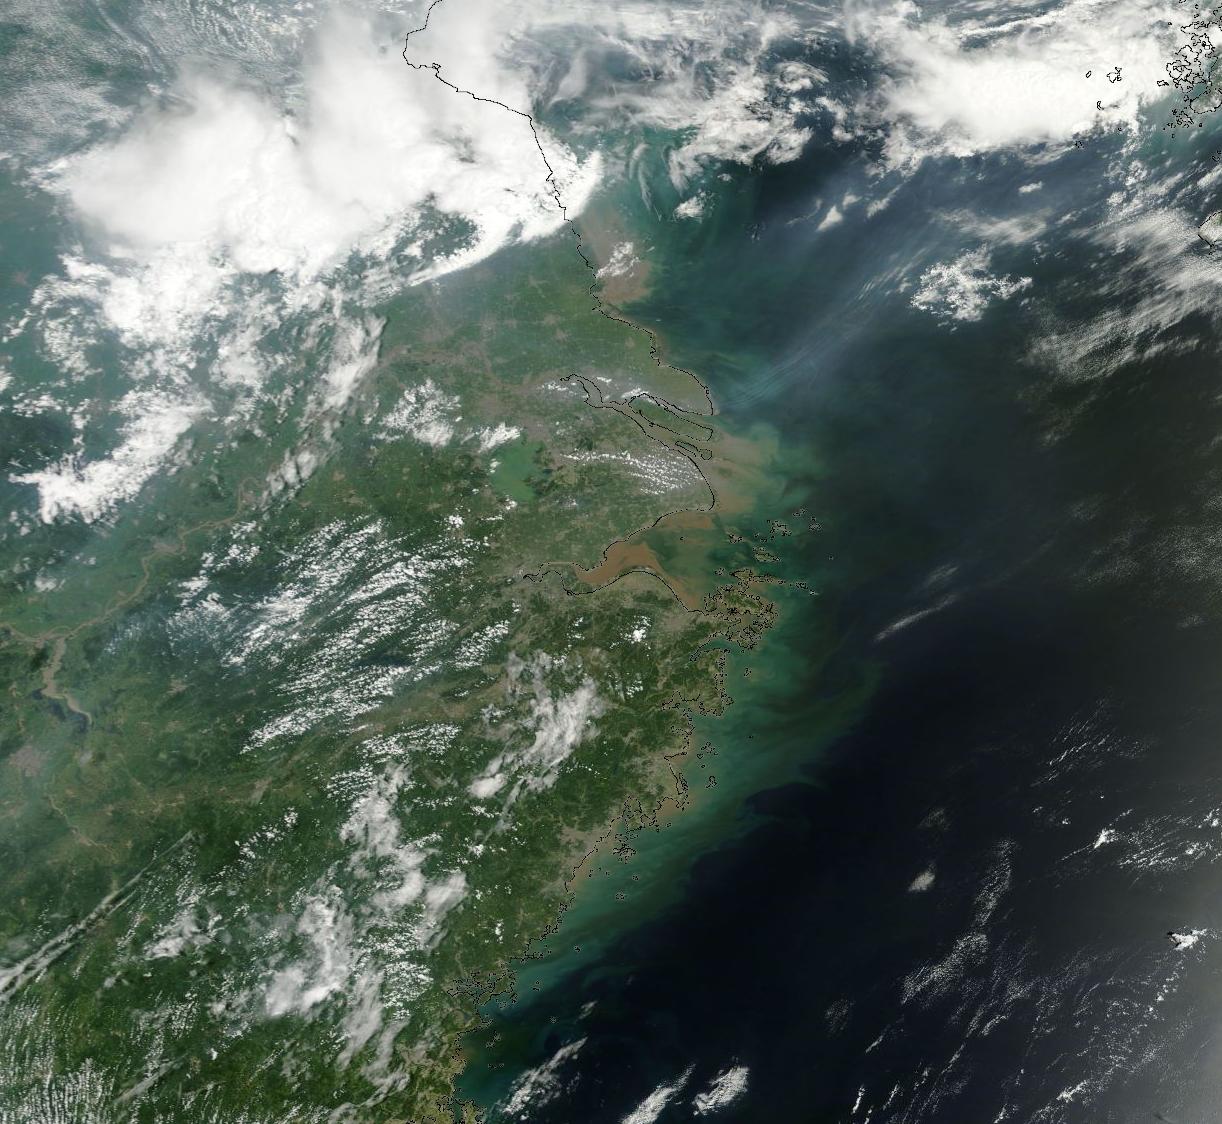
Coastal region of China hardest hit by heat wave.
(Image source: Lance-Modis)
A dome of hot, moist air has persisted over this region for nearly a month now. Though rainfall and even flooding events have occurred due to a flow of Pacific moisture over the area and the occasional onrush of tropical cyclones, these rainfall events have done little to alleviate a combination of oppressive heat and humidity.
Flows off the ocean would normally help to somewhat alleviate the heat, but an area of typically hot summer water is now showing readings 1-2 degrees Celsius above average. This broad region of hotter than normal surface ocean waters off China now show temperatures higher than 30 degrees Celsius (86 degrees Fahrenheit). Windflows issuing off these extraordinarily hot ocean surface areas are not very helpful in cooling the baking land. Worse still, the heat dome conditions — stifling airflow, concentrating heat and locking in place a layer of heat amplifying haze and smog — have persisted for much of the past month. This combination of less effective ocean cooling and heat dome conditions has resulted in a terribly severe heatwave for this coastal region.
Coastal heatwaves are particularly oppressive and potentially lethal due to the fact that humidity tends to remain higher than in more arid regions. A wet bulb temperature above 35 degrees Celsius (95 Fahrenheit) is considered lethal for human beings. Those living in Southeast Asia are well used to living under sweltering conditions of high heat and humidity. But as temperatures approach this human threshold (25 C + wet bulb temperature), even those acclimated are at increased risk. So both extreme heat and high humidity likely contributed to the sad and tragic dozens of instances in which lives were lost during this particular event.
The forecast for Shanghai next week calls for continuing record heatwave conditions with high temperatures ranging from 99 to 102 degrees (Fahrenheit) from Sunday through Saturday. With humidity levels near 50% this means wet bulb temperatures will approach 29-30 degrees Celsius during the hottest portions of the day. This continuation of a scorching summer heat wave will result in high risk of both heat injury and loss of life for those living in this sweltering region. With little to no relief in the forecast, this section of China is likely to remain under the fire of human-caused heating as August advances.
Links:
People Crops and Fish Suffer in China’s Heat Wave
Dozens of Deaths Blamed on China’s Heat Wave
Heat Wave Blamed for Huge Pile of Dead Fish
Share this:

Posted by robertscribbler on August 2, 2013
https://robertscribbler.wordpress.com/2013/08/02/worst-heatwave-in-140-years-turns-deadly-after-scorching-china-for-more-than-a-month-forecast-predicts-no-relief/
Total Measure of Human Warming: Heating Atmosphere, Warming Oceans, and Melting Ice
(Our thoughts and prayers go out to the residents of Moore, Oklahoma and to all the other 30 million people rendered homeless by an expanding series of weather emergencies across the globe.)
Human caused warming is a global impact. It heats the atmosphere, it melts ice, and it warms the oceans. Yet, often, we find ourselves squabbling with an increasingly inane, irate and out of touch set of climate change deniers over one third of this equation: atmosphere. And even though evidence of inexorably increasing atmospheric temperatures, worldwide, is enough to bury any climate change contrarian under a mountain of facts almost as large as the 800 cubic kilometers of ice that melted from Greenland last year, it is still worthwhile to look at all these systems and see how they are responding to human warming.
CO2 Rise
This week, CO2 levels averaged just a hair shy of 400 parts per million, a level not seen since the Pliocene, 2-4.5 million years ago. During this time the atmosphere was much warmer, there was much less ice, and ocean levels were much higher. Long-term, if atmospheric CO2 levels remain at 400 parts per million or higher, the least we can expect is about 3-4 degrees Celsius of warming, almost all Arctic ice gone, and sea levels about 75 feet higher than they are today.
CO2 is the most powerful long-term governor of atmospheric temperature. It has been compared to the control nob on the Earth’s global thermostat by atmospheric scientists. In the past, as CO2 rises, so does global temperature. If CO2 falls, so does temperature. If there’s no CO2 in the atmosphere, all water vapor falls out and freezes, leaving Earth as a snowball. If most of the atmosphere was composed of CO2, Earth would look a lot more like Venus. So, in short, it’s established that rising CO2 means increased warming.
What’s most important to our current exploration is that CO2 levels are rising. And what that means is one thing — the Earth will warm. How will this happen? The atmosphere will heat up, the oceans will warm, and ice will melt.
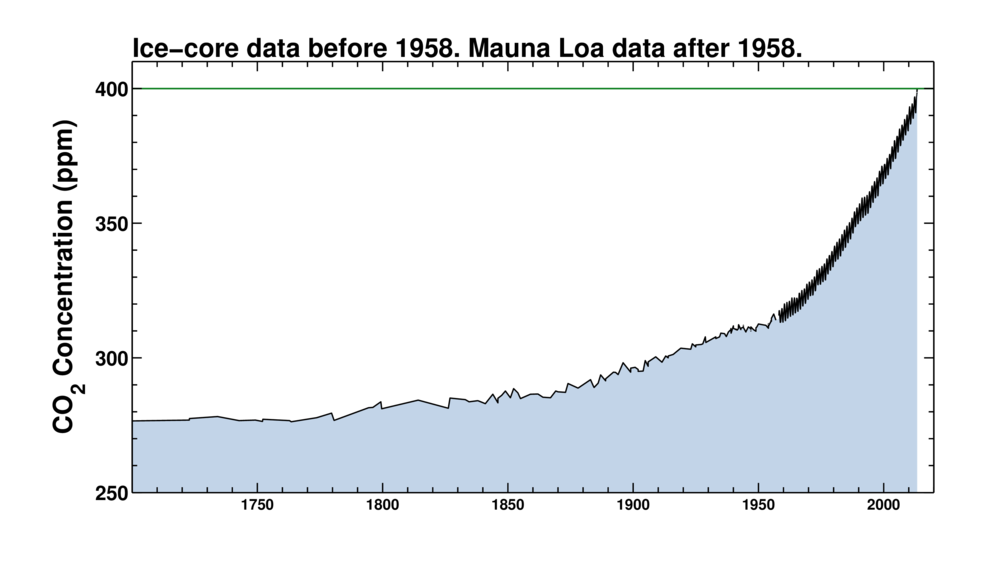
(Image source: Keeling Curve)
In the above graph, we can get an idea of how much and how rapidly CO2 has risen over the past 300 years. In the 1700s, human carbon emissions were much less than today. England was one of the only countries involved in wide-scale use of the fossil fuel — coal. So CO2 levels remained about at a level equal to past inter-glacial of around 275 parts per million — a level that had been steady for over 10,000 years. Then, in the 1800s we began to see a gradual rise in world CO2 levels. Over the course of one century, CO2 increased from 275 to 290 parts per million as industrialization began to ramp up and use of fossil fuels became more wide-spread. This increase of about 15 parts per million CO2 over the course of a century was already about as fast as anything that had ever occurred in the geological past. If sustained over centuries, such a rate would be enough to push a powerful warming. But what happened next was catastrophic.
In the 20th century, worldwide CO2 went from about 290 parts per million in 1900 to around 375 parts per million in the year 2000. This rise of 85 parts per million over the course of a century was much faster than any rise in CO2 previously detected by scientists. What it represented was a powerful forcing pushing the world’s atmosphere, oceans, and ice sheets to ever greater levels of warming.
By the turn of the century, this increase in CO2 had already set off at .6 degree Celsius increase in global land and ocean temperatures, pushed the recession of a majority of glaciers around the world, caused sea ice area, volume and extent to begin to fall off, and set Greenland and Antarctica to melting. This initial punch was just the opener for a long age of Earth changes that were a result of human-caused climate change.
In the first 12 years of the new century, world CO2 levels continued to rise at ever-increasing rates. About another 25 parts per million CO2 was added to the global total and we are now poised to break the 400 part per million threshold. At this stage, land and ocean surface temperatures have risen by about .8 degrees Celsius, 9 out of ten glaciers in the world are receding, the rates of ice melt from Greenland and Antarctica are accelerating, and Arctic sea ice volume has declined by more than 80%.
Energy Imbalance
The power of CO2 to govern Earth’s temperature and, by extension, climate, rests in its heat-trapping characteristics. So as CO2 concentrations in the atmosphere have dramatically risen, the heat trapping characteristics of the Earth’s atmosphere have also increased. The result is that more of the sun’s radiation is being absorbed by the Earth than is being reflected back into space. This characteristic is called an energy imbalance.
Over time, this imbalance will be resolved by Earth warming, which will result in more radiation being sent out into space and equilibrium will again be achieved once a higher temperature is reached. Currently, the energy imbalance of the Earth is about .6 Watts per meter squared or enough to warm the Earth by about another .5 to .7 degrees Celsius before reaching equilibrium. So, in total, given the current energy state of the Earth’s atmosphere, we have at least another .5 to .7 degrees Celsius locked in over the next couple of decades even without further greenhouse gas emissions or the contribution of a number of amplifying feedbacks.
Heating the Atmosphere and Ocean Surface
The re-balancing of Earth’s energy will result in heating the atmosphere, warming the oceans and melting ice in the form of glaciers, ice sheets, and sea ice.
The first element, a warming atmosphere and a heating of the ocean surface has been well documented. As CO2 concentrations rose, atmospheric and ocean surface temperatures also rose. You can see this dramatic increase in global temperatures by looking at the following graph:
(Image source: GISS)
In short, rising levels of CO2 in the atmosphere continued to force global temperatures higher until they finally reached a .8 degree Celsius increase over the 1880s. This surface temperature increase is a powerful visible sign of global warming caused by human activity.
To wit, an increasing number of climate change deniers and contrarians are trying to argue that human caused global warming has stopped. To support this conclusion, they point to a ‘plateau’ in atmospheric temperature increases occurring over the last five years. To do this, they must ignore the fact that 2010 was the hottest year on record even as they continue to cherry pick data to support some rather obviously skewed conclusions. Others have claimed, using a curve fitting analysis that is unsupported by scientific evidence, that global temperatures will continue to plateau until 2040 when Earth will undergo another step increase to higher atmospheric temperatures. With forcing so high and greenhouse gasses increasing at such a rapid rate, such a conclusion is difficult to support without major ocean heat uptake or extraordinarily rapid melt of glaciers, sea ice, and ice sheets.
Even if such an event, however unlikely, were to happen, it would not signal that the Earth is cooling. A pause in atmospheric warming while the oceans continued to heat up and ice continued to melt does not a cooling world make. In order for the ‘cooling’ contrarians claim to be established, you would have to see a combination of atmospheric cooling, ice increase, and ocean cooling. In truth, what is happening and what continues to happen is exactly the opposite.
The larger fact is that the atmosphere is warming, remains at record high temperatures, and that Earth’s energy system remains out of balance even as CO2 levels increase. The result is that atmospheric temperatures will continue to increase as time moves forward. Most likely, the next El Nino year will break the record set just three years ago in 2010.
Warming Oceans
That said, it is worth noting that the lion’s share of CO2 forcing goes to work warming the world’s oceans and melting the world’s ice. As a result, atmospheric temperature measurements only take account of the tip of the human global warming ice burg.
The reason for this is that interplay between the Earth’s atmosphere and the ocean surface, heat transport of atmospheric heat through the surface and into the middle and deep ocean, and evaporation of water all serve as heat uptake processes that are not accounted for in the atmospheric temperature readings. So if you want to get a better idea of how rapidly the Earth is warming, you also need to take into account ocean heat content.
Until recently, there were very few comprehensive studies of ocean heat content. So most warming studies took into account only atmospheric heating alone. However, recent studies by Magdelena Balmaseda, Kevin Trenberth and others have opened a new field of middle and deep ocean heat measuring providing yet another overwhelming volume of evidence pointing toward a rapidly warming world.

(Image source: Balmaseda/Trenberth Study)
The above graph shows a very rapid ocean heat content uptake occurring in the period of 2000 onward. As a result, a greater portion of the world’s warming ended up in the oceans even as atmospheric temperatures continued to move higher. It shows an increasing pace of transfer of heat from the atmosphere to the ocean — a result of a steadily strengthening CO2 forcing.
When combined with atmospheric warming, these measurements show a powerful warming effect both on the atmosphere and on the ocean. The result is that it appears both are warming in steps.
One interesting point to make is that during the 1990s, the Earth’s atmosphere appeared to warm rapidly while ocean warming slowed. During the 2000s, the pace of atmospheric warming tended to be slower while ocean warming speeded up. It is likely that the pace of ocean heat uptake has a direct impact on the atmosphere and that these systems are involved in a complex dance as Earth warms.
For a long time, ocean turnover has been seen as a system that could slow global atmospheric temperature increases. Yet this inertia comes at the cost of more ocean evaporation. The result is that more water vapor ends up in the atmosphere. And since water vapor is a powerful greenhouse gas, the longer term effect would be greater warming. More ominously, warming oceans house a large volume of methane hydrate. In a world of warming oceans, a portion of this gas, now locked in icy formations on the ocean floor, is likely to be liberated. Since methane is a powerful greenhouse gas, its liberation will likely combine with increasing water vapor to push atmospheric warming higher.
Ocean turnover, heat absorption and warming, therefore, should best be seen as an inertia that, over the course of decades, has the potential to slow down human warming. That said, at least two major amplifying feebacks — water vapor and methane hydrates — also emerge to greater and greater degrees as the ocean warms.
So, in summary, what we have witnessed, thus far is both substantial atmospheric and ocean warming as a result of human CO2 increase. Now let’s look at the third system — the world’s ice.
Melting Ice and Evaporating Water
The final measure of human caused global warming impact includes phase changes between water and liquid and liquid and gas. This is an important measure because it takes energy just to change matter from one state to the next. For example, the energy required to melt ice at zero degrees Celsius is 334 kilojoules per kilogram. This extra energy required to melt ice without increasing temperature, represents an invisible barrier to temperature increase. A similar barrier lies between water as a liquid and water as a gas.
So any melting of ice takes up energy that would instead be used to heat the atmosphere or warm the oceans. As such a change in phase from solid ice to liquid water is one more sign that the Earth is warming.
For global ice melt, we have a number of rather comprehensive measurements: glacial melt rate, Greenland melt rate, Antarctic melt rate, and sea ice volume loss. Though no complete measure, as yet, has been assimilated to determine the total volume of ice lost each year, a combination of these measures can give us a good indication.
First, lets start with rates of glacial ice loss. Though no total volume measurement is given for all the world’s glaciers it has now been observed that 9 out of 10 glaciers are losing ice more rapidly than they are gaining ice. In almost all regions around the world, major mountain glaciers are rapidly receding, a sign that global warming is steadily advancing. Average glacier mass balance provides a good catalog of this change.
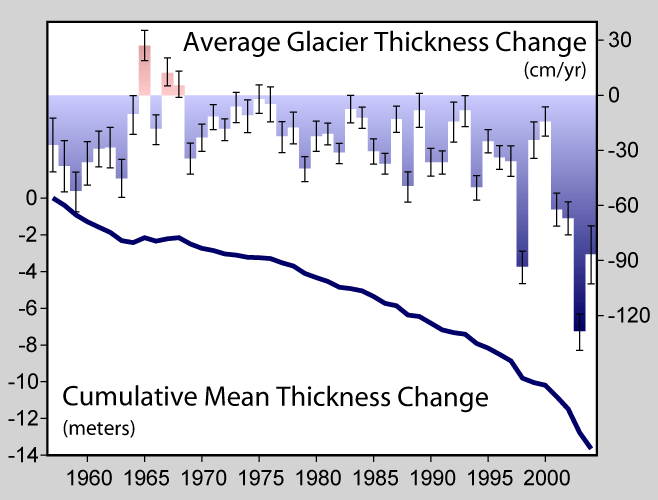
(Image source: Commons)
What the above image shows is that the world’s glaciers have lost, on average, about 14 meters of thickness since 1955 and are now losing mass at the rate of around 80 centimeters of thickness each year. Not only does this table show mass loss for glaciers continuing over time, it shows that the rate of mass loss is increasing.
These statistics only involve the world’s continental mountain glaciers. If we want to get an ever-clearer picture of the ice, we need to take a look at Greenland and Antarctic ice mass loss.
For Greenland, satellite measurements have shown an increasing decline in total ice mass over the past decade.
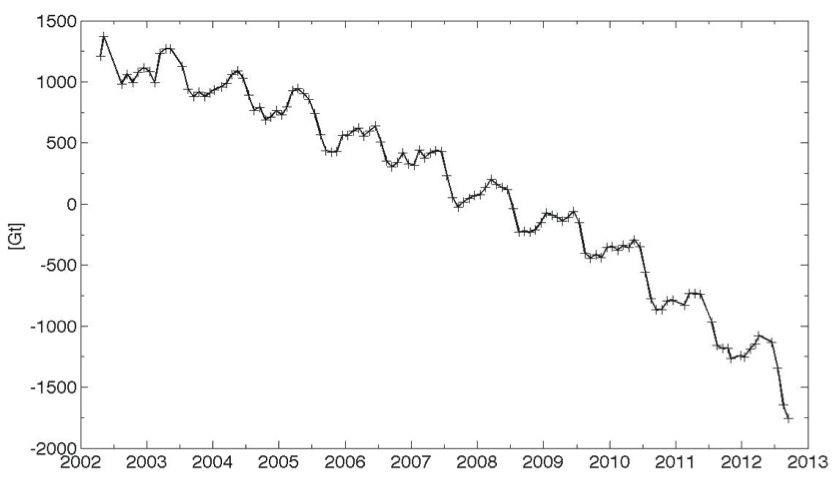
What the above image shows is an ongoing loss of ice since 2002 with the rate of loss increasing steadily through the start of 2013. Average rates of loss in recent years have been on the order of 500 cubic kilometers per annum, with a massive loss of about 800 cubic kilometers occurring between 2012 and 2013.
Antarctica has shown a similar rate of decline which, though slower than Greenland is still contributing high and increasing rates of ice melt.
(Image source: Skeptical Science)
What has been shown is that this rate of melt for land-bound ice at both poles is rapidly increasing. According to a statement from NASA in November of 2012, the current rate of polar melt from Greenland and Antarctica is now three times the rate of melt during the 1990s (NASA statement here).
Moving on to sea ice, we find similar rates of loss in the northern hemisphere. In the southern hemisphere, we have a set of counter-trend circumstances that have resulted in modest sea ice gains.
Northern hemisphere sea ice is perhaps the most dramatic example of human caused warming in the form of ice melt. Sea ice volume has fallen by over 80% since 1980 with the pace of melt accelerating since 2000. The following graph provided by PIOMAS vividly shows this devastating decline.
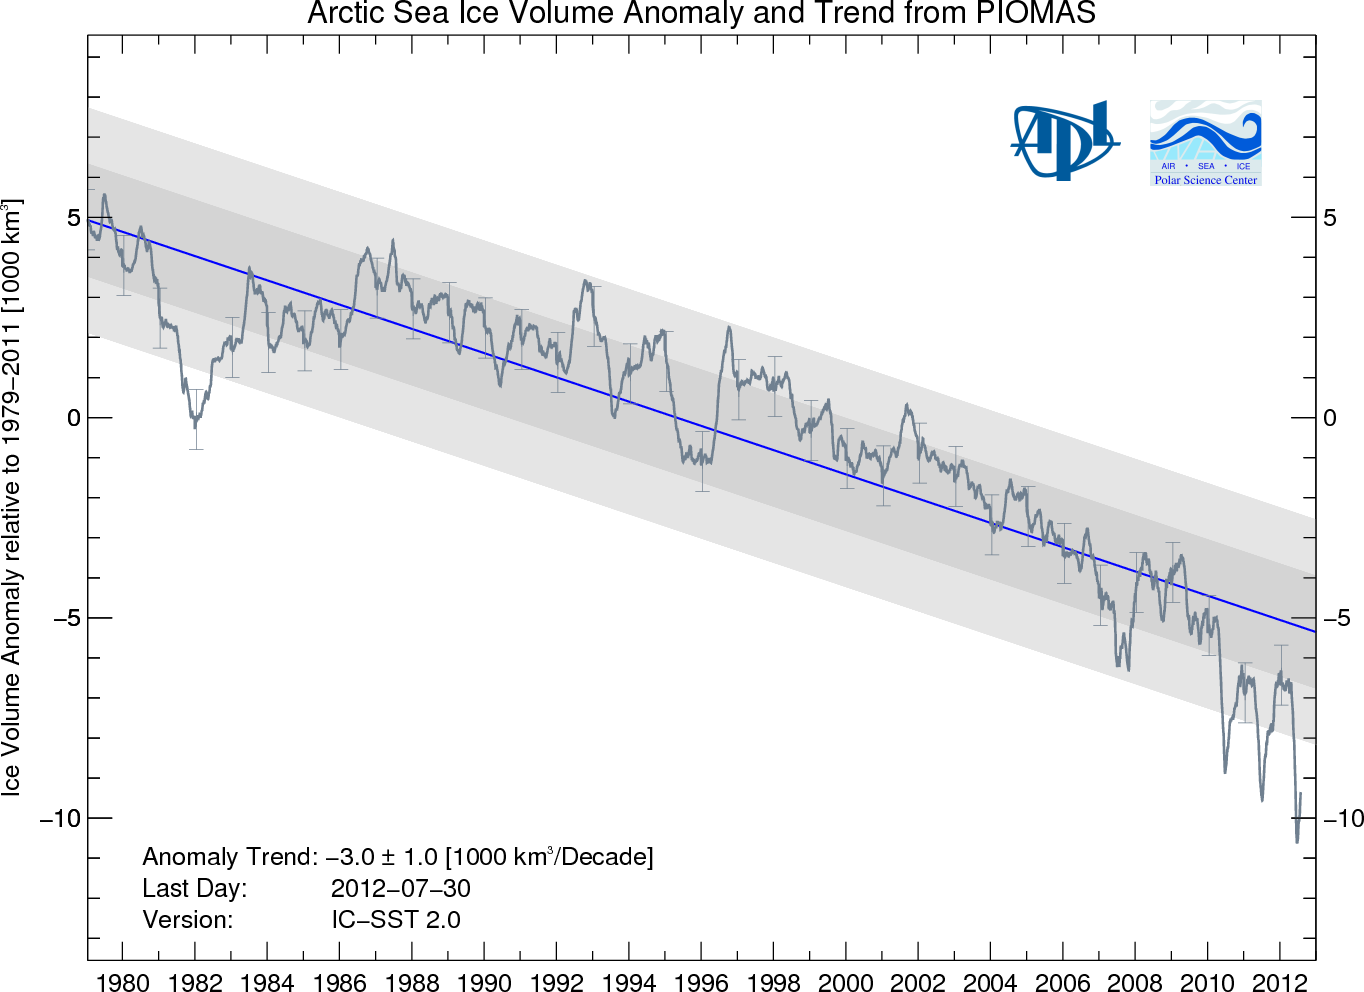
(Image source: PIOMAS)
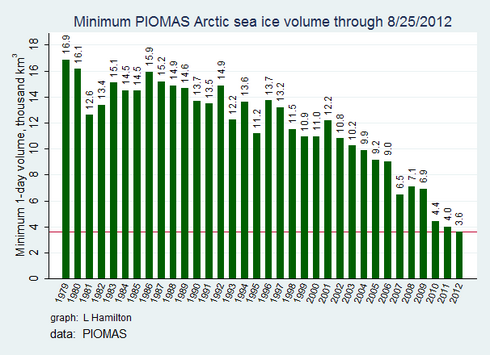
What these two graphs show is a loss of, on average, 750 cubic kilometers of sea ice in the northern hemisphere at the end of each summer. This high rate of loss adds to Antarctic land ice mass loss of around 300 cubic kilometers each year and Greenland mass loss of around 500 cubic kilometers each year.
Last of all, let’s take a look at Southern Hemisphere sea ice. Counter to the trend of melt in continental glaciers, Greenland ice, Antarctic ice and Arctic sea ice, sea ice area and extent in the southern hemisphere has been slowly increasing since the 1980s. The rate of increase is small when compared to similar measures of sea ice extent and area in the Arctic — about 1/3.
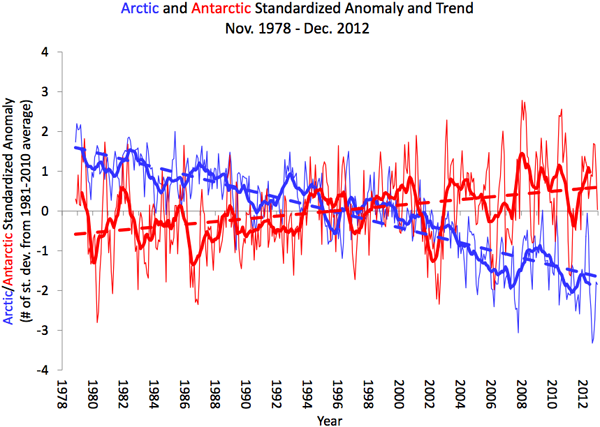
(Image source: NSIDC)
That said, it is important to note that air temperatures in the region of increasing Antarctic sea ice are increasing at rates even faster than around the globe. Furthermore, sea ice volume measurements for the Antarctic are sparse and difficult to come by. So we don’t really know if the surface is expanding even though the ice, in total, may be thinning. Furthermore, studies indicate that sea ice area and extent expansion in the Antarctic are driven by the melting of land ice. As the great glaciers of Antarctica have contributed an average of around 300 cubic kilometers of melt each year, this fresh water has extended around the Antarctic continent. The fresh water freezes at higher temperatures. Also, as the water is already near zero degrees Celsius, it takes less energy to freeze. Last of all, this fresh water cap tends to prevent warm water upwelling from the deep ocean. Such upwelling has tended to melt ice in this region and so the ice is somewhat protected from below by a shield of cold, fresh water.
Since we don’t have volume measurements of Antarctic sea ice, we can only assume that the slight increase in Antarctic sea ice extent and area over the past 30 years is also indicative of a small net increase in volume. If this is the case, it is the only area around the globe where ice is seen to be increasing. All other areas show rapid decline. And this larger trend is indicative of a massive amount of heat energy going to melt the ice.
So what we see, in combining the measures of continental glacier mass loss, Greenland glacial melt, Antarctic glacial melt, and Arctic sea ice melt is a rapid changeover of much of the world’s ice from solid to liquid state. This takes a huge amount of energy and is roughly equivalent to the energy that has gone into heating the atmosphere.
No Evidence That Global Warming Has Paused
When taking into account continued atmospheric temperature increases, increasing ocean heat uptake, and increasing rates of global ice melt, there is absolutely zero evidence that human-caused global warming has paused. Instead, we have seen a much more rapid impact on both the world’s oceans and on its ice over the past decade and a half. Further, though atmospheric temperature increase may have slowed somewhat over the same period, such a slow-down has come at the cost of an increasing pace of impact to both the Earth’s oceans and to its ice.
Moving forward, it will be worthwhile for scientists, researchers and environmentalists to continue to keep track of total Earth warming by gaining ever-clearer pictures of ocean heat uptake and worldwide ice melt while also keeping track of atmospheric temperature increases. In total, these provide a much more comprehensive picture of human warming. When taken together we can see that the human impact has been both rapid and powerful, with the pace of impact showing no sign of abating.
Links:
The Balmaseda/Trenberth Ocean Heat Study
Skeptical Science: Antarctic Mass Loss
Share this:

Posted by robertscribbler on May 24, 2013
https://robertscribbler.wordpress.com/2013/05/24/total-measure-of-human-warming-heating-atmosphere-warming-oceans-and-melting-ice/
Global Heating Accelerates, Deep Ocean Warming Fastest; What Does it Mean For Methane Hydrates?
A new study published in Geophysical Research Letters, found that ocean heat content rose at its fastest rate ever recorded over the past 15 years. The study, written by Magdalena A. Balmaseda, Kevin E. Trenberth, and Erland Kallen, found that the deep ocean below 700 meters accounted for 30% of all global heat content increase over the past decade.
What this means is that total warming of the atmosphere-ocean system didn’t slow down as some global warming denier sources claim. Instead, total Earth warming accelerated.
According to the paper, the most recent period since 1999 was:
the most sustained warming trend in this record of OHC. Indeed, recent warming rates of the waters below 700m appear to be unprecedented. In the last decade, about 30% of the warming has occurred below 700 m, contributing significantly to an acceleration of the warming trend.
Over the past decade, La Nina events have predominated. And this, according to study authors, resulted in a large portion of global warming being retained in the oceans. The reason is that El Nino is a powerful mechanism of ocean heat transfer to the atmosphere. But over the past decade, El Nino events have been rare, keeping more human caused heating in the world’s oceans. Not only did upper levels of the ocean heat up, a massive amount of global warming telegraphed into the deepest regions of world ocean systems.
According to Keven Trenberth, one of the study’s authors and a leading climate scientist, “It means less short term warming at the surface but at the expense of a greater earlier long-term warming, and faster sea level rise.”
The reason is that rapidly warming oceans pump more water vapor into the atmosphere. Water vapor is a powerful greenhouse gas and a major amplifying feedback to human caused warming. In addition, rapidly warming waters leads to greater thermal expansion of the world’s oceans, accelerating sea level rise.
Bad News For Methane Hydrates
More rapid ocean heating also has another impact not directly mentioned in the new study. What it does is put more of the world’s deposits of methane hydrates at risk of destabilization.
Methane hydrate is a volatile mixture of methane and frozen water that can be found on seabeds around the world. It is estimated that as much as 10,000 gigatons of carbon lay locked in methane hydrate deposits around the globe. Methane is a powerful greenhouse gas. Over a century, it is 20 times more powerful by volume than CO2. Over ten years, it is 100 times more potent. Methane is also problematic because after it amplifies warming as methane, it then breaks down into CO2, adding to already high volumes of that gas. Were even a small fraction of this carbon to bubble up from the ocean bottom and reach the atmosphere, it would result in a powerful amplifying feedback to human caused climate change.
Over the past decade, instances of methane hydrate destabilization have been found in the Arctic, off the east coast of the United States, and in other regions around the globe. Many of these events appeared to be new. Of these, methane plumes found in the East Siberian Arctic Shelf were the most disturbing. There, plumes of methane a kilometer across were discovered. Though submerged tundra was also a likely contributor to massive methane plumes discovered on the shelf, hydrates are also known to have formed there.
Now, with oceans heating at a greater rate than the atmosphere, risks for large methane hydrate releases are also increasing.
Most Missing Heat Found, Look to Ice Sheets for Remainder
This new research finds most of the missing heat scientists have been looking for around the globe. And that heat, as previously suspected, ended up in the world’s oceans and, to great extent, in the deep oceans. That said, a much smaller measure of heat is still unaccounted for. It might not be a bad idea to look in the world’s ice sheets — which appear to be decaying at a much faster rate than expected. One speculates that the hearts of the great glaciers are more watery than anticipated and contain much of the remaining heat from human caused global warming not currently located.
Links:
In Hot Water: Global Warming Has Accelerated Over Past 15 Years, New Study of Oceans Confirms
Winter 2013 Shows Increasing Arctic Methane Feedback to Human Caused Warming
Arctic Methane Release Sea Ice Melt Shows Amplifying Feedbacks to Human Caused Climate Change
Share this:
Posted by robertscribbler on March 26, 2013
https://robertscribbler.wordpress.com/2013/03/26/global-heating-accelerates-deep-ocean-warming-fastest-what-does-it-mean-for-methane-hydrates/
Please Help Support Our Ongoing Efforts

Climate of Pandemic — A COVID-19 Special Report

GROWTH SHOCK

Luthiel’s Song: Dreams of the Ringed Vale

Luthiel’s Song: The War of Mists

Climate Progress

The Secular Jurist

Exposing Misinformation Spread by Anthony Watts

Colorado Bob’s Climate Feed

Arctic Sea Ice Blog

Science Blogs

Climate State


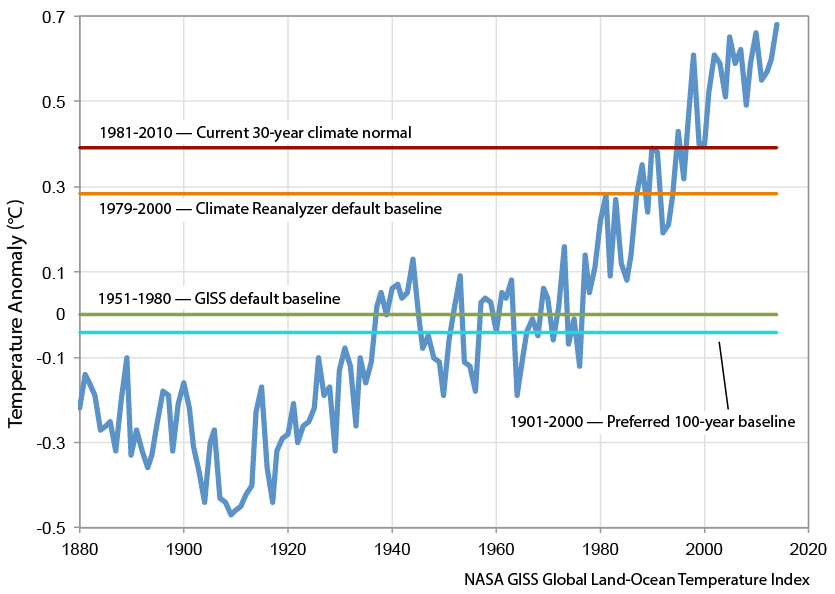
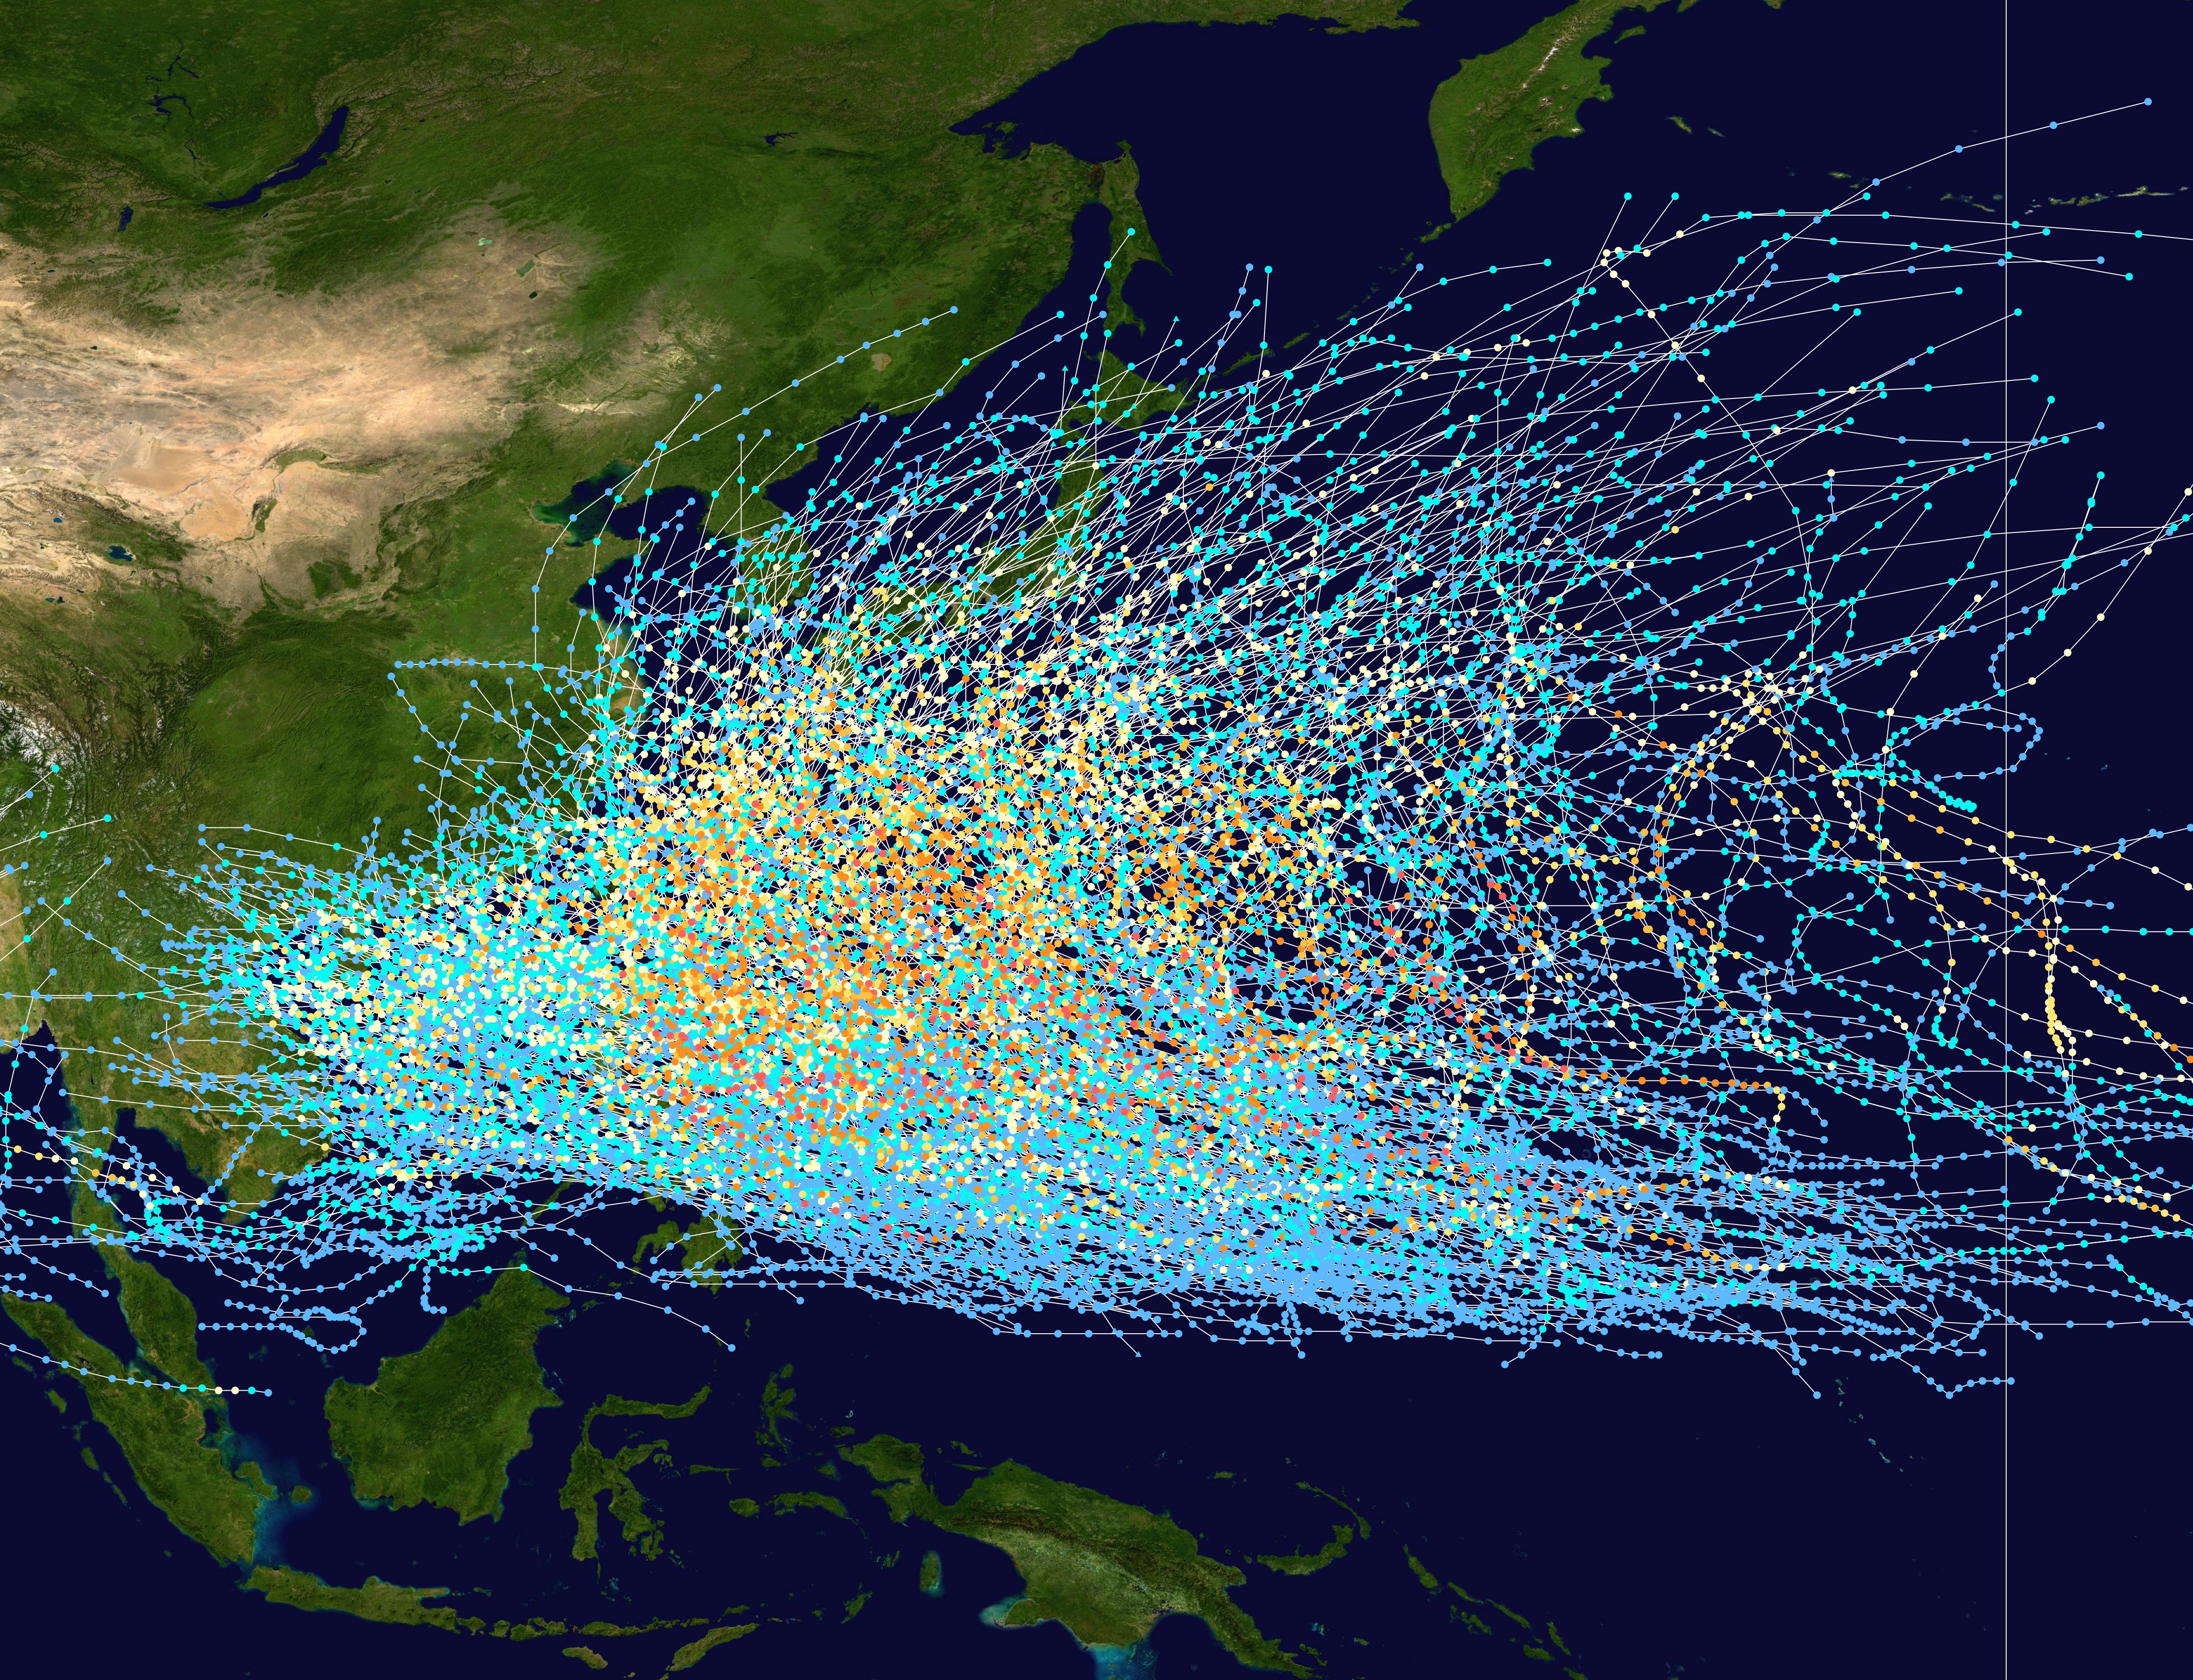
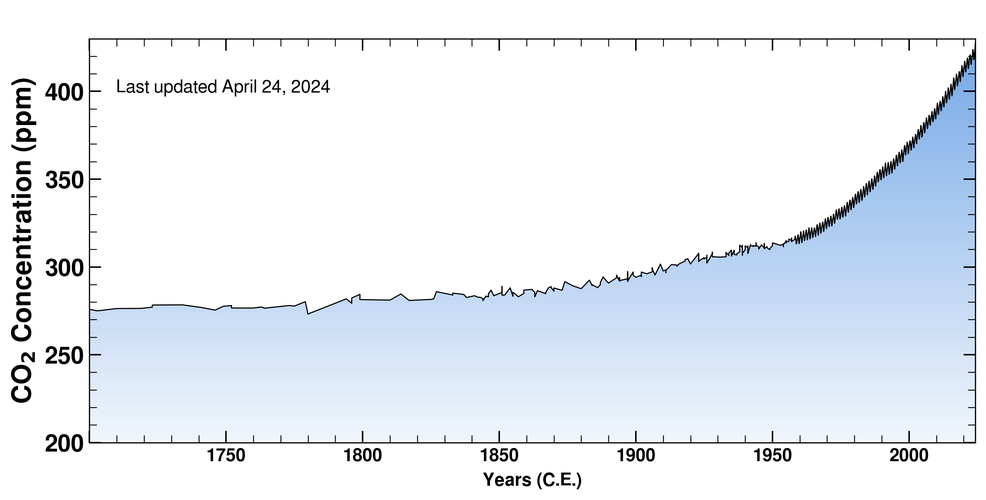