
2 C.
It’s the amount of warming past pre-industrial times that the IPCC says we should try to avoid this Century in order to prevent the worst consequences of human-caused climate change. It’s the so-called safe limit, even though there’s nothing really safe about it and we should probably be aiming more for a below 1.5 C target.
1 C.
It’s the amount of warming between pre-industrial times and, according to the latest data from NASA, the first half of 2015. In other words, temperatures during the first six months of 2015 are now at least halfway toward freeing some of the nastiest climate monsters in the closet.
* * * * *
According to NASA GISS, June of 2015 was tied with 1998 as the hottest of any June in the entire 135 year global climate record. Coming in at +0.76 C above NASA’s 20th Century average, June follows May at +0.73 C (4th hottest), April at +0.71 C (tied for 3rd hottest), March at +0.91 C (second hottest), February at + 0.89 C (hottest), and January at +0.81 C (2nd hottest).
Combined, these average out for a +0.80 C departure from the 20th Century in the NASA measure. That’s an extraordinary amount of heat — +0.18 C above 1998 levels and +0.05 C above 2014, which was the previous hottest year on record.
But, perhaps most importantly, this reading is the first consistent break at 1 C above 1880s levels. An ominous benchmark and halfway to the catastrophic 2 C warming we really, really want to avoid.
June Takes On El Nino-Type Temperature Pattern
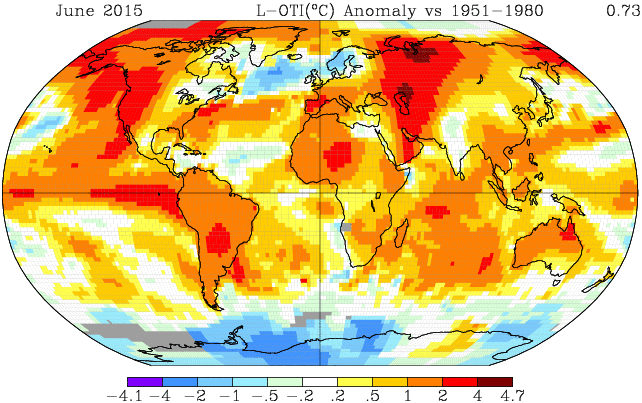
(NASA’s geographic temperature anomalies for a record hot June in 2015. Image source: NASA GISS.)
Looking at the June temperature anomaly map, we find very large zones of 2-4 C above average readings running up toward the Northern Hemisphere Pole. The first of these zones rides up over Western Asia. Covering most of the region from the Caspian Sea on northward, this area features two anomalously hot zones ranging to as high as a +4.7 C anomaly in intensity. The second of these zones issues from the developing El Nino in the Eastern Pacific, rides up over the hot ‘Blob’ of ocean water in the Northeastern Pacific, invades Alaska and the Pacific Northwest, and then enters the Beaufort and Chukchi seas. This zone also features large expanses of +2 to +4 C above average temperatures.
Overall, most of the globe saw above average readings with only the region just south of Greenland, a small zone just west of the hot ‘Blob,’ and an area of somewhat cooler readings over West Antarctic showing below average readings.
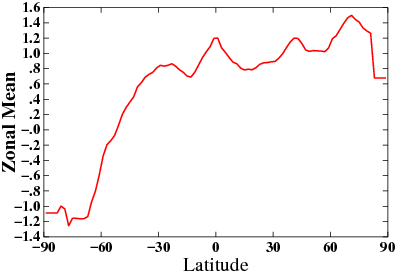
(Zonal anomalies began to pick up the El Nino signal during June. Note that equatorial heat gain nearly matches that of the Northern Hemisphere pole. Image source: NASA GISS.)
Under El Nino — a climate condition the globe is steadily transitioning toward — we would expect to see relative warming near the Equator and relative cooling near the poles. During June, we begin to see this signature with the Equator warming up to a substantial +1.2 C positive anomaly. Antarctica also followed this trend as that polar zone dipped into the -0.4 to -1.2 C negative anomaly range (60 to 90 South). Meanwhile, the Northern Hemisphere Polar zone (60 to 90 North) showed significant hot readings in the range of +0.9 to +1.4 C anomalies.
Overall, the entire globe from 50 South on northward experienced above average to much hotter than average temperatures in the zonal measure. A clear and powerful heat signal for June of 2015.
Building El Nino Likely Means More Heat to Come
With the first six months of 2015 finished and with El Nino still strengthening in the Pacific, it appears that a record hot year may already be a lock. In addition, further warming may be in store.
The current El Nino appears to be roughly on a similar development track, as far as timing and possible intensity, to the 1997-1998 El Nino. Given this rough allegory, we are approximately at the same place, climatologically speaking, as July of 1997. During that event, global temperatures didn’t really start taking off into severe record high ranges until Fall of 1997 through Summer of 1998. If the ocean to atmosphere heat loading for the current event proceeds in similar fashion, we could expect to see even more extreme temperatures than we are currently experiencing by Fall and running on through at least the first season or two of 2016.
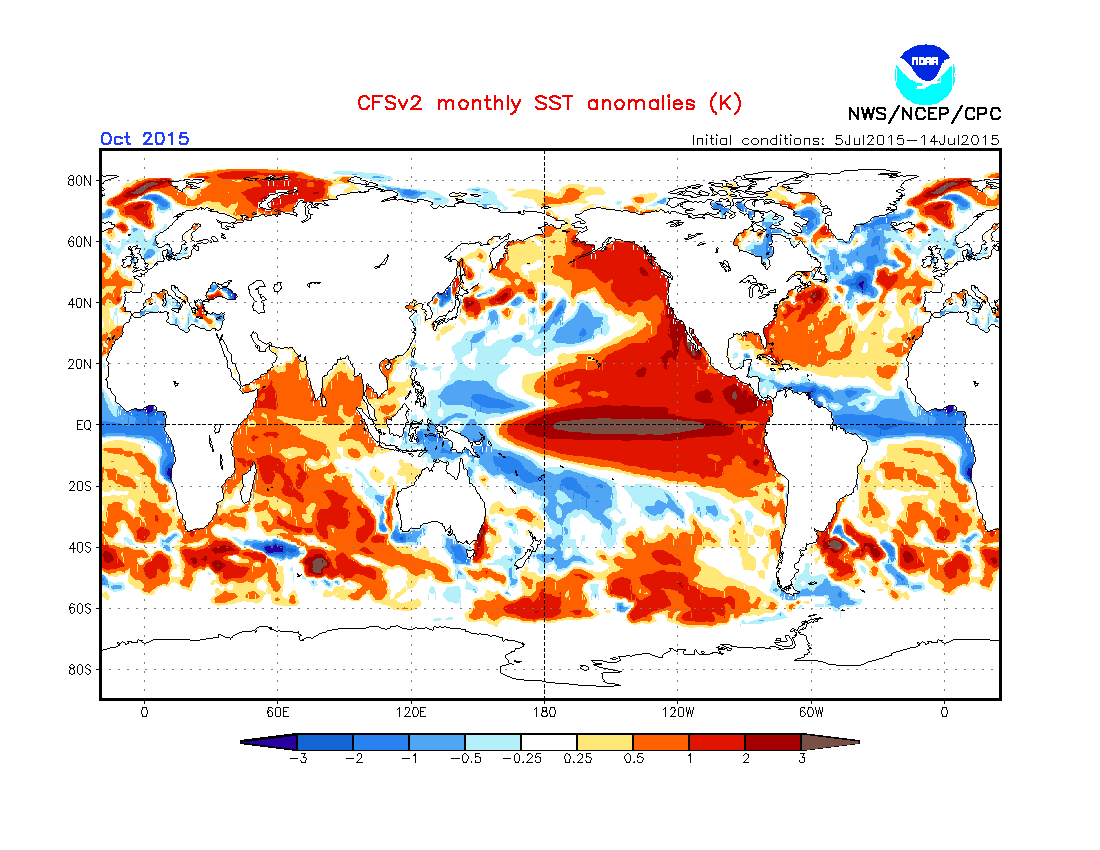
(Record-breaking El Nino by October? NOAA CFSv2 models have been spitting out some pretty extreme results. If we see anywhere near this level of sea surface warming the Central Pacific, the heat records thus far for months during 2014 and 2015 may soon be left in the dust. Image source: NOAA CPC.)
Looking toward July’s forecast, there is a bit of a caveat. That month is typically cooler globally due to a lessed impact of the greenhouse gas heat forcing. This is due to the fact that greenhouse gasses are concentrated most heavily in the Northern Hemisphere and such greenhouse gasses are most efficient at heat trapping during night time and winter. As such, we may see a bit of a dip in the July readings below June. But if this current El Nino gets involved as the models predict, it’s likely to be record-breaking heat that pushes some very ominous global temperature thresholds all the way through from August 2015 to at least early 2016.
Let’s just hope we don’t close too much more of the gap to 2 C. It’s really starting to get scary out there.
Links:
Hat tip to Wili
(Please support public, non-special interest based, science like the fantastic work written about here and conducted by the experts at NASA and NOAA.)


Robert A. Vella
/ July 16, 2015Reblogged this on The Secular Jurist.
LikeLike
Andy in San Diego
/ July 16, 2015One of the mental exercises in all of these events we examine I do is I think of “what next for that area”.
For example regarding Arctic fires:
Initial Impact:
Subarctic, and boreal forests burn, they will continue to do so year after year until there are only “clumps” rather than contiguous large forests. Areas are cleared out of coniferous forest. Under that removed canopy you find salmon berries, blue berries and other plants that thrive in the acidic soil (due to the coniferous needle debris). Peat bogs contain a differing mix of life forms in balance, they are removed and relegated to small cantons (bogs, forests, plants and life forms). Birds and other life forms that depend on these have to have a mass die off. Not enough food left. There also is an occurrence of genetic mutation as new food sources have to suffice. Some species have genetic occurrences of the ability to digest a differing food source or reduced intake of specific foods. This is not a trivial task. Areas get replaced by scrub plants and deciduous trees such as alders. Bogs get replaced by grasslands, scrub, deciduous. Entire populations of species suddenly collapse (like what is occurring off the US/Canada west coast). What is left must either luck out on the genetic variability lotto, or vanish.
Secondary Impact:
Mass die offs must occur all along the food chain. New species migrate, but with a caveat. They must adjust to the new temperature/climate (that takes a few generations of trial and error). Existing species must adapt (again trial and error). Species that move into the territory can not be from very distant, as their ability to survive winter/summer decreases in a non linear manner the further they are away from their norm. In the interim, food sources need to adapt. Such as flowering plants (berries etc..), they now have to adjust their annual cycles so they are safe. Don’t suffer a latent freeze so stay dormant. Don’t miss the short window of summer light, so don’t stay dormant too long. Animals need to stay in winter mode not too long, not too short. These cycles between producers and consumers must reconcile such that neither dies out en mass. This is more trial and error. During this period, life is sporadic and bleak as we wait for successful species to pop up, fight it out and establish themselves. Occasionally a species will grab hold, only to suffer a mass die off.
Tertiary Impact:
Some plant species adaptions succeed, which provides a knock on effect of a food source for herbivores. They in turn produce enough population such as not to over strip the vegetation (provided lifespan and carnivores keep them in check). Carnivores find themselves adapting as well. They are the tempering effect on the herbivore population, without over running it. This final balancing and fine tuning can take ages. Again, this is a trial and error activity. However it is done on an ecosystem scale. And as ecosystems collapse and reform in order to achieve balance various populations and species have to be purged and forced to re adapt in order to try again, or be replaced by other species. This may take quite a long time (certainly in the human time scale).
Now for contrast / context. It take between 14 million and ~20 billion attempts to get a potential successful successor that matches the ecology / environment per species per step in the above 3 steps at each stage. We are looking at a very very long time in our scale.
And in the meantime, how does a geometrically expanding human population sustain itself? Or does it follow the same steps as above?
LikeLike
wili
/ July 16, 2015“species must adapt (again trial and error). Species that move into the territory can not be from very distant, as their ability to survive winter/summer decreases in a non linear manner the further they are away from their norm”
Nicely put, as is the rest. Basically, species are not generally ‘rugged individualists’ and most animal species are not omnivores. Most exist within a framework of interactions (direct and indirect) with specific other species in their ecosystem. Take a few of those away, and the whole thing goes pretty quickly to hell.
These changes are taking place on way to fast a time scale for most species to ‘adapt.’
Prof. Parmesan recently mentioned that the butterfly she had been studying rather suddenly shifted its range by about a half a continent. There just aren’t too many more half continents to go before you run out of planet.
LikeLike
Andy in San Diego
/ July 16, 2015and butterfly’s can fly. Plants, insects, ground mammals, amphibians, reptiles, mushrooms, mold, local bacteria don’t have that luxury. And then… the butterfly has to be really lucky to find an ecosystem / climate it can fit into without genetic deltas.
The recovery time for nature is well outside our area of experience.
LikeLike
Wake
/ July 16, 2015“There just aren’t too many more half continents to go before you run out of planet.”
This is incorrect. There are an infinite number of half continents remaining with each step, so long as the one behind is written off
As an added bonus, they get smaller and smaller so the range issues diminish to near nothing
I’m sure it will be fine as a result
LikeLike
robertscribbler
/ July 16, 2015Great points, Andy.
It really is the pace of human forced warming that makes this so hard. More southerly plant species would take time to shift their ranges and to adjust to the harsher soil environments. If warming was gradual, the ecosystem shock is greatly lessened. But the pace of warming alone generates out of context stresses for species dependent on genetic change for adaptation to new environments. It’s a pace of warming that’s also worsening these fires.
LikeLike
Dave Person
/ July 16, 2015Hi Andy,
Unless we stop burning fossil fuels, climate changes will be continuous for a long time until we are gone or fossil fuels are used up. Consequently, only those ecological communities resilient to constant climate change and extreme variation in seasonal weather patterns will survive. The future likely will favor ecological generalists and doom ecological specialists (most species in the world).
dave
LikeLike
AThornton
/ July 16, 2015“how does a geometrically expanding human population sustain itself? ”
It doesn’t. The Lotka-Volterra equations are clear: when a prey species (that’s us) reaches a certain level of predation (what we are doing to the planet) the predator species numbers jiggle around a bit and then crash to minimal population sustainable, or roughly the population numbers before a dramatic increase. In this case we can use the estimated global population of 1800: 978 million, as a Rule of Thumb.
LikeLike
robertscribbler
/ July 16, 2015A couple points —
1. Human beings are omnivorous, so they have a few rather different challenges than a predator. That said, the versatility of human beings give them a bit more flex regarding limits.
2. To this point, humans can choose to make the energy exchange and go meat free. This gives humans more available food energy during times of scarcity and it’s one of the reasons I’ve promoted veganism so readily. Now there’s a lot of misinformation out there on veganism just as there’s a lot of misinformation out there on renewable energy. But even the most basic reasearch can show that in a comparison between the amount of cropland needed to support humans on a vegetable diet vs the amount of cropland needed to support humans on a mostly meat diet the vegetable based crops result in less acres needed by a very wide margin (especially when you consider industrial meat which is ridiculously less sustainable).
All that said, changes to diet and the way we generate and consume energy (renewables+efficiency) will probably need to also be augmented by population restraint and bending the curve down through the 21st Century. Demographics tragectories support the notion of populations peaking at around 8-9 billion by mid century and then falling off. This may be manageable with aggressive moves toward more sustainable foods (vegetables) and energy sources (renewables + efficiency). But there is absolutely no way we support those numbers under resource base destroying BAU practices (industrial meat + carbon emitting fuels).
Finally, there appears to be some effort to paint the sustainability crisis solely as a population crisis. But it doesn’t really matter what level of population you have if you keep burning fossil fuels and dumping carbon into the atmosphere. The 330 million in the US alone would be enough to wreck things if we kept up the way we are going now with fossil fuel burning and carbon emissions, it would just take a bit longer. So you need to change how you run civilization too and what you end up running civilization on. The switch to renewables + efficiency is therefore necessary to the potential for our civilizations surviving going forward. Continuing to run on fossil fuels is rapidly suicidal.
LikeLiked by 1 person
robertscribbler
/ July 16, 2015That and stop burning those damn fossil fuels and making the situation worse.
LikeLike
AThornton
/ July 16, 2015“Predation” should be read as “extraction and consumption from the natural world.” We “predate” the oil supply just as we “predate” CAFO raised chickens. IOW, read generally. I should have made that clear. Apologies.
I think population crisis is a strong contributing factor to the sustainability crises. “Solving” (sic) the population crisis is a necessary but not sufficient condition for sustainability.
LikeLike
robertscribbler
/ July 16, 2015Nicely put. And I do agree.
LikeLike
robertscribbler
/ July 17, 2015In following thoughts I return to the reflection that we as a race have a choice between living in cooperation with our world and with the wondrous living creatures inhabiting it or living in a state of perpetual conflict as we try and fail to assert dominance over creation. One of these choices has a future. The other one does not.
LikeLike
Dave Person
/ July 17, 2015Hi AThornton,
Lotka-Volterra model of predator-prey dynamics is a very poor representation of reality and I urge you to ignore it as a model for what you are trying to represent. You need to read Robert May’s (1974) monograph “Stability and Complexity in Model Ecosystems”. Simply put, the LV model has a single point solution of equilibrium and when perturbed from that point it exhibits pathological instability. That is because the two eigenvalues of the community matrix derived from the equations, which define the conditions of stability, contain a single value and a term that includes the imaginary number “i” as a scalar. It does not account for density-dependence, time lags in species functional and numeric responses, etc…. It portrays systems that are far too unstable to represent reality.
dave
LikeLike
Mblanc
/ July 16, 2015I’m not sure about the accuracy of your ‘geometrically expanding human population’, because it does not tally with my understanding of present rates of population growth. As far as I can make out, and I’m no expert, the only current population boom is in Africa, where the use of contraception is low,and the education of girls is patchy.
Your other excellent points, about the cascading ecological effects of AGW, are ones (amongst many), that I worry about myself. Restoring ecosystems doesn’t seem very likely, and one only needs to look at the state of the oceans, to see what a decimated food chain looks like.
Jellyfish soup, anyone?
LikeLike
robertscribbler
/ July 17, 2015Population growth, as you observe is on the decline. Add women’s rights, education and birth control to the places where they are not already established and you end up with negative population growth, even with people living much longer. It’s an invisible infrastructure that helps a great deal and the current trend, at least in the case of population, is somewhat encouraging. That said, if we had peaked at 6 billion we’d have been better off.
LikeLike
Robert in New Orleans
/ July 16, 2015Humanity is really provoking the climate Cthulhu.
LikeLike
Mblanc
/ July 16, 2015Great line. Here come the giant Climate monsters!
LikeLike
A. Randomjack
/ July 16, 2015Hello Robert
I 1st have to pass on the comment of excellence of the work I got for an article of yours I translated/adapted on Le Climatoblogue, http://leclimatoblogue.blogspot.ca/2015/06/un-blob-sattaque-la-glace.html from yours “Hot Blob #2 Takes Aim at Sea Ice — Abnormally Warm Waters Invading the Arctic Through Bering and Chukch sea”
I’m starting this one on the +1°C mark we hit today. I can hardly believe we already hit that mark!
Thanks again for your permission to translate your excellent articles.
Have a nice day Robert
LikeLike
robertscribbler
/ July 16, 2015Thanks so much, a Jack. Glad to see your audience is benefitting from the posts.
LikeLike
msrfuture
/ July 16, 2015Reblogged this on msrfuture.
LikeLike
wili
/ July 16, 2015Thanks again, rs, for the hat tip (two in a day! woohoo!), and especially for putting this grim news in sharp perspective.
Let’s all do all we can to be sure that this news is blazoned around the world, especially since we are going to have to all the pressure we can on the upcoming Paris talks.
LikeLike
robertscribbler
/ July 16, 2015Cheers, Wili. You guys make my work a bit easier. Much appreciated.
LikeLike
Syd Bridges
/ July 16, 2015It has taken about 300 years of industrialization to generate this 1 degree rise, from the time of such people as Thomas Newconem and Abraham Darby to the present. That approximates to 10 generations. My guess is that the next one degree rise will be within a generation unless drastic action is taken to reduce greenhouse gases. . I wonder how much extra heating would still occur even if we were (magically) able to hold the CO2 at this year’s levels. I think this development gives the lie to low estimates of climate sensitivity. My belief is that 3 deg C for a CO2 doubling is an optimistic figure, though I hope I’m being unduly pessimistic.
LikeLike
robertscribbler
/ July 16, 2015ESS is 5-6 C per doubling. No one wants to talk about that. ECS 3 C is for this Century only. It’s really an artificial estimate, though. ESS includes all feedbacks but likely takes a long time to hit that number. There’s a lot that has to change in that energy redistribution.
LikeLike
Spike
/ July 17, 2015“ESS is 5-6 C per doubling. No one wants to talk about that.”
Something I’ve noticed too. Perhaps a future post could look at ESS and the rationale and research underlying it?
LikeLike
Andy in San Diego
/ July 16, 2015We need to remember that the global mean temperature is a trailing indicator. Like an oil tanker, it takes some time to develop the inertia to go 20 knots. But once it’s going it takes a long time to slow down too. Our CO2 loading is the fuel, the global temperature average is the oil tanker speed, velocity is the rate of change in the temperature to atmospheric CO2. I wonder what year it was that we had baked in that 1C, how long ago we had secured 1C. I also wonder what temperature we are currently really baking in.
LikeLike
Eric Thurston
/ July 16, 2015Related to the global mean temperature, I have some questions that maybe RS or someone else could answer.
We talk about how the El Nino could contribute towards making this year a record breaker, but isn’t this heat already part of the global system and the El Nino a pattern of weather that redistributes the heat that is already there (albeit increasing every day)? And when we refer to the global mean temperature (GMT) I presume that we are concerned with the top, say 10 miles deep and, of course, the atmosphere. I wouldn’t think that climate change would affect more that about 10 miles deep into the earth’s crust. On re-reading it sounds like a dumb question, and maybe I’m taking the term ‘global’ a bit too literally. Maybe someone could point me towards an information source that goes into how climatologists measure and calculate the heat content and the mean temperature of our planet.
Another thing I have been wondering is what, in rough guess terms, was the last time period when the earth was in a state of equilibrium with regards to solar heat gain vs infrared heat loss.
This is such a great source of information, even though the information is getting pretty scary.
LikeLike
robertscribbler
/ July 16, 2015The NASA LOTI index is a measure of combined land and ocean surface temperatures. These are temperatures within the first two meters of the surface (land) and at the surface (ocean). It includes a composite of thousands of sensors and has been the benchmark for global temperature analysis over the past 135 years. So there’s no reason for confusion. Surface temperature measures are just that. And surface temperatures are now at levels 1 C hotter than 1880s — ominously close to the bad 1.5 C benchmark and halfway to the terrible 2 C benchmark.
As for the larger measures, there has been a good deal of work lately through the floats network to get an idea as to how much heat is stored in the oceans and changes in that heat content. Since 1998 and during negative PDO, we’ve seen quite a lot of heat going into the ocean system. One of the ways in which we were able to get an idea that a strong El Niño might be on the way was due to the ramping volume of heat in Pacific Ocean waters at depth. This heat would eventually come back to impact the atmospheric temperatures sooner or later. Oceans are really the big player when it comes to heat storage. They uptake more than 90 percent of all the added forcing.
As for the atmospheric measure above the surface zone, we are reliant on various sensors. Warming in the lower atmosphere can probably best be observed by tropopause heightening — as the lower atmosphere swells due to the heat that it has taken on. Heightening is particularly visible in the Western Pacific where ocean surface waters tend to be the hottest globally. This peak heightening has had some marked impacts to atmospheric chemistry in the region.
But the benchmark temperature we use, for good or for ill, is the surface temperature index. This set will tend to wag more due to the viscititudes of natural variability. But because it is supported by the broader based ocean warming, it is a good measure for overall warming so long as you don’t end up with a major ice sheet response. At that point, adding in all the energy that has gone to melting ice, warming waters and warming the atmosphere may give a decent view of where we are on the net energy scale. That said, energy imbalance at the top of the atmosphere probably provides a good proxy for that as well. And we’ve probably had a net energy imbalance on the + side of the ledger since at least the early 20th Century once the ghg forcing grew large enough to crowd out the other atmospheric chemistry impacts (aerosols etc).
1 C and 2 C, however, are good proxies for how much in the way of damaging geophysical changes we are likely to see. And in this context what we should be doing is looking for ways that we can rapidly reduce our fossil fuel emissions to zero. Looking for ways to remove the fossil fuel industry from its position of power and severe negative influence in our civilizations so that we can get done the changes that need to be done to prevent ever increasing degrees of harm. Fossil fuels are locking in an increasingly severe trauma and the industries that profit from them are trying to force us to endure an ever worsening pain. It’s these industries that need to go, and fast.
LikeLiked by 1 person
Andy in San Diego
/ July 16, 2015I’m curious about the answers to what you’re asking too Eric. The answers would help in understanding the post El Nino climate.
LikeLike
Andy in San Diego
/ July 16, 2015Thanks Robert, that helps clear things up.
LikeLike
Abel Adamski
/ July 16, 2015Interestingly I note a “little” hype about some companies that have CO2 extraction technology to extract CO2 from the atmosphere, still in development and a plant is producing CO2 which is being converted into diesel in Germany apparently.
Will take decades to set up enough and how will it be funded?
Will it be an excuse to just pump out more CO2 as we can just remove it. ?
Also just before Paris
As I keep on pointing out on those sites (strangely those comments disappear) that without the campaign of misinformation and deception we may have been on a win win path for industry and the planet decades ago. That 30 years was decisive
LikeLike
robertscribbler
/ July 16, 2015We have solutions to oil, gas, and coal burning that are available now. Their names are wind, solar, EVs and battery storage. Wind and solar are already less expensive than new gas and new coal. EVs and battery storage are closing the gap. Over time, these renewables grow less and less expensive, which also makes the energy base, less and less expensive. Over time, the fossil fuels grow more expensive to extract and more damaging to the climate. So replacing them is necessary both on economic and on climate impact counts.
As for a technology that relies on a polluting infrastructure to work, that, at this time, is a very, very expensive chemistry experiment, and that will take at least 30 years to be even remotely practical — at best it’s a dog and pony show distraction away from what we need to be doing now which is shuttering emissions dependent industry. To be very clear the low hanging fruit when it comes to dealing with climate change is cessation of coal, oil, and gas burning as soon as possible. After that, then we can start seeing if this hard challenge of atmospheric carbon reduction can be achieved. But we’re not going to get anywhere hoping in a technology that will likely perpetuate the lifetime of diesel burning and that will probably never come to fruition in a practical sense to do it.
We don’t have 30 years to wait. 30 years of BAU is 500 ppm CO2 and 600 ppm CO2e. We can’t run civilizations in a world like that. We need to start emissions reductions and rapid energy transitions immediately.
LikeLike
Mblanc
/ July 16, 2015I totally agree with you last paragraph, although I would highlight a time just before the millenium, when the satellite and ground measurements of temperature were reconciled. I think it was 1998.
I looked for references to this, but I couldn’t find a good one in the time I have to look.
I have seen that point described as the time when climate skepticism became intellectually unsustainable, leaving only climate denial.
LikeLike
John
/ July 16, 2015Reblogged this on jpratt27.
LikeLike
Greg
/ July 16, 2015Does anyone else here think these nunbers are insane for rainfall potentials for Japan’s main island with up to 900 mm (35 inches!) for Osaka and environs from typhoon Nangka hitting now?
http://www.weather.com/storms/typhoon/news/typhoon-nangka-west-pacific-japan-july2015
LikeLike
robertscribbler
/ July 16, 2015That’s absolutely insane, Greg. Especially considering that this is on top of an already long list of very severe hydrological events.
LikeLike
Mblanc
/ July 16, 2015I noticed that, seems extraordinary. Here is Jeff Masters take
http://www.wunderground.com/blog/JeffMasters/comment.html?entrynum=3045
LikeLike
Jimmy
/ July 16, 2015I feel that things will begin to collapse as climate decreases food production/increases food price. My eye is on Asia food crops. I feel that we are about to get served a double whammy of pea oil and climate change. The list of failed states will continue to grow. As can be expected most people will see or ecological/economic problems as political problems and blame their favorite scapegoat, retreat into ethnic mythology and in-group/out-group identities.
http://www.bangkokpost.com/business/news/623304/el-nino-starting-to-bite-in-asia
LikeLike
robertscribbler
/ July 16, 2015Peak oil is a good thing. We need to be pursuing peak oil. We need to be pushing that date closer and closer, making it less and less worthwhile to get that stuff out of the ground and burned to dump carbon into our atmosphere. Peak oil isn’t the crisis. Peak oil, gas, and coal is the objective.
LikeLiked by 1 person
AThornton
/ July 16, 2015Lagi, Bertrand and Bar-Yam wrote a very interesting paper in 2011 “The Food Crises and Political Instability in North Africa and the Middle East.” I quote from the abstract:
“… the timing of violent protest in North Africa and the Middle East in 2011 … coincides with large peaks in global food prices.”
and the body of the paper:
“… food riots occur above a threshold of the FAO price index of 210 (p < 10^-7)…"
At 165 the price Index is at it's lowest in four and half years. The 2015 harvest is supposed to be adequate but there's no slack in the system. We are eating the harvest as it is harvested. Any weather-related 'shock' to production levels will almost immediately be reflected in the FAO price index. Which is really great news for Lagi, et. al., and those interested in seeing if their thesis withstands the brutal world of Empirical Validation.
From the point of view of the average Bangladeshi, facing a choice between (a) drowning from global sea rise in the long term or (b) starving in the near term … not so much.
LikeLike
robertscribbler
/ July 16, 2015Absolutely. The global food system is in trouble now. We have oceans that are less productive. We have lands that are increasingly stressed. We have increasing water stress and scarcity. We have flooding river deltas and these crazy switches from rain to drought. With each 0.1 degree C of warming we make this situation worse. And to top it all off we are growing more than half our food, using more than half our land to support livestock animals and a growing global meat consumption. There’s a lot that’s not too right about this picture. But the obvious thing to do if you’re looking for more flex is to cut out the meat fat.
And of course… stop burning the fossil fuels.
LikeLike
Jimmy
/ July 16, 2015**peak oil
LikeLike
mikestasse
/ July 16, 2015Reblogged this on Damn the Matrix.
LikeLike
LAM78
/ July 16, 2015Mr. Scribbler, ECMWF foresees freaking Niño 3.4 values with a majority of the ensemble in the range of 2,5-3,5C above normal by October… One main question also is also the potential for a powerful La Niña in 2016. So far, I don’t see any real signs for that but it should become clearer later this year…
Cheers, LAM
LikeLike
robertscribbler
/ July 16, 2015Absolutely, LAM. We have about ten posts now tracking the extreme potential of the current El Niño. Started issuing warning on potential extreme intensity about a year and a half ago as PDO looked like it might start to flip and as the trades were starting to weaken. The issue was the massive amount of heat content in the world ocean system. Eventually, that heat would result in a backing up of energy into the atmosphere. We are starting to see that now and ECMWF is picking up a very strong signal indeed.
That heat energy train wreck will ultimately play out. That said, I wouldn’t be looking for La Niña until mid to late 2016 at the soonest.
LikeLike
LAM78
/ July 16, 2015Oh, a link to ECMWF forecast might be a good idea: http://www.ecmwf.int/en/forecasts/charts/seasonal/nino-plumes-public-charts-long-range-forecast?public_date=201507&nino_area=3.4&forecast_type_and_skill_measures=plumeo
LikeLike
robertscribbler
/ July 16, 2015Thanks for this. Good resource.
LikeLike
Ryan in New England
/ July 16, 2015I’m reading this latest entry (great job and many thanks, Robert) after reading about the record shattering fires, and as usual I am overwhelmed by the speed and intensity with which events are occurring, and frightened by what the future holds. I have the CBS morning news on in the background, and Michio Kaku is on talking about the Cascadia subduction zone, the massive earthquake that it can trigger and the fact that it is over due for a quake. It’s the “mother of all earthquake faults.” I just realized that mainstream media constantly reports on contrived and unrealistic dangers, making viewers frightened of possible dangers that May one day happen-terrorism, earthquakes, Iran making a nuclear bomb-but they totally ignore actual dangers that will certainly affect all their viewers. The one situation that people SHOULD be frightened of and worried about is ignored, while the media try like hell to scare their viewers with nonsensical dangers and manufactured threats. A ridiculous situation.
LikeLike
davidlwindt
/ July 16, 2015Absolutely agree, Ryan. In a rational world, the mainstream media would cover climate change 24/7 at this point. It’s overwhelmingly the most dire existential threat that we face. Though I’d note that the piece you heard must be related to this fascinating New Yorker article: the ‘really big one’ they discuss is certainly only a problem that will likely occur ‘someday’, but it doesn’t appear to fall into the category of nonsensical dangers or manufactured threats. And the author does at least touch upon the bigger issue of society’s response to a ‘looming crisis of … catastrophic proportions’:
http://www.newyorker.com/magazine/2015/07/20/the-really-big-one
—
“The Cascadia subduction zone remained hidden from us for so long because we could not see deep enough into the past. It poses a danger to us today because we have not thought deeply enough about the future. That is no longer a problem of information; we now understand very well what the Cascadia fault line will someday do. Nor is it a problem of imagination. If you are so inclined, you can watch an earthquake destroy much of the West Coast this summer in Brad Peyton’s “San Andreas,” while, in neighboring theatres, the world threatens to succumb to Armageddon by other means: viruses, robots, resource scarcity, zombies, aliens, plague. As those movies attest, we excel at imagining future scenarios, including awful ones. But such apocalyptic visions are a form of escapism, not a moral summons, and still less a plan of action. Where we stumble is in conjuring up grim futures in a way that helps to avert them.
“That problem is not specific to earthquakes, of course. The Cascadia situation, a calamity in its own right, is also a parable for this age of ecological reckoning, and the questions it raises are ones that we all now face. How should a society respond to a looming crisis of uncertain timing but of catastrophic proportions? How can it begin to right itself when its entire infrastructure and culture developed in a way that leaves it profoundly vulnerable to natural disaster?
—
What I find far more irritating is when people like Michio Kaku blabber on about how wondrous the world will soon be – space tourism, emotional robots, genetic engineering, laser fusion, etc etc. Such speculations are completely disconnected from the imminent disaster that is climate change. (Sells books, though 😉
LikeLike
dtlange
/ July 16, 2015– This graphic puts the Cascadia subduction zone into geographic perspective. I like the mark titled ‘Coast Mnts. buttress’.
I find it very valuable that we here tend to buttress RS and vice versa. And find weaknesses as well as. Good stuff.
Cascadia subduction zone map from (only by subscription) but a link via Google Images.
LikeLike
Ryan in New England
/ July 16, 2015Very true about Michio Kaku’s positive view of the future. Does he think we’ll be investing billions in developing new technology when we are struggling to feed our populations and rebuild from storm after storm after extreme event after extreme event? Our insane congress is already cutting funding for all things science. And they are hostile to technology and progress, like solar, wind and hi-tech solutions to our use of centuries old finite fuels.
And I didn’t mean to make light of the very real danger that the Cascadia subduction zone poses. It could one day cause a major disaster, with lives and properties destroyed. That said, the potential number of Americans affected is in the tens to hundreds of thousands, which is a huge number, until you compare it to the billions of humans across the globe that will definitely face hardship and potential disaster in the very near future. The most urgent and serious issues are completely ignored while the danger of others is exaggerated.
The potential effects of climate change in the near future, and current effects already being manifested should be front page news, reported around the clock daily on 24/7 news stations.
LikeLike
robertscribbler
/ July 17, 2015Have to agree with Ryan here. We are in the process of putting a hothouse mass extinction into fast motion and setting out lawn chairs for the entire observing human race in the disaster zone.
LikeLike
Ryan in New England
/ July 16, 2015This is a good example of the effect the media has on the masses by incorrectly prioritizing the threats we face.
http://thinkprogress.org/climate/2015/07/16/3681002/americans-worried-about-isis-developing-countries-worried-about-climate-change/
While large parts of the world are correctly concerned about AGW, biggest concern of Americans is ISIS. ISIS!! Most Americans couldn’t point out ISIS controlled territory on a map, never mind explain how exactly ISIS is a threat to them. Of course they also couldn’t explain how climate change induced drought in Syria led to social instability and revolution…and ISIS. It drives me crazy how completely ignorant of reality most Americans are.
LikeLike
robertscribbler
/ July 17, 2015Imagine the media hype if ISIS killed 2,000 to 3,000 people in one week. If ISIS wounded and resulted in the hospitalization of 50,000 others. If ISIS set off the largest evacuation in Canadian history just a couple of weeks later while at the same time burning up a territory in the Arctic the size of four Connecticuts. Imagine the great gnashing of teeth, the calls for action and mobilization and invasion.
Well that’s just a small taste of what climate change has treated us to in just the past 45 days. So, yeah, it’s amazing looking at the disparity of impact — ISIS being far smaller, the human hothouse much greater — and the news coverage, with climate change taking a back seat if it even has a seat at all.
LikeLike
robertscribbler
/ July 17, 2015Sea ice situation looks like it’s starting to deteriorate. Big drop in the JAXA measure. Concentration in Beaufort/Chukchi just went from bad to worse. Heat on the way from Pacific side.
LikeLike
Aldous
/ July 16, 2015July 15th 2015 Daily CO2 average comes in at 402.19 ppm.
It’s hard to believe that it was only in May of 2013 that the Keeling Curve at the Mauna Loa Observatory, for the first time, passed 400 ppm. Levels not seen in 2-4 million years.
Two years later and we potentially stand to have over 6 months with an average higher than 400 ppm. The rate of change is numbing.
If there is a geological highway, i’d say we are on it and we’re going 50 km/h over the speed limit.
LikeLike
robertscribbler
/ July 16, 2015Aldous — that 400 ppm threshold hit in March was a global mean including all reporting stations. The Mauna Loa proxy has been hitting above 400 ppm since 2013.
LikeLike
Greg
/ July 16, 2015As of 11:00 p.m. JST Thursday, the highest reported rainfall total in Japan was 521 millimeters (20.51 inches) in Kamikitayama village, Nara prefecture, south of Osaka. Typhoon Nangka is expected to keep dumping rain against mountains along with a stationary front until Saturday. Up to a meter of rain could fall in parts of Japan. If you’ve been there you know they have walled their waterways with concrete to carry waters quickly offshore (and line the pockets of corrupt construction firms and politicians) but landslides are common, never-the-less. Warm moist Pacific waters contributing to a record typhoon season…
http://www.weather.com/storms/typhoon/news/typhoon-nangka-west-pacific-japan-july2015
LikeLike
Greg
/ July 16, 2015Update on drought in Caribbean. Spoke with a colleague yesterday who told me she has water one day and then its shut off for the next two in San Juan, Puerto Rico. After discussing the details of how she deals with the challenges I found this article from Tuesday in the Times that summarizes and connects the dots. “The drought here has not received as much attention as the one in California and other Western states. But the dry weather, which meteorologists say is caused by the Pacific warming pattern known as El Niño, has spread across much of the Caribbean, affecting countries like Cuba and the Dominican Republican as well as crops and livestock. In Puerto Rico, some reservoirs have come within 30 days of running out of water.”
LikeLike
Patricia
/ July 16, 2015Question from a lay person:
Robert wrote, “Overall, most of the globe saw above average readings with only the region just south of Greenland, a small zone just west of the hot ‘Blob,’ and an area of somewhat cooler readings over West Antarctic showing below average readings.”
Are the cooler regions near Greenland and over the WA cooler because they contain melt water?
LikeLike
robertscribbler
/ July 16, 2015That is a good part of it, Patricia. The surface waters have been cooled and freshened by abnormally high volume outflows from Greenland during recent years. The outflow has not only resulted in localized cooling of waters, but it has interrupted some of the warm water transport north from the Gulf Stream.
LikeLike
wili
/ July 16, 2015That would help explain why there’s been so little melt (in terms of extent, anyway) on the Atlantic side. Do you think the sea ice in that area is relatively ‘safe’ now for the next few year, at least?
LikeLike
robertscribbler
/ July 16, 2015So the cool pool is off the southern tip of Greenland. The Laptev and Barents, by comparison, has been unusually hot since about 2005. So we have this new regime where there’s not much difference between winter and summer on the north Border of the Barents. Given the Latitudinal boundaries to insolation, my opinion is that sea ice in the Beaufort, Chukchi and Laptev goes before the Barents side sees further recession.
The odd thing this year is that much of the surface warming is occurring North of Greenland and the CAA. This hits the surface portion of the remaining thick ice which may have greater impacts to volume this year and be a set up more for 2016 and 2017.
If anything the AMOC slowdown and AMO switch will likely help preserve sea ice in Baffin Bay and Hudson Bay a bit. I say a bit because it doesn’t seem that water temperatures in those regions have been baffled much at all by the cool pool. It appears to have remained isolated in its impact on sea ice thus far. My opinion is we’d have to see something more intense to result in any kind of serious preservation or rebound negative feedback mechanism.
LikeLike
wili
/ July 16, 2015More drought news: http://www.cbc.ca/news/canada/british-columbia/level-4-drought-declared-for-south-coast-and-lower-fraser-1.3153654
“Level 4 drought declared for South Coast and Lower Fraser
‘Extremely dry’ conditions mean water managers may soon bring in tighter restrictions”
If deep droughts smack in the middle of rainforest zones don’t tell you that things are already fundamentally shifting, I’m not sure what would.
LikeLike
wili
/ July 16, 2015And the birds are feeling it, too: http://news.nationalgeographic.com/2015/07/1579-birds-snowpack-drought-flyway-wetlands-California/
LikeLike
dtlange
/ July 16, 2015Terrible news for our avian friends. More victims of our FF excesses.
LikeLike
dtlange
/ July 16, 2015And, we’ve already filled in for profit, poisoned, or dried out much of the ‘Flyway’.
LikeLike
wili
/ July 16, 2015More confirmation of what we already know. But we need to keep pounding these messages into the consciousness of the populace and of our leaders. Eventually the hard nail of reality may pierce the thick skull of denial and obliviousness:
http://www.noaanews.noaa.gov/stories2015/071615-international-report-confirms-2014-was-earths-warmest-year-on-record.html
“International report confirms: 2014 was Earth’s warmest year on record”
LikeLike
dtlange
/ July 16, 2015Andy SD, take a look at this.
Stratosphere pushes Santa Ana wind wildfires
A study says that the Santa Ana winds have an accomplice when it comes to California wildfires – extremely dry air pulled down from the stratosphere
Southern Californians and writers love to blame the hot, dry Santa Ana winds for tense, ugly moods, and the winds have long been associated with destructive wildfires.
Now, a new study finds that on occasion, the winds have an accomplice with respect to fires, at least: Natural atmospheric events known as stratospheric intrusions, which bring extremely dry air from the upper atmosphere down to the surface, adding to the fire danger effects of the Santa Anas, and exacerbating some air pollution episodes.

…
LikeLike
dtlange
/ July 16, 2015http://earthsky.org/earth/stratosphere-pushes-santa-ana-wind-wildfires
LikeLike
Andy in San Diego
/ July 16, 2015Weird. So used to those down drafts occurring in the high desert then blowing out towards the coast. This definitely adds a new variable.
LikeLike
Planet In Distress
/ July 16, 2015Munich Re is out with their biannual disaster report, the core of which is excerpted in this news report: http://www.claimsjournal.com/news/international/2015/07/15/264525.htm We are actually clocking a bit slower pace for disasters than last year, but barely. However, the second half of last year saw a slowdown and we are unlikely to see that with a monster El Nino emerging, so I am betting on an all-time record number of disasters. Well, “all-time” as in since reliable records were kept. So, since about 1980 I guess. Still, the trend is striking–a trebling of natural disasters in the last three decades.
LikeLike
robertscribbler
/ July 16, 2015Thanks for this. Good catch!
LikeLike
wili
/ July 16, 2015http://www.theguardian.com/environment/2015/jul/16/warming-of-oceans-due-to-climate-change-is-unstoppable-say-us-scientists?CMP=twt_environment
Warming of oceans due to climate change is unstoppable, say US scientists
Seas will continue to warm for centuries even if manmade greenhouse gas emissions were frozen at today’s levels, say US government scientists
“Scientists said the consequences of those warmer ocean temperatures would be felt for centuries to come – even if there were immediate efforts to cut the carbon emissions fuelling changes in the oceans.
“I think of it more like a fly wheel or a freight train. It takes a big push to get it going but it is moving now and will contiue to move long after we continue to pushing it,” Greg Johnson, an oceanographer at Noaa’s Pacific Marine Environmental Laboratory, told a conference call with reporters.
“Even if we were to freeze greenhouse gases at current levels, the sea would actually continue to warm for centuries and millennia, and as they continue to warm and expand the sea levels will continue to rise,” Johnson said.”
LikeLike
robertscribbler
/ July 16, 2015Even in the best case, we’ve probably locked in another 1 C warming long term. That’s including an assumptions of cold turkey cessation of fossil fuel burning and a relatively mild earth system response. The good news from that scenario is that warming slows down dramatically once the human carbon emission stops.
We are kind of on a razor edge now. Our policies, how much renewables we adopt and how rapidly we adopt them, how much fossil fuel infrastructure we shut down and how rapidly all really play into the final outcomes.
But we’ve already locked in a degree of warming that is irreversible that even in the best case results in a changed world. Perhaps if we can learn to draw carbon out of the system in addition to doing the renewables switch and the carbon emissions shut down. Perhaps that will help to mitigate some of the added warming locked in.
But yeah, it’s a freight train coming our way.
LikeLike
Alexander Ač
/ July 16, 2015Age of megafires, absolutely:
LikeLike
Dr Bob Rich
/ July 16, 2015Reblogged this on Bobbing Around and commented:
And there is nothing safe about 2 degrees C. It is a disastrously high “limit.”
LikeLike
robertscribbler
/ July 17, 2015Just read your about section. Kudos! Best grandpa ever.
LikeLike
climatehawk1 (@climatehawk1)
/ July 17, 2015Australian PM Abbott: full steam ahead on #coal, ‘the foundation of prosperity’ http://gu.com/p/4aknn/stw #climate #divest
LikeLike