Haiyan Redux? Monster Typhoon Hagupit Forecast To Strike Philippines Still Reeling From Last Year’s Terrible Blow

In early November of 2013 the monster Typhoon Haiyan roared ashore in the Central Philippines claiming over 8,000 souls and rendering many thousands more homeless. It was the strongest storm ever recorded on Earth over land — boasting winds exceeding 190 mph and pressures below 900 mb. It formed over ocean surface waters that were far warmer than normal and whose heat extended much further into the ocean depths than was typical. The kind of powerful storm that many atmospheric scientists say is more likely to occur as humans keep heating the ocean and atmosphere, providing fuel and conditions to make the most intense storms ever stronger.

Today, more than a year later, 15,000 people are still living in tents along a swath that saw more than 4 million homes destroyed as Haiyan made landfall. Climate and extreme weather refugees in a world that is, sadly, seeing more and more dislocated people. People affected by drought, water loss, and by the devastation of storms. From Syria to Brazil to California to the Philippines, the refrain is the same. Bad weather pushed people to the edge or over. It took their homes or made living where they are a nightmare.

And, for a Philippines still reeling from Haiyan’s brutal blow, it may just be happening again.

Hagupit

(December 4 infrared satellite shot of Hagupit as it approaches the central Philippines. Image source: NOAA MTSAT.)

As of yesterday afternoon Hagupit had bombed out into a category 5 monster storm boasting 1 minute sustained winds of 180 mph and a minimum central pressure of 905 mb. This put Hagupit in a tie with super typhoons Vongfong and Nuri as the strongest storms of 2014. Not quite as strong as Haiyan, but still a very dangerous storm. One strong enough to fling out 50 foot waves and bring a storm surge as tall as a two story house to Philippine shores.

Over the next few days Hagupit is expected to steadily weaken, roaring ashore in the Central Philippines as a strong Category 4 or weak Category 5 before slowly churning off toward the WNW toward Manila.

Hagupit is a gradual mover and covers a relatively broad area. The result is that tropical storm and intense typhoon conditions will persist over regions for longer periods than occurred with Haiyan, even if Hagupit is not quite as powerful. As mentioned above, of serious concern is that the currently predicted track of Hagupit will bring it near or over regions that have yet to fully recover from the terrible impacts of Haiyan.

Hagupit predicted track

(Predicted track and strength of Hagupit. Image source: Joint Typhoon Warning Center.)

Overall, the predicted track is a bit to the north of Haiyan’s shoreward surge of last year. However, the hardest hit areas are still uncomfortably close to the guidance cone. In addition, the current projected path features more flood prone coastal regions than Haiyan’s path. With many bay features to funnel in and amplify a storm surge.

Along this track, the storm would primarily be a major rainfall concern by the time it reached the capital city of Manila.

Climatology — Very Strong Supertyphoon in December Feature of a Globe in Hot Water

Climatologically, it’s a bit odd for such a strong storm to form in December, even in the warm Western Pacific (at peak intensity, Hagupit was the strongest December cyclone in at least the past 15 years). During recent years and under the apparent influence of a heating climate this region has tended to feature tropical cyclone formation year-round. A phenomena that some atmospheric scientists expect to continue to ramp up with human-caused warming.

sea surface temperature anomaly West Pacific

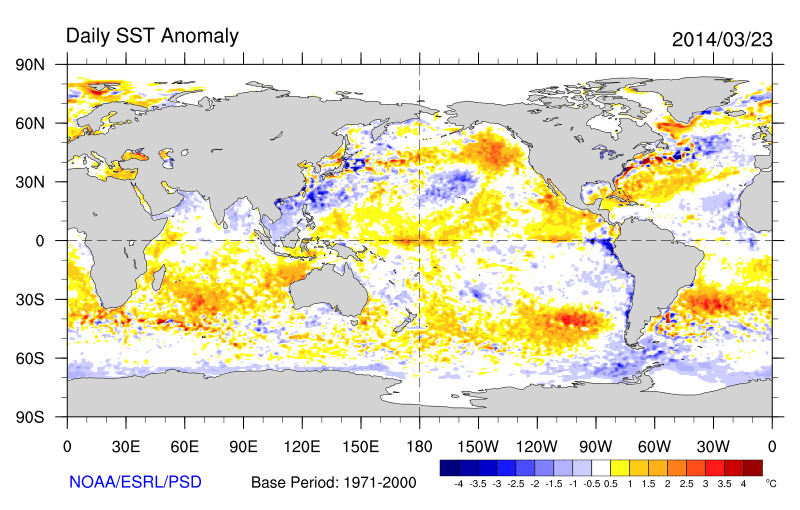
(Sea surface temperature anomaly for the Western Pacific in the vicinity of the Philippines. Image source: NOAA Sea Surface Temperature Anomaly Charts.)

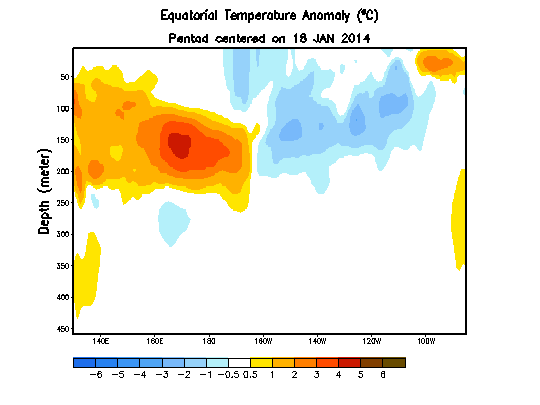
Sea surface temperatures for the region remain in a very hot range of 0.5 to 2 degrees Celsius above the 20th Century average. Meanwhile, temperatures at depth are in the slightly above average range. So Hagupit has plenty of energy to feed on, even if conditions aren’t quite as favorable as they were for Haiyan last year.

Perhaps more striking is the persistence and intensity of ocean surface heat on both the regional and global levels. GFS models for the past 8 months have shown positive ocean surface anomalies in the range of +0.6 to +1.4 C above the 20th Century average. A very, very hot world ocean, especially when we consider that the typical major ocean heating event called El Nino was in neutral status throughout this period. In this context, it is also worth noting that January through October of 2014 was the hottest such period for the world surface in all of the 136 year global climate record. Again, occurring without the added heating influence of a declared El Nino.

The Western Pacific, itself, is the hottest ocean zone in the world. And high temperature departures there have been implicated both in increasing storminess at the surface and in a troubling heightening of the troposphere over a warm and warming region.

It is in this context that we should consider the extraordinary storms we’ve recently witnessed and the major potential impacts of Hagupit over the coming days.

*     *     *     *      *

*     *     *     *      *

UPDATE: Thursday, Hagupit went through an eye replacement cycle as well as a brief period of weakening. This caused the storm to temporarily dip below super typhoon intensity (150 mph). As of Friday morning (EST), Hagupit had re-strengthened to a 150 mph monster storm with a very low central pressure of 915 mb.

A large and intense storm that is, at least one day ahead of landfall, already pushing seas to the steps of homes, washing out roads in the city of Samar where Hagupit is expected to make landfall, and lashing the Philippine coast with intense squalls.

It is worth noting that many communities in Samar and along the Philippine coast are low-lying and are thus very vulnerable to the effects of Hagupit. A fact the Philippine government appears well aware of as it has already evacuated more than 500,000 people ahead of landfall.

The storm will also race ashore over seas already elevated by human-caused climate change, though the peak of the warm water bulge has shifted east in a broader transition toward more El Nino-like conditions for the Equatorial Pacific.

Wind Shear — Limiting Storm Intensity

Hagupit is feeling the impacts of wind shear to its south and west and this influence is likely to keep the storm below the terrible intensities seen during Haiyan.

Hagupit SW wind shear

(Hagupit feeling the effects of southwest wind shear on December 5, 2014. Despite these influences, Hagupit is maintaining status as a strong category 4 storm. Image source: NOAA MTSAT.)

It is, nonetheless, predicted to be a very powerful storm — raking the Philippine Coast with category 4 winds (135-155 mph), monster waves, storm surges in excess of 10 feet and dumping 10-25 inches of rainfall over very broad regions. Areas along the path of the storm are likely to be heavily impacted by rainfall as the storm weakens and dumps copious moisture. The expected very heavy rainfall has also prompted lahar warnings for mudslides on the flanks of volcanos Mayan and Bulusan — both in Hagupit’s path.

Hagupit track

(Updated track of Hagupit from the Joint Typhoon Warning Center)

Hagupit’s current projected track brings its center about 50-100 miles north of Haiyan’s path. This predicted motion would spare regions hardest hit by Haiyan from Hagupit’s worst impacts. However, recent satellite imagery depicts a bit of a southward jog. This recent motion, combined with the storm’s broad size and slow forward speed, mean these regions may still take a substantial beating.

The storm is a slow mover — advancing only at a rate of 5-10 miles per hour. So regions will feel the impacts of Hagupit for much longer than Haiyan. For the Philippines as a whole, it looks like this will be a three day event. A longer duration storm, though somewhat less intense.

Links:

NOAA MTSAT

Joint Typhoon Warning Center

NOAA Sea Surface Temperature Anomaly Charts

More than 15,000 People Still Living in Tents a Year After Haiyan

Weather Underground (Who Is Matching Donations to a Charity Providing Relief for the Victims of Extreme Weather)

James Reynolds — Providing Live Updates From Samar on His Twitter Feed

Hat tip to Colorado Bob

(Post Edited on December 5)

NASA GISS Shows April 2014 was Second Hottest on Record Amidst Epic Siberian Heatwave, Wildfires

Extraordinary ocean surface temperature anomalies that spiked into the range of + 1.4 C above 1880s values and a continued progression of the Pacific toward El Nino began to take its toll in April. NASA GISS shows that global temperature anomalies hit 0.73 C above the 1951-1980 average last month, the second hottest in the record and just behind 2010’s +0.80 C reading.

2010 was an El Nino year and the most recent record-holder for hottest year in the NASA measure. So it appears all it takes is just a slight tilt toward El Nino, as we saw in April, to challenge previous highs.

NASA April 2nd Hottest

(Temperature anomalies for April of 2014 vs the 1951-1980 average. Image source: NASA GISS.)

The global hotspot for the month again centered on the Yakutia region of Siberia stretching south into Mongolia and Northern China and north into the East Siberian and Beaufort Seas. Positive anomaly values hit as high as 7.9 degrees C above average for the entire month in this hot zone. This was the same region that experienced anomalously intense wildfires throughout much of April and into early May with some fires burning along gargantuan fronts stretching 20 to 100 miles.

Alaska, Europe, North Africa, the Middle East, Queensland and West Antarctica also displayed very warm readings in the range of 2-4 C above average for the month. Meanwhile, positive sea surface temperature anomalies advanced into the Eastern Equatorial Pacific during April, a clear sign that ocean heat was beginning to transfer back to the atmosphere.

Negative temperature anomalies were confined primarily to the Hudson Bay region and to the High Arctic above 80 North in the Northern Hemisphere and in the Southern Ocean adjacent to Antarctica in the Southern Hemisphere. These cool zones were both small and isolated as most of the world experienced above average to well above average readings.

Zonal anomalies April 2014 NASA

(Temperature anomalies by Latitudinal zone. Image source: NASA GISS.)

High latitude zonal anomalies in the Northern Hemisphere fell off with the arrival of Spring bringing down high temperature anomalies that occur as a result of polar amplification due to human-caused warming and ramp up during late Autumn and early-to-mid Winter. Cold air again retreated toward the pole where it will fight a battle with Summer heat over a diminishing ice cover. Warmth followed the cold retreat into high latitude regions, though, pushing heat anomaly values up to an extreme +2.7 in the region around 70 degrees North Latitude signalling the location of the warm-cold battle line for the onset of late Spring and early Summer. It is a line well north. One that includes sections of the Arctic Ocean now experiencing early melt and/or sea ice break-up.

With the onset of austral fall, polar amplification ramped up for the Southern Hemisphere with extreme low latitude Antarctica experiencing +1.45 C above average temperatures for the month.

Following March’s +0.70 above average reading, April showed continued progress toward warming. And with May seeing further advancement toward El Nino in the first and second week, we can expect global temperature values are likely to keep rising.

Links:

NASA GISS

When April is the New July: Siberia’s Epic Wildfires Come Far Too Early


Monster El Nino Emerging From the Depths. Nose of Massive Kelvin Wave Breaks Surface in Eastern Pacific

Monster El Nino

(A monster Kelvin wave, possibly more powerful than the 1997-98 event, is now rushing toward the surface of the Eastern Pacific. Image source: NOAA/ESRL.)

We are observing an extraordinarily powerful Kelvin Wave, one that was likely intensified by factors related to human global warming, traveling across the Pacific. It appears to be an epic event in the making. One that may be hotter and stronger than even the record-shattering 1997-98 El Nino. What this means is that we may well be staring down the throat of a global warming riled monster.

*   *    *    *    *

Ever since the early 2000s very strong east to west trade winds have been blowing across the Pacific. By around 2010, the force of this wind pattern had risen to never before seen records. Over the years, these record winds piled very warm waters in a region of the world east of the Philippines and Australia. As the pool grew warmer, evaporation increased and salinity levels in the hot water pool spiked. Increasing salinity in the zone resulted in a down-welling current that transferred heat into the ocean’s depths.

By 2013, this hot water pool had grown into a vast abyss of heat. Cyclones forming over this zone experienced a kick in intensity as the typical upwelling force of their winds only dredged more hot water from the ocean deeps. It was a pattern that is contrary to typical tropical storm dynamics in which cooler waters drawn up by intense storms tend to limit their peak strength. Not so with mega-typhoon Haiyan, the strongest storm ever to strike land. The cyclonic wind pattern only dredged more heat from the extraordinarily deep hot water. And so the storm only grew stronger and stronger, knowing little in the way of limits before it barreled into an already storm-battered Philippines.

After Haiyan’s passage, the heat pool remained, only growing deeper and more intense, waiting for a change in the wind. And by January of 2014, that wind change was already well on its way.

In Deep, Hot Water

Like an enormous bag waiting to burst eastward, the hot water pool contained temperatures of 29-30 degrees C or hotter and sagged deep, extending up to 150 meters below the ocean surface. A vast stretch of explosive heat that had been held in check from an equatorial surge only by the strongest trade winds on record. But by January, those trade winds had faded. The east-west flow first weakened, then it fluttered, then it died, allowing the wind direction to reverse.

Strong Trade Winds Hot Ocean

(Did strong trade winds intensify the current Kelvin Wave by piling hot water into the Western Pacific? Top graph shows ocean heat content rise, bottom graph shows zonal wind strength of the trade winds through 2011. Note that IPO — Interdecadal Pacific Oscillation — divergence roughly correlates with trade wind intensity fluctuation. Image source: England Study.)

This trade wind reversal has, since January, been facilitated by a string of explosive low pressure systems that developed in the vicinity of the Western Pacific both south and north of the equator. Northern hemisphere storms circulate in a counter-clockwise fashion while southern hemisphere storms circulate clockwise. When the storms line up, they kick storm winds out along the equator, providing strong reversals to the trade winds and further shoving our hot, monster Kelvin Wave to the east.

And as the trade winds fell and reversed due to this sporadic assault of countervailing storms, the hot, deep pool of water surged eastwards. To those on the surface, the motion was invisible. And but for a series of floats spread throughout the Pacific, we would never know a monster thing was rushing along toward the east at a depth of about 150 meters below.

But the floats did their work and by late February it looked like a rather strong heat pulse was on its way across the Pacific Ocean. Risks began to dramatically increase that the heat would breach the surface of the Eastern Equatorial Pacific and set in place the globe-altering weather pattern called El Nino. In a world where human warming was already having serious impacts, the emergence of a new, potentially strong El Nino was not at all a welcome sign. For one, it meant new global high temperature records were likely to soon follow.

It also meant that world food security may well be about to receive yet one more staggering blow.

First Warnings

As the signal for a new El Nino began to appear in the models during late February, NOAA started to issue watches and predictions. Initial estimates were for a 52% chance of El Nino by late 2014.

These warnings caused a ripple of concern through the global food markets. Already reeling under the insults of a series of severe, climate change induced, droughts from Brazil and Argentina, to California and Texas, to the Middle East, to China, the world’s growers were hardly prepared for another series of anomalous weather events. Russia rolling into bread-basket Ukraine further set anxieties alight. But the threat of even a moderate El Nino and its associated droughts and extreme weather seemed to be a rising perfect storm for what was already a terrible year.

Growers in Southeast Asia chided forecasters in the West, with some cautioning that El Nino trackers do their best to quiet down so as not to induce a panic.

Southeast Asia often experiences an interruption of the annual monsoon in association with El Nino. So the region, which was already suffering from ground water shortages, lowering glacial outflows and sporadic periods of intense drought — all conditions related to growth, over-consumption and climate change — could ill afford yet one more strike against it.

Still, the strike appeared to be gathering heat and steam.

A Rising Monster Pushing the Tip of Its Nose up in the Eastern Pacific

As growers and states with marginal or bad food security grew more anxious, the hot water surge intensified. Researchers independent of NOAA began to issue estimates for a 60, 70 even 80% probability for the emergence of El Nino. Others, tracking what now appeared to be the hottest Kelvin wave ever seen, began to issue warnings that a monster event may well be on the way.

Deep Hot Water

(Most recent NOAA Kelvin Wave assessment. Top panel shows deep water high temperature anomalies telegraphing across the Pacific and pushing toward the surface. Large, deep pool of hot water providing energy to for the wave is visible in the bottom panel. Image source: NOAA.)

At issue were deep ocean temperature anomalies that were now rushing across the Pacific and beginning to rise toward the surface. The zone in late February that had indicated temperature anomalies in the range of +4-6 C was over an area of approximately 48 degrees of longitude. By March 19, the hot zone of 4-6 C above normal temperatures had expanded to cover about 62 degrees of longitude, and contained a hotter 5-6 C anomaly zone that was now larger than the 4-6 C zone from late February. The deep, hot water pool in the Western Pacific was now beginning to set up a kind of bridge in which it could transfer east, dump its heat into the atmosphere and disrupt global weather. Perhaps, somewhat more disturbing, it was linking to a deep pool of warmer water off the coast of South America (also see animation at the top of this post).

By comparison, the monster El Nino of 1997 featured a Kelvin Wave covering about the same area but whose high temperature anomalies only peaked out at about 4.5 C above average. So the current Kelvin wave is of approximately the same size but, based on current observations, appears to contain more heat.

The Kelvin wave had also begun to tilt up in the front with its ‘nose’ just starting to break the Pacific Ocean surface at between 120 and 100 West Longitude. This put the tip of the rising heat spike almost due south of Baja California and almost due west of the Peru and Ecuador border as of yesterday, March 23.

Monster El Nino Shows Nose

(Monster El Nino pokes the tip of its nose through Pacific surface waters between 120 W longitude and 100 W longitude along the equator. Image source: NOAA/ESRL.)

In the above ocean temperature anomaly measure for March 23, 2014, we can see a hot pool in the range of 1 to 2 C above average beginning to emerge between 120 and 100 West Longitude. It is a heat pulse that has eliminated all but the closest near-shore cool upwelling along the west coast of South America.

Should the rest of the Kelvin wave follow, spot temperature anomalies in this region will spike well above 4 C and possibly has high as 5-6 C. Such an event would be even stronger than the one seen in 1997-98, drive global temperatures about .05 to .2 C hotter than previous records in a single year, and set off a series of extreme weather that, when combined with the already severe conditions set in place by human-caused warming, may well be far in excess of those seen during past events.

Links:

NOAA/ESRL

England Study

Abnormally Hot, Deep Pacific Ocean Waters Explode Haiyan into Monster Storm

NOAA El Nino Monitoring

Climate Change Pushing World to the Brink of Food Crisis

The Monsters of Growth Shock Rise: Conflict in the Ukraine, Global Food Crisis, and Spending 500 Billion Dollars to Wreck the Climate

India Times Chides Western Meteorologists about El Nino Predictions

Unusually Intense El Nino May Lie Ahead, Scientists Say

Disquieting Facts About El Nino

Washington Post: A Super El Nino May be on the Way

US Atmospheric Scientists Predict Intense El Nino

Weather Centre: Could the Next Super El Nino Be Forming?

Extensive Dark Snow, Very Large Melt Lakes Visible Over West Slope of Greenland as Late Season Melt Pulse Continues

Late Season Greenland Melt Pulse Continues.

Late Season Greenland Melt Pulse Continues.

(Image source: NSIDC)

A strong, late-season melt pulse continued over the Greenland ice sheet this weekend as melt covered a much greater portion of the ice sheet than is typical for this time of year. As of late July, the area of the Greenland ice sheet subject to melt had spiked to nearly 45%. Soon after, a second melt spike to around 38% followed. Over the past two weeks, melt area coverage has fluctuated between 5 and 25 percentage points above the seasonal average for this time of year, maintaining at or above the typical melt season maximum of around 25% for almost all of this time.

This late-season melt surge was driven by a switch in the polar Jet Stream. A trough which had dominated through much of summer, bringing near average temperatures and melt conditions, had eroded and by late July a broad ridge began to form. This high amplitude wave dredged warm air up from as far south as the south-eastern US, then dumped it on the west facing coast of Greenland. There, last week, a new record all time high temperature of 78.6 degrees (Fahrenheit) shattered Greenland’s previous highest temperature of 77.9 degrees.

And this record heat is beginning to have a very visible affect on the ice. Aqua satellite passes this weekend recorded a visible darkening of ice cover in the region most greatly impacted by high temperatures last week. The snow and ice cover there has taken on a sooty appearance with darker gray tendrils finding their way deep into the ice pack. At the same time, large melt lakes expanded over the region with some of these lakes measuring more than  three kilometers across.

In this first Modis shot we see a broad region of darkened, melt-pond speckled ice forming over a very large swath of Greenland’s western ice sheet:

Greenland west coast melt, August 4.

Greenland west coast melt, August 4.

(Image source: Lance-Modis)

For reference, Baffin Bay is toward the left of the image, the southern tip of Greenland, toward the bottom, and the far right frame of the image runs about down the center-line of the south Greenland ice spur. Note the swatch of dark ice that appears much like dirty snow running down western side of the ice sheet. This major melt region, at its widest, appears to dive as much as 100 miles into the ice sheet. Even at this level of resolution, we can see the large melt lakes speckling the inland border of this darkened region.

Zooming in to a region where melt appears to have penetrated deepest into the ice pack, we find even more dramatic features.

Greenland melt lakes, dark snow, August 4, 2013.

Greenland melt lakes, dark snow, August 4, 2013.

(Image source: Lance Modis)

The orientation of this particular image is the same as the larger image above, but we have just zoomed in to a large, central melt region. Toward the coast, we can see melt and ice flowing into channels and fjords. Adjacent to this rocky coastal zone is a region of more rapidly mobile and fractured ice flows. Few melt ponds are visible in this region and this is, likely, due to the large fissures and steep vertical faces that cover most of the ice surface in this area. It is beyond this boundary margin and inward toward the ice sheet’s center that we find a second region of very dark snow and ice. This area shows some large melt ponds, but its prominent feature is an almost complete loss of reflective snow cover with lower layers of soot deposition and darker sediment now exposed. Still further in, we find the third, and arguably most dramatic, melt zone. This particular area is coated, not in dark gray, but in blue. It is a feature primarily caused by a very extensive surface melt covering much of this region. In this single picture, we can count over a hundred large melt lakes mostly dominating this region. They range in size from about a half kilometer to over three kilometers across. Connecting these lakes is what appears to be a web of melt rivers, some of which terminate in moulins that core into the glacier’s heart, delivering warm melt water the frigid ice’s center and base. The general bluish color of this region indicates a very high degree of melt with puddles and pools below the 250 meter resolution of this particular satellite shot lending an azure tint to the ice.

Conditions in Context

Over the past two decades, Greenland has shown a very disturbing and rapid melt response to human-caused warming. During the mid 1990s, Greenland began to show a net loss of ice mass. Through the 2000s, this melt rate accelerated, growing generally, but rapidly peaking in rather disturbing melt surges as warm weather conditions grew more extreme during certain years. By 2012, a very extreme melt year had occurred, resulting in ice sheet losses on the order of 700 cubic kilometers in just one year. These peak melt years appeared to re-cur at a rate of once every 2-5 years even as overall average melt from Greenland grew to a disturbing 500 cubic kilometers by the early 2010s.

Even worse, sensors deep within the ice sheet indicated that the ice sheet had become more mobile, increasing in velocity by about 2-3 percent each year since 2010.

Though 2013 does not appear to be a peak melt year, as weather conditions have favored less melt than in 2012, the continued softening of the Greenland ice sheet remains a very disturbing summer feature. This year’s west coast melt has been particularly dramatic, with the most recent shots shown above featuring some of the worst melts I have yet witnessed.

UPDATE:

Prokaryotes (think about the name) was kind enough to produce the following video of this blog on his own platform: Climate State. I’ve linked the YouTube version here:

Links:

Greenland Ice Sheet Slipping Under Hottest Temperatures Ever Recorded

Keep up with Greenland Melt by Reading Jason Box’s Website

The Dark Snow Project

NSIDC’s Review of the Record 2012 Greenland Melt Season