
(Global temperature anomalies for 2013. Image source: NOAA)
With the readings coming in for 2013 — atmosphere, ocean surface and the deep ocean — it becomes increasingly obvious that anyone saying planetary warming has slowed down is clearly misinformed.
Criticisms of the misinformed aside, according to reports from NOAA’s National Climate Data Center, 2013 was the world’s 4th hottest on record since temperature measures began in 1880. All this despite ENSO conditions remaining neutral in the Eastern Pacific and deep ocean heat content continuing to rapidly rise while sucking a portion of that heat out of the atmosphere.
The NCDC measure found numerous regions in which temperatures were the hottest ever recorded including a large swath of Australia, a broad stretch of the Pacific Ocean adjacent to New Guinea and the Philippines, an area larger than Texas at the heart of the Asian Continent, and multiple other locations ranging from south of Svalbard to East Africa to the Indian Ocean to the Northern and Southern Pacific. Aside from these record hot zones, over 70 percent of the land and ocean surface measured came up either hotter than average or much hotter than average while 28% of the globe experienced average temperatures and less than 2% of the Earth’s surface experienced cooler than average temperatures.
Notably, no regions of the globe saw record coldest temperatures and the only zone coming up cooler than normal cropped up in the Southern Ocean just north of Antarctica.
NASA found 2013 to be the 7th hottest on record and the 2nd hottest non El Nino year on record.
Helpfully, NASA also put together a graph of global temperature averages as measured since 1950 showing that atmospheric warming has continued unabated despite much false and inaccurate press coverage of a ‘global warming hiatus.’

(GISS temperature measurements with trend lines for El Nino, La Nina and all years. It’s worth noting that this temperature graph indicates no pause in warming since 1950. Instead, what we see are inexorable global surface temperature increases. Image source: NASA GISS)
Deep Ocean Warming Measures Far More Dire
Recent news reports have also falsely claimed that more heat going into the deep ocean, as measured by NASA, NOAA, the Trenberth study, and others, is an indication of lowered global climate sensitivity. To the contrary, a warming ocean contains two very dire consequences that, if set into play, could both enhance warming, and create an ecological nightmare for first the oceans and finally the surface world.
The first, a growing risk of subsea methane release, is greatly enhanced by a rapidly warming ocean. We have covered the risks and consequences of methane release (both seabed and terrestrial methane) in numerous posts over the past year. For your convenience I’ve linked them below. But, suffice it to say that a warming ocean puts at risk the more rapid release of hundreds of gigatons of methane, an amount that could greatly amplify the already powerful and ongoing signal of human warming. More worrisome, initial indications show that at least some of this methane is already destabilized and venting into the world ocean system and atmosphere.
The second consequence involves growing ocean hypoxia and anoxia as the oceans warm, become more stratified and as major ocean current systems are disrupted and altered. Growing ocean hypoxia and anoxia results in, among other terrible impacts, ocean sea bottoms that are less and less able to support a diversity of life and that, more and more, come to support dangerous hydrogen sulfide producing bacteria.
A third consequence includes the basal melting of ocean contacting ice sheets. Such melting has already destabilized the massive Pine Island Glacier which, according to a recent scientific study, is on the path to an inevitable collapse into the Southern Ocean.
Yet, according to these excellent graphs produced by Larry Hamilton for The Arctic Ice Blog, world ocean heat content has been rising by leaps and bounds over the past few years, especially in the deep ocean where warming puts at risk the most dangerous of outcomes — methane release and anoxia.

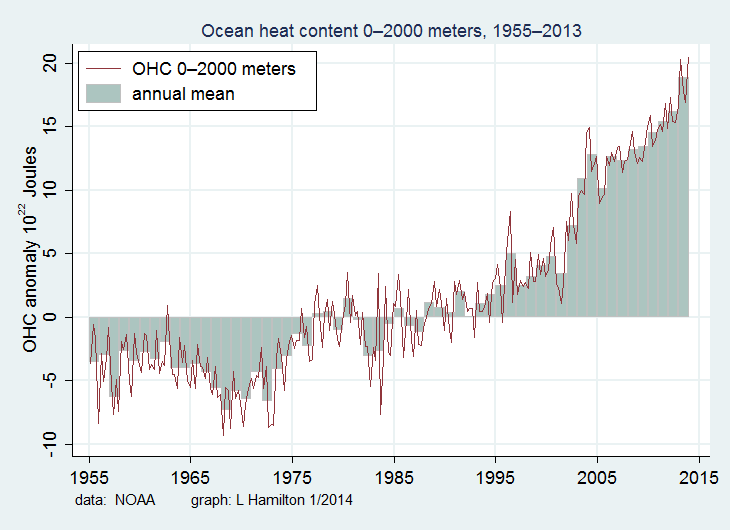
(Image source: L Hamilton. Image data: NOAA. Produced for The Arctic Ice Blog. Note the extraordinarily steep slope indicating deep ocean warming since 1985.)
The top graph shows ocean heat content increases in the first 700 meters of ocean water. The bottom graph shows ocean heat content in the first 2000 meters of ocean water. Note that ocean heat content gains for the deep ocean (2000 meter graph) are more rapid by 25% than heat content gains in the shallower ocean. Meanwhile, both graphs show a very rapid accumulation of heat, especially through recent years during which the so-called global warming hiatus was in effect.
If we could find a place to put the majority of heat from human-caused climate change, the deep ocean would be the last place any sane ecologist would look. Warming the deep ocean is a worst-case disaster in the making. It puts added stress on methane hydrate stores and it pushes the very dangerous consequences of ocean stratification and anoxia along at a much more rapid pace.
These are not optimistic measures. In my view, this is much closer to an absolute worst case.
Mixed Outlook for 2014
Early indications for 2014 show an increased chance of La Nina for the first three months of the year. That said, ocean surface heat in the Eastern equatorial Pacific appears to be on the rise, especially in areas closest to coastal South America.

(Image source: NOAA)
Should ENSO tip the scale to El Nino, it is almost certain we will see a hottest year on record for surface temperatures during 2014. Should conditions remain neutral or tip to La Nina, we’ll still likely experience a top ten hottest year on record (atmosphere) even as ever more heat is transferred to the deep ocean.
Links:
NASA Finds 2013 Sustained Long-Term Warming Trend
National Climate Data Center Global Analysis
Larry Hamilton CA The Arctic Ice Blog
The Arctic Methane Monster Continues its Ominous Rumbling
Arctic Methane Monster Shortens Tail
The Arctic Methane Monster Stirs
Through the Looking Glass of the Great Dying
Awakening the Horrors of the Ancient Hothouse — Hydrogen Sulfide in the World’s Warming Oceans
Warming Ocean, Upwelling to Make an End to Pine Island Glacier


mikkel
/ January 22, 2014I linked a few posts back about how the PDO should switch in the next couple of years and release much of the heat it’s been claiming. Do you have any knowledge of research into what will happen when there are sudden releases of the stored energy?
LikeLike
robertscribbler
/ January 22, 2014We should be close to the end of a typical PDO cycle, shouldn’t we? Although I sometimes wonder if we’ve thrown PDO out of whack.
A large Pacific Ocean heat dump would be very painful, stretching some already stressed weather/patterns to the breaking point. Among other things, a west coast megastorm is not out of the question.
LikeLike
Miep
/ January 22, 2014A west coast megastorm? Like where it rains a foot in a day?
That’s what I’m most afraid of far as summer events go…that during what tends to be our summer monsoon season, the jet will get stuck here during an El Nino when we get twice as much rain as usual, and flood us out like last year with Boulder…near here in the Guadalupes there was a foot of rain in a day too; we weren’t much in the news because we don’t have all these people living in the mountains.
One doesn’t complain about rain in the desert, but that much rain that fast does tend to move stuff around.
LikeLike
robertscribbler
/ January 22, 2014El Nino can cough up a rather large moisture flow for the western region. With the way evaporation and precipitation have been amped up in recent years, it appears possible that a strong El Nino year could result in a fixed river of moisture over the west coast where very powerful storms progress in train. Given the way rainfall events have been much more extreme I don’t think the term megastorm is too much of an exaggeration.
Per your experience, I’ve noticed enhanced explosive monsoonal precipitation episodes for the west featuring extreme rainfall totals over the past year. In the summer the precipitation/evaporation rates are getting to be pretty extraordinary. We’re looking at an abnormal frequency of catastrophic drought and rainfall events in general over much of the globe. See four feet of rainfall within a week over the Philippines.
LikeLike
mikkel
/ January 22, 2014I presume he means something like this http://www.montereycountyweekly.com/news/cover/article_7c1fe064-102f-11e3-ad7a-0019bb30f31a.html
LikeLike
robertscribbler
/ January 22, 2014You got it. The problem presented is that 100 and 200 year events now appear to be happening with almost decadal frequency. The evaporation/precipitation system and the instability that feeds extreme events of this kind are in overdrive at this time. With the Pacific already so full of heat and bleeding so much moisture, it is certainly a strong concern.
Consider the massive flows of moisture now evident in the Asian Pacific zone near the hot water pool off of the Philippines and New Guinea. Shift that hot pool eastward with the switch to El Nino. It doesn’t take too much imagination to envision how such a hot, moist zone could interact with a, what would otherwise be typical, progression of storms impacting the US West Coast.
LikeLike
mikkel
/ January 23, 2014Thanks Robert, I hadn’t thought of that particular outcome but it seems extremely likely that is precisely what will happen
I live on the South Island of NZ so see first hand what happens when a large amount of moisture gathers across an ocean and runs smack into mountains on the coast:
“The gorgeous fiord of Milford Sound is one of New Zealand’s most popular tourist destinations and also long considered the country’s officially wettest location. It once received 22”/559 mm of rainfall in 24 hours on April 17, 1939. However, portions of the western Fiordland and Westland of the Southern Alps are estimated to receive as much as 630”/16000 mm of precipitation a year.”
LikeLike
Miep
/ January 23, 2014I hiked Milford in 1981, and I remember that six-feet-of-rain-per-year figure. Easily the most beautiful place I’ve ever been.
LikeLike
Miep
/ January 23, 2014no, wait, it must have been 60?
LikeLike
mikkel
/ January 23, 2014I think Milford gets around 8m so 24 feet or so. Some other parts probably average closer to 50 and easily get to 60 in a wet year.
LikeLike
Miep
/ January 23, 2014I remember 6 so it may be I was just misrembering 36. In any case, enough to grow one fine crop of moss, among other things!
LikeLike
mikkel
/ January 23, 2014Or 6 meters!
LikeLike
Miep
/ January 23, 2014My father and his second family had been living there for six years at the point and were doubtless used to thinking in metric, but I was not and would have been remembering the translation. But yes, aren’t we USAians silly for clinging to these outmoded systems of measurement?
Although if we were really advanced we’d use base 16.
LikeLike
Colorado Bob
/ January 23, 2014Tipping El Ninos harder as Pacific sensor array output ‘collapses’
Floating sensors that have predicted extreme weather events for decades and saved lives in the process have been left to “collapse” amid vandalism and US budget cuts.
The United States and Japan set up the Tropical Pacific Observing System – made up of about 70 buoys – after a large El Nino event in 1982-83 caught forecasters unaware. Fourteen years later, the moored devices helped provide warnings of the “super” 1997-98 El Nino almost a year before it hit, probably saving lives and preventing billions of dollars in damage.
But the performance of the moored devices, which take atmospheric readings and monitor conditions down to 500 metres below the sea’s surface, has fallen to about 40 per cent since 2012, according to the the climate observation director of the US National Oceanic and Atmospheric Administration, David Legler.
Performance drop
After operating at between 80-90 per cent capacity until about 2012, the performance of the system, also known as the TAO/TRITON array of buoys, dropped to “around 40 per cent” by the end of 2013, Dr Legler said.
Read more: http://www.smh.com.au/environment/climate-change/tipping-el-ninos-harder-as-pacific-sensor-array-output-collapses-20140122-318q4.html#ixzz2rFDkda9t
http://www.smh.com.au/environment/climate-change/tipping-el-ninos-harder-as-pacific-sensor-array-output-collapses-20140122-318q4.html#ixzz2rEt8RR4x
LikeLike
robertscribbler
/ January 23, 2014We need more sensors not less. I sincerely hope we can get funding for new ones past Republicans in Congress who appear likely to fight the science every step of the way. Better yet, perhaps we could increase taxes on a few of those 85 individuals who together own half the wealth on the planet. Kick social responsibility up a notch or two?
LikeLike