
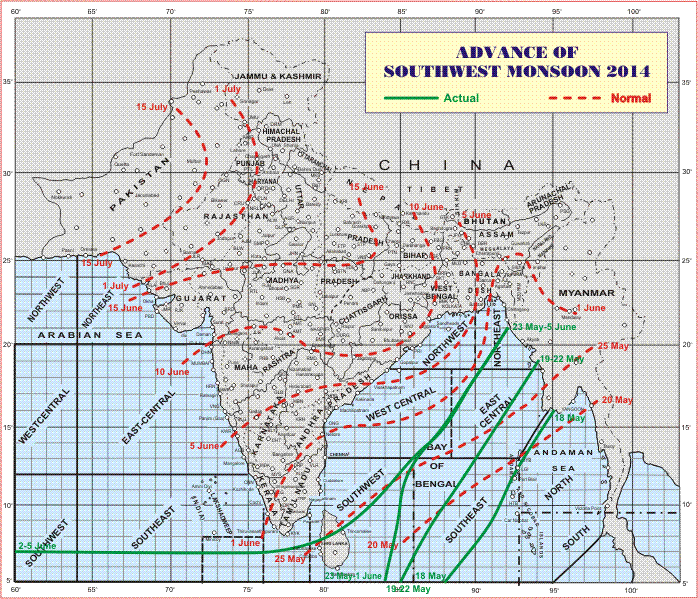
Current advance of the Indian Monsoon indicated by the green line vs typical historic advance indicated by the dashed red line. Image source: India Meteorological Department.
The Indian Monsoon arrived in Sri Lanka on June 2nd, 8 days late, with extreme force. Dumping excessive rainfall even for a typically powerful event, it forced 2,500 to flee and resulted in the loss of 22 souls. There it stalled, battening into a Bay of Bengal moisture flow that hasn’t budged since May 23rd.
* * * *
By today, June 5th, powerful storms should be dumping rain over a wide swath including the entire southern tip of India, almost all of the waters between Myanmar and the Tamil Nadu and Andhra Pradesh coasts, and over most of Bangladesh. But in the satellite shot only scattered storms are visible where powerful, wall-to-wall squalls should now cover an impressive swath.
By this time last year, more than a third of India was obscured by cloud. Today, the skies of this nation of 1.25 billion people are ominously clear. The steely-gray aerial tint of coal ash smog is the most impressive feature in an otherwise open expanse from the northwest deserts to the southeast coast. A massive zone showing only sparse hint or hope of rain.
Even Sri Lanka seems mostly cloud-free. The monsoon and, more importantly, the crop-essential rains it brings are walled out, pushed into the margins by El Nino and some of the hottest global temperatures on record.
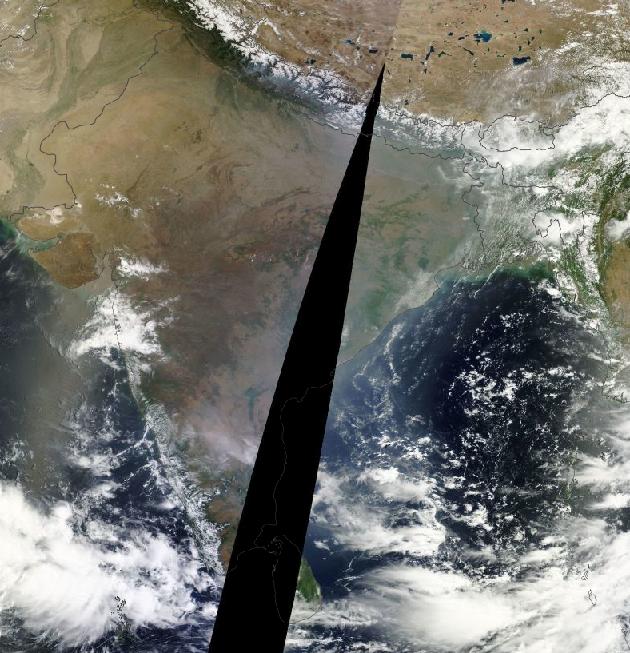
Blazingly clear skies laced with ominous coal ash over India during a time when monsoonal storms usually advance. Image source: LANCE-MODIS.
Forecasts indicate that some of the long-delayed rain could arrive to the coast by tomorrow through Sunday. Sparse comfort to sweltering interior sections that may not now see the cooling monsoon until after July 1st.
Unrelenting Heat Risks Late Switch to Violent Storms
In the north, the heat and drought just builds and builds. Jaipur recorded its highest temperature in 33 years on Thursday at a scorching 46.3 degrees Celsius (115.3 F). Meanwhile, New Delhi hit a new record high for the day of 45 C (113 F). Forecasts for New Delhi on Saturday and Sunday show the potential for even more extreme heat with temperatures projected to climb to 116 F. Over the coming ten days, the coolest is expected to be Friday of next week at 109 F.
The continued delay of monsoonal rain combines with record heat throughout northern and western sections of India to enhance risks of drought and loss to crops. Heatwave conditions have already reduced Lychee fruit crop yields by 40%. But an extended stalling of the monsoon and ongoing heat could result in increased damage.
Atmospheric thickening that comes with such extreme heat can also spur intense rain and hail events causing another kind of damage to crops. So a flash switch from heat to heavy storms like those seen earlier this week in Sri Lanka may not be so much of a boon as a terrible jolt to affected lands.
Moderate to Strong El Nino Ever More Likely
This year’s monsoonal delay and related extreme weather were likely amplified by a combination of record atmospheric heat due to human-caused greenhouse gas forcing and a growing and strengthening El Nino. In April, global atmospheric temperatures hit new record highs of +.91 C above 1880s values even as El Nino rapidly gained ground in the Pacific through May.
Multivariate ESNO Index values catapulted to +0.93 in May hitting the seventh highest values on record for the month and pushing the current El Nino into Moderate-Strong range for this time of year. During previous years, similar high values resulted in strong El Ninos on 3 of 5 occasions in the climate record. So historical indicators point toward a 60% chance of a strong event emerging by later this year.
From to NOAA’s El Nino Discussion Page:
The long anticipated breakthrough to El Niño conditions in 2014 is clearly under way, leading to the next question of how big it will get. Of the 10 nearest-ranked April-May values, five had clearly come up to this level over the previous three months. Among those five, four continued at El Niño levels through the rest of the year, while one (1993) dropped back to borderline neutral conditions by the end of the year. One (2002) ended up as a weak-to-moderate event, while the other three (1957, 1987, and 1997) are classified as strong El Niño events in the MEI sense. In other words, the simple-minded odds for El Niño remain at or above 80% through the remainder of 2014, and are consistent with previous discussions on this website. The odds for a strong El Niño are perhaps slightly higher than before, somewhere around 60%.
Meanwhile, the official NOAA forecast is more cautious, with model interpretations pointing to a higher likelihood for a moderate El Nino during 2014.
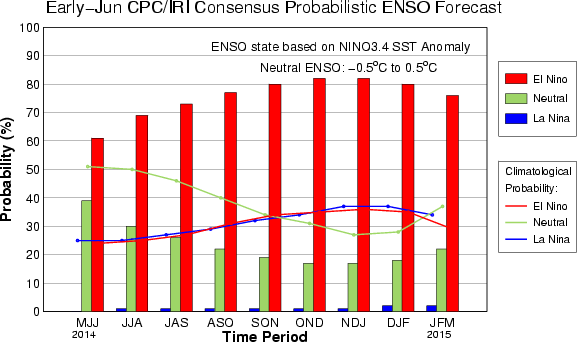
El Nino probability graph. Image source: CPC.
Overall, chances for evolution to full-blown El Nino rose significantly with today’s forecast now showing a 70% chance for El Nino development by this summer and nearly an 85% chance for El Nino development by Fall-Winter.
Regardless of El Nino strength, such an event is likely to have broad-ranging global impacts in the context of human-caused warming.
India’s Heightening El Nino + Climate Change Threat to Crops
For India, history shows numerous cases of severe monsoonal disruption during strong, moderate, and, recently, even weak El Nino events. In addition, record high atmospheric temperatures enhance extreme drought and flood potentials by amping up the hydrological cycle and thus increasing the rate of both evaporation and precipitation. Storms, where they do occur tend to be both tall and abnormally powerful under current human-warming related stresses even as droughts tend to develop with higher velocity and to persist for longer periods.
It is possible, due to both changes to the hydrological cycle and to atmospheric circulation, that the Indian monsoon has become even more sensitive to the El Nino pattern under current human-caused warming. This year’s monsoonal delay with El Nino just emerging shows an almost instant response to the forcing coming from increased temperatures in the Equatorial Pacific. As such, conditions of heightening threat for crop damage throughout a land where 1.25 billion people rely on the annual rains is a critical issue.
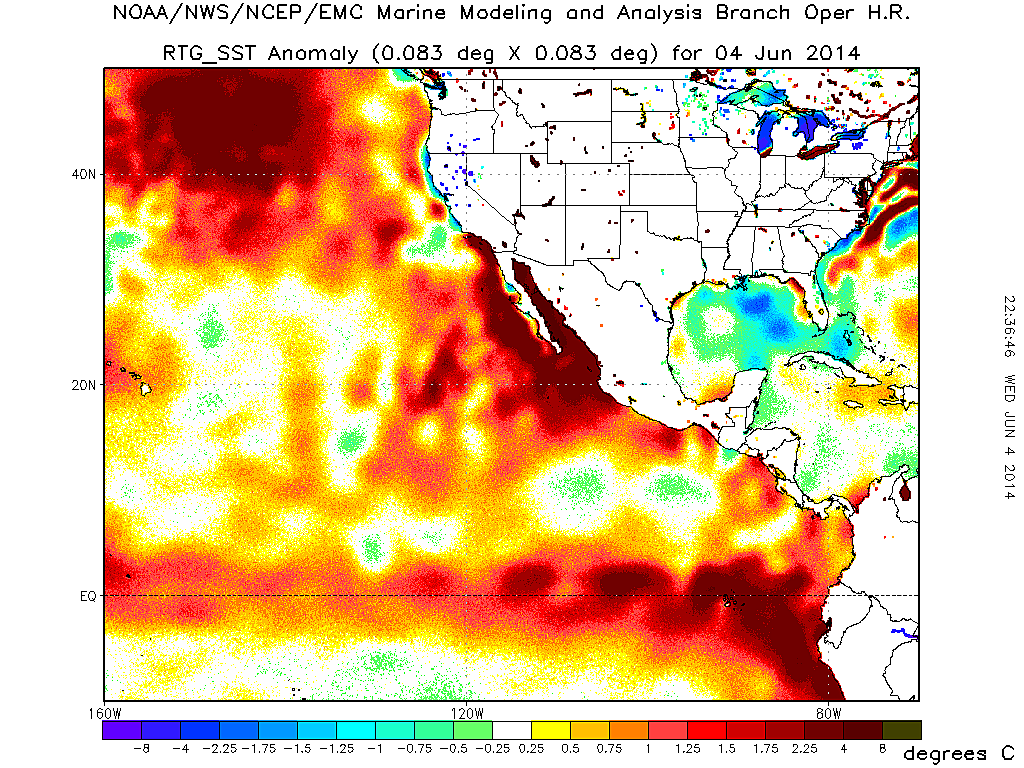
(Extraordinary sea surface temperature anomalies in the Northeast Pacific including numerous pools of +2.25 to +4 C or higher departures are indicative of both a strengthening El Nino pattern and a general warming of Ocean surface waters through human greenhouse gas heat forcing. Image source: NOAA Environmental Modeling.)
Overall, the forecast remains for continued monsoonal delay and disruption, continued heatwaves and a likelihood for extreme rainfall and storms in the regions where the monsoon finally arrives. With El Nino conditions in place over the Pacific now, with atmospheric temperatures rising into record range, and with an official El Nino status likely to be declared by summer, this forecast is lent yet more certainty and urgency.
Links:
India Meteorological Department
NOAA’s El Nino Discussion Page
North India Reels Under Heatwave
Monsoon Delayed Across India, Deadly Flooding in Sri Lanka
Weather Underground Ten Day Forecast for New Delhi
(Hat Tip to Timothy Chase)


Mark from New England
/ June 5, 2014Another great one Robert. Thanks for being our man on a mission and keeping us so well informed.
“Meanwhile, New Delhi hit a new record high for the day of 45 C (113 F). Forecasts for New Delhi on Saturday and Sunday show the potential for even more extreme heat with temperatures projected to climb to 116 F. Over the coming ten days, the coolest is expected to be Friday of next week at 109 F.”
Try as I can, I cannot imagine myself staying sane and healthy in such temperatures, and adding in the humidity it must be near the limits of human tolerance. And to consider that most of the urban poor there probably don’t have air conditioning, or even much in the way of fans, I’d imagine the mortality rate from this heat wave will be high. Hell on Earth.
LikeLike
robertscribbler
/ June 5, 2014Humidity is actually rather low at the moment. That’s the only saving grace for those without AC in that city.
LikeLike
robertscribbler
/ June 5, 201459 F in the Mackenzie Delta right now.
LikeLike
Mark from New England
/ June 5, 2014That was the temp. here in southern NH most of the day. Normal for a rainy day in early June here, not so normal there.
LikeLike
robertscribbler
/ June 5, 2014Lots of rather warm temps gathering in the far north just south of the ice and snow.
LikeLike
robertscribbler
/ June 6, 2014And it looks like we have warm water flowing from the Mackenzie river in decent volumes now. Sediment visible in the satellite.
LikeLike
Griffin
/ June 5, 2014In years past El Nino was in itself the significant ocean temperature event, and thus the great disruptive force to our atmosphere. These days it seems as though El Nino has become the equivalent of dropping napalm on a forest fire.
LikeLike
robertscribbler
/ June 5, 2014I think that’s an excellent analogy, Griff. There are so many global hot spots, El Niño serves as a kind of heating multiplier.
LikeLike
dtlange
/ June 5, 2014A typo? End of paragraph under the Lance Modis photo… after July 1rst. SB 1st?
Great post. Thanks for keeping us informed.
LikeLike
robertscribbler
/ June 6, 2014Got it DT. Thanks for the kind comment.
LikeLike
Griffin
/ June 6, 2014The waters of the northeast US have been warmer than average for quite some time. Even for a region dominated by the Gulf Stream, it’s SSTA’s have been significant. I have a very uneducated opinion that this is significant beyond the scant attention it has received in the media. Last summer the temp anomaly had a brief moment in the spotlight, but few could grasp the importance of the event. It didn’t take me long to be a little unnerved by the fact that I was not cold in the water. http://www.capecodonline.com/apps/pbcs.dll/article?AID=/20130718/news/307180318
LikeLike
robertscribbler
/ June 6, 2014As the Gulf Stream weakens, more hot water remains off the US east coast. It is forced back by higher volumes of cold, fresh water outflow to the north.
LikeLike
Griffin
/ June 6, 2014That makes perfect sense. And you just blew my mind.
LikeLike
Griffin
/ June 6, 2014So that explains why the anomaly does not go away. Indeed, “anomaly” has become an anachronism.
LikeLike
robertscribbler
/ June 6, 2014What’s your location and how long have you seen warmer ocean water?
LikeLike
dtlange
/ June 6, 2014Not to distract from today’s important post, but it is in the context of air pollution being the force behind climate change that I offer this linked video that I made and posted on DTLANGE2. It’s a short edit at 1 min 2 sec.
Many people don’t know what polluted air looks like up close. This video is a graphic display of traffic dust in a modern California city of Santa Barbara. No satellite images were needed. Just my photographer’s eye and sensibilities — plus some basic physics.
A carport overhang in the foreground, and a apartment building in the background, created a perfect magnifying aperture for the setting sun to illuminate a cloud of ambient traffic dust…
The vid begins with a couple of still photos then the live action video. That cloud that swirls left to right is a minor burst of breeze. This illustrates the dense amount of pollutants in the neighborhood. It is troublesome that so many people fail to notice what is really in the air — that civil government and its public safety element allows this. Local and state agencies were notified. But the condition stayed unabated. You can be sure the same denying, dereliction, and culpability taking place on this small regional level has much in common with the global dynamics of allowing climate change.
(Soon after this video was made I fled Santa Barbara, and am in Portland, OR — where air pollution is on the rise.)
Thanks, DT
LikeLike
Andy in Bangalore
/ June 6, 2014Additionally the pollution cloud coming off the east coast of the U.S. creates a magnifying glass effect, heating the surface waters and causing an area of extremely high ocean evaporation. one of the highest on the planet. The warm temps have caused the collapse of the shrimp fishery, likely associated with the collapse of puffin populations and lobster recruitment among others. (okay, lets just say we are witnessing the regional collapse of the ocean). The gulf stream heats in the summer in the region and then transports the heat into the Arctic, arriving about 4 months later.
LikeLike
robertscribbler
/ June 6, 2014Overall, observed weakening of the Gulf steam is in the range of 10-12 percent.
LikeLike
pintada
/ June 6, 2014And it is continuing at 2% per year. At that rate (and why would it not continue slowing given that the Arctic is melting) it will stop within my lifetime.
LikeLike
Griffin
/ June 6, 2014I live in Massachusetts and the warmer local waters really hit me last year. The water temp in Massachusetts Bay last year was simply unbelievable. To jump in and be warm was just as foreign an experience as I could imagine there. It was actually scary! I had always banked on those cold waters to shield us from the most violent of hurricanes, but actually feeling the unusual warmth left me feeling very vulnerable. The game had changed. I wish I had been paying attention to the actual temps longer but in anticipation of the coming El Nino I started watching SSTA’s on a global scale. The anomaly present of the northeast was so fixed, I wondered if it was an accurate reading. Your explanation, coupled with what I have read about the increase in temps in the Gulf of Maine, make the picture much clearer. Now I think back to fishing trips and comments made, “the water is just too warm this year” and know that we were just witnessing the opening acts of the show.
LikeLike
robertscribbler
/ June 6, 2014If you look at the temperature anomaly graphics on climate reanalyzer, you’ll see a large pool of cold water to your north and east. Some of this is due to a remnant of this winter’s dipole, some is due to north winds and melting ice outflow from Baffin Bay. The rest is due to cold, fresh water outflow from Greenland.
That pool of fresh water will grow over time, generating more intense impacts on North Atlantic Ocean circulation as it does. One effect, which you are seeing directly is the pushing of the warm Gulf current south. In the areas where the current backs up, you’ll see anomalous warmth.
The cold, fresh water outflows should remain to your north and east. So you should experience warming together with enhanced sea level rise.
LikeLike
Harry
/ June 6, 2014Robert, what do you think the the result of this reduction in the gulf current will mean for us over in the UK?
LikeLike
robertscribbler
/ June 6, 2014Storm track hits you hard during the winter. As Greenland melt increases, the oceanic temp differential makes this situation worse over a long period. Eventually, models show the potential for very strong northern hemisphere impacting storm originating in that Atlantic zone just south of Greenland.
LikeLike
Mark from New England
/ June 6, 2014I can vouch for Griffin’s observations of Cape Cod bay water temps. Though I must say the open ocean / Atlantic side of Cape Cod still felt damn cold to me last July! When the surfers can dispense with wet suits, everyone will believe in AGW 😉 I wonder how the seals will make out?
There was a good article in the recent Harper’s Magazine (or was it Mother Jones?) about how warm ocean waters in the Gulf of Maine are causing the primary prey of Puffins, the sand lance, to migrate northward, forcing the Puffins to prey on warmer water Butterfish too large for their fledglings to eat. This resulted in massive nest failure off the Maine coast the last few years. So Puffins may become extirpated in Maine. This reminds me of some of the stories Elizabeth Kolbert relates in her book “The Sixth Extinction”.
LikeLike
robertscribbler
/ June 6, 2014Excellent book. Sorry to hear about your potential local loss of puffins. Quite an interesting bird.
I’d think there are many stories like this all over the world. The Chesapeake Bay is full of expanding dead zones due to a combination of farm runoff and warming. Huge lists of invasive so as well.
LikeLike
Bernard
/ June 6, 2014Completely aside, but this might illustrate adaption and speciation. One group of Puffins decides to migrate northward and apart from relocation remains the same. A second group doesn’t relocate and shift to a different main diet. The first generation is unfit and gets reduced. The nests that do make it form the start of a lineage that physically adapts to its new diet.
LikeLike
Griffin
/ June 6, 2014I see what you mean. The cold fresh water has an effect like a landslide across a stream. Wow. As for the enhanced sea level rise I offer this video. Keep in mind that no one remembers the storm of 3/7/2013. It carries no great significance. But it’s surge was noted.
LikeLike
robertscribbler
/ June 6, 2014Related change in sea height is party due to local thermal expansion, partly due to alteration to ocean circulation.
That said, the US east coast should see an enhanced sea level rise on top of overall global sea level rise.
I take it this storm was a rather minor one?
LikeLike
Mark from New England
/ June 6, 2014Wow – that was impressive Griffin! I’ve been there – but never seen it like that! I wonder if anyone ran that in white water kayaks!
Some day Cape Cod will be spilt into 2 or 3 islands at the low points; and the Pamet River is one of those, as are the salt marshes in South Wellfleet.
LikeLike
robertscribbler
/ June 6, 2014How low lying is the cape? Is it like the barrier islands in the south?
LikeLike
robertscribbler
/ June 6, 201461 F at the Mackenzie Delta now. Similar temps at the mouth of the Lena on the Russian side.
LikeLike
robertscribbler
/ June 6, 2014South wind and 40-50 degree temps on the west coast of Greenland.
Trends pointing toward a rough summer.
LikeLike
Mark from New England
/ June 6, 2014Cape Cod is low lying, being a glacial terminal moraine, but it does have some hills that get 100 – 200+ feet above sea level in the middle / spine area (as well as some high bluffs overlooking the Atlantic), so it’s not quite as vulnerable to sea level rise as a barrier island. But many parts of it are quite low, and will likely get inundated in the future. The barrier beaches and islands around Chatham at the Cape’s “elbow” have been reconfigured many times since the infamous Blizzard of 78′.
LikeLike
Mark from New England
/ June 6, 2014Wikipedia of Cape Cod for the record:
http://en.wikipedia.org/wiki/Cape_Cod
LikeLike
robertscribbler
/ June 6, 2014Good stuff. I’ve been looking at satellite shots of the Cape to gain context for potential future news and research. Seems to be quite a bit of interest in this area. I’m curious to see how SLR impacts compare to rest of the US East Coast on a more granular scale.
LikeLike
Griffin
/ June 6, 2014Yes Robert, it was a very typical Nor’easter. Of course the storm surge coincided with a higher tide but it was notable that the storm was not a memorable one by any means. Yes Mark, thankfully wetsuits are still needed for the outer cape! The Sixth Extinction, sobering read. I swear if the Peeper Frogs ever go silent around here in the spring I will tip over. As for the Puffins, that was a heartbreaking story that you referenced Mark. Hopefully the seals can adapt better than the Puffin. Thank you both for the insight tonight.
LikeLike
robertscribbler
/ June 6, 2014Very non standard damage for a typical storm at high tide.
Pretty much any surfing location I go to on the east coast these days shows signs of encroachment and moderate to severe erosion. Virginia Beach is an exception due to constant sand pumping. But they spend millions per year for the project.
LikeLike
Robert A. Vella
/ June 6, 2014A weakened monsoonal season could be devastating for the Indian subcontinent. The cycle of life there is heavily dependent upon it. Another excellent post, Rob.
LikeLike
robertscribbler
/ June 6, 2014Thx, Bob!
A bit concerned for India. El Niño has meant rough times for them lately.
LikeLike
Vic
/ June 6, 2014From the Guardian…
” The last big El Niño in 1997/98 caused the worst coral bleaching in recorded history. In total, 16% of the world’s coral was lost and some countries like the Maldives lost up to 90% of their reef coverage.”
http://www.theguardian.com/environment/blog/2014/jun/05/el-nino-coral-reef-earth-amazons
LikeLike
todaysguestis
/ June 6, 2014Almost 21,500 people cannot return to their waterlogged homes after worst flooding in 45 years
http://siberiantimes.com/ecology/others/features/almost-21500-people-cannot-return-to-their-waterlogged-homes-after-worst-flooding-in-45-years/
LikeLike
climatehawk1
/ June 6, 2014Flooding in Turkey also: http://en.cihan.com.tr/news/Flash-floods-causes-disaster-in-Northern-Turkey_3028-CHMTQ1MzAyOC80
LikeLike
Colorado Bob
/ June 6, 2014Jakobshavn calves a(nother) big one
Greenland glacier guardian Espen Olsen informed us a couple of days ago on the Forum that Jakobshavn Isbræ – Greenland’s fastest glacier draining 6.5 % of the Greenland ice sheet – has had another big bite taken out of its southern branch recently. Espen made this animation to show the difference between May 7th and June 1st (red circle added by me):
http://neven1.typepad.com/blog/2014/06/jakobshavn-calves-another-big-one.html#comments
LikeLike
robertscribbler
/ June 6, 2014Damn.
LikeLike
Andy in Bangalore
/ June 6, 2014Wow, I spent summers in the 60s and mid-70s on the Cape at some cabins (Hunter’s Pine Acres) near Oyster Pond. We would either go to Hardings, Chatham or Nauset beach. . . and yeah, Nauset was cold! Fishing the rip tide off of Monomoy with my Dad and older brother are some of my best memories.
LikeLike
Kevin Jones
/ June 6, 2014Hey, Colorado Bob Speaking of the Other superb site, I just returned from the bridge of the USCGC Healy (at near speed-of-light and in my mind) . They’re just off the NW coast of Alaska and heading about 46 degrees. I always find their in situ Healy AloftConn gives a fascinating view.
LikeLike
Andy (in San Diego)
/ June 6, 2014Looking at climate reanalyzer this morning (Happy Friday).
Surface winds around Antarctica are getting tremendously convoluted, and speeds seems to be picking up.
4C heat anomaly coursing over the Antarctic peninsula and deep into the interior. Flipping between temp anomaly & surface wind you can see the driving force there. I’ve been watching this and it seems to have been growing over the past 2 weeks.
Water temp anomaly off the coast of Alaska / BC, that big blob is getting huge.
Water temp anomaly blob at Baja Peninsula is growing quite a lot.
Air temp anomaly over Labrador / Quebec is getting quite pronounced. Flipping over to surface wind it looks like wind in the straits is the only thing keeping that away from southern Greenland.
NSIDC down for maintainance for a few more hours <== sadness
LikeLike
robertscribbler
/ June 6, 2014The Beaufort High has shifted to the Laptev where we have extreme readings along with wildfires within 120 miles of sea ice today.
The North American dipole is breaking up with summer as the cool anomaly runs a ragged retreat northward.
The Caspian high is swinging northwestward toward Scandinavia.
And the Greenland high is digging its heels in today.
Crazy readings you mention down there in Antarctica. Polar amplification kicking in with the advance of Austral winter.
LikeLike
Kevin Jones
/ June 6, 2014Checking the New Delhi forecast from Weather Underground: But for two of the next ten days the daily mean (hi and lo avg.) is above 100 F. (99F and 98F are the others). Only precipitation chance is about 10% for the morning of 6/13. Horrid.
LikeLike
Kevin Jones
/ June 6, 2014Just refreshed my memory on wet-bulb temperature and human (and others’ ) health. Sustained +35C (95F) is fatal to humans, regardless of age/health. Let us hope the relative humidity stays below this threshold.
LikeLike
robertscribbler
/ June 6, 2014New Dehli is probably getting into the range of 30 C + wet bulb right now. Haven’t hit 35 C wet bulb in any record yet. But we’re getting closer, unfortunately.
LikeLike
ccgwebmaster
/ June 6, 2014If memory serves it’s really rather rare for anywhere on earth to exceed lethal wet bulb. The air becomes relatively less dense (and more buoyant) both with increasing temperature and with increasing humidity, tending to set up convection.
Of course, it will become increasingly frequent and widespread with some projections for a majority of the currently inhabited surface to cease to become inhabitable to humans later on – but – that’s quite a ways down the road (at least in terms of events, timescale may be somewhat open depending on how aggressive natural feedbacks become – but still not highly imminent).
LikeLike
robertscribbler
/ June 6, 2014It hasn’t happened yet. Looks like the threshold for such events is around 3 C warming from 1880s levels.
LikeLike
ccgwebmaster
/ June 6, 2014Though of course lethal wet bulb is 100% lethality even if you’re sweating profusely and lying down resting in a hurricane…
Heat stress kills people long before that point, especially if young or old, subject to physical exertion, dehydration, etc.
So for practical purposes, I wonder where the threshold really lies beyond which mass mortality would occur? (say the LD50 equivalent?)
LikeLike
robertscribbler
/ June 6, 2014A healthy, fed, properly hydrated and lightly to moderately clothed human being at rest in the shade is at risk of heat injury (20%) at wet bulb temperatures around 30 to 33 C. Change any of these factors and you increase the risk of heat injury.
For example, the same properly fed, hydrated and healthy human involved in constant heavy work is at risk of heat injury at wet bulb temperatures above 25.5 C.
A poorly fed, dehydrated or sick human loses ability to regulate heat and can quickly succumb to heat injury while at rest even at lower wet bulb temperatures 23-25 C or less in some cases.
Elderly dehydrate more rapidly and regulate heat less efficiently, lowering their wet bulb thresholds.
Any level of work at 26 C wet bulb or higher is miserable and likely to impare productivity.
A heatwave featuring wet bulb temperatures above 32 C would likely result in LD 50 mortality overt the course of a few days unless human beings were able to access cooling environments (AC, cold baths etc) and almost entirely refrain from outdoor work. Heatwaves in this range would inevitably result in some level of mortality even when ideal conditions for artificial cooling are widely available.
Power failures and loss of water during such events result in critical risk.
The European Heatwave, resulting in so much loss of life, for example, featured wet bulb temperatures in the range of 26 to, at most, 30 C. Heatwaves in southeast Asia tend to be more intense, but result in less widespread loss of life, possibly due to the fact that residents are more used to coping with high heat intensity events. Nonetheless, heat mortality still results.
LikeLike
ccgwebmaster
/ June 6, 2014If memory serves one feature of the european heat wave (2003) that exacerbated loss of life was housing stock not designed for such heat – being designed more typically for, well, rain. That’s not to say people in most consistently hotter places aren’t better adapted both in terms of dynamic physiology and genetic traits though.
It’s these constraints on infrastructure design that make climate change much worse than people might think – they build roads that don’t melt in Australia, but roads in the UK will melt at lower levels of heat as a different formulation is used. The UK environment wasn’t engineered to handle those temperatures, but rather to cope with frost and cold, and so damage is disproportionate even though people in the bigger sense have solved the problem at hand (though perhaps not both extremes simultaneously).
LikeLike
robertscribbler
/ June 6, 2014Huge hit to sunk capital. You’re talking about a total re-working of infrastructure, moving of cities, changing of the way things are engineered.
If we hit 10 C warming, we end up with that crazy wet bulb heat all over the world in addition to hydrogen sulfide gas coming out of the oceans eventually (300 years). Surviving that large-scale without a bunker civilization would probably prove impossible.
LikeLike
ccgwebmaster
/ June 6, 2014The unfeasibility of rebuilding literally the whole world simultaneously with dealing with resource depletion and population is pretty much why I think collapse is on the cards (that and the 19th century behaviour you refer to – technologically we have hydrogen bombs, but culturally we’re still the apes that throw rocks at each other).
I don’t see large scale survival as being likely, extrapolating from the near total failure to confront the matter to date. I’m beginning to question if many people will really make any organised efforts for even small scale civilisational survival? (where I’ve been pitching my efforts)
I tend to find serious denial around collapse to date, never mind even getting to the question of action. Still quite a few people in the hopium realms (where they assume upon fundamental changes in human behaviour… happening at unimaginable speed)
LikeLike
robertscribbler
/ June 6, 2014The progress of the mid 20th Century gives me some hope. But it appears to me that those lessons have been buried. Unless unearthed and expanded on, we probably have our goose cooked.
My opinion on resource depletion is mixed. I view fossil fuels as more albatross than aid.
As with anything else, I don’t like to see any situation as inevitable. At this point, I put collapse at 30% over the next 20 years (rising chance with each year of failure to take meaningful action). Small steps ongoing now are encouraging, though not enough to take us off the current path. Cultural and societal barriers are immense but not insurmountable.
NTHE pre 2030 at less than 1% now. Will await new variables if methane feedback increases or major destabilizing wars break out.
LikeLike
ccgwebmaster
/ June 6, 2014Fossil fuels – sure – but we also depend heavily on all sorts of other finite resources (or renewable ones being consumed at rates that make them finite). Sustainability simply hasn’t been a priority and we’re eroding the limits (of where it would be) aggressively (even as population is projected to still rise by several billions in coming decades, and we remain fixated on consumption based growth).
Personally I think it more likely than not that collapse will be well underway within 20 years (though not necessarily concluded, a long tail is likely, as any societies able to weather the initial shocks will be more likely by definition to continue to do so for at least a while).
NTHE I don’t take seriously at all. I wouldn’t even give it 0.01% by 2030? My view is that the NTHE crowd is filled with reasonably affluent westerners who really don’t appreciate how people mostly lived throughout human history (and in many cases still do live…).
Just because they can’t imagine the survival or themselves or their society is no reason to write off everyone else too…
LikeLike
robertscribbler
/ June 6, 2014Fossil fuels are the ones reaching more immediate limits. And, in my opinion — good riddance. Other materials resources are more easily mixed and matched. More easy to replace.
LikeLike
ccgwebmaster
/ June 6, 2014Also as a minor note, people talk about adaptation to climate change…
http://rspb.royalsocietypublishing.org/content/early/2010/07/29/rspb.2010.0923.full
Certainly, some degree of adaptation is likely possible, including to extreme heat. But this mode of rapid evolution essentially relies upon mass mortality to cull all the unsuited genetic stock (and still has a hard limit in the end).
It might not be quite what people mean when they talk about adaptation, but that’s the shape of our future, especially for those unable to relocate to the few remaining tolerable places.
LikeLike
robertscribbler
/ June 6, 2014We face severe challenges and risks for loss of life as time moves forward. If we are not compassionate and do not attempt to help others, the loss of life will be severely compounded with chances for societal collapse increasing (perceived and real cultural abandonment to suffering and death is a primary trigger for unrest, destabilization and violent resource re-allocation).
Adapting to 3-5 C warming is possible but difficult. We lose whole regions. Our world vastly shrinks. Beyond that, the challenges become overwhelming without massive unforeseen progress in human adaptability via behavior, cooperation, and technology advancement.
LikeLike
ccgwebmaster
/ June 6, 2014There are no signs that we are even seriously trying to adapt to +1C, unless drooling over Arctic resources and racing each other to buy up the worlds farmland count…
LikeLike
robertscribbler
/ June 6, 2014Yes. We’re back to life with a 19th Century mentality. Not very likely to help us survive in the 21st.
LikeLike
Kevin Jones
/ June 6, 2014Wet Bulb Globe Temperature ( WBGT) 100% relative humidity + 28C = WBGT 35C
30% relative humidity + 40C= WBGT 35C
This without effects of sunshine and light wind.
LikeLike
robertscribbler
/ June 6, 2014Atmospheric pressure is also a variable. New Delhi RH is at 5-15 percent during peak heating times. The atmosphere just usually doesn’t keep the moisture as temps go up. It gets baked out.
We haven’t had wet bulb readings at 35 C … Yet.
LikeLike
robertscribbler
/ June 6, 2014Just checked through my notes and the highest values we generally achieve on Earth during extreme events these days is the range of 30-31 C. Some instances have shown evidence of edging slightly higher to 32 or even 33 C.
Generally, it’s the heat of the tropical oceans that limits wet bulb peak temperatures as they tend to govern overall atmospheric heat, pressure and humidity. Warming the tropical oceans not only adds to overall atmospheric heat, it pumps more moisture into the atmosphere through ocean evaporation all while adding bulk to the atmosphere. This tips the scale on wet bulb readings as the atmosphere and ocean continues to warm.
A good article to read is here:
http://www.ccrc.unsw.edu.au/staff/profiles/sherwood/wetbulb.html
LikeLike
Apneaman
/ June 6, 2014Wet bulb temperatures. That’s another issue Guy McPherson has been talking about for a few years. I’m not a NTE 2030 advocate/predictor (just a huge die off), but most of the consequences Guy has been warning about are getting worse. Can tweaking the existing political system really solve anything?
LikeLike
robertscribbler
/ June 6, 2014Any action helps somewhat and large-scale action helps greatly. For example, our prospects look ever more grim with the end total amount of carbon we burn. If that number can be vastly cut, then the consequences we’ve locked in are far less dire.
NTE 2300 relies on a hyper-sensitive Earth System. And though sensitivity is likely higher than some have estimated, going off the charts may not be the best response to scientific reticence.
My opinion is that large-scale policy response can probably prevent a mini-runaway and limit long-term warming to around 3-5 C (1.5 to 2.5 C this century). Very, very bad, but not wretchedly horrible, and probably survivable.
LikeLike
Mark from New England
/ June 6, 2014My God, look at the map of wet bulb temperatures under 10C of warming. Gulp. Looks like much of the currently most densely populated areas of the world would exceed the 35C wet bulb limit of human tolerance for part of the year. Very scary. I’d like to see this map for 3C, 4C, 5C, etc. If it ever gets to 10C + I wonder if anyone would be around to write about it.
LikeLike
robertscribbler
/ June 6, 2014Yes. Everyone there lives indoors or not at all. Bunker life, basically.
LikeLike
Kevin Jones
/ June 6, 2014Thank you Robert. I’m always learning. Just came across your work on this back in August ’13. Plus this: http://www.ccrc.unsw.edu.au/staff/profiles/sherwood/wetbulb.html Thanks, yet again!
LikeLike
robertscribbler
/ June 6, 2014🙂
LikeLike
Kevin Jones
/ June 6, 2014Too funny. You beat me again!
LikeLike
Kevin Jones
/ June 6, 2014As the sign in my girlfriend’s kitchen reads: I’m so far behind I thought I was first!
LikeLike
robertscribbler
/ June 6, 2014Covered it quite a bit RE last year’s China heat wave. Some rather high apparent values then, but it’s tough to get exactly correlating temp and humidity readings.
Unrelated… It appears a rather strong storm is barreling in to the UK and France at the moment. Weather could get quite nasty.
LikeLike
Mark from New England
/ June 6, 2014Right after the D-day celebrations no less.
LikeLike
ccgwebmaster
/ June 7, 2014If there is to be any action, one needs the developed nations most responsible to be the ones taking the beating (ie including the UK)? It’s hard to see altruism coming to the fore – selfishness, though…
LikeLike
robertscribbler
/ June 7, 2014I find the notion that adopting renewables is some kind of punishment to be rather silly. That said, take a look at the impact of even the minor step taken this week. The US announces carbon restrictions and three days later China announces a carbon cap. If you get a growing number of nations taking responsibility, it has a progressive effect, it becomes easier from a policy standpoint for others to pitch in.
If everyone is just sitting around the table staring at each other and being unwilling to take the initiative, then things get overly adversarial and finger pointing ensues.
LikeLike
robertscribbler
/ June 6, 2014One thing to think about, Kevin. As the Indian monsoon advances, humidity levels go up. So you probably end up with rising wet bulb values just before the rains hit even though relative temperatures may fall a bit.
LikeLike
cowpoke
/ June 6, 2014A picture is worth a thousand words they say. I think purple means hot. From today and relevant to the wetbulb discussion.
Great blog BTW.
LikeLike
robertscribbler
/ June 6, 2014Thanks. Will keep doing my best.
It’s worth noting that the Monsoon slugged a bit forward today. Still very little rain for India. Looks like the lag is now at about 7 days at least.
LikeLike
Colorado Bob
/ June 6, 2014Floods displace over 100,000 in Sri Lanka
COLOMBO: Floods caused by days of torrential rain have displaced over 100,000 people in Sri Lanka, latest government data showed on Friday.
The Disaster Management Centre said that 26,688 families comprising 109,075 people have been affected by the rain, floods and landslides as of Friday afternoon, Xinhua reported.
http://timesofindia.indiatimes.com/world/south-asia/Floods-displace-over-100000-in-Sri-Lanka/articleshow/36143676.cms
LikeLike
robertscribbler
/ June 6, 2014God, this is terrible. From heatwave to extreme flood in a snap. I’m very concerned for southern India.
LikeLike
Mark from New England
/ June 6, 2014I hope Andy in Bangalore can keep us posted of events there.
LikeLike
Andy (in San Diego)
/ June 6, 2014Mark from New England,
Just voicing my agreement with you.
Andy in Bangalore, do keep us posted as to how things progress. It is very much appreciated!
LikeLike
Timothy Chase
/ June 7, 2014An El Niño is coming, but the strength will depend on the interaction between the atmosphere and ocean…. More from Trenberth, Halpert
LikeLike
robertscribbler
/ June 7, 2014I guess the MEI jump wasn’t enough, nor the trade wind weakening on the same day the article published, nor the low near Fiji, nor the consistent west winds over the Eastern Pacific, nor the stalling monsoon? One wonders if there’s something a bit more specific they’re looking for?
In other news, looks like sea ice area remains a hair above new record lows today.
LikeLike
Timothy Chase
/ June 7, 2014Robert, I have little more than intuition in this area, much less background than yourself. But I know that a great deal of heat was buried by the trade winds, that there is a very large reservoir of ocean heat, as suggested by Haiyan.
With so much potential energy, the sort of self-organization that would result in a strong El Nino could come very quickly. Perhaps much of the news you are seeing came after the interviews? Regardless, if something happens that will result in a strong El Nino I would expect it sooner rather than later. Within the week, perhaps?
LikeLike
robertscribbler
/ June 7, 2014There’s still a long time for this thing to run. We probably won’t see peak SST for 2-6 months yet. Don’t know if it will take a week to tease out a strong vs moderate signal.
LikeLike
Timothy Chase
/ June 7, 2014Ps By “something happening” I simply mean “something beginning to happen”. Responding by phone. A bit of a pain, really.
LikeLike
Timothy Chase
/ June 7, 2014You are probably right. Come to think of it, I seem to remember another article suggesting the same. It might have been going off Halpert. Still, it will be interesting to see what happens over the next couple weeks, to what extent things may or may not come into alignment. According to some experts, last month was when we should begin to see the shape of things. At this point, models seem to be indicating something moderate, historical analogs would seem to suggest something strong. Then of course there would seem to be the potential for something stronger than that. I haven’t written off a big one yet.
LikeLike
robertscribbler
/ June 7, 2014Not writing it off either. May was a very strong month.
But I think there will be conjecture until everything falls into place.
LikeLike
robertscribbler
/ June 7, 2014In any case, the trades still look rather weak and confused.
LikeLike
Mark from New England
/ June 7, 2014I tend to go with your opinion these days Robert!
LikeLike
Timothy Chase
/ June 8, 2014According to forecasters, subsurface ocean temperatures are dropping, which is the reason why they are currently forecasting a weaker El Niño:
LikeLike
robertscribbler
/ June 8, 2014Expected. Negative phase of this Kelvin wave is cooler upwelling. Heat is transferred to the surface and will be ongoing for a number of weeks to come.
Second hot, down welling wave required for strong event. There’s probably enough energy in this Kelvin wave alone for a weak to moderate event without strong feedback.
LikeLike
Andy in Bangalore
/ June 7, 2014Yes, I will be happy to keep commenting. We do leave for summer break (Southeast Alaska Bound!) in a week and will be back at the end of July.
I followed the wet bulb conversation with great interest. I’d only been familiar with the 35C wet bulb prior to. I recall reading somewhere years ago that soil life dies when soil temps reach 26 C. I have seen a recent study that finds that the world’s forest lose the ability to be a carbon sink at a 3C temperature rise. Michael Mann is predicting a 2 C rise by 2035 and the IEA predicts up to 3.5 C by 2035 if BAU continues. It seems to me that if BAU does not continue most forests will be cut down by the masses in order to not freeze to death and for cooking. In fact there have reports of that very thing happening in Greece. I don’t see that ending well.
As I’m sure all of you are aware the heating doesn’t stop at 3-5 degrees, nor does ocean stratification and acidification. Change in natural systems is not linear but rather occurs in step or phase changes or some manner of exponential change. The compression in time between chaotic events is a signal of a system nearing a flip into a different stable state that once achieved is near impossible to reverse back to the the prior state. I liken it to a severe heart attack presaged by years of small daily choices and larger but ignored health signals that lead to a “sudden no one could have predicted this” catastrophic event.
LikeLike
robertscribbler
/ June 7, 2014The potential Earth Systems sensitivity to human forcing is certainly a problem. It is, however, not one that is endlessly exponential. 3-5 C under current forcing includes likely long-term feed backs. According to paleoclimate we end up with about 1.9 C by end century at current forcing, 3.8 C long term after feed backs. Of course, that’s without a drop more carbon and assumes moderate-high range sensitivity. Less than 2.5 C this century and 5 C long term assumes a rather vigorous mitigation and medium-high ESS. Additional mitigation can be achieved and will probably be necessary through carbon capture practices.
LikeLike
rayduray
/ June 9, 2014Good news. Rains have come to Kerala:
http://in.reuters.com/article/2014/06/06/india-monsoon-kerala-idINKBN0EH0KT20140606
And this bit about El Nino caught my eye:
The formation of a possible El Nino weather phenomenon, which can cause drought in South Asia, is only expected to have an impact later in the four-month rainy season.
“We don’t foresee any El Nino impact in the first month of the monsoon season,” said B.P. Yadav, head of the National Weather Forecasting Centre at the India Meteorological Department in New Delhi.
LikeLike
Andy in Bangalore
/ June 10, 2014Personally I don’t trust that even government issued weather reports are not massaged to manage perceptions and world markets.
LikeLike
rayduray
/ June 12, 2014Andy,
Perhaps then you’ll enjoy this H.L. Mencken quote: A cynic is a man, who when smelling flowers, immediately looks around for the casket.”
Some of us here might fit this description. 🙂
If you think government meteorologists are not to be trusted, how about the kind who admit to prognosticating for profit? I would think they’d be even less reliably telling the honest truth, especially when they can lay off the odds and make some good clean dirty money on side bets on disinformation.
***
Some prognostication about El Nino and drought in Australia: http://tinyurl.com/nb5zwcd
LikeLike
Timothy Chase
/ June 12, 2014Then again, it is pretty clear the Indian government engaged in a bit of propaganda a while back, downplaying the possibility of a super El Nino while fanning the flames of nationalism in an effort to shore up support, although judging from this story at least some of the India media weren’t buying it:
[continued]
LikeLike
Timothy Chase
/ June 12, 2014[continued]
Not sure I can really blame the Indian government, though:
LikeLike
rayduray
/ June 11, 2014The Monsoon as of June 11:
http://classic.wunderground.com/blog/JeffMasters/comment.html?entrynum=2698
LikeLike