Perturbed Earth: Why is Heat-Trapping Methane on the Rise?

Globally, atmospheric methane levels have been on the rise over recent years. And though the rate of rise is not as dramatic as seen during the late 1980s (yet), the relative rise of atmospheric methane has caused concern among scientists.

Methane is a major heat trapping gas. And it is the #2 driver of human-forced global warming behind fossil fuel burning based CO2 according to NOAA’s Earth Systems Research Lab. It also has an out-sized potential to swing global heat trapping values higher due to the fact that a single molecule of methane can trap around 86 times more heat than a single molecule of CO2 over the same period of time.

ch4_trend_all_gl

(Global trends in methane show a concerning jump in atmospheric values since leveling off in the mid-2000s. A combination of earth environment feedbacks to warming and fossil fuel related extraction, burning and transport activity are primary suspects for this increase. Image source: NOAA ESRL.)

Methane is a much shorter lived gas (one molecule lasts 8 years in the atmosphere while a molecule of CO2 lasts 500 years), and atmospheric concentrations of methane are far, far lower than CO2 (measured in parts per billion, not parts per million), however. Which is one of the reasons why CO2 (primarily from fossil fuel based burning) is the gas in the driver’s seat of the majority of present warming.

Given this context, the new upward swing in methane is troubling for a number of reasons. Which begs the question — where is the excess methane coming from?

One primary suspect is that the Earth System, warmed by fossil fuel burning, is starting to produce its own feedback carbon emissions. The way this works is that warmer wetlands (a major source of methane) become more biologically active and, in turn, produce more methane. Heavier rains might provide more flooded regions in which microbes become productive. And thawing permafrost in the far north may be providing new wetland based methane sources. So the nascent methane emissions could be coming from such varied sources as tropical wetlands (as some experts point out), from thawing and expanding biologically active permafrost zones, from increasing wildfire activity, from increasing methane emissions due to drought, or any combination of the above.

Add in potentially very leaky and large-scale, fossil fuel infrastructure related to gas and legacy infrastructure related to coal and the list of suspects grows very long indeed. A hint at where the larger sources of methane show up, at least at present, is provided by the atmospheric observatories. In particular, I’m going to turn to the Copernicus Atmospheric Monitoring System (CAMS) for this part of today’s discussion:

Atmospheric Methane Hot spots

(Global atmospheric methane hot spots indicated by CAMS.)

What we find from looking at this map is that the highest concentrations of methane presently correspond with the densest collections of fossil fuel based industrial activity. This jibes with findings that 60 percent of the presently elevated atmospheric methane value is due to human activity — leaky gas infrastructure, leaky coal mines, and various human-based farming practices that produce methane (rice farming, cow belches etc). It also highlights the recently discovered fact that fossil fuel based leaks are 60 percent more extensive than previously indicated. Confusing this point is the recent Nature finding that though leaky gas and coal infrastructure were more leaky than expected, the large fossil fuel based infrastructure methane emission was not increasing over time.

So the visible, top-down readings in the CAMS monitor may mask a larger feedback delta, or change, in how the the Earth System itself is producing methane. In other words, the new bump in methane may be coming from a perturbed Earth.

As noted by NOAA research scientist Lori Bruhwiler in a recent Wired article:

“The most important science question we face now is the question of carbon-climate feedbacks. The question that’s really important is, what’s coming down the road?”

In other words, is the recent methane spike coming from changes to the Earth System driven by the longer term fossil fuel based warming? And if so, how much will it continue to feed back? How much more methane can we expect from tropical wetlands, fires, droughts and thawing permafrost? This is a big question with wide-ranging implications for our climate future.

(Want to help fight climate change by transitioning to a clean energy vehicle? Get 1,000 to 5,000 free supercharger miles at this link.)

Analysis of Present Surface Methane Hot Spots

A contextual analysis of present surface methane emission sources and rates of atmospheric accumulation.

New Report: ‘Blowtorch’-Like Ocean Warming Advances Killer Seas, Shifts El Nino, Heats Hydrates

Tampering can be dangerous. Nature can be vengeful. We should have a great deal of respect for the planet on which we live. — Carl-Gustaf Rossby

But as the [IUCN] study points out, 90% of the extra heat that our greenhouse gases trap is actually absorbed by the oceans. That means that the upper few meters of the sea have been steadily warming more than a tenth of a degree celsius per decade, a figure that’s accelerating. When you think of the volume of water that represents, and then try to imagine the energy necessary to raise its temperature, you get an idea of the blowtorch that our civilization has become. — Bill McKibben

The scale of ocean warming is truly staggering with the numbers so large that it is difficult for most people to comprehend. — from the IUCN report Explaining Ocean Warming: Causes, scale, effects and consequences

*****

If there’s one simple fact about past Earth climates that should keep you awake at night, it’s this — warming the world ocean eventually produces a killing mechanism that is unrivaled by any other in Earth’s deep past. Great asteroids, gamma-ray bursters, earthquakes, tsunamis and volcanism — none of these can rival the vast damage to life on planet Earth that is resulting from ocean warming.

As a study of the sciences, this assertion would be merely an academic one if the human race weren’t now involved in a great injection of an unprecedented volume of greenhouse gasses into the Earth’s airs. As a critical new ocean report from the International Union for Conservation of Nature (IUCN) points out, these gasses are trapping an extraordinary amount of heat at the top of the world’s atmosphere. In turn, the atmosphere is transferring the lion’s share of this heat — more than 90 percent — into the waters of our world.

The Extreme Amount of Heat Energy Piling up in Our Warming Ocean

As a result, the surface of the world ocean is warming by 0.1 degree Celsius per decade. That may not sound like much, but it takes about four times the amount of energy to warm one gram of water by 0.1 C as it does one gram of air. This property, called specific heat, is a defining aspect of water. Water has the highest specific heat of any common substance.

heat-accumulation-human-forced-zillions-of-joules

(Since the 1970s, about 300 zettajoules’ (ZJ) worth of heat energy has accumulated in the Earth System due to fossil-fuel burning and related greenhouse gas emissions. That’s about 5 Hiroshima bombs worth of heat accumulating every second. Most of that energy has gone into the world’s oceans. So much heat is bound to have consequences, and these impacts are starting to show up in the form of declining ocean health, melting sea ice and glaciers, shifting climate zones and weather patterns, worsening droughts and storms, and threats of Earth System carbon feedbacks. Image source: Explaining Ocean Warming.)

Liquid water is also far denser than air. And this density generates an even higher impact heat energy transfer multiplier. So not only does it take four times more energy to warm a similar weight of water vs air, once warmed, that water contains that higher level of specific heat energy in a much more tightly concentrated package. And when that high heat concentration liquid water comes into contact with other substances — like ice in the form of ocean contact, or air in the form of evaporation, or frozen hydrates on the sea bed — it can pack a serious heat punch.

The vast volume of water in our oceans, therefore, serves as a kind of heat and energy regulator. It takes a lot of energy to warm it up, but once it does, serious environmental changes start to happen as a result. In other words, the temperature of the global ocean could be viewed as the point on which the whole of the Earth climate system pivots. Once the oceans are set in thermal motion, serious changes to the rest of the world are going to take place. To get an idea how much energy the oceans now contain, of how much potential they now have to dramatically alter our world, consider that if these vast waters were not present, the atmosphere now would have already warmed by 36 degrees C due to the heat-trapping effect of greenhouse gasses already in our atmosphere.

Fossil-fuel blowtorch indeed.

Heating Seas Ultimately Become Killer Seas

There’s a starker message to convey here, one that focuses on this simple yet dire question — how do warming oceans kill? In basic terms, they become toxic and anoxic. Warming oceans melt ocean-contacting glaciers. The glacial melt forces seas to rise and forms a freshwater lid on the global ocean, breaking down ocean conveyor belts and preventing mixing. This freshwater lid also deflects heat toward the ocean bottom. This process in turn helps to thaw methane hydrates. Warm waters that don’t mix and that are filled with bubbling hydrates become very oxygen-poor.

barents-algae-bloom

(Massive algae bloom covers tens of thousands of square miles of open water in the Barents Sea during August of 2016. As glaciers melt, oceans stratify and warm; as water oxygen levels drop, and as hydrates vent due to warming, such blooms result in significant reductions to ocean health and a related global mass-extinction threat. Image source: LANCE MODIS.)

As the land glaciers bleed out into the oceans, the stratified, oxygen-deprived waters become less and less able to support advanced life. The kinds of life warm, oxygen-deprived waters do support are poison-producing microbes. These microbes thrive in the warm, oxygen-poor waters. If ocean heating continues to progress, the warming seas will eventually fill up with their deadly byproducts. Among the most nasty of these is hydrogen sulfide. If enough of it is produced, it will spill out from the ocean into the nearby air, resulting in land animal mortality as well.

In microcosm, we saw a mild taste of some of these effects this past year in Florida as toxic algae blooms filled the warming state’s waterways and coastlines, even forcing some riverside marinas to close due to toxic gasses wafting up from the purple-green, oxygen-starved waters. These effects are a snapshot of a possible future for Earth’s oceans if we don’t get our act together yesterday.

El Niño Shifted, Ocean Hydrates Threatened

As alluded to earlier in this post, a new report, Explaining Ocean Warming, provides some pretty hard evidence that the oceans are on the move toward a much more harmful global climate state. The study, which has rightly received a great deal of media attention, issues a ‘shot across the bow’ warning to pretty much everyone living today. And it finds serious impacts to the ocean and linked climate systems due to a very rapid human-forced global warming.

These hard findings are worth reading directly:

  1. Sea-surface temperature, ocean heat content, sea-level rise, melting of glaciers and ice sheets, CO2 emissions and atmospheric concentrations are increasing at an accelerating rate with significant consequences for humanity and the marine species and ecosystems of the ocean.
  2. There is likely to be an increase in mean global ocean temperature of 1-4 degrees C by 2100. The greatest ocean warming overall is occurring in the Southern Hemisphere and is contributing to the subsurface melting of Antarctic ice shelves. Since the 1990s the atmosphere in the polar regions has been warming at about twice the average rate of global warming.
  3. There is likely to be Arctic warming and ice loss, and possibly the essential removal, in some years, of the summer Arctic sea ice within the next few decades.
  4. Over the last 20 years there has been an intensification and distinct change in the El Niño events, with a shift of the mean location of sea-surface temperature anomalies towards the central Pacific.
  5. Currently 2.5 Gt of frozen methane hydrate are stored in the sea floor at water depths of 200 to 2000 m. Increasing water temperature could release this source of carbon into the ocean and ultimately into the atmosphere.

These are all Earth-shattering scientific statements. For those who frequent this blog, points 1 through 3 are probably pretty familiar. The last two, however, require more in-depth explanation.

global-warming-el-nino

(Some scientific studies have pointed out that warming the world ocean will result in a shift of El Niño toward the central Pacific. A new ocean report finds that it’s already happening. Image source: Global Warming May Dent El Niño’s Protective Hurricane Shield, Increase Droughts.)

For a long time now, scientists have believed that El Niño wouldn’t be affected by climate change until the end of this century. But as with sea ice, it appears that such impacts may well be advancing faster than expected. As we’ve alluded to here, there’s been an apparent shift in El Niño toward the central Pacific over recent decades. This may well be a climate change-related shift. The fact that the IUCN report highlights this change is a sign that the broader sciences are starting to tackle the notion of early alterations to El Niño due to climate change as well.

However, the most ominous language here centers around methane hydrate. For years, there’s been adamant push-back against potential risks to hydrates coming from well-respected sections of the climate sciences. Nonetheless, those downplaying the threat of warming to hydrates have yet to produce any conclusive proof as to why warming the ocean bottom and applying heat to hydrates won’t result in at least some feedback from these carbon stores (especially under the higher-range warming scenarios). The IUCN report reiterates this risk by identifying 2.5 billion tons of frozen seabed methane at shallow and mid-ocean depths that will ultimately be exposed to warming — risking both an ocean and an atmospheric release.

These last points serve to underline some pretty basic facts, the chief of which is that pushing Nature, and heating up her life-blood world ocean waters, is a very, very dangerous game. And if this poignant new report sends any message at all it could simply boil down to this — turn back before it’s too late.

Links:

IUCN Report: Explaining Ocean Warming

Specific Heat

Ocean Warming

Awakening the Horrors of the Ancient Hothouse

LANCE MODIS

Slimy Green Algae Invades Florida

The oceans are heating up. That’s a big problem on a blue planet.

Global Warming May Dent El Niño’s Protective Hurricane Shield, Increase Droughts

Hat tip to Cate

Hat tip to George Hayduke

Possible Record Methane Spike at Barrow, Alaska — What Does it Mean?

There’s no avoiding it — climate change is a controversial subject; a threat that should unify us all that, due to reticence, denial, fear, and a basic lack of understanding, is instead often quite divisive. But among the subjects that stand out as real fodder for acidic controversy, the issue of methane feedbacks from the global climate system — the oceans, thawing permafrost, and especially the Arctic — is one of the worst. There’s a noted tendency to either downplay or overplay risks. Though this polarization is likely fed by the general mysteriousness and complexity of the subject, its potential existential nature also feeds into the heat that methane feedback-related discussions tend to draw.

It all makes one hope for improved discussion on the subject. Given the fact that catastrophic methane feedback appears unlikely (but would have a high overall impact if it did emerge), it’s probable that the subject will continue to generate a difficult conversation for as long as human-forced warming is an issue, and so long as the science continues to remain uncertain.

copernicus-observatory

(The Copernicus Observatory shows surface methane hot spots in China, Africa, South America, the U.S., Canada, Europe, Russia and the Arctic. Note that generally high concentrations still tend to center over the Arctic. Meanwhile, the various hot spots seem to indicate major sources like fossil-fuel industry wildfires, wetlands, droughts, the Arctic Ocean and glacial and permafrost thaw. Also note that current readings indicate a serious rise in global methane concentrations, but not a spike that significantly exceeds peak 20th-century additions. It’s worth considering that, during recent years, expanded natural gas exploration and extraction through fracking has likely contributed a substantial new human methane source addition to the global atmosphere. Meanwhile, there is some concern that the Earth System may be starting to mildly feed back by bleeding additional carbon from warming lands, forests, oceans and permafrost.)

It’s not really a question of whether or not some scientists are concerned or if there is a risk, however ill-defined. Dr. James Hansen has often indicated that a strong methane feedback from the Arctic or world ocean system would be a climate nightmare that could well eliminate the time window to respond to prevent catastrophic warming. Methane and other carbon feedbacks are prime suspects for past hothouse event triggers — potentially playing a role in setting off events like the Permian-Triassic Extinction and/or greatly contributing to the loss of ocean health that was a key feature of these extinction events. Neil deGrasse Tyson alluded to this risk in his 2014 rerendering of the science series Cosmos.

Polar researchers, including those at the National Snow and Ice Data Center (NSIDC), often point to varying risks and potentials for methane feedback from numerous sources such as permafrost thaw. Others fear releases coming from seabed stores — claims that often meet stiff resistance from more established areas of the science. But given how close we are to locking in 2-degree-Celsius or greater amounts of warming this century, it doesn’t take a lot of carbon feedback, methane or otherwise, from the Earth System to generate a problem. Even a moderate feedback would cut the time necessary for carbon emissions draw-downs. It is for this reason that monitoring of the methane, and overall carbon feedback, situation is a necessary part of developing a comprehensive climate change situational awareness (which I have worked hard to develop here at this blog). Which is why, today, we are going to talk a little bit about a big methane spike appearing in the hourly readings near Barrow, Alaska.

Apparent Record Methane Spike in the Hourly Readings at Barrow

Yesterday, climatologist Brian Brettschneider, whose Twitter feed provides a good stream of informed climate change-related updates, posted a truncated version of this NOAA ESRL graph:

hourly-methane-spike

The graph tracks hourly methane readings at the data collection location for Barrow, Alaska. As shown, the recent (and unconfirmed) data set shows what appears to be a record methane spike for that location. Also note that big spikes appear in the hourly data at certain points many times since 2000, as is typical during this time of year. Most notably, a similar very large spike occurred in 2004, one that the recent 2016 spike just edges out.

Looking at the graph, there’s a lot that it doesn’t tell us. Firstly, what is the source of this methane spike? If the spike was an outlier with no periodicity it might indicate the potential for some kind of anomaly or human source. However, since seasonal spikes seem to show up in this graph, this hints that the current spike is environmental. In addition, since Alaska as a whole and Barrow in particular both recently experienced some of their warmest weather on record, there’s some reason to suspect that this added heat played a part in the 2016 spike. And, 2004 also saw a period of then-record warmth during summer in Alaska. So Alaska warming is in line as a suspect cause for the 2016 methane spike.

As anomalous spikes go, this one is pretty big — it apparently set a new hourly record methane reading around 2370 parts per billion for the recording station. But since this Barrow spike isn’t visibly part of some big regional methane plume and since the global monitors aren’t recording a big methane jump as well, we can be pretty certain that this particular spike, if confirmed, is a local and probable short-term issue, and not a sudden, huge methane release issue of global importance. However, it does represent another point in a context that seems to include some big local methane sources popping up in the Arctic environment and possibly indicating a larger, if comparatively moderate, regional feedback taking place in response to the warming and thawing ongoing there. (No consensus scientific study has yet fully confirmed such a preliminary observation, which is a threat analysis-based potential identification on my part.)

So, overall, something to add to the big pot of bubbling concerns — but nothing to light your hair on fire over yet.

Conditions in Context

During the 20th century, large-scale industrialization linked to fossil-fuel burning and extraction helped to drive rapid rates of atmospheric methane increase. These rates peaked during the late 1980s and early 1990s when global policy measures helped curtail methane leakage from fossil fuel infrastructure. According to NOAA, annual rates of global atmospheric methane increase peaked in 1991 at a 14.32 ppb yearly jump.

ch4-trend

(Global methane is again hitting a rapid rate of rise. Though the Earth System appears to be providing some ominous rumblings that feedbacks may be on the way, the present spike is likely primarily due to increased fossil-fuel extraction activity, particularly due to fracking. Image source: NOAA.)

Such curtailments helped to produce a mid-1990s to mid-2000s plateau in the rate of atmospheric methane accumulation. Now, with the advent of fracking and with global warming appearing to generate a number of possible new methane sources (or amplify traditional sources) from the Earth System, rates of annual methane increase are again on the rise. In 2014 and 2015, annual increases hit 12.53 ppb (the third highest annual rate of increase in the NOAA record) and 10.07 ppb respectively (tenth highest). Preliminary reports show that 2016 appears to be on track to hit near 10 ppb worth of atmospheric increase.

As a result, it appears that fracking, primarily, and warming-related feedback (possibly secondarily) are contributing to annual rates of atmospheric methane increase that are comparable to peak periods of increase during the late 1980s and early 1990s. However, these rates of increase, though significantly adding a heat forcing that about equals one quarter to one third of the annual CO2 addition, show no current indication of a catastrophic rate of methane increase that would point toward the major environmental releases some have feared. As such, the greatest part of our ability to currently prevent further rising rates of atmospheric methane comes in the form of rapidly reducing all fossil fuel use and particularly to contain and reduce coal mining and oil and natural gas fracking. And if we do that, there will be less heat stress on the environmental methane stores and less overall long-term pressure for the kinds of feedbacks some of us have come to fear.

Links:

NOAA ESRL

All About Frozen Ground

The Arctic Turns Ugly

Hydrate Catastrophe Unlikely

The Copernicus Observatory

Brian Brettschneider

Toward Improved Discussions: Methane

An Update on Fracking Emissions

Cosmos

Hat tip to Griffin

2 C Coming On Faster Than We Feared — Atmospheric Methane Spikes to Record 3096 Parts Per Billion

It’s essential that policymakers begin to seriously consider the possibility of a substantial permafrost carbon feedback to global warming. If they don’t, I suspect that down the road we’ll all be looking at the 2°C threshold in our rear-view mirror.Robert Max Holmes

****

Unraveling the global warming puzzle is simple at its face, complex when you pierce the surface.

We know that burning fossil fuels, that the activity of mining coal, fracking for gas, and drilling for oil all result in dangerous greenhouse gas emissions. We know that the vast majority of these warming gasses are coming from fossil fuel based sources. We know that, now, the burning and mining and fracking and drilling have pushed atmospheric CO2 above 405 parts per million and the global concentration of all CO2 equivalent gasses to an amazing 485 parts per million CO2e (levels not seen in at least 15 million years). And we know that the heat re-radiated by these gasses has warmed the world by about 1 C above 1880s levels — forcing weather patterns to change, seas to rise, ocean health to decline, and setting off a wave of die offs in the animal world while increasing the near-term risk of hunger, spreading tropical disease, and mass displacement in the human world.

Radiative Forcing

(Heat added to the Earth’s atmosphere by fossil fuel emitted gasses like CO2 and Methane are measured in watts per meter squared. A yardstick known as radiative forcing [RF]. In the above graph by IPCC, we can see the estimated levels of radiative forcing from each greenhouse gas and total net human heat forcing upon the Earth atmosphere as of 2011. It’s a measure that may also need to start adding in the RF of feedback greenhouse gasses as the 21st Century progresses. Image source: RealClimate.)

We know many of the names of these other gasses — methane, nitrous oxide, and chlorofluorocarbon. And some of the others — like sulfur hexaflouride — many of us haven’t yet heard of. But the big name, the primary warming agent, is carbon dioxide — responsible on its own for the majority of the overall heat forcing currently. A gas so important to long term warming that NASA has called it ‘the thermostat that controls Earth’s temperature.’

All this is pretty simple and straightforward. But it’s when we start looking at what are called amplifying feedbacks — the Earth System Sensitivity responses to human forced warming — that things really start to get dicey. And wrapped up in the Earth System Sensitivity equation is methane — a greenhouse gas with the ability to strongly influence global temperatures over rather short time-frames.

Methane Spikes to Over 3,000 parts per Billion

On February 20th, for about 12 hours, the NOAA METOP measure recorded a major atmospheric methane spike in the range of 3,096 parts per billion at 20,000 feet in altitude. This was the first time that any measure had recorded such a high methane spike and the first time any measure had exceeded the 3,000 parts per billion threshold. For context, just two years ago, a methane spike in the range of 2,660 parts per billion would have been significant. Now, we’re getting peak readings that are more than 400 parts per billion higher than that previous maximum threshold.

Metop methane

(METOP showed a record 3,096 parts per billion atmospheric methane spike on February 20 of 2016. Thus far, this was the largest such spike ever recorded in the NOAA measure. One that far exceeded a global atmospheric average of around 1830 parts per billion. Image source: NOAA/METOP.)

It’s a pretty ominous signal — especially when you consider the fact that global atmospheric methane averages are in the range of 1830 parts per billion. The recent major spike was about 1170 parts per billion higher. In other words — a pretty extraordinary excession. It’s evidence that the methane sources of the world are growing more vigorous in their output. And when you consider the fact that methane — on a molecule-by-molecule comparison to CO2 — traps about 80 times more heat over the decadal timescale, large additions of methane on top of an already dangerous CO2 forcing is certainly cause for some concern. An issue that may further speed the already rapid pace of human-forced warming such that we become at risk of hitting the 1.5 C and 2 C thresholds sooner than expected. Outcomes we should urgently be working to avoid — by cutting the human-based emission as rapidly as possible at this time.

The Usual Suspects — Fossil Fuel Based Activity

Perhaps still more concerning is the fact that we really don’t know exactly where this significant methane spike is coming from.

We do, however, have a long list of usual suspects. The first, of course, would be from any number of very large and dangerous fossil fuel emission sources. China, with its massive methane belching coal mines, gas infrastructure, and dirty coal burning facilities would be a prime suspect. Mongolia, where equally sprawling coal and gas facilities operate is another likely hot spot. Russia — with its vast and leaky oil and gas fields. The Middle East — which is choked with fossil fuel infrastructure. Europe — where many of Russia’s pipelines terminate and where many nations burn a high-methane brown coal. And the United States — where the geologically destructive practice of fracking has now also recently and greatly increased methane emissions.

Unusual Suspects — Permafrost and Clathrate Warmed by Fossil Fuel Emissions

Looking at the very low resolution METOP graphic above, we find a number of methane hot spots around the globe. And many of these hot spots do coincide with our usual suspects list. But others are well outside the range we would typically expect. Far up in the north. Over the tundra and the Arctic Ocean where few major fossil fuel burning or extraction facilities now exist. There, somewhat ironically, great piles of permafrost spreading over millions of square miles and sometimes mounding up as thick as two miles are thawing due a greenhouse gas heat forcing from fossil fuel burning often happening hundreds or thousands of miles away. This thawing permafrost is filled with organic material. And when freed of its icy prison it is exposed to the world’s elements and microbes. These forces then go to work turning the organic carbon in that permafrost into carbon dioxide and methane.

This is rather bad news. In total, more than 1,300 billion tons of carbon are locked away in the permafrost soils. And carbon emissions from permafrost make an already bad heat forcing coming from fossil fuel burning even worse.

Barrow methane

(Atmospheric methane levels as recorded by various reporting stations and global monitors have been rising more rapidly during recent years. In the Arctic, atmospheric readings have tended to remain above the global average — an indication that local emissions are generating an overburden for the region. Image source: NOAA ESRL.)

But if all the human emissions and potential permafrost emissions weren’t bad enough, we have one more major carbon source in the Arctic to consider — methane hydrate. A controversial potential methane release source to be certain. But a very large one that we would be remiss to ignore. Due to the fact that the Arctic has remained very cold overall for the past 3 million years of long ice ages and brief interglacials, this massive store of carbon has been given the opportunity to build up within the relatively shallow and now swiftly warming Arctic Ocean waters and even beneath large sections of now-thawing permafrost. Much of this carbon is in the form of the frozen ice-methane called hydrate. And as the Arctic Ocean warms and sea ice recedes to expose blue ocean to the heating of the sun’s rays for the first time in hundreds of thousands of years, there is concern among some scientists that a not insignificant amount of that submerged frozen methane will release, pass the ocean-atmosphere or thawing permafrost boundary, and add more heat forcing to the world’s atmosphere. The shallow sea of the East Siberian Arctic Shelf has been identified by some to contain as much as 500 billion tons of carbon in the form of frozen methane. And a fossil fueled heating of the Earth may be just now risking amplifying feedback level releases from this large clathrate store along with a number of other very large stores scattered all across the Arctic Ocean basin and on throughout the global ocean system.

A Clearer Picture? Or One Far More Complex?

So who among all the various suspects — usual and unusual — may be responsible for the record methane spike now showing up in the METOP measure?

Before we attempt to answer this question, let’s pull in another methane graphic — this one from the Copernicus Observatory:

Global Surface Methane Readings Copernicus

(The February 25 Copenicus methane graphic tracking surface methane readings gives a higher resolution indication of surface methane readings than the NOAA METOP measure. This second measure provides some confirmation of an Arctic methane overburden even as spike sources from human emissions become more readily apparent. Omnious spikes also apparently come from wildfires in the tropics and from regions in the Arctic near Yamal, Russia, Northern Scandinavia, the Barents and Kara seas. Image source: The Copernicus Observatory.)

Here we can see the range of surface methane readings according to Copernicus. A higher resolution image that may provide us with a better idea of the point-source location for daily global methane spikes. Here we see that the major methane sources are predominantly China, Russia, the Middle East, Europe, the United States, India, Indonesia, Fires in Africa and the Amazon, and, finally, the Arctic.

Though the Copernicus measure doesn’t show the same level of Arctic overburden as what has tended to show up in the METOP measure, it’s a confirmation that something in the near Arctic environment is generating local spikes in above 1940 parts per billion for large regions of this sensitive zone.

The Copernicus measure, as noted above, also shows that the human spikes are quite intense, remaining the dominant source of methane emissions globally despite a continued disturbing overburden in the Arctic. Spikes in Africa, the Amazon, and Indonesia also indicate that declining rain forests and related fires in these tropical zones are also probably providing an amplifying feedback to the overall human emission.

Given this month’s spikes and the overall disposition of surface methane readings around the globe, it does appear that the large human base methane emission is being enhanced by feedbacks from local emissions from carbon stores both in the tropics and in the Arctic. This enhancement signal, though somewhat smaller than the fossil fuel related signal in some measures, is concerning and hints that Robert Max Holmes’ warning at the top may be all-too-relevant. For Earth System feedbacks to massive and irresponsible fossil fuel emissions appear to already be starting to complicate our picture of a warming Earth.

Links:

CO2: The Thermostat That Controls Earth’s Temperature

Ominous Arctic Methane Spike Continues

Huge Methane Spike Coming from US Fracking

Methane Release From Frozen Permafrost Could Trigger Dangerous Global Warming

Concern over Catastrophic Methane Release

A4R Global Methane Tracking

The Copernicus Observatory

NOAA ESRL

RealClimate

NOAA/METOP

Hat Tip to Griffin

Siberian Permafrost Methane Shows Growing Eruption: Number of Global Warming-Induced Craters Now Estimated at 20-30

Siberian Crater Locations

(Siberian methane crater locations. In total, 7 methane blow holes with features similar to the Yamal Crater have now been discovered. Unofficial reports from observers on the ground have local scientists placing the likely count now at between 20-30 original craters with many more secondary craters. Image source: The Daily Mail.)

*   *   *   *   *

The ground smoked for hours. Then, with a great flash and an enormous boom, the land exploded. When the smoke cleared, all that was left was a great, black hole. Ejected earth lay scattered around it — sheer sides plunging into the permafrost like some gigantic, gaping gun barrel.

This was the scene last summer in Yamal, Siberia — a region of extreme northern Russia.

Mysterious Holes Emitting Methane Gas

Speculation about the cause of this mysterious hole became rampant. It looked like a sink hole, except for the ejected material surrounding it. Some said it was a pingo. But pingos weren’t known to form due to explosions.

Teams of scientists rapidly descended upon the hole. And there they found high readings of methane at the hole’s base — in the range of 10% concentration, which is a very explosive level for the gas. At the base of the hole they also found evidence of hydrate. A form of frozen water-methane that is quite unstable unless kept under high pressure and low temperature.

The initial conclusion of the Russian scientists was that relic hydrate sealed beneath the previously flooded Siberian permafrost had been destabilized. Eventually reaching an explosive concentration, it then erupted from the ground.

Discovery of this methane crater spurred a sweep of the area. Almost immediately, two other craters with similar features were discovered. And throughout fall and winter, both ground searches and satellite reconnaissance identified still more.

Methane blow hole lake surrounded by small craters

(Newly discovered methane blow-hole found by satellite observation. In the top frame we see tundra absent the newly formed hole. In the bottom frame, we find the hole forming a lake [B2] surrounded by 20 or more ‘baby craters.’ Image source: The Siberian Times.)

Now, according to recent reports in the Siberian Times, a total of seven craters with features similar to the Yamal eruption have been pinpointed by observers. Just one of these craters (shown above) hosted about 20 smaller ‘baby craters’ surrounding it. In this instance, a large methane store below the permafrost is thought to have explosively displaced a shot-gun pattern of frozen soil sections before filling with water.

Most of the craters, like the one above, were observed to rapidly fill with water even as they continued to emit methane. In many instances, the methane emission was visible as bubbles on the newly formed lake surface.

Bubbles from Methane Crater Lake

(Bubbles from suspected methane crater lake as seen by an observation aircraft. Image source: The Siberian Times.)

Additional reports from reindeer herders have led these same scientists to believe that in the range of 20-30 of these methane eruption holes are likely to exist in this region of Northwestern Siberia.

A Problem of Relic Hydrates Facing Rapid Warming

The fact that reindeer herders keep discovering new holes and that the first Yamal craters discovered earlier this year were recent events have led local scientists to believe that the eruptions are a new phenomena for Siberia. There, temperatures have warmed by a stunning 2 degrees Celsius within the mere span of 14 years. A very rapid rate of warming that is putting severe stress on the geophysical stability of this Arctic region.

Last night, as polar amplification again ramped up, we saw an example of this very rapid warming with locations in Yamal, Russia experiencing -3.1 C temperatures as of 1 AM Eastern Standard Time. A very warm measure for this region during winter time — representing an anomaly at least 20 degrees Celsius above average. For reference, North Texas, an area far south of the Arctic Circle, experienced similar readings (-3.4 C) at the same time:

imageimage

(Side-by-side frames showing 1 AM EST temperatures in Yamal Russia [left frame] and North Texas, US [right frame]. Location in the frames is indicated by the small green circle. Temperature, wind speed and direction, and grid location are given in the lower left hand corner. Image source: Earth Nullschool. Data Source: Global Forecast Systems Model.)

In other words, it was colder in North Texas last night than it was in Yamal, Siberia near the 70 degree North Latitude line beside the Arctic Ocean.

This extremely rapid warming is thought by Russian scientists to have destabilized zones of relic hydrate trapped beneath the permafrost. There, the methane gas bonded with water to form a kind of methane ice.

Sandwiched beneath frozen permafrost, the hydrate remains stable so long as temperatures and pressures are relatively constant. Any increase in warmth — either through geological processes working below the hydrate, or from changes at the surface causing permafrost to melt and warmer, liquid water to contact the hydrate — would result in increased hydrate instability.

Yamal Crater Wall

(The Yamal Crater as seen by Russian Scientists who investigated the scene last summer. The crater’s structure and surrounding ejecta was indicative of an explosive outburst. Image source: The Siberian Times.)

In some cases, the gas would very rapidly liberate from its frozen traps forming increasingly high pressure pockets beneath the permafrost. If these pockets reach 10 percent methane concentration, they become very explosive and can be ignited when in contact with a catalyst or ignition source. The result, either due to very high pressure or ignition, is plugs of permafrost exploding from the ground as the gas erupts to the surface.

Conditions in Context

It is important to note that the amount of methane liberated by these initial eruption events is likely rather small — when considered on the global scale. However, what we see in Siberia now may be part of a growing and ominous trend.

First, we do not know the size of the potential methane store that could be liberated in such an explosive fashion. And the question must be asked — if we are looking at such rapid warming of methane hydrates in shallow sea and former shallow sea regions, what scale eruptions could we potentially experience in the future? Could very large sections of hydrate go critical? Areas possibly covering hundreds or thousands of square meters or more?

The Russian scientists seem very concerned. And, ironically, it is for the future safety of their oil and gas infrastructure, which sits atop what is potentially a rapidly destabilizing zone. A zone that could see explosive eruptions of the ground beneath pipes, equipment and extraction fields. (One would think that the Russians would also begin questioning the continued exploration and production of oil and gas considering its contribution to the dangers they are now identifying. But that level of wisdom appears absent in the recent assessments.)

Second, it appears that these methane eruptions provide pathways for ongoing release. Not all of the gas in the relic hydrate is initially liberated. And the structures that remain apparently release methane gas for some time — as is evidenced by continued high methane concentrations found at crater sites and by observed emissions from crater lake surfaces.

In essence, if this is a growing trend, then it is a rather unsettling one. Especially when one considers that it is just a single instance of many possible amplifying carbon feedbacks set off by a very rapid human warming. Particularly, the explosive land and ocean floor-altering nature of this specific carbon feedback makes it especially troubling. For it encompasses the very nature of a catastrophic upheaval.

In the end, the question must be asked — is Siberia sitting atop a methane volcano that is being prodded to rapid wakening by high-velocity human warming?

Links:

Dozens of New Craters Suspected in Northern Russia

Are Siberia’s Mysterious Craters Caused by Climate Change?

Earth Nullschool

Global Forecast Systems Model

More Siberian Craters Prompt Urgent Call For Investigation

Hat Tip to James Cole

Hat Tip to Wili

Hat Tip to Colorado Bob

Mauna Loa Methane Measure Shows Rising Rates of Increase Through End 2014

Mauna Loa Methane early December

(Atmospheric methane levels as measured at the Mauna Loa Observatory. Image source: NOAA/ESRL.)

Atmospheric methane levels as measured by the Mauna Loa Observatory (MLO) showed a continued steepening rate of increase through late 2014 — featuring one rather troubling spike late last month.

The measure, which has been recording atmospheric methane levels since the middle of the 20th Century, continued to ramp higher with readings hitting an average of 1850 parts per billion by late November.

Notably, this increase is at a faster pace than yearly averages for all of the last decade.

In addition, a single spike to 1910 parts per billion took place last month. This large departure of 60 parts per billion above the average was somewhat unusual for the Mauna Loa measure. The collection site is rather far from human or Arctic emissions sources which makes it less likely to feature anomalous spikes due to local influences. This particular spike also represents the largest single departure from the base line measure since 1984 (when the ESRL record begins).

Overall drivers of the more recent increase in global methane levels beginning around 2007 come from an increase in human emissions (likely due to rising rates of fossil fuel exploitation — primarily through hydrofracking and coal mining) as well as what appears to also be an increase in Arctic emissions. Large methane sources in Siberia, over the East Siberian Arctic Shelf, in the Laptev Sea, the Nares Strait, and west of Svalbard have been observed in both satellite monitors and through observations taken by scientists and researchers on the ground. Overall, a significant overburden of greenhouse gasses centers on the Arctic and appears to be enhanced by local carbon (methane and CO2) sources in the region.

More comprehensive measurements of methane releases over Alaska (according to NASA JPL), on the other hand, have not yet shown methane release departures above the global norm for land areas. But the observational record for Alaska composes just one year (2012), so there is no way to yet determine if permafrost carbon and methane releases from the tundra in that region increased to achieve their current rates. It is worth noting generally that the terrestrial zone for Alaska and its off shore region are not, as yet, major carbon release hot spots.

Global Warming Potential at Least 20 Times CO2

Methane (CH4) is an important greenhouse gas due to the fact that its global warming potential (GWP) over short periods is much higher when compared to a similar volume of CO2 (most measures consider the GWP of methane to be 20 times that of a similar volume of CO2). That said, methane’s residence time in the atmosphere is much shorter than CO2 and CO2 volumes are much larger. So CO2 is considered to be a more important gas when it comes to long term climate change. Nonetheless, CH4 increases since the start of the industrial revolution put it as the #2 gas now forcing the world to warm.

Very large outbursts of CH4 from the global carbon store (including terrestrial and ocean stores) during the Permian and PETM are hypothesized to have set off very rapid increases in global temperature. For some prominent researchers, this potential hazard is seen to be very low under current warming conditions. Others, however, seem very concerned that a rapid methane outburst under the very fast rate of human warming could be a tipping point we are fast approaching.

Observations in a Murky Scientific Context

It is important to note that the current profile of atmospheric methane increase does not yet look like one of catastrophic release. Instead, what we see is an overall ramping up of atmospheric levels.

The issue of catastrophic release potential — raised by Peter Wadhams, the Arctic Methane Emergency Group, and Dr. Simeletov and Shakhova among others — is not one that is certain or settled in the science.

As an example, Dr. Shakhova identifies a substantial but non-catastrophic 17 megaton atmospheric release from the East Siberian Arctic Shelf (equal to about 8 percent of the human emission and a substantial increase from a previous estimate of 8 megatons per year in 2010) as currently ongoing. However, both Simeletov and Shakhova have been the object of criticism due to their identification of a risk of a 3.5 gigaton per year methane release should all the East Siberian Arctic Shelf methane hot spots become active. Such a release would, in one year, nearly double the amount of all methane currently in the atmosphere (5 gigatons).

Dr. Peter Wadhams, another Arctic expert, has also received criticism for his assessment that a 50 gigaton release from the large subsea Arctic methane stores could be possible as sea ice retreat spurs Arctic Ocean sea floors to warm.

Other scientists such as GISS lead Gavin Schmidt and prominent Earth Systems modeler David Archer have noted that such very large releases aren’t currently likely. They point to natural traps that tend to tamp down sea based release rates (sometimes stopping as much as 90 percent of a destabilized methane source from hitting the atmosphere). They also note that current warming has probably not yet exceeded levels seen during the Eemian (130,000 years ago) and no large methane releases were observed at that time from Arctic carbon stores like the ESAS. They tend to take the view that any increasing rate of release coming from Arctic methane stores in particular and Arctic carbon stores in general will be very slow — so slow as to not be a significant amplifier of human warming (less than 5 percent) this century.

In general, between these two rather extreme and increasingly polarized views on Arctic methane, there appears to be very little in the way of middle ground. Although, a loosely related survey of permafrost carbon experts found a consensus opinion that the total carbon emission (including CO2 and methane) from land based tundra alone would equal between 10 and 35 percent of the current annual human emission by the end of this Century. It’s worth noting that this survey assessment does not include potential releases from the submerged permafrost in the ESAS or releases from other global carbon stores as a result of human warming.

The current rapid pace of human-caused warming — heating some regions of the Arctic as fast as 0.5 to 1 C per decade — also caused some of Archer and Schmidt’s scientific forebears, particularly James Hansen, to be rather less dismissive of the potential for a significant release from global methane stores, especially those in the Arctic. In any case, current human greenhouse gas emissions of nearly 50 gigatons CO2e each year are now in the process of pushing global temperatures past Eemian thresholds. An excession likely to elevate Anthropocene temperatures beyond all Eemian estimates before the mid 2030s under current rates of global greenhouse gas emissions and expected increases in fossil fuel burning.

So it is in this murky scientific context that we must interpret risks involving a continuing and apparently ramping rate of atmospheric methane increase. And what we can say with certainty is that there is little evidence that we are now hitting an exponential rise in global atmospheric methane levels. But that there is some evidence that a risk for such an event is real and requires much more detailed research and public dissemination of information to put what are some very valid concerns to rest.

Links:

NOAA ESRL

Alaska Methane Survey by JPL

Global CO2 to Reach Extremely Dangerous Peak Near 402 PPM for 2014, Methane Levels Ramp Ominously Higher

During 2014, human CO2 forcing continued its long march toward ever-more dangerous and climate-damaging levels. By the peak month of May, global CO2 had ranged well above the 400 parts per million threshold, catapulting Earth at raging velocity toward climate and atmospheric states not seen in at least 3 million years.

According to May readings from the Mauna Loa Observatory, the more volatile hourly measures jumped as high as 404 parts per million while daily and weekly averages tended to settle between 401.4 and 402.3 parts per million. Given these trends, overall CO2 levels for May of 2014 are likely to peak at near or just below the astronomical 402 ppm threshold.

Atmospheric CO2 Late May 2014

(Atmospheric CO2 levels measured by the Mauna Loa Observatory over the past two years. Peak values for 2012 hit near 397 ppm, peak for 2013 hit near 400 ppm, and peak for 2014 is likely to hit near 402 ppm. Image source: The Keeling Curve.)

CO2 levels near 400 parts per million are enough, according to our developed understanding of paleoclimates, to increase global temperatures by between 2 and 3 degrees Celsius, to melt Greenland, West Antarctica and a portion of East Antarctica, and to raise sea levels by 75 feet if sustained over a long term. According to recent glacial research, these very high levels, when combined with additional greenhouse gas forcing and concurrent ocean and atmospheric warming have already been enough to destabilize or push large portions of these major ice systems into irreversible collapse.

(A history of atmospheric carbon dioxide through early this year provided by CIRES and compared to the entire ice core record of the past 800,000 years. Video source: CIRES.)

36 Billion Tons of CO2 Emission per Year and Counting

Measured from peak to peak, the rate of atmospheric increase is likely near 2.5 to 3.0 parts per million per year over the two year period. Averages over the whole range of the past two years show increases on the order of 2.4 parts per million per year — a challenge to recent rates of increase near 2.2 parts per million a year since 2000.

Steadily ramping rates of atmospheric CO2 accumulation are driven by extreme global industrial, agricultural, and land-use emissions. According to the Global Carbon Project, 2013 saw total global CO2 emissions in the range of 36 billion metric tons. This emission was 2.1 percent higher than the 2012 level and about 60 percent higher than the 1990 level at around 22 billion metric tons of CO2. Such an extraordinary pace of emissions puts severe strain on both atmospheric carbon levels and on carbon sinks around the globe. The resulting risk of such a strong continued emission is that global sinks and stores may soon become sources (see methane monster below). An issue of amplifying feedbacks that grows ever more perilous with each passing year.

Rapidly Increasing CO2 Acting in Concert With Ramping Methane, other Greenhouse Gasses

Unfortunately, CO2 is not the only human emission forcing global temperatures rapidly higher. In addition, methane, nitrous oxide, and numerous other greenhouse gasses also make their way into the atmosphere each year through industrial sources. If we combine all these other greenhouse gasses, the total CO2 equivalent carbon emission is now at around 50 billion metric tons each year. A veritable mountain of greenhouse gasses dumped at a pace more than 150 times that of volcanic emissions each and every year.

Overall, the total greenhouse gas forcing from all these sources is now likely in the range of 481 parts per million of CO2 equivalent. This immense heat forcing, were it to remain in the atmosphere long-term, is enough to raise global temperatures by 3-4 C and to melt enough ice to raise sea levels by at least 120 feet. It is also enough, with only two more years of current emissions, to likely lock in an inevitable, irreversible and extraordinarily disruptive increase of 2 C in global temperatures for this century alone.

First Glimpses of the Methane Monster

The most potent and troubling of these additional greenhouse gasses is methane. Over the course of 20 years, methane is about 80 times as powerful a heat trapping gas as CO2 by volume. And though atmospheric methane levels are far less than comparable CO2 levels (at around 1.8 parts per million, or 1/3 the total atmospheric heat forcing of CO2), there is cause for serious concern.

For not only is the industrial emission of methane increasing, primarily through the use of very damaging hydraulic fracturing technologies (fracking), the global emission of methane from the Earth System also appears to be ramping higher. Over recent years, rapidly thawing permafrost and warming oceans both around the world and, particularly, in the Arctic show signs of venting an increasing volume of methane into the atmosphere from terrestrial sources. Though annual official tracking of total Arctic methane emissions at this point is practically non-existent, recent research allows for rational estimation.

Taking into account known emissions from permafrost and the East Siberian Arctic Shelf, and adding in expected emissions from the rest of the thawing Arctic, methane emissions for the entire region are likely around 40 teragrams per year, or about 7% of the global total. This emission is equivalent to that of a major industrial nation and initial indications are that it is growing.

Mauna Loa Methane 2007 to 2014

(Atmospheric methane increase since 2007 as measured at the Mauna Loa Observatory. Note the more rapid pace of increase from 2013 through the first quarter of 2014. Image source: NOAA/ESRL.)

The result of combined increases in the human methane emission and in the Earth System emission has been enough to continue to push global levels higher with Mauna Loa readings breaching the 1840 part per billion average by early 2014. What is even more troubling is that the Earth System methane store, composed of both permafrost methane and methane hydrate at the bottom of the world ocean system, is immense.

In total, more than 3,000 gigatons of carbon in the form of methane may be at risk to eventually hit the atmosphere as the Earth continues to warm under the current human forcing. A very large store that could easily multiply the current rate of Earth System methane release many times over. One that represents a clear and present danger for a potentially very powerful amplifying heat feedback to an equally extraordinary initial human forcing.

Links:

The Keeling Curve

NOAA/ESRL

What Does a World at 400 PPM CO2 Look Like Long-term?

Grim News From NASA: West Antarctica’s Entire Flank is Collapsing Toward the Southern Ocean

Global Carbon Budget 2013

A Faustian Bargain on the Short Road to Hell: Living in a World at 480 CO2e

Far Worse Than Being Beaten With a Hockey Stick: Michael Mann and Our Terrifying Greenhouse Gas Overburden

Beneath the Cracking, Melting Ice, Arctic Methane Monster Continues its Ominous Rumblings

CIRES


Methane Monster Finding Cracks in Earth’s Defenses: Is the Global Methane Sink Starting to Fade?

Annually, humans emit about 13.5 gigatons of carbon, or about 50 gigatons of CO2 equivalent gasses into the atmosphere. The measures are essentially the same — one just counts carbon weight, the other counts out all the additional hydrogen, oxygen, nitrogen or other atoms together with the carbon.

Of this massive volume, a volume at least six times the emission seen at any time in the geological past, even during the worst greenhouse gas extinction — the Permian — only a fraction remains in the atmosphere for any substantial period of time. This fraction continues to trap the heat and cause the effects we now see on a daily basis — extreme weather, record droughts, fires, floods, crop damage, sea ice loss, storms and an incessant rise in global temperatures.

The rest goes into what we call carbon sinks or stores.

Through the course of human-caused warming, scientists have been concerned that carbon sinks and stores will eventually fill up or, even worse, become emissions sources themselves. The result would be that a greater fraction of the human greenhouse gas emission would remain in the atmosphere longer and do even more damage through its now increased warming potential as natural sources began to emerge and multiply.

Atmospheric elevator

(Atmospheric elevator. Very large storms in the Pacific transport pollutants into the stratosphere. What impact is this having on one of the world’s major methane sinks — the hydroxyl shield? Image source: Alfred Wegener Institute.)

It is this kind of amplifying feedback that we’ve been sounding warnings on since 2012. And, according to new scientific research, there is serious reason for concern that another amplifying feedback in the form of erosion of the methane sink is now starting to develop coincidentally with rising rates of natural methane store emissions.

Methane — A Potent Heat Trapping Gas

And it is here in our chilling and cautionary tale that we come to the story of how methane acts to warm the atmosphere…

As a molecule, methane is an extraordinarily potent heat trapping gas. If CO2 were the tortoise — persisting for hundreds or thousands of years and gradually and inexorably building up a potent heating force, methane is the hare — providing a very intense burst of heating potential for a short period before being sucked out of the atmosphere by either the hydroxyl sink in the tropopause or through interaction with the soil.

The hydroxyl sink lives as a thin layer of a detergent-like molecule consisting of one oxygen atom and one hydrogen atom (HO). The layer exists along a boundary between the troposphere and the stratosphere called the tropopause. It forms when Nitrous Oxide (NO2) encounters Ozone (O3) and water vapor (H2O) at a height of about 8-10 miles where solar radiation is of a wavelength shorter than 315 nanometers. The radiation energy sets off a reaction between these three molecules producing a layer of hydroxyl, a reactive compound that breaks down all sorts of nasty chemicals floating around in our atmosphere. It also breaks down methane. A service that is quite valuable, especially when you consider that methane’s heat forcing, without the rapid oxidization powers of the hydroxyl layer, would be far, far greater.

The heat potential of a single methane molecule is 80 times that of a single CO2 molecule (in the presence of aerosols, it jumps to 105 times that of CO2, somewhat reducing the aerosol cooling effect). And so it’s probably a good thing that the lifespan of a methane molecule in the current atmosphere is only about 8 years. In contrast, CO2 lives about 500 years before weathering or the deep ocean finally knock it out.

As a fraction of total greenhouse gas forcing, scientists conservatively calculate that the total methane overburden represents about 60 parts per million of additional CO2 equivalent heat forcing or a little more than half the total additional heat forcing from CO2. But this calculation takes into account the notion that methane is short lived and will tend to drop out, resulting in relatively less methane heat forcing over time.

Earth’s Hydroxyl Shield Now Has a Gaping Hole

And so it is that today we encounter a bit of a problem. For it appears that a large hole has now been blown in the methane/hydroxyl sink over the Pacific Ocean.

Hydroxyl Hole

(A very large hole in the Earth’s protective Hydroxyl Layer discovered over the Western Pacific northeast of New Guinea during spring of 2014. Image source: Markus Rex, Alfred-Wegener-Institute.)

Though the cause of the current hole is unknown, what is known is that powerful thunderstorms in the region provide atmospheric lift and could have mixed in ozone destroying chemicals such as bromine and chlorine that significantly reduced one of the key constituents of hydroxyl formation.

The hole is quite large and while the initial paper by Markus Rex primarily noted concerns about additional volatile chemicals reaching the stratosphere through the hole, these major hydroxyl reductions over such a large area are also likely to lengthen the atmospheric lifespan of methane.

This feedback may well be a result of other human pollutants and have a possible negative effect on global warming by acting to significantly degrade a major carbon sink. If such an instance is confirmed, it may well be the first such case of its kind where two separate subsets of pollution create a kind of harmonic, but indirect, warming potential effect.

In any case, not a good outcome.

10 to 165% More Methane to be Released From Wetlands

A second very large methane sink/store is encompassed by the world’s vast swaths of wetlands. There, organic materials in the wetlands soil bind electrons needed by methane producing bacteria during regular wet-dry cycles, preventing a portion of the organic material from being broken down as methane. In essence, it’s a kind of indirect methane sink in that it prevents carbon-based materials from being converted to methane by already active methane producing bacteria.

But new research conducted by a team of Swiss and German researchers has found that as climate warms, wetlands are increasingly submerged, and large regions of tundra wetlands thaw, the electron binding process tends to run in reverse even as more wetlands become available for methane emission. In essence, warming both submerges more wetlands even as it generates more wetlands due to tundra thaw. It’s a kind of one, two punch that these researchers are saying could push global methane production radically higher.

As a result, the very large organic carbon store contained in wetlands would increasingly be emitted as methane and the wetlands would act less and less as a methane sink and more and more as a venting methane store. The new addition of wetlands from melting tundra only compounds the process. Researchers found that wetlands are likely to emit between 10 and 165% more methane due to these combined impacts.

It’s worth noting that global methane emissions from wetlands are currently about 165 teragrams (megatons metric) each year. So the new research estimates that annual emissions from these sources will increase by between 17 and 260 megatons annually. By comparison, the total annual methane emission from all sources (including the human addition) is about 600 megatons each year.

Pace of global atmospheric methane increases is tracked by NOAA’s Earth Systems Research Laboratory. Mauna Loa annual measures and trends can be seen here:

Global methane levels

(Global methane levels since 1983 as measured at the Mauna Loa Observatory. Image source: NOAA.)

Fading Sinks, Releases From Stores

These new discoveries — the formation of a hydroxyl shield hole and the recent study finding that global warming will lead to a greater annual release of methane from the world’s wetlands — are likely to combine with ongoing human methane emissions that are now radically increased due to hydrolic fracturing for new gas deposits and with potentially increasing methane emissions from subsea sources such as worldwide stores of methane hydrates and the very vulnerable methane stores in the East Siberian Arctic Shelf. The result is a much greater risk that current methane levels will rise and/or remain high for longer than expected. In total, it’s a significant risk of additional major warming on top of an already very powerful heat forcing coming from a rising human CO2 emission.

Links:

Markus Rex, Alfred-Wegener-Institute

Methane Climate Change Risk Suggested By Proof of Redox Cycling of Humic Substances

Sea Ice Melt, Methane Release Shows Amplifying Feedbacks to Human-Caused Climate Change

NOAA

Global Methane Emissions From Oil and Gas

Methane Emissions From Wetlands

Hole Found in Natural Protective Layer

Tropospheric Chemistry

A Faustian Bargain on the Short Road to Hell

Hat Tip to Colorado Bob!


CO2, Earth’s Global Thermostat, Dials Up to Record 401.6 ppm Daily Value on March 12

NASA GISS, likely the world’s premier Earth atmospheric monitoring agency has dubbed CO2 “The Thermostat that Control’s Earth’s Temperature.” So when human fossil fuel emissions keep cranking that thermostat ever higher, it’s important sit up and take note. For, inexorably, we keep forcing atmospheric values of this critical heat-trapping gas up and up.

According to reports from The Mauna Loa Observatory and The Keeling Curve, daily CO2 values for March 12 rocketed to a record 401.6 parts per million. Hourly values rose briefly higher, touching 402 parts per million. Levels fell back to around 400 ppm on March 13. But the overall trend will continue upward through March, April and much of May when the height of annual atmospheric CO2 readings is typically reached.

By comparison, during May of last year, daily and weekly values hit just slightly higher than 400 parts per million while measures for the month hovered just below this number. We are now about two months away from the 2014 peak. So it appears possible that daily values could rise to 404 ppm or greater with highs for the month potentially exceeding 402 ppm (you can view a comparison graph for May 2013 here).

March CO2 401.6

(Daily and hourly atmospheric CO2 values from March 7 to 13. Image source: The Keeling Curve.)

Such high levels of this gas have not been seen on Earth in over 3 million years. A time when temperatures were 2-3 degrees Celsius warmer and sea levels were 15-75 feet higher than today. And should CO2 levels merely remain at the level currently achieved, we can probably expect at least the same amount of warming long-term.

CO2 in Context

Annually, the average rate of CO2 increase now is an extraordinary 2.2 parts per million each year. This rate is about 6-7 times faster than at any time in geological history. None of the vast flood basalts of the ancient past, no period of natural vulcanism, can now rival the constant and massive injection of this powerful and long-lasting greenhouse gas by humans into the atmosphere.

Last year, the rate of increase spiked to around 2.5 parts per million and we can view this as mere prelude under a continuation of business as usual. For if human fossil fuel emissions are not radically brought into check, the ongoing economic inertia of existing fossil fuel based infrastructure and planned new projects will likely shove this rate of increase to 3, 4 even 7 parts per million each year by the end of this century. As a result, CO2 levels alone have the potential to reach catastrophic values of 550 parts per million by around 2050-2060 that, long term and without any of the added effects of other greenhouse gasses, would be enough to eventually melt all the ice on Earth and raise global temperatures to around 5-6 degrees Celsius above current levels. A level that, through acidification alone and not including damage through stratification and anoxia, could drive up to 1/3 of ocean species to extinction.

CO2 accounts for much of the greenhouse forcing when taking into account the feedbacks it produces on water vapor and clouds. NASA notes:

Because carbon dioxide accounts for 80% of the non-condensing GHG forcing in the current climate atmosphere, atmospheric carbon dioxide therefore qualifies as the principal control knob that governs the temperature of Earth.

All other greenhouse gasses pale in comparison to both its total effect and its current rate of increase. Methane, the next most potent greenhouse gas, accounts for about 15% of the forcing and is rising at a rate of 4 parts per billion (1/550 that of CO2), generating a net effect equal to, in the worst case, an additional .4 parts per million CO2 each year (.29 when aerosols drop out). A troubling and dangerous increase itself. But still a mere shadow compared to the overall rate of CO2 increase.

Only in the most catastrophic of scenarios, when added atmospheric heat, primarily generated through added CO2 and other greenhouse gas forcing, triggers methane emissions equal to 2 gigatons each year in the Arctic (a rate 25 times the current release), would the total methane forcing approach the predicted value for CO2 by the end of this century under current fossil fuel emissions scenarios. More likely, paleoclimate scenarios tend to suggest that the natural methane feedback, long-term, is roughly equal to 50% of the CO2 forcing and is largely governed by it. A dangerous amplifying feedback driven by a devastating and long-lasting CO2 forcing.

CO2 is also the longest lived of the major greenhouse gasses with one molecule of CO2 providing effective atmospheric warming for at least 500 years. By comparison, the oxidation time for a single molecule of methane is around 8 years. What this means is that it takes an ever increasing methane emission just to keep values constant while atmospheric CO2 takes much longer to level off given even a constant rate of emission.

The result is that heat forcing from CO2 tends to remain constant over long periods while methane heat forcing values have a tendency to spike due to rapid oxidation.

methane.rf_.11071836-300x150

(Radiative forcing from a 10 gigaton release of methane in red compared to expected end century CO2 values of 750 ppm. Note how the methane heat forcing spikes and then rapidly falls off. Image source: RealClimate.)

Current rates of CO2 increase, therefore, should be viewed as catastrophic to climates that are both livable and benevolent to humans. A rate of increase that puts at risk severe changes to Earth environments and which provides a trigger for setting off a series of powerful amplifying feedbacks through the medium and long term. These include both loss of ice albedo and the potential for spiking methane emissions from the widespread natural store.

UPDATE:

Most recent daily values from March 12 onward in relationship to the six month trend. Note the sharp spike upward at the end of the period as well as the overall volatility of the trend line. High volatility may well be an indication that the typical carbon cycle is suffering disruption with sinks, stores and sources experiencing larger than typical fluxes.

mlo_six_months

(Mauna Loa Observatory six month trend. Image source: The Keeling Curve.)

Dr. Ralph Keeling today noted:

“We’re already seeing values over 400. Probably we’ll see values dwelling over 400 in April and May. It’s just a matter of time before it stays over 400 forever.”

Links:

The Keeling Curve

May 2013: CO2 Touches 400 ppm

The Thermostat that Control’s Earth’s Temperature

Atmospheric Composition, Radiative Forcing, and Climate Change as a Consequence from the Massive Release of Gas Hydrates

RealClimate

Hat Tip to Climate State

Kudos to Mark Archambault for Looking Sharp

The Arctic Methane Monster’s Nasty Little Helpers: Study Finds Ancient, Methane Producing, Archaea Gorge on Tundra Melt

An emerging methane feedback in the Arctic. It’s something that, since last summer, I’ve been calling the Arctic Methane Monster. A beast of a thing composed of giant reserves of sea bed methane and an immense store of carbon locked away in Arctic tundra.

How dangerous and vicious the monster ends up being to a world set to rapidly warm by humans depends largely on three factors. First — how fast methane is released from warming stores in the sea bed. Second — how swiftly and to what degree the tundra carbon store is released as methane. Third — how large the stores of carbon and methane ultimately are.

permafrost_arctic-1024x557

(Thawing permafrost and organic carbon in Yedoma region of Russia. Image source: NASA.)

On the issue of the first and third questions, scientists are divided between those like Peter Wadhams, Natalia Shakhova and Igor Simeletov who believe that large methane pulses from a rapidly warming Arctic Ocean are now possible and warrant serious consideration and those like Gavin Schmidt and David Archer — both top scientists in their own right — who believe the model assessments showing a much slower release are at least some cause for comfort. Further complicating the issue is that estimates of sea-bed methane stores range widely with the East Siberian Arctic Shelf region alone asserted to contain anywhere between 250 and 1500 gigatons of methane (See Arctic Carbon Stores Assessment Here).

With such wide-ranging estimations and observations, it’s no wonder that a major scientific controversy has erupted over the issue of sea bed methane release. This back and forth comes in the foreground of observed large (but not catastrophic) sea-bed emissions and what appears to be a growing Arctic methane release. A controversy that, in itself, does little inspire confidence in a positive outcome.

But on the second point, an issue that some are now calling the compost bomb, most scientists are in agreement that the massive carbon store locked in the swiftly thawing tundra is a matter of serious and immediate concern.

Tundra Thaw by Human GHG Now Practically Inevitable

At issue here is the initial power of the human heat forcing and what consequences that forcing is likely to unlock. Consequences that are directly tied to the amount of greenhouse gasses we emit. A total forcing that is now likely equivalent to around 425 CO2e when taking into account the effect of human aerosols and an even more ominous 480 CO2e when and if those aerosols fall out (IPCC and MIT).

The first number, 425 CO2e, were it to remain stable over years, decades and centuries, is enough push global temperatures above the 1.5 C warming threshold that would thaw the northern hemisphere tundra. And within this tundra is locked a store of about 1,500 gigatons of carbon. A massive store that is set to eventually, thaw, decompose and release its carbon as either CO2 or methane over the long period of warmth that is to come.

Area of contiguous permafrost

(Northern Hemisphere Permafrost Zones. Image source: NASA.)

The immense size of this carbon store represents an extreme risk both for extending the period of human warming and for, potentially, generating a feedback in which natural warming adds to, rather than simply extends, human warming. By comparison, human fossil fuel emissions have already resulted in about 540 gigatons of carbon being released into the atmosphere. The tundra store alone represents nearly three times this amount. But the concern is not just the massive size of the tundra store now set to thaw, or the rate at which the tundra will, eventually, release its carbon to the atmosphere. The concern is also how much of the tundra store carbon is released as either methane or CO2.

Methane Provides a Strong Amplifying Feedback

Since methane’s radiative absorption is about 35 times that of CO2 by volume in the IPCC climate assessments (and its short term global warming potential is as much as 72 to 105 times that of a comparable amount of CO2) and since methane release sets off other feedbacks by turning into CO2 after it is oxidized and by increasing atmospheric water vapor, a strong greenhouse agent in its own right, a significant portion of tundra carbon being liberated as methane could result in a rather powerful heat amplification. In the worst case, such an amplification could set off conditions similar to those during which other mini-greenhouse gas runaways occurred — such as the Permian, Triassic and PETM events.

Which is why the release of a new paper should be cause for serious concern.

Ancient Archaea — The Arctic Methane Monster’s Nasty Little Helpers

This week, a paper published in Nature Communications described findings based on a study of thawing Swedish permafrost. The study investigated how microbes responded to thawing tundra in various mires throughout warming sections of Sweden. What they discovered was the increased prevalence of an ancient methane producing micro-organism.

Billions of years ago, methane producing cyanobacteria or archaea were prevalent in the world’s oceans. The methane they produced helped keep the Earth warm at a time when solar output was much less than it is today. Later, as oxygen producing plants emerged, the archaea, to which oxygen was a poison, retreated into the anoxic corners of the more modern world. Today, they live in the dark, in the mud, or in the depths of oceans. There, they continue to eek out an existence by turning hydrogen and carbon dioxide into methane.

A kind of archaea, the newly discovered organism, named methanoflorens stordalenmirensis, was found to be exploding through sections of rapidly melting Swedish tundra. In fact, it is so at home in regions of melting permafrost that it blooms in the same way algae blooms in the ocean. As a result, it comes to dominate the microbial environment, representing 90% of the methanogens and crowding out many of the other microbes.

Distribution of Methanogen

(Methanogen shows global distribution. Each dot indicates a location where methanoflorens stordalenmirensis was discovered. Image source: Nature.)

That these massive archaea blooms can effectively convert large portions of the newly liberated tundra carbon store into methane was not at all lost on researchers:

“Methanoflorens stordalenmirensis seems to be a indicator species for melting permafrost. It is rarely found where there is permafrost, but where the peat is warmer and the permafrost is melting we can see that it just grows and grows. It is possible that we can use it to measure the health of mires and their permafrost. The recently documented global distribution also shows, on a much larger scale, that this microbe spreads to new permafrost areas in time with them thawing out. This is not good news for a stable climate“, said study author Rhiannon Mondav.

So what we have here is a billions year old microbe that thrives in wet regions called mires where permafrost is melting, rapidly converts tundra carbon to methane, readily spreads to new zones where permafrost melt occurs, and explodes into algae like blooms to dominate these environments.

One could not ask for a set of more diabolic little helpers for the already very disturbing Arctic Methane Monster…

Implications Going Forward: Arctic Methane Emission Not Currently Catastrophic, But Likely to Continue to Grow

Recent research shows that the current methane emission from all natural sources north of 53 degrees north latitude is on the order of 81 trillion grams (TG) each year. A portion of this, about 17 TG, comes from the East Siberian Arctic Shelf. Other inputs are from sea bed sources, thawing tundra and existing wetlands in the region. Meanwhile, the global emission, including both human and natural sources is in the range of about 600 TG each year. Overall, this emission is enough to overwhelm current sinks by about 40 TG each year, which results in continuing increases of atmospheric methane.

Atmospheric Methane Mauna Loa

(Atmospheric methane levels since 1969, Mauna Loa, show levels rising by about 200 ppb over the 45 year period. Image source: NOAA ESRL.)

As more and more of the tundra melts and as seabed methane continues to warm it is likely that total Arctic methane emissions will continue to rise, perhaps eventually rivaling or, in the worst case, exceeding the size of the human methane emission (350 TG). But, to do so, current Arctic and boreal emissions would have to more than quadruple — either through a slow increase (high likelihood) or through more catastrophic large pulse events (lower likelihood, but still enough for serious concern). By contrast, recent warm years have shown increases in the rate of methane flux/emission of around 5% with the average flux increase being around 2%.

It is worth noting that NOAA and a number of other agencies do track methane emissions in the Arctic but that a comprehensive tool set for accurately tracking the total emission does not appear to be currently available. Instead, various studies are conducted in an effort to capture total emissions levels. Monitoring does, however, track total atmospheric values.

Links:

Discovery of a Novel Methanogen Prevalent in Thawing Permafrost

Methane Producing Microbe Blooms in Permafrost Thaw

The Arctic Methane Monster

The Arctic Methane Monster Stirs

Living in a World at 480 CO2e

Caves Point to Thawing in Siberia

NSIDC: Climate and Frozen Ground

Thawing Permafrost Could Cause 2.5 Times the Warming of Deforestation

Is a Sleeping Giant Waking in the Arctic?

Radiative Forcing of Non CO2 Greenhouse Gasses

Carbon Tracker CH4

Like a Volcano Slowly Awakening at the Top of our Earth: From Baffin Bay to the Laptev Sea, Arctic Methane Monster Releases Troubling Outbursts

The most dangerous of volcanoes have a number of identifiable behaviors.

They tend to lay dormant for hundreds, thousands, or tens of thousands of years. Then, slowly, as heat and pressure beneath the Earth builds, they begin to awaken. First they tremble a bit. Then they emit a growing volume of noxious gas. Then, they begin a series of mini-outbursts in an ever more violent build-up to an explosive and destructive grand eruption.

The lost residents of Pompeii, were they here today, could tell us what such an event is like.

Now consider that a volcano-like thing also exists beneath the world’s frozen oceans and lands near the roof of our world. A thing that probably hasn’t erupted in over 45 million years. A thing that has had this immense period of time in which to build up an enormous highly toxic and explosive reserve of frozen and sequestered methane. A thing that is at least as large as the boundary circumscribed by the Arctic Circle. A vast and extraordinarily dangerous monster of a thing. A kind of climate super-volcano.

AIRS_Methane

(Initial methane out-gassing shows a tell-tale methane overburden in the troposphere near Arctic ocean and tundra methane sources in 2011. Just one of many signs of what may be a very large, impending methane eruption. Image source: NASA/AIRS.)

For ever since the Earth began its long fall into cooling at the end of the Eocene, methane has been freezing at the bottom of the world’s oceans, sequestering in the frozen earth. As world land and ocean temperatures fell, the methane formed into clathrates or was bound up in organic permafrost and was, ever-after, locked away. There it lay patiently, waiting for the time when it would be, once again, disturbed by a return to warmth.

And that time of dangerous and explosive reawakening, increasingly, seems to be now.

Footprint of the Vast Volcanic Monster: Shallow Seas, Deep Seas, Permafrost

Of these volatile methane concentrations, some of the most prolific and the most vulnerable reside in the Arctic. Some, which lay sequestered within the shallow sea bed near the East Siberian Arctic Shelf, have been the subject of much controversy during recent years. Scientists like Natalia Shakhova and Peter Wadhams have issued repeated warnings that these methane stores could be vulnerable to a rapid release as sea ice retreats and waters warm. It is estimated that as much as 1400 gigatons of methane lay sequestered under Arctic submarine permafrost in the ESAS. A massive store that, if disturbed even in part, could provide an immense amplifying feedback to human-caused warming.

But the Arctic submarine permafrost isn’t the only zone in which large volumes of methane lay hidden. The Amundsen Basin, one of the deepest trenches in the Arctic Ocean, in the Laptev Sea is a known emitter of methane from sub-sea sources. A region near Svalbard both stores and emits large volumes of methane. And, recently, high rates of methane release have been observed near Baffin Bay. A complete catalog of these stores has not been adequately assessed. But, in combination, it is likely that they at least approach the total volume of stores in the vulnerable East Siberian Arctic Shelf (ESAS) zone.

Ominous Rumblings from the Rapidly Warming Deeps

These stores are deeper beneath the ocean surface and so are not generally thought to be as vulnerable as the shallow sea reserves in the ESAS. But this thinking may be in error as Arctic waters display a temperature inversion in which surface waters near the ice pack are colder than deeper waters far below.

In addition, wide zones of deep water in the Arctic have displayed rapid warming over the past few decades. As an example, bottom waters in the Greenland Sea, an area between the east coast of Greenland, Iceland and Svalbard, were shown in a September 2013 study to be warming 10 times faster than the rest of the world’s deep ocean system. According to the report:

Recent warming of the Greenland Sea Deep Water is about ten times higher than warming rates estimated for the global ocean. Scientists analyzed temperature data from 1950 to 2010 in the abyssal Greenland Sea, which is an ocean area located just to the south of the Arctic Ocean.

Deep Water Warming in Greenland Sea

(Deep Water Warming in the Greenland Sea since 1950. Image source: Science Daily. Image credit: Alfred Wegener Institute, Helmholtz Centre for Polar and Marine Research.)

In other regions of the Arctic and through the rest of the global ocean system rapid ocean bottom warming has also been observed. Recent studies by Kevin Trenberth have found that heat accumulation in the deep ocean, during recent years, has outpaced that of warming at or near the surface. And because this warming occurs adjacent to frozen methane stores on or beneath the sea floor, it is a very, very dangerous development.

To the point of an observed rapid warming of the deep ocean, it is important to note that there are a number of mechanisms that transport heat into the abyss worldwide. But in the Arctic, this transfer system is amplified and particularly intense. Fresh, cold surface waters tend to deflect warmer, saltier waters funneling in from more southerly latitudes toward the Arctic Ocean bottom. As glacial ice melts in Greenland, as storms within the Arctic intensify and become more prevalent, and as fresh water runoff from the continents surrounding the Arctic basin increases, fresh water content at the surface grows and widens, creating a kind of fresh water wedge that expands southward and deflects warmer, saltier water toward the ocean bottom.

And there, the warmer waters can go to work releasing the massive volumes of methane stored in frozen clathrates near the ocean floor.

Large Mid-February Methane Belch

Methane released from deep water clathrate stores has a long journey before it reaches the atmosphere. The methane passes through the water column, where a portion of it oxidizes into CO2. Microbes near the methane source and throughout the water column devour a portion of the methane as an energy source. But eventually, if the pulse is large enough, the methane finds its way to the surface and releases. Such outbursts are, likely, only a fraction of the initial bottom release. So a large expulsion into the atmosphere may well be a hint that something even more powerful and energetic is going on down below.

Over the past decade, deep water regions have shown at least as much atmospheric venting as the East Siberian Arctic Shelf. And this year has been no exception with troubling outbursts continuing in a zone from Baffin Bay to Svalbard to the Laptev Sea. These outbursts have, in part, contributed to increasing atmospheric methane concentrations at a rate of around 7 parts per billion each year since 2007 after an 8 year period during which global methane levels had plateaued at around 1790 parts per billion. By comparison, pre-industrial global methane levels were around 750 parts per billion during the 1880s. Today, they average around 1835 ppb (Mauna Loa). Should very large outbursts emerge, the rate of atmospheric methane increase would be expected to dramatically steepen. And though we haven’t yet seen these kinds of outbursts, more minor, but still large and concerning, continue to occur with troubling frequency.

This past week, according reports from Methane Tracker and Sam Carana, two particularly large and troubling ocean to atmosphere methane outbursts were observed in this region — one over the Laptev Sea and the other over Baffin Bay. The Baffin Bay outburst occurred in a zone where water depths ranged from 1,000 to 2,500 meters (middle to deep ocean) and the Laptev outburst likely occurred from the deep waters and precipitous slopes of the Amundsen Basin which plunges as deep as 4,400 meters (extraordinarily deep ocean) and extends almost directly under the North Pole.

Methane belch

(Methane belching from Laptev Sea and Baffin Bay on February 22nd with highest reading spiking to 2383 ppb, about 500 ppb above the global average. Image source: Methane Tracker and Sam Carana. Data source: composite methane data collection from SIO, NOAA ESRL, U.S. Navy, GEBCO. )

From these outbursts, 10,000 foot methane concentrations of 2383 ppb were observed. These readings are about 500 ppb higher than the global average and represent an extraordinary local spike for the Arctic.

The outbursts occurred in a region where the fresh water wedge was most recently active — areas where sea ice keeps expanding then melting and retreating as warmer, saltier waters encroach. Regions where the warmer water column would be continuously flushed toward ocean bottom zones containing methane hydrates.

If we were to continue with the volcano analogy, we could well consider the most recent Laptev and Baffin Bay outbursts to be a series of minor but intensifying eruptions. The most recent in a string of troubling and increasingly more volatile activity from the methane volcano rumbling at the top of our planet.

Links:

Deep Greenland Sea is Warming Faster than the World Ocean

Global Heating Accelerates, Deep Ocean Warming the Fastest, What Does it Mean for Methane Hydrates?

Methane Tracker

NOAA ESRL

Massive Methane Concentrations over Laptev Sea

2013 4th Hottest Year on Record, Deep Ocean Warming Fastest

Triggers to Release the Methane Monster, Deep Ocean Warming, Sea Ice Melt, Sea Level Rise and the Fresh Water Wedge

Methane Emissions From ESAS Occurring at Twice the Expected Rate

The Arctic Methane Monster Stirs

Beneath the Cracking, Melting Ice, The Arctic Methane Monster Continues it Ominous Rumblings

Stop The War to Silence Science, End Egregious Cuts To Greenhouse Gas Monitoring Now

Here we stand at the cusp. At the brink. At the precipice of the crisis that will certainly define this century. An extraordinarily dangerous human alteration of the climate that, at its end, could be far more destructive and deadly than any war. A growing and emerging monstrosity created by us. One which, should we continue to feed it, would plunge us into the heart of one of the blackest climatological eras ever experienced on this planet.

We know there is danger. And we have known it for some time due to the clarity and accuracy of our vision. A vision provided to us by a scientific understanding of our world that is the pinnacle of human progress. For if there is one thing that we should be proud of, that we could all share in as a great victory for our race, it would be the knowledge and understanding that we have gained in our long and tempestuous rise from darkness.

Global CO2 levels since 1700

Global temperatures since 1880

(Upper graph: Global CO2 concentrations since 1700. Lower graph: Global temperatures since 1880 as measured at the world’s meteorological stations. Image sources: The Keeling Curve and NASA GISS.)

And yet now, at the brink of crisis, we are at risk of having the new senses provided to us by science, senses we depend upon so much for that knowledge, that vision we need most desperately, begin to fade, to dim, to wink out. For the monitors we use to track the crisis are steadily being de-funded and are at risk of going dark.

Just this past Christmas Eve, Dr. Ralph Keeling, son of the renowned Dr. Charles David Keeling, made a public appeal for increased funding of the critical Mauna Loa Observatory’s CO2 Monitor. The funds, you see, after more than 40 years of cuts to critical scientific research, research often labeled by political opponents to be ‘wasteful government spending,’ were at risk of short-fall. So Dr. Keeling, a scientist in the crucial and much-needed field of atmospheric monitoring, was forced, by the most greedy and heartless among us, who only see the gift beyond price that is human science as a tax burden equivalent to ‘wasteful government spending,’ to pan handle for the continued funding of his, all-too-necessary and growing ever more important with each passing day, mission.

Dr Keeling’s appeal was the very modicum of dignity and candor. And it contained hardly a jot of the outrage which he, and the rest of us, should justifiably feel. Instead, he simply and candidly reminded us of the importance of his ongoing mission:

Friends,

I am writing as the director of the Scripps CO2 and O2 programs, which keep track of how these vital gases are changing in the atmosphere over time.  The CO2 measurements include the iconic Mauna Loa record, now commonly known as the “Keeling Curve”, which was started by my father in the late 1950s.

The O2 measurements, carried out on samples from Mauna Loa and many other stations, also provide critical information about how the planet is changing.  The measurements show that the world’s O2 supply is slowly decreasing, and have helped prove that the CO2 increase is caused by fossil fuel burning, but offset by natural sinks of CO2 in the land and oceans.

The need to continue these measurements has not diminished. The planet is undergoing dramatic changes, unprecedented for millions of years.  This past year, our group reported that CO2 topped 400 parts per million at Mauna Loa for the first time…

The Scripps CO2 and O2 measurements now face severe funding challenges.  The situation is most urgent for the O2 measurements.  These measurements have been supported for decades through proposals submitted every few years to the federal agencies.  The value of these measurements is not questioned, but federal funding for these programs has never been so tenuous.  This is the basis for this unusual to the public at large…

I have struggled throughout my career to cope with [funding challenges], and I will continue the struggle.  The quest for continued federal support will not end.

For now, I ask for your support so that we can keep up these activities and sustain our watch on the planet in this time of unprecedented global change.

Sincerely,

Ralph F. Keeling

(I’ve abbreviated Dr. Keeling’s appeal for this post. That said, I fully urge you to read the entire appeal at his blog The Keeling Curve, to help spread word of his appeal far and wide, and to donate generously.)

Now, as Dr. Keeling knows all too well, 400 ppm CO2 is a big deal. If the world were to remain at this level for an extended period, global temperatures would eventually stabilize between 2-3 degrees hotter than the 20th Century Average. Analysis of the dramatic changes, including a 15-75 foot sea level rise, massive expansion of deserts, a reduced productivity of lands and oceans, and dangerous changes to the world’s weather as it undergoes this temperature transition would put most if not all human civilizations at risk of collapse. Failure to heed this warning and rapidly stabilize and then reduce CO2 levels would risk these and far worse consequences. Yet despite this danger, we are rapidly heading on toward 450, 550, 650 ppm CO2 or more.

NASA has rightly labeled atmospheric CO2 concentration ‘the global thermostat’ and if you want to get a good idea of where the temperature is heading, you need to keep an eye on the thermostat needle. Dr. Keeling’s research gives us that needle. And without the measure his research provides, we are flying blindly into a world of worsening and ever more dangerous weather.

Methane Monitoring Cut as Well

Sadly, Dr. Keeling’s essential monitoring is not the only measure at risk of funding cuts. According to a recent report in Live Science, monitoring of another essential greenhouse gas, methane, has fallen by 25% due to ongoing cuts and is now at serious risk of collapsing. Ed Dlugokencky, an atmospheric chemist with NOAA’s Earth Sciences Research Laboratory in Boulder, Colorado noted:

“We’ve had about a 25 percent decrease in the number of air samples measured from the global cooperative network. If we want to understand what is happening [with methane], we’re going in the wrong direction to do that.”

While CO2 is the primary driver of current warming, methane is, increasingly, an indicator of one of the worst amplifying feedbacks due to human caused change. Massive volumes of methane lay stored in tundra and on the sea bed. Should these stores, which are sensitive to heating, be released into the atmosphere, they could add substantial additional warming on top of the warming already set in play by CO2 increases.

methane-concentration

(Global Methane Distribution Indicative of Large Arctic Emissions. Image source: NASA)

Recent reports and studies have found evidence of an increasing Arctic emission of methane, one that has possibly exceeded 90 megatons annually. Though not yet catastrophic, this increasing emission is a serious concern and we would be very unwise to stop taking measures of this very volatile and potentially dangerous atmospheric gas.

As is the case with Dr. Keeling, cuts in funding to scientific monitoring of these gases are as egregious as they are short sighted. The scientists and the research efforts they provide go to benefit us all. They work diligently to serve our interest and to give us the best information along with the means to make sound decisions, should we choose to. They are not wealthy and could have probably earned far more using their considerable intellects to game the stock market, for example, or to aid CEOs in determining how best to off shore US jobs to cheap, easily exploitable foreign labor.

There is no tax cut for the top 1 percent, no foreign oil war, no subsidy to the fossil fuel industry that is more important than funding this scientific effort and these selfless public servants who work so diligently on our behalf. So we should do everything necessary — increase taxes on the wealthy, stop fighting wasteful wars, and stop subsidizing dirty and dangerous industries — in order to provide the support needed to continue this vital service to humankind.

And as for those dark political and social forces that, as they did in Canada with the dismemberment, looting, and dissolution of scientific libraries, seek to suppress the accumulation of knowledge about how our world operates and, yes, responds to the harm we’ve inflicted upon it — they should be banished back to the dark ages from which they arose. They have no place here. Not at this time of clear and present danger. They are traitors to human progress, to our civilizations and, ultimately, to the vitality of life on this world. And they should be swept aside lest, one by one, we all, and not just the scientists, be silenced.

Links:

The Keeling Curve

NASA GISS

NASA’s Earth Observatory

NASA: CO2 Acts as Global Thermostat

Live Science

In Book-buring Like Episode, Conservatives in Canada Destroy Scientific Libraries

Hat tip to Colorado Bob

Beneath the Cracking, Melting Ice, the Arctic Methane Monster Continues its Ominous Rumbling

Methane Concentration

(Large Northern Hemisphere methane overburden points to major Arctic emission. Image source: NASA)

“How am I going to be an optimist about this?” — excerpt from Pompey

*    *    *    *    *

In the high north, deep beneath the sea ice, sequestered within the sea bed, sleeps a monster. A massive store of methane that is the relic of ages past. A beast whose vast body is composed of hundreds of gigatons of this climatologically volatile gas.

Since times immemorial, the monster slumbered. Accumulating vast size and girth through a near constant rain and sequestration of biological material as the long ages passed. Until human time, that is, when an unprecedented warming began to prod the monster to waking. And so, during recent years, the monster has stirred, even as more and more of this gas has been observed escaping into the atmosphere.

What is happening can be compared to the, at this time, slow initial rumblings of a climate volcano. The gas, forced out of its icy traps in the sea bed, escapes into the ocean where it destabilizes the sea bed and wrecks jarring changes on the marine environment. It bubbles up beneath the ice, running along beneath the strong ice to find holes where the ice is weak, or escaping out from under the ice edge. And in these places, it runs out into the atmosphere. There, the gas is between 20 and 100 times as potent a warming agent as CO2 by volume. There, it inevitably adds to the human warming and emissions nightmare now underway.

In other places the tundra thaws, unleashing its own monstrous volumes of methane, adding to the giant emerging from the troubled seas.

We have seen the large and growing escape of methane in the great 1 kilometer plumes in the East Siberian Arctic Shelf and in other large releases off of Svalbard. We have seen them in the 150 kilometer atmospheric plumes observed by NASA’s CARVE study. We have seen them in ‘hot’ melt lakes that bubble with methane dense enough to burn. We have seen them in the explosive Arctic fires that burn the thawing and volatile land itself.

These all-too-obvious hints of steadily increasing emissions are ominous, not only for their current warming contribution, but for the potential of an even more rapid and violent release. For the eruption of the methane monster, though somewhat gradual now, could, in the build-up to an immense disaster rarely witnessed on Earth, evolve into an ever more deadly and rapid release.

There is evidence of such events in the geological past. Events that have left their black fingerprints splattered over most, if not all, of the climate mass extinctions. And there are a handful of leading scientists who are very concerned that such an event may well be in the offing.

The Methane Monster Continues its, For Now Gradual, Emergence

methane-jan21-31

(Image source: Dr. Yurganov)

Unfortunately, 2013-2014 marked the continuation of a dangerous trend where, once again, rates of Arctic methane emission were shown to increase markedly over those seen during previous years. In the above series of enhanced Aqua satellite images, provided by Dr. Leonid Yurganov you can see the steadily increasing volume of atmospheric methane in Arctic regions during a time of typical methane peaks in late January from 2009 to 2013.

A more comprehensive slide-show ensemble displays Arctic methane increases from 2003 through 2012 here. It is is worth noting that top scale values were 1870 ppb in this video series. In the more recent series (images above and below), the scale has been increased to a maximum value of 1920 to account for spiking atmospheric levels. So don’t let the moving goal posts fool you!

Though we are still about two weeks away from the start of 2014 Arctic methane peaks, early data throughout the fall and winter has shown a marked increase in methane values when compared to similar periods last year. The below image, as an example, compares January 1-10 of 2013 with the same period of 2014:

methane 2013 to 2014 January 1 to 10

(Image source: Dr. Yurganov and Sam Carana)

These images, also provided by Dr. Yurganov and composed by Sam Carana, show substantial levels of methane increase for the Arctic during early January of 2014 when compared to the same period in 2013. Especially of note was the significant increase in methane concentrations over the Barents Sea where values were consistently higher than 1920 parts per billion.

It is worth mentioning that during 2009, the same region saw methane levels in the range of 1870 parts per billion and that the jump of +50 ppb or more during this interval is roughly consistent with global average increases. What is more concerning, however, is that these maps clearly show this region of the Arctic as a primary methane hot spot, indicating the likelihood of a very large emission seeping out from under the ice and up from the depths of the ocean.

Overall methane spikes in the Arctic were very significant with, according to observations from Methane Tracker, values exceeding extraordinary levels of 2400 parts per billion in local spikes.

NOAA’s ERSL monitor at Barrow also found large local spikes in the range of 1995 parts per billion during late December:

Barrow Methane 2012 to 2013

(Image source: NOAA ERSL)

Note that local methane levels at Barrow, Alaska on the Arctic Circle have risen from an average of 1895 ppb during early 2012 to about 1920 ppb by early 2014, an increase of more than 12 parts per billion per year.

Globally, methane levels have also been on the rise. The record at the Mauna Loa Observatory is now closing in on 1840 parts per billion and shows a significant upward curve during the past two year interval. Though not rising as fast as regions close to the large Arctic emissions sources, the Mauna Loa measure shows a jump of about 15 parts per billion over the two year interval from early 2012 to early 2014.

Mauna Loa Methane 2001 to 2014

(Image source: NOAA ESRL)

Above we can see the global trend line for methane as measured at the Mauna Loa Observatory. Note that methane increases had slowed during the period of 2001 to 2006. But in 2007, at about the time Arctic sea ice began its rapid retreat, methane levels commenced a rapid rise. Of particular concern is the gradual upturn in the global average methane curve leading into early 2014.

Very High Arctic Temperature Anomalies Coincide With Rising Methane Levels

As methane levels have continued to rise throughout the Arctic, so have winter temperatures. During 2013-2014, abnormal Arctic winter warmth, especially over the Arctic Ocean, the Barents Sea, and the Bering Sea, has played havoc with Northern Hemisphere weather. In early January, a spate of intense Arctic warmth collapsed the polar vortex, shoving a powerful remnant low southward and setting off a 20 year cold snap in the US. The same extreme winter weather pattern that has impacted much of the US also unloaded a fusillade of storms on the coastlines of the British isles, breaking thousand ton rock structures and reshaping seemingly impervious coastlines.

In this case, the added methane release contributes to polar warming amplification and, at this time, is setting in line a series of increasingly violent weather events likely to ramp up over the coming years and decades. In such cases, the methane monster’s contributions to warming cannot be detached from the changing climate as a whole. In fact, it is the kind of amplifying feedback that makes our situation far more dangerous.

Arctic 30 day anomaly a

(30 day Global Temperature Anomaly from 1981 to 2010 base line. Image source: NOAA)

Note the extreme temperature anomalies over the past 30 days throughout much of the high Arctic with extremes ranging from 2-6 degrees Celsius above the, already warmer than normal, 1981 to 2010 average. This is just the kind of heat, in conjunction with rising greenhouse gasses, that we would expect from an Arctic undergoing dangerous, if not yet catastrophic, change.

Is Optimism Rational?

Given the evidence showing an amplifying methane signal coming from the Arctic, a signal that becomes louder with each passing year, it becomes more difficult to cling to the comfort provided by a number of the more conservative scientists on the issue of methane release (hydrates, compost bomb or other). Though we have not yet seen major releases large enough to push global methane levels higher by 50, 100 or more parts per billion per year (as we would see during an exceptionally catastrophic event), what we have seen is a growing Arctic release that remains a serious cause for concern.

In such an instance, we might be wise to compare the Arctic Methane Monster to a massive volcano. One that continues to rumble even as it releases ever greater volumes of its climatologically volatile and heat-contributing gasses. As anyone living in the neighborhood of a volcano can attest, it’s generally not a good idea to ignore such things. In this case, the monstrous volcano is so large as to make all the Earth its neighborhood. So we should all be paying attention.

Links:

NASA

NOAA ESRL

Methane Tracker

Climate Change Driven Storms Reshape Coastlines of the British Isles

Arctic News

Arctic Ice Graphs

Playing with Global Fire

Amplifying Feedbacks

It’s The Collapsing Polar Vortex

Arctic Methane Monster Stirs

Amplifying Feedbacks: Climate Model to Test Projections of Zero Sea Ice By Summer 2016, Stark Predictions by Wadhams, Duarte

Ever since 1995 and especially since 2007 Arctic sea ice area, volume and extent have been in rapid free-fall. By 2012 both sea ice area and extent had suffered losses greater than 55% when compared to end summer measures in 1979. Sea ice volume, meanwhile had shown a stunning loss of nearly 80% from 1979 volume observations. This staggering trend of losses means that any melt year comparable to 2007, 2010 (volume) or 2012 would result in the total or near total loss of all sea ice within the Arctic by end of summer.

The summer of 2013 was exceptional in that it was the first year that statistical averages indicated a potential for total summer sea ice loss. The risk at the time was considered to be low, only 10%. But the figure was historic in that, never before, had a statistical risk of total sea ice loss been identified. Following more typical trends, the 2013 melt season showed a bounce-back from 2012’s record melt year with levels roughly correlating with those seen in 2009. That said, even 2013’s pseudo-recovery did little to disturb an extraordinarily powerful melt trend:

Sea Ice Volume Exponential Trend Wipneus

(Sea Ice Volume Measurements For All Months as Observed By PIOMAS With Exponential Trend. Image source: Wipneus. Note that the exponential trend shows monthly volume measures for July, August, September and October reach zero sea ice volume all before 2019.)

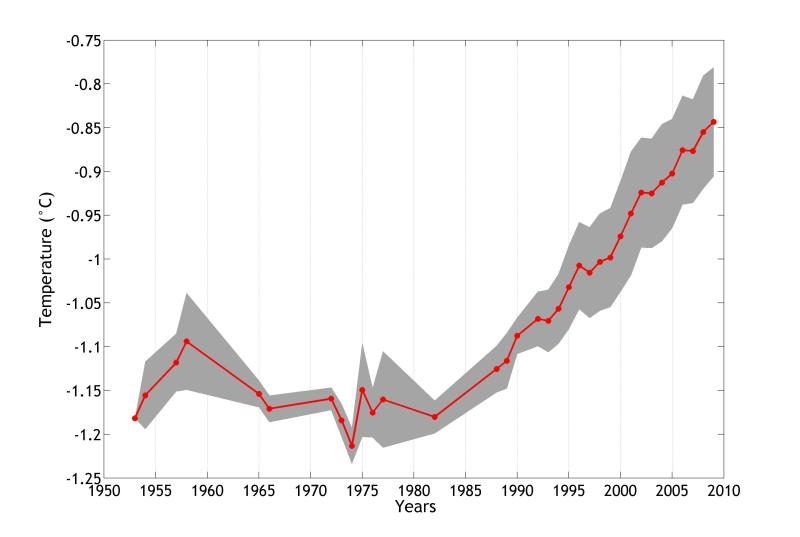
Taken into context, the 2013 melt season was little more than a counter-trend year in a period of ongoing and apparently inexorable decline. In context to these massive losses, the heat forcing in the Arctic continues to grow with most regions showing at least a doubled rate of temperature increase when compared to the global norm. Total temperature change in the Arctic is now about 2 degrees Celsius hotter than the 1950 to 1980 global average. A recent study of the regions around Baffin Island showed temperatures are now hotter than at any time within at least the last 44,000 years and probably the last 120,000 years. And with temperatures rising by about .4 degrees Celsius each decade, the Arctic continues to rapidly transition toward ever more hot and unfamiliar territory.

A High Resolution Climate Model For An Arctic in Rapid Transition

These rapid and massive changes appear to have left conventional global climate models (GCMs) in the dust. Earlier global climate model runs of the Arctic assumed slow responses to temperature increases by the world’s ice sheets resulting in predictions for ice free Arctic Ocean conditions at much higher temperatures than those currently being observed. The result of these assumptions that Arctic sea ice generated high inertia and was more resilient to human caused climate change were predictions for ice free Arctic summers to hold off until at least 2100.

But, as we have seen in the above analysis, recent events have put the possibility for ice free Arctic conditions on a much shorter time-scale. And, until recently, only statistical analysis, exponential trends fitting, and direct observation were able to provide any direct guide that more closely fit the stark and ongoing changes in the Arctic. In a world where simulative models seemed to take precedence over even observed reality, the dearth of models describing what all could plainly see was a catastrophic and rapid melt trend cast doubt on the all-too-stark observations.

Now, a new tool to place these much more rapid than expected melt conditions into context appears to be coming together. The high resolution Regional Arctic Systems Model (RASM) constructed by US Navy Scientist Professor Wieslaw Maslowski finds its basis in a 2012 paper showing the potential for the Arctic to be ice free come 2016 +/- 3 years. This new model takes into account a more detailed summary of Arctic conditions including a more highly resolved interpretation of the impacts of warming-driven changes to:

“… sea ice deformation, ocean eddies, and associated ice-ocean boundary layer mixing, multiphase clouds as well as land-atmosphere-ice-ocean interactions.”

Dr. Maslowski notes that while no climate model simulation is perfectly accurate, the RASM simulation is likely to be much closer to what is actually happening in the Arctic environment. Maslowski notes:

“Given the estimated trend and the volume estimate for October–November of 2007 at less than 9,000 km3, one can project that at this rate it would take only 9 more years or until 2016 ± 3 years to reach a nearly ice-free Arctic Ocean in summer. Regardless of high uncertainty associated with such an estimate, it does provide a lower bound of the time range for projections of seasonal sea ice cover.”

It is important to note that RASM hasn’t yet run or provided projections. But the fact that it is taking into account the visibly rapid loss of sea ice as well as a more refined view of the Arctic environs means that such a tool could well generate more accurate measures or at least help explain the apparently very rapid melt trend. According to Maslowski:

“We do expect to compare sea ice volume results [from the RASM model] with our earlier model for the same period … possibly next year or so…”

Confirmation of the Most Pessimistic Predictions?

2012 and 2007 record minimum overlay

(2007 and 2012 record sea ice minimums — overlay. Image source: NSIDC)

Dr. Maslowki’s paper and RASM model runs may provide single source confirmation for some of the most pessimistic predictions by Arctic sea ice experts. Dr. Peter Wadhams, a world renown sea ice expert who has spent about 30 years monitoring the state of sea ice aboard British Navy submarines has projected that the Arctic could reach an ice-free state by the end of summer during 2015 or 2016.

Another climate expert, Dr. Carlos Duarte, head of the Ocean Institute at the University of Australia, has projected that the Arctic will reach an ice free state by 2015.

More moderate projections place total sea ice loss during summer at between 2025 and 2040.

IPCC Global Climate Model Sea Ice Melt Projections For Extent (Trend in Black)

(IPCC Global Climate Model Sea Ice Melt Projections. Figures are in Sea Ice Extent (not Volume as seen Above). It is worth noting that the Volume and Area melt trends are much more pronounced than the extent measure that fails to count holes in the ice (area) or add in the measure of ice thickness (volume). The above image, produced by Overland and Wang, also appears to be off the 2012 minimum extent measure by about 200,000 square kilometers.)

Meanwhile, global climate models (GCMs), provided above, continue to lag real time observation, and projections by noted experts. Even taking into account models that have gotten the current trend mostly correct show ice free conditions by around 2050 (mean). Meanwhile, the GCM overall mean continues to show near ice-free conditions by 2100.

These projections are questionable for a number of reasons, not the least of which is the fact that they only take into account the very low resolution of sea ice extent and not the higher resolution figures of sea ice area or volume. Sea ice area, for example, fell to a stunning record low of 2.1 million square kilometers during 2012, a total loss of about 3.6 million square kilometers since 1979 and a loss of about 1 million square kilometers off the previous record low (area) set in 2011. Such a low figure could already, arguably, be called ‘nearly ice free when compared to average area lows of nearly 6 million square kilometers during summers four decades ago.

sea ice area

(Sea Ice Area Measures Provided by NSIDC via Cryosphere Today. Note the extreme record low set in 2012, a measure well below comparable sea ice extent figures which fail to account for holes in the ice. See also: Arctic Ice Graphs.)

It is this lack of GCM resolution, combined with an ongoing trend of stunning losses that has resulted in serious changes in predictions by even somewhat conservative scientists from the National Snow and Ice Data Center. Professor Mark Serreze of Colorado’s branch of NSIDC, who is skeptical that ice free conditions could be reached as early as 2016, notes:

“I am on record stating that we may lose the summer ice cover as early as 2030, and I stand behind that statement. This is in itself much earlier than projections from nearly all climate model simulations. I would agree with Dr. Maslowski that the IPCC models have shortcomings.”

The question, then, is will higher resolution climate models like Maslowski’s RASM provide a better understanding of what appear to be chaotic, powerful and rapid changes to the Arctic environment well ahead of the previously predicted time-frame?

Loss of Summer Sea Ice to Unleash Amplifying Feedbacks

Because it covers such a large stretch of ocean with a white, reflective surface, sea ice is a primary governor of Arctic and global weather. It keeps the Arctic cool by insulating millions of square kilometers of dark Arctic Ocean waters from the near constant radiation of the polar summer sun.

As the sea ice retreats, more of this dark water becomes exposed to the sun’s rays. Because the ocean surface is dark, it traps most of this light. The result is far greater warming of the Arctic during the summer time.

The loss of sea ice and related ocean warming has a number of knock-on effects. The first is that increasing ocean heat delivers far more energy to the sea bed. In the case of the East Siberian Arctic Shelf, the warming shallow sea is one filled with carbon deposits from a massive expanse of submerged tundra. An estimated 1500 gigatons of methane lay sequestered in thawing permafrost beneath this rapidly warming sea. According to Wadhams, loss of sea ice can add up to 7 degrees Celsius of additional warming to this vulnerable sea bed.

Current estimates provided by Dr. Natalia Shakhova show that around 17 megatons of methane are being released from the ESAS each year. This emission is more than twice that of the entire global ocean system and accounts for about 2.8 percent of the current global methane emission. Given the massive volume of methane stored in the ESAS and the rapid pace of sea ice loss and related ocean warming, this region of the world is more than capable of providing significant additional volumes of this potent greenhouse gas.

ESAS methane froth and sea ice

(A frothy mixture of methane and sea ice near the East Siberian Arctic Shelf. Image source: Igor Semiletov, The University of Alaska)

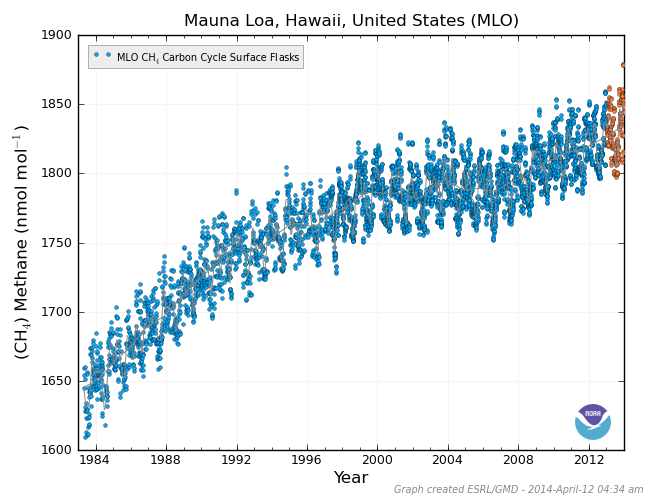
Meanwhile, ship based observations show that methane levels at the surface of ESAS waters are a stunning 3800 ppb, about twice the global average:

“Ship-based observations show that methane concentrations in the air above the East Siberian Sea Shelf are nearly twice as high as the global average… Layers of sediment below the permafrost slowly emit methane gas, and this gas has been trapped for millennia beneath the permafrost. As sea levels rose at the end of the ice age, the shelf was once again covered by relatively warm ocean water, thawing the permafrost and releasing the trapped methane… In the short-term… methane has a global warming potential 86 times that of carbon dioxide. (NSIDC)”

More rapid Arctic Ocean warming during summer times also results in more rapid warming of nearby land masses. And recent years have seen a number of extraordinary Arctic heatwaves driving 80+ degree temperatures all the way to the shores of the Arctic Ocean. Rapid warming of this region also results in a rapid thaw of massive volumes of permafrost. The permafrost stores organic material that breaks down into both CO2 and methane, providing additional emissions that enhance an already very rapid human warming. Current emissions from the Arctic tundra system are estimated to be around 17 megatons of methane and hundreds of megatons of CO2. Like the emissions coming from the ESAS, these emissions provide a significant added contributor to the human GHG forcing and will likely continue to provide increasing emissions as the sea ice retreats further.

In addition to the combined amplifying feedback of loss of sea ice albedo and amplifying greenhouse gas emissions from the Arctic, sea ice erosion has now also been shown to have profound effects on the circumpolar Jet Stream. Research by Dr. Jennifer Francis, Dr. Quihang Tang, a number of other scientists, and confirming analysis by Dr. Jeff Masters, has noted a weakening in the Jet Stream caused by a lowering of the temperature differential between the lower latitudes and the poles. The Jet is driven by such high temperature extremes between north and south. But as the higher latitudes warm faster than the temperate zones this temperature differential drops and the Jet Stream weakens. The end result is higher amplitude Jet Stream waves that tend to get stuck, resulting in more persistent, extreme weather. Dr Quihang, in a recent paper, notes:

“As the high latitudes warm faster than the mid-latitudes because of amplifying effects of melting ice, the west-to-east jet-stream wind is weakened. Consequently, the atmospheric circulation change tends to favour more persistent weather systems and a higher likelihood of summer weather extremes.”

The end result of these alterations brought on by a very rapid loss of Arctic sea ice are chaotic changes to the Arctic Ocean and surrounding lands along with a severe disruption to Northern Hemisphere weather patterns. These changes also combine in a self-reinforcing pattern to further amplify the pace of human caused warming both in the Arctic and around the globe. And should the summer Arctic sea ice completely melt in the time-frame of now to 2019 as Maslowski, Wadhams and Duarte have projected as a ‘most rapid’ estimate, then the already stark changes we are seeing will become much more extreme and pronounced.

Links:

The Future of Sea Ice

US Navy Predicts Summer Ice Free Arctic by 2016 (Note, the Guardian article appears to be somewhat misinformed, conflating a 2012 paper by Maslowski with RASM model runs.)

NSIDC

Extreme Summer Weather Linked To Vanishing Cryosphere

Colorado Bob’s Climate Feed

Wipneus

Could Arctic Summers be Ice-Free Within Three Year’s Time?

When Will the Arctic Summer be Nearly Ice Free?

Arctic Sea Ice Graphs

Hat Tip to Aaron

(Updated December 17)

Playing Games With Global Fire — Putting Scientific Arguments over Arctic Methane Emissions into Context

A pool of hydrates destabilizes on the ocean floor.

A pool of hydrates destabilizes on the ocean floor.

UPDATED ON AUGUST 3 DUE TO NEW INFORMATION
This week, the scientific journal Nature issued a bombshell article in which Peter Wadhams and a number of Arctic specialists warned that very large methane pulses, on the order of 1-50 gigatons in a single year, are likely to begin to appear soon in the Arctic. Other specialists, including Gavin Schmidt, a climate scientist at NASA’s GISS division, have noted that such an event is very unlikely.

Schmidt, in his argument, points toward past periods — 8,000 and 125,000 years ago — when the summer Arctic was mostly ice free and notes that there is no geological evidence of rapid release during these times. Wadhams, on the other hand, points toward large methane plumes that are already rising from a region of the East Siberian Arctic Shelf — a region vulnerable to rapid warming. Joining the mix is a NASA scientist, Ed Dlugokencky, who claimed in a recent Live Science article, that there has been no detectable change in Arctic methane emissions over the past two decades.

Critics of Wadhams have also made an interesting claim that, for the methane to have a ‘significant impact’ most of it would need to release rapidly. David Archer, a climate scientist at the University of Chicago noted in the Live Science interview:

“It [methane] has to be released within a few years to have much impact on climate, but the mechanisms for release operate on time scales of centuries and longer.”

There’s no indication what Archer is referring to, the ESAS stores (composing about 500 gigatons) or the much larger Arctic tundra and hydrate stores, composing hundreds to thousands of gigatons or global methane stores which are about double that of the Arctic (I’ll respond to this more in my assessment below).

What these arguments present is a veritable scientific fur-ball. One that will be very difficult for the casual observer to unravel and one we had better damn well get right soon as the Arctic begins to enter a new ice-free state not seen in over 800,000 years.

My assessment

Bubbles of Methane Locked in Sea Ice

Bubbles of Methane Locked in Sea Ice. Image source: The Alaska Dispatch.

It’s basically accepted science that release from the vast Arctic methane stores will increase as the planet warms, and sea ice, ice sheets, and tundra continue to melt. The argument, right now, basically hinges over how fast this process will occur — years, decades, centuries or millennia. As to whether the amount of methane coming from the Arctic is increasing or not, I’d like to see the data Ed Dlugokencky is looking at. Because, to my knowledge there is no complete survey of annual Arctic methane emissions. If he would like to provide them, they would be very helpful. And if we don’t have means to provide such information, then I think it is urgent we develop it.

What is available, at least in open source data, shows that atmospheric methane levels in the Arctic are higher than the global average, which would indicate a local emission of large volume (melting tundra, peat bogs, ocean emissions, thawing ESAS stores, environmental fire releases etc). And numerous studies — CARVE, the ESAS study, and others — have found very large local emissions sources in the Arctic in the megaton range and at levels far higher than previously anticipated. Wadhams joins a group of experts who believe a more rapid emission is possible (on the order of 1-50 gigatons per year in the case of the ESAS). Schmidt seems to believe there is no possibility for a release on a scale of anything less than 1,000 years or more.

My own opinion is that there is no possible means by which the Arctic’s methane stores can remain locked in their various traps so long as human greenhouse gas emissions continue along a business as usual path. In my view, it is entirely likely, that along this path, nearly all these stores will have released within a 500-1000 year time-frame, with Arctic methane emissions beginning to steadily increase now. The human greenhouse gas forcing will be enough to render the Arctic Ocean ice free during summer within the next few decades at the longest. And, without a major interrupting melt pulse from Greenland, this ice free state will continue to advance until winters show no ice as well. The last time this happened was likely in the Pliocene, around 2.5 million years ago. But the Pliocene oceans were settling down into a glacial period and not emerging from one. Such a set of rather disturbing circumstances will almost certainly result in large methane releases from the Arctic that are significant and contribute markedly to warming — even if such events don’t happen as fast as Wadhams warns.

Yet the gap between the two estimates from professional scientists is wide and no-one (except, apparently, me) seems to be occupying any middle ground in this particular discussion. Schmidt uses past interglacials where sea ice mostly vanished during summer time as a flimsy reassurance. But Schmidt does not acknowledge that we are out of reckoning of these time periods due to the clear and obvious fact that the current CO2 levels of 400 ppm puts us in the context of the Pliocene, nearly 2.5 million years ago, when the Arctic Ocean likely saw no sea ice and, as mentioned above, the newly emerging Arctic Ocean is one charged with carbon stores. So the situation may well be worse than the Pliocene. Sadly, this imperfect corollary is a moving target because the human emission that is currently nearly 32 gigatons drives CO2 levels higher by 2-3 ppm each year. Such an emission is at least ten times faster than any comparable emission in geological history — even that seen from the massive Siberian flood basalts during the Permian. This rate of emission, unless rapidly halted, will hit the Earth System like a 10 kilometer boloid — only potentially locking in catastrophic conditions that last for tens of thousands of years, not decades.

Wadhams, in contrast to Schmidt uses the Shakhova study and his own observations to support a claim that rapid methane release on the order of 1-50 gigatons is likely over the next 30 years. It is worth noting that a study conducted by Carolyn Ruppel refuted Shakhova’s findings for rapid methane hydrate release. This refutation may or may not stand as disproof. It’s too early in the scientific process, at this point, to be certain. So, though I agree with Schmidt and Archer that a slower release is more likely, I’m not assured enough by a single refutation to agree with them in their complete dismissal of Wadhams concerns.

The assertion that a slower rate of methane release would have little effect is also incorrect. Global methane stores are on the order of thousands of gigatons. And there are many ways by which such stores could hit the atmosphere — action by bacteria on thawing tundra, direct warming of anoxic carbon stores in shallow sea beds, heat forcing directly to hydrate locations, and potential for slope collapse and large release during destabilization. Some of these mechanisms remain unproven in the science. But all remain on the table. Should just 500 megatons of this vast store release each year (less than 1/10000th the total amount), global methane emissions will have doubled, putting at risk sinks and creating a very strong additional forcing to add to CO2 emissions. Global methane levels are increasing at a rate of around 4 ppb each year, some of this increase comes from the approximately 350-400 megaton human release, the rest comes from an Earth Systems release totaling around 130 megatons of which the Arctic is a portion. Yet the sinks are limited and there is good reason to believe that they will be saturated soon if current methane emissions double or more.

As I’ve noted before, I think that methane release is a part of a total Earth Systems response to a given forcing, in this case, human warming. And that total, given our best views of paleoclimate, is somewhere between 4-7 degrees Celsius of warming for each doubling of CO2 once all the ‘slow feedbacks’ come in. A 50 gigaton release in a single year would be far outside this usual range — a truly catastrophic event. So, in this case, Schmidt is probably right. But, as during the Permian, we sit at the end of a rather long glacial period in which global carbon stocks represent a very large charge and, potential, though unproven, larger than expected climate response. This is a disturbing circumstance and, in addition to the still accepted in broader scientific literature, Shakhova study, provides a strong reason to not entirely dismiss Wadhams concerns. In addition to these risks and considerations, lower levels of still significant methane release are likely still a significant and non-dismissible part of the total Earth System response. Responses we may start to see now and of which we have point source, though not broader, evidence for at this time.

The controversy, therefore, is in no small part caused by a lack of clarity and context. It is also due to the transient and amplifying nature of our current climate crisis. This is not an attack on the science, but a direct call for more effort, study, and proofs — from both sides of the argument. We need more context, not broad claims and flat dismissals. Such effort, I believe, would make the science stronger and provide a better tool for human resilience. So this is also an appeal for more direct support from policy makers — for all those who investigate Earth Systems responses to climate change.

To this point, I’d like to add Charles Miller’s own statement regarding the NASA CARVE mission with which he is involved:

“Permafrost soils are warming even faster than Arctic air temperatures — as much as 2.7 to 4.5 degrees Fahrenheit (1.5 to 2.5 degrees Celsius) in just the past 30 years. As heat from Earth’s surface penetrates into permafrost, it threatens to mobilize these organic carbon reservoirs and release them into the atmosphere as carbon dioxide and methane, upsetting the Arctic’s carbon balance and greatly exacerbating global warming.”

To this last point made by a scientist outside of the current controversy, I continue to believe that a rapid reduction in greenhouse gas emissions is a necessary and urgent response. To Schmidt and others who would cite past interglacials, I would add that unless human carbon emissions stop soon, the only set of geological events that will be worth looking at for long-term corollaries are the PETM and the P-T, especially after the ice goes. And it will surely go unless said soon human emissions halting actually happens.

James Hansen and the Three Categories of the Runaway Greenhouse: Earth Uninhabitable for Humans at ~5,000 Gigatons Fossil Fuel Burned

Runaway Global Warming

The Arctic’s Contribution to Runaway Global Warming (hypothetical worst-case runaway) . The above image provides a potential worst-case scenario for amplifying Arctic methane feedbacks to human-caused climate change. James Hansen’s research shows that a mini-runaway, pushing global temperatures to 10-12 degrees C above the Holocene, is all but certain under continuous, business as usual, fossil fuel burning through 2100. It is important to note that the current non CO2 forcing is equal to about 1/3 of the total CO2 forcing and that atmospheric methane releases are at 1/20th the level we would see during a runaway of the kind depicted in this image.

( Image source: Arctic News)

Forget for a moment that we can still emit about 530 gigatons of CO2 and still keep human warming in the ‘safe range’ of less than 2 degrees (Celsius) temperature increases this century. Forget for a moment how important to the sustenance of human civilization and the prevention of ever-worsening conditions this strict limit on carbon emissions is. Now think for a moment what will happen if Republicans in Congress and fellow conservatives aligned with fossil fuel companies across the country and around the world get their way.

In the past month, Republicans in the House of Representatives have pushed to increase US coal burning, approve the Tar Sands Keyston XL Pipeline, remove energy efficiency standards, and to slash US government (ARPA -E) R&D funding for new renewable energy technology by 80 percent. Fully 55% of all Republicans in the US Congress deny that human caused warming even exists. And the rest clearly are deluded enough to believe that it represents the climate version of a mild summer storm. Their legislative action over the past month, the past year, and for many years following that has been to enforce US dependence on oil, gas, and coal and to delay, diffuse and deny US access to new energy sources that may effectively serve as their replacements. And the millions of dollars in oil, gas and coal company largess they enjoy in the form of contributions is just the final proof that these members aren’t working for the best interests of the American people. They’re working for the international corporate state called Big Oil (BO).

So let’s consider for a moment what would happen if these BO lackeys in Congress were successful in their efforts to kill off alternative energy, to remove efficiency standards, and to shackle the US Energy future to Tar Sands, Coal, and Fracked Shale Oil and Gas.

What would happen?

It’s difficult to argue, given the current extreme and worsening state of the world’s climate, that blind Republican attempts to enforce dependence on BO would result in much in the way of US prosperity. It, essentially, would turn the entire North American Continent into a giant petro-state. It is possible that, for some years, the US will make some energy independence gains, possibly removing a larger fraction of imports from most states except Canada. But the loss of efficiency standards would do ongoing damage by increasing consumption of high-cost unconventional fuels, which would put a drag on the economy. The even greater drag would come from shackling US and North American economies to ever greater degrees to fuel sources, at best, that create a 6 to 1 energy return, where wind and solar could have supplied between 10 and 20 to 1 at ever-lower costs.

Worse still, is the fact that US and Canadian carbon emissions would go through the roof. Tar Sands, Coal, and Tight Shale Fracking are three horsemen of the apocalypse when it comes to climate change change (the fourth being fossil fuel company greed). Coal has always been the worst emitter. But both Tar Sands and Tight Shale Fracking are not far behind. The Republicans would have us depend on these, arguably vast, unconventional sources to the exclusion of all others. They wouldn’t care one whit about capturing the carbon (costs too much and reduces the energy return on already low energy fuels). And, adding yet one more insult, they allow BO to export the fracking and tar sands technologies to other countries consigning them and the world to similar fates.

Total carbon emissions in 2012 (including non CO2 sources) was 45 gigatons. But on the path Republicans set, this level of emission will look minor. Peak emissions would probably pair with peak human civilization at some time around 2050 near 80-90 gigatons per year. At this point, emissions are put in check by mother nature’s outrage at our insults. By 2050, the ‘burn everything’ strategy put in place by Republicans and enforced by conservatives around the world has resulted in near 600 ppm atmospheric CO2. Life in the oceans is in terminal collapse, major cities and island nations are being devoured by a combination of powerful storms and rising seas. The coastlines, for so long productive, have become unstable. And large regions of once fertile land are now being devoured by deserts. Water stress has caused entire countries to collapse. Mass migrations from both the coastlines and from desertified regions has already set in. Human population peaks at about this time near 10 billion.

But over the next 50 years humans maintain enough vestige of prior fossil-fuel based civilization to keep burning. They expend massive efforts to encircle coastal cities with walls. They try to farm indoors more and more. Miami is placed on giant oil platforms (we have more than enough in surplus) whose bases are driven into the limestone beneath the city. The New Orleans’ tidal wall is heightened to 30 feet. New York and the all important Wall Street is surrounded by increasingly high flood barricades. But the massive storms of this age are freakish, wrecking entire regions and knocking out power for weeks to months. Storms and heatwaves kill millions each year and millions more are rendered homeless. Entire countries collapse for want of food or under a tide of refugees they cannot support.

By 2100, CO2 is at 1000 ppm and global temperatures are 7 degrees (Celsius) hotter. Fossil fuel based industry has emitted about 5,000 gigatons of carbon, enough to set off the stages for a mini runaway global warming scenario (Category 1). Sea levels have risen 12 feet and Earth’s population has been reduced to 6 billion. 40% of ocean species are extinct and 10% of land species have suffered the same fate. Summer time results in the emergence of large heat death zones experiencing wet bulb temperatures in excess of 35 degrees Celsius (hot enough to kill most large mammals, including humans, through heat stress alone). Even if all emissions ceased, global temperatures would still rise to around 12-14 degrees Celsius hotter than the Holocene. There is almost no chance, in this case, for human civilization to survive such an insult for more than another 50-100 years. And the chances for humans, long term, are dire indeed.

But the world’s fossil fuel companies are still around, still clawing coal, fracked oil and gas, tar sands, oil shale, and methane hydrates  from the Earth with whatever new high tech process they’ve invented. These manage to survive for another 50 years or so selling off enough dirty fuels to set world CO2 levels to 1500 ppm. And that’s when game over really sets in for just about everything that can’t run to a high mountain range.

Fossil fuel based industry had managed to survive just long enough to emit more than 8,000 gigatons of carbon into the atmosphere. Just long enough to kill off the rest of us and themselves too.

Three Categories of Runaway Warming

The above scenario isn’t science fiction. According to some hard science done by the world’s top climate scientists, it is entirely likely if Republican burn, baby burn policy and the fossil fuel companies that push it survive in their current forms for much longer.

Hansen’s new paper is a more in depth study of Earth Systems Climate Sensitivity to a given level of CO2 forcing. The study looks, with greater detail, into both how much Earth will warm, long term, given a certain level of CO2 emission and how much of this emission is required to set off one of three categories of a runaway greenhouse.

In a less than ideal scenario, Hansen investigates what will happen if we burn all or nearly all the fossil fuels currently included in the unconventional reserves. All, or nearly all, according to Hansen represents between 5,000 to 10,000 gigatons of carbon equivalent fuels. Chillingly, if we tap the most extreme sources, such as methane hydrates, that number could rocket to 20,000 gigatons or more. So even Hansen’s study isn’t an extreme worst case.

Category 1: The Mini-Runaway

The Hansen paper finds that burning between 3,500 and 6,500 gigatons of carbon based fuels is enough to raise world CO2 levels to between 800 and 1200 parts per million. This level of CO2 would set up climate conditions similar to those experienced during the Paleocene-Eocene Thermal Maximum (PETM) in which temperatures were between 10 and 12 degrees Celsius hotter (average) than today.

Hansen finds that this level renders much of the Earth mostly uninhabitable for humans. Hansen notes:

Earth was 10-12 °C warmer than today in the early Eocene and at the peak of the PETM (Fig. 4). How did mammals survive that warmth? Some mammals have higher internal temperatures than humans and there is evidence of evolution of surface-area-to-mass ratio to aid heat dissipation, e.g., transient dwarfing of mammals (Alroy et al., 2000) and even soil fauna (Smith et al., 2004)during the PETM warming. However, human-made warming will occur in a few centuries, as opposed to several millennia in the PETM, thus providing little opportunity for evolutionary dwarfism to alleviate impacts of global warming. We conclude that the large climate change from burning all fossil fuels would threaten the biological health and survival of humanity, making policies that rely substantially on adaptation inadequate.

It is also worth noting that much of the world’s land masses would experience average summer temperatures above the mammal-killing level of 35 degrees Celsius (wet bulb) in a PETM-like world. The added heat of this regime would swiftly soften and obliterate any ice on the planet. But given the killing heat and a hydrological cycle driving droughts and rainfall events that are 80% more extreme, a rapid sea level rise of 200+ feet would likely come as a harsh afterthought. (To this point, it is worth mentioning that most planetary ice disappears when CO2 levels hit and maintain between 500 and 620 parts per million over a number of centuries).

Nearly all climate scientists agree that a return to PETM conditions and CO2 levels, especially on so short a time-scale would be a mass extinction event on the land and in the ocean. Which is why policies that extend the burning of fossil fuels combine the travesties of ecocide, genocide, and suicide in equal measures and to ever greater degrees as time moves forward.

Category 2: The Moist Stratosphere Runaway

If the fossil fuel companies manage to stick around long enough, they may be able to burn through between 8,000 and 15,000 gigatons of additional carbon-based fuels. Such an event would almost certainly spell the end for human beings and probably most of the complex life on Earth as well.

In such a situation, average global temperatures rise by between 15 and 20 degrees Celsius. A 15 degree Celsius temperature rise increases temperatures over land by around 20 degrees C. This puts Earth’s average land temperatures at around 35 degrees Celsius with average daily (wet bulb) highs in the range that is hot enough to kill humans. The entire Earth, in this case, is an enormous human killing field.

The only regions able to even marginally support human life or agriculture would be the high mountains. But even these regions would be under threat. Global heating of around 15 degrees Celsius or greater would pump ever greater levels of moisture into the stratosphere. The added H20 would substantially degrade stratospheric ozone. The added UV radiation would severely hamper both plant and animal life in the remaining habitable regions. Human food crops are highly sensitive to excess UV radiation. So it is seriously doubtful if humans could continue cultivation even on the Himalayan Plateau during a Category 2 Runaway.

Category 3: Evaporated Oceans, Baked Crusts

Thankfully, even the fossil fuel companies aren’t likely to bring about even the worst of the climate change nightmares — Earth transitioning to a state more like Venus. In order to do that, global heating would have to evaporate all of Earth’s oceans and then bake the remaining carbon out of the Earth’s crust. According to new models constructed by Hansen, such conditions would take between 100 million and one billion years to develop. Hansen’s models also show that climate sensitivity is not enough, at the higher CO2 levels, to finally set off the kind of runaway that would force such catastrophic events to occur.

That said, the first two categories of global warming runaway are well within the reach of current fossil fuel reserves. And the fact that all fossil fuel companies are doing everything they can to burn all the reserves on their books and to find ever greater quantities of these fuels is not at all comforting, especially when they have a number of hired trolls in Congress and elsewhere (Republicans) to do their dirty work for them…

Links:

New Hansen Paper on Climate Sensitivity, CO2 and Sea Level Rise

The Methane Bomb, Clathrates, and Arctic Tundra. Life in a World at 1830 Parts Per Billion and Rising.

As the world hit a new and ominous CO2 record of 400 parts per million and rising, just one milestone on the road toward ever greater harm from damage via human-caused greenhouse gas emissions, another record was quietly reached. At the Mauna Loa Observatory, world-wide methane levels hit a new record average of 1830 parts per billion in April of 2013 even as they continued to ramp higher.

Methane 2003-2013

(Image source: NOAA ESRL)

The new record follows a short-term rise in atmospheric methane that began in 2007 and has continued to this day. It also caps a long-term rise in methane that began at the start of the industrial revolution and, through a long ramp-up, has resulted in atmospheric methane levels rising from about 750 parts per billion to the record high level of 1830 parts per billion today.

You can view this long-term rise in atmospheric methane in the second chart, provided by NASA, below. Note that atmospheric levels given are only updated through 2008, just at the start of the most recent jump in atmospheric methane concentrations:

greenhouse_gases_1750-2008

(Image source: NASA)

This ramping up of atmospheric methane that began in 1750 and has continued to this day has, so far, been mostly caused by humans. Primary sources for human methane emissions include landfills, coal mining, leaks from oil and gas infrastructure, and the digestive generation of methane in the guts of livestock animals such as cattle. An explosion in the volume of methane coming from these sources pushed world methane levels about 1080 parts per billion higher over the last 250 years.

This increase has had a powerful impact on global warming caused by humans. It is estimated that, at current concentrations, methane’s contribution to global warming is about 28% that of CO2. The reason for this, even though atmospheric levels for methane are more than 200 times lower than CO2, is that methane is at least 25 times as potent a heat absorber by volume (and as much as 105 times during the short term). What this means is that atmospheric methane increases are a huge contributor to climate change.

Now, I want to stop here before going any further. And the reason is that some oil industry cheer leaders have made the false argument that reducing human methane emissions is more important to mitigating the impact of climate change than reducing CO2 levels. The short answer to this false claim is that they’re both important and there’s no way to address human climate change without reducing both CO2 and methane emissions. And, since there’s at least 500 parts per million worth of CO2 in the remaining fossil fuel reserves, for us to maintain much hope of a livable future climate will necessitate that most of these fuels remain unburned or that the carbon from these fuels is captured and permanently sequestered.

Human-caused warming results in increasing methane release from Earth’s environment

Unfortunately, humans are no longer the only contributor to rising levels of atmospheric methane. New research being conducted by NSIDC, NASA, and a number of scientists around the world show that organic material stored in the world’s permafrost and methane clathrates at the bottom of the ocean are showing signs of stirring.

Permafrost is a region of frozen soil that dominates large sections of the Northern Hemisphere and the entire continent of Antarctica. This image, provided as part of NASA’s CARVE research project, shows the Northern Hemisphere’s permafrost zones.

Northern Hemisphere Permafrost NASA CARVE

(Image source: NASA)

As humans have driven the climate to warm, larger and larger sections of the northern permafrost have been subject to thaw. As the permafrost thaws, it opens organic material, sequestered for tens of thousands of years, to decay. If the region where the permafrost melts is predominantly wet, the organic material breaks down into methane. If the region is primarily dry, carbon dioxide is produced.

The volume of organic material locked in permafrost is massive. In fact, NSIDC shows that there are about 1,400 gigatons of carbon locked up in the world’s permafrost. This is nearly twice the volume of all the carbon currently contained in the atmosphere. For even a small fraction of this carbon to be released via human warming would have dramatic consequences. And, since many regions in the Arctic are predominantly wet, a large portion of any future release is likely to be methane.

Already, research is beginning to indicate that carbon stores in the Arctic are being set free by human-caused warming. In NASA’s most recent press release describing its CARVE research mission, entitled “Is a Sleeping Giant Stirring in the Arctic,” NASA scientists were said to have found large methane emission sources comparable to major cities.

“Some of the methane and carbon dioxide concentrations we’ve measured have been large, and we’re seeing very different patterns from what models suggest,” Charles Miller, of NASA’s Jet Propulsion Laboratory, said. “We saw large, regional-scale episodic bursts of higher-than-normal carbon dioxide and methane in interior Alaska and across the North Slope during the spring thaw, and they lasted until after the fall refreeze. To cite another example, in July 2012 we saw methane levels over swamps in the Innoko Wilderness that were 650 parts per billion higher than normal background levels. That’s similar to what you might find in a large city.”

If methane emissions from the Arctic permafrost via human-caused warming are beginning to rival those of major human sources, then we could be in for some rather serious trouble. CARVE’s mission is to find out if such a threat is emerging. Early observations are, as one NASA researcher put it, “both amazing and potentially troubling.”

The Clathrate Gun

Potentially even more troubling is the possibility that seabed methane stores locked in ice, known as clathrates, may also be starting to destabilize.

Worldwide, there is estimated to be between 1,600 and 2,000 gigatons of carbon locked in clathrates (or methane hydrates) on the bottom of the ocean. This is a massive store of carbon is at least two times the amount currently in the atmosphere. As with permafrost, if even a small amount of this methane reached the atmosphere, it would have powerful global warming impacts.

The problem is that human warming, via CO2 and other greenhouse gas emissions, is currently causing the world’s oceans to heat up. In fact, the oceans are accumulating heat faster than expected. You can see the pace of this increasing heat content in the graph below:

Trenberthstudy

(Image source: Trenberth study)

And since clathrates are ice structures that are only stable in a narrow range of temperatures, any warming of the oceans, especially the deep oceans where clathrates are primarily stored, results in risk that the clathrates will melt, releasing their methane.

Unfortunately, we have emerging evidence showing that sea-bed clathrates are starting to destabilize. One set of evidence, produced by Shakhova, began to emerge in 2007. Shakhova’s study: Methane Release and Coastal Environment in The East Siberian Arctic Shelf illustrated how sea-bed methane in the region of the East Siberian Sea was venting into the ocean and even up through the thawing permafrost. A later survey of sea-bed methane releases, also conducted by Shakhova, found stunning one kilometer wide plumes of methane bubbling up from the ocean in the region of the East Siberian Arctic Shelf. In thhe report, published in The Independent, Igor Semiletov, Shakhova’s co-author, noted:

Earlier we found torch-like structures like this but they were only tens of metres in diameter. This is the first time that we’ve found continuous, powerful and impressive seeping structures more than 1,000 metres in diameter. It’s amazing,” Dr Semiletov said.

“I was most impressed by the sheer scale and the high density of the plumes.  Over a relatively small area we found more than 100, but over a wider area there should be thousands of them,” he said.

Another study, this one conducted off the US East Coast, found that methane depositions on the Continental Shelf were also starting to destabilize. The study, published in Nature, showed that changes in the Gulf Stream and an unusual level of warming off the eastern seaboard of the United States was destabilizing a 10,000 square kilometer region rich in sea-bed methane. The study warned:

A changing Gulf Stream has the potential to thaw and convert hundreds of gigatonnes of frozen methane hydrate trapped below the sea floor into methane gas, increasing the risk of slope failure and methane release…

Evidence of Growing Trouble

Though not yet conclusive, the current permafrost studies by NASA and others combine with growing scientific evidence of sea-bed methane destabilization to provide a rather stark warning. Human warming via greenhouse gas emissions is beginning to push Earth to release some of her carbon stocks. These stocks, contained in tundra and sea-bed methane, are now showing signs of disturbance and are visibly starting to contribute to atmospheric carbon. It is worth noting that tipping points may be fast approaching and could run away from us rather rapidly.

As such, all efforts should be made to reduce worldwide human CO2 and methane emissions as rapidly as possible. Over the past 250 years, humans have contributed a large and growing forcing to the world’s climate. Now, emissions have grown to vast and dangerous levels even as Earth’s systems are reaching their carbon storage limits. Major feedbacks and threatening changes are likely in store if we don’t dramatically draw down emissions soon.

Evidence of methane coming from the Earth system should, therefore, serve as a warning, one we would well be wise to heed.

Links:

Recent Changes to the Gulf Stream Causing Widespread Gas Hydrate Destabilization

NOAA ESRL

NASA

Distinctive Climate Signals in Reanalysis of Global Ocean Heat Content

Vast Methane Plumes Seen In Arctic Ocean as Sea Ice Retreats

Human CO2 Emissions Continue to Play Russian Roulette With Clathrate Gun

Global Heating Accelerates, Deep Ocean Warming Fastest; What Does it Mean For Methane Hydrates?

A new study published in Geophysical Research Letters, found that ocean heat content rose at its fastest rate ever recorded over the past 15 years. The study, written by Magdalena A. Balmaseda, Kevin E. Trenberth, and Erland Kallen, found that the deep ocean below 700 meters accounted for 30% of all global heat content increase over the past decade.

What this means is that total warming of the atmosphere-ocean system didn’t slow down as some global warming denier sources claim. Instead, total Earth warming accelerated.

According to the paper, the most recent period since 1999 was:

the most sustained warming trend in this record of OHC. Indeed, recent warming rates of the waters below 700m appear to be unprecedented. In the last decade, about 30% of the warming has occurred below 700 m, contributing significantly to an acceleration of the warming trend.

Over the past decade, La Nina events have predominated. And this, according to study authors, resulted in a large portion of global warming being retained in the oceans. The reason is that El Nino is a powerful mechanism of ocean heat transfer to the atmosphere. But over the past decade, El Nino events have been rare, keeping more human caused heating in the world’s oceans. Not only did upper levels of the ocean heat up, a massive amount of global warming telegraphed into the deepest regions of world ocean systems.

According to Keven Trenberth, one of the study’s authors and a leading climate scientist, “It means less short term warming at the surface but at the expense of a greater earlier long-term warming, and faster sea level rise.”

The reason is that rapidly warming oceans pump more water vapor into the atmosphere. Water vapor is a powerful greenhouse gas and a major amplifying feedback to human caused warming. In addition, rapidly warming waters leads to greater thermal expansion of the world’s oceans, accelerating sea level rise.

Bad News For Methane Hydrates

More rapid ocean heating also has another impact not directly mentioned in the new study. What it does is put more of the world’s deposits of methane hydrates at risk of destabilization.

Methane hydrate is a volatile mixture of methane and frozen water that can be found on seabeds around the world. It is estimated that as much as 10,000 gigatons of carbon lay locked in methane hydrate deposits around the globe. Methane is a powerful greenhouse gas. Over a century, it is 20 times more powerful by volume than CO2. Over ten years, it is 100 times more potent. Methane is also problematic because after it amplifies warming as methane, it then breaks down into CO2, adding to already high volumes of that gas. Were even a small fraction of this carbon to bubble up from the ocean bottom and reach the atmosphere, it would result in a powerful amplifying feedback to human caused climate change.

Over the past decade, instances of methane hydrate destabilization have been found in the Arctic, off the east coast of the United States, and in other regions around the globe. Many of these events appeared to be new. Of these, methane plumes found in the East Siberian Arctic Shelf were the most disturbing. There, plumes of methane a kilometer across were discovered. Though submerged tundra was also a likely contributor to massive methane plumes discovered on the shelf, hydrates are also known to have formed there.

Now, with oceans heating at a greater rate than the atmosphere, risks for large methane hydrate releases are also increasing.

Most Missing Heat Found, Look to Ice Sheets for Remainder

This new research finds most of the missing heat scientists have been looking for around the globe. And that heat, as previously suspected, ended up in the world’s oceans and, to great extent, in the deep oceans. That said, a much smaller measure of heat is still unaccounted for. It might not be a bad idea to look in the world’s ice sheets — which appear to be decaying at a much faster rate than expected. One speculates that the hearts of the great glaciers are more watery than anticipated and contain much of the remaining heat from human caused global warming not currently located.

Links:

In Hot Water: Global Warming Has Accelerated Over Past 15 Years, New Study of Oceans Confirms

Winter 2013 Shows Increasing Arctic Methane Feedback to Human Caused Warming

Oceans Sponging Up Warmth

Arctic Methane Release Sea Ice Melt Shows Amplifying Feedbacks to Human Caused Climate Change


Winter 2013 Shows Increasing Arctic Methane Feedback to Human Caused Warming

Methane-Jan21-31

(Image source: AQUA Satellite, NASA. Image produced by Dr. Leonid Yurganov)

Steadily increasing Arctic methane emissions over the past decade are a dangerous amplifying feedback to human caused climate change.

This emission is a direct result of a rapid heating of the Arctic caused by human global warming via the ever-increasing volume of CO2 emitted and stored in the Earth’s atmosphere. Since the year 2000, world CO2 levels have risen from about 365 ppm to 396.8 ppm today. This rapid increase in CO2 is driving enhanced heating of the Arctic environment on the order of about one degree Celsius per decade.

The extra heat in the Arctic does work melting glaciers, reducing sea ice, and rapidly reducing spring time snow cover. The result is a warming of the Arctic tundra and sea bed. As these areas warm, methane stored in the frozen permafrost and in methane hydrates on the sea bed are released.

Amplifying Methane Release Adds to Already Difficult CO2 Problem

Since the year 2000, we have seen growing levels of methane release throughout the Arctic. This methane provides an extra push to global warming by adding more heat-trapping gasses on top of already high and rising values of CO2. Over the course of a century, methane provides 20 times the amount of heat trapping by volume compared to CO2. But short-term warming caused by methane is even greater, about 100 times that of CO2. So increasing levels of Arctic methane as a feedback to human-caused warming further amplifies the overall problem of climate change.

The above series of images provides Arctic methane levels from January 21-31 of 2009 through January 21-31 of 2013. As you can see, over this period Arctic methane levels ramped steadily higher, increasing by about 10-20 ppb on average each year. This steady increase provides a substantial additional forcing to an Arctic that is already much warmer than in previous decades.

Increasing Arctic methane levels combine with sea ice melt and early snow melt to create a powerful amplifying feedback over much of the Arctic. And carbon stores in the Arctic are massive. The US National Snow and Ice Data Center estimates that there are 1400 gigatons of carbon locked in Arctic permafrost alone. This volume compares to the 880 gigatons of carbon already put into the atmosphere via human greenhouse gas emissions. Arctic methane hydrates compose at least another 1000 gigatons of carbon. So for even a fraction of this carbon to be released would result in a substantial addition to human-caused warming.

Human Forcing Just Keeps Rising

All these hundreds and thousands of gigatons of methane would have remained locked in frozen storage without the ever-increasing amounts of CO2 we keep dumping into the atmosphere. From February of 2012 to 2013, global CO2 levels increased by 3.2 parts per million, far higher than even for the already high average of 2.2 parts per million each year over the past five years. At 396.8 parts per million, CO2 is now providing a large amount of heat forcing to the atmosphere. And it is this rising level of heat trapping gasses that has set the Arctic environment in motion.

These increased feedbacks through human forcing make the challenge of dealing with human-caused climate change all the more difficult and urgent. From this point forward, the more we push the climate, the more it is likely to respond by contributing its own stores of carbon from sinks that are now in the process of turning into sources. A rapid transition away from the use of fossil fuels is, therefore, necessary to ensure an already difficult problem does not grow worse.

Links:

Top Scientists Speak Out on Growing Risk of Methane Emergency

http://www.esrl.noaa.gov/gmd/ccgg/trends/

http://nsidc.org/cryosphere/frozenground/methane.html

https://robertscribbler.wordpress.com/2012/08/21/satellite-data-compiled-by-university-of-maryland-shows-amplifying-arctic-methane-release/