
Last year, we raised a warning that the 2014-2015 El Nino could develop into a monster event. And, unfortunately, there is some indication that conditions may well be continuing in that direction.
* * * *
All across the broad belt of the Equatorial Pacific, sea surface temperatures are running in the hot-to-extraordinarily hot range. Starting just north and east of New Guinea, 1 C + above average temperature anomalies run uninterrupted to a zone near the date line where they encounter a hot pool in the range of +2.6 to +3.1 C above average. Running eastward, these high heat anomalies gradually taper off to +1.4 to +1.7 C along a 5,000 mile stretch before they again spike to +3 to +4 C above average just off the west coast of South America.
A massive zone of above average sea surface temperatures encompassing almost the entire width of the Equatorial Pacific:
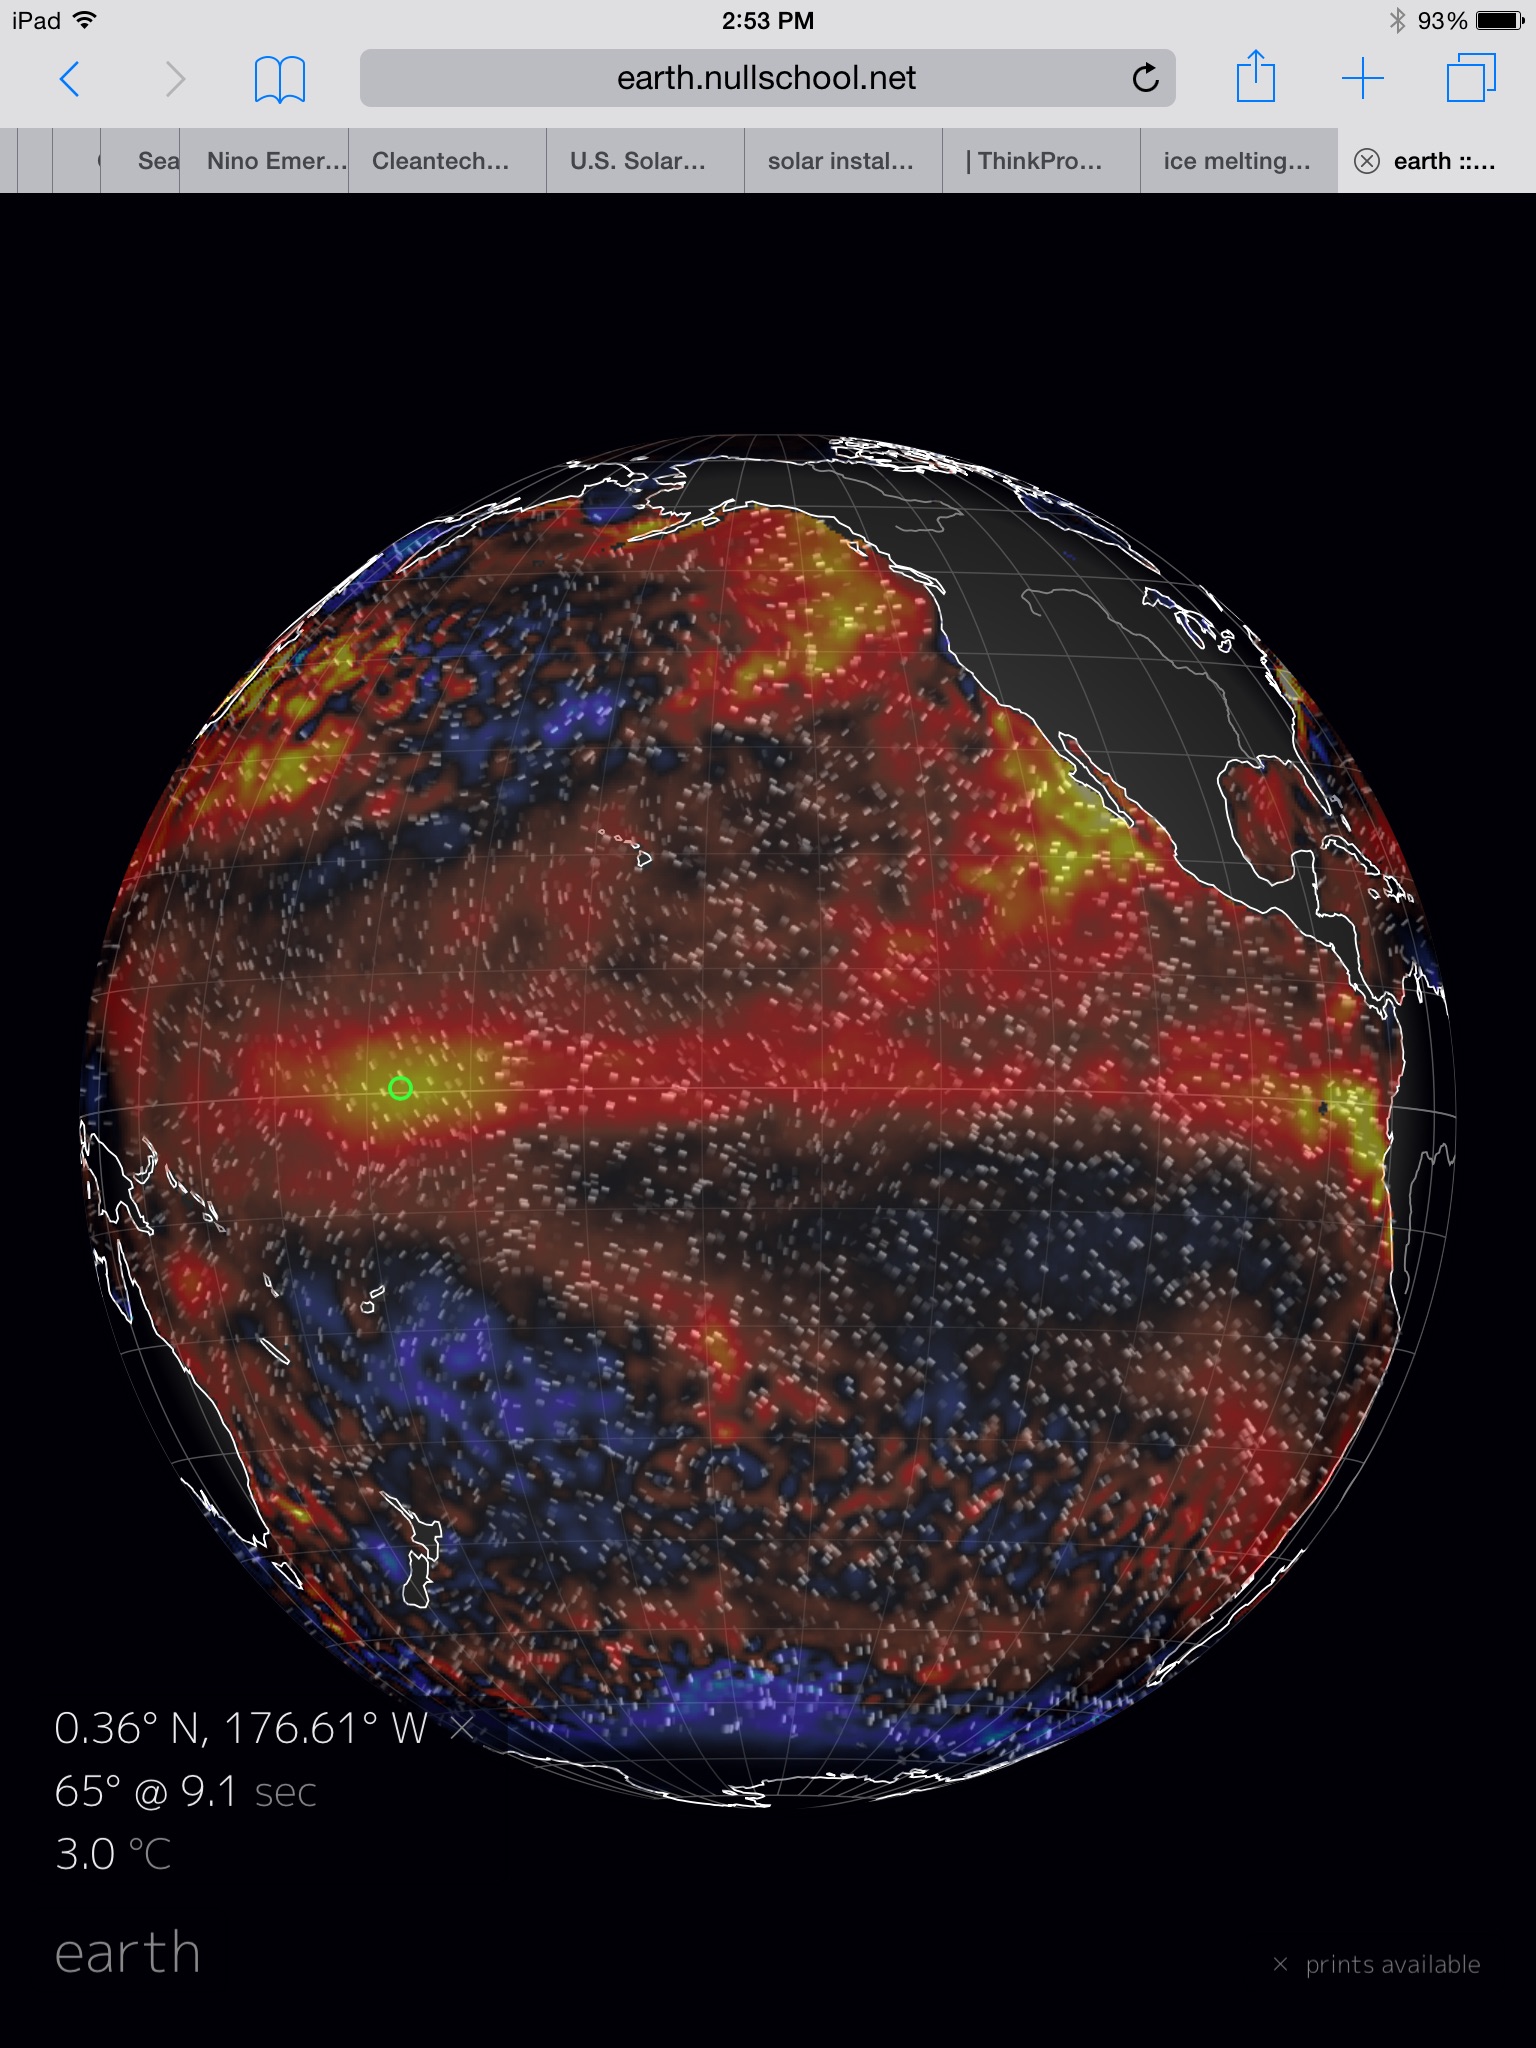
(Pacific Ocean showing extreme heat anomalies across most regions. Image source: Earth Nullschool.)
Hot equatorial waters in a Pacific Ocean that, from Arctic north to Austral south, from East Asian shores to the west coasts of the Americas is a morass of record high temperatures. An ocean zone featuring few and dwindling pools of lower than average readings. Oceans undergoing rising rates of heat-related sea creature die offs in waters that, when they warm, lose vital oxygen and host toxin-producing microbes that thrive in hot water.
It’s a freakishly hot Pacific. A strange ocean. One that we aren’t quite accustomed to. One in the grips of what is already a moderate strength El Nino. An El Nino that, combined with an extraordinary human greenhouse gas heat forcing, has pushed global surface temperatures into record high range for 2014 and the first three months of 2015 thus far. An El Nino which is now threatening a new leap to monster status.
For a powerful Kelvin Wave is presently lending heat to equatorial surface waters after receiving a boost from gale force westerly winds associated with the strongest Madden Julian Oscillation on record this past March. An raging equatorial heat engine that is now drawing yet more energy from a second set of strong westerlies developing this week.
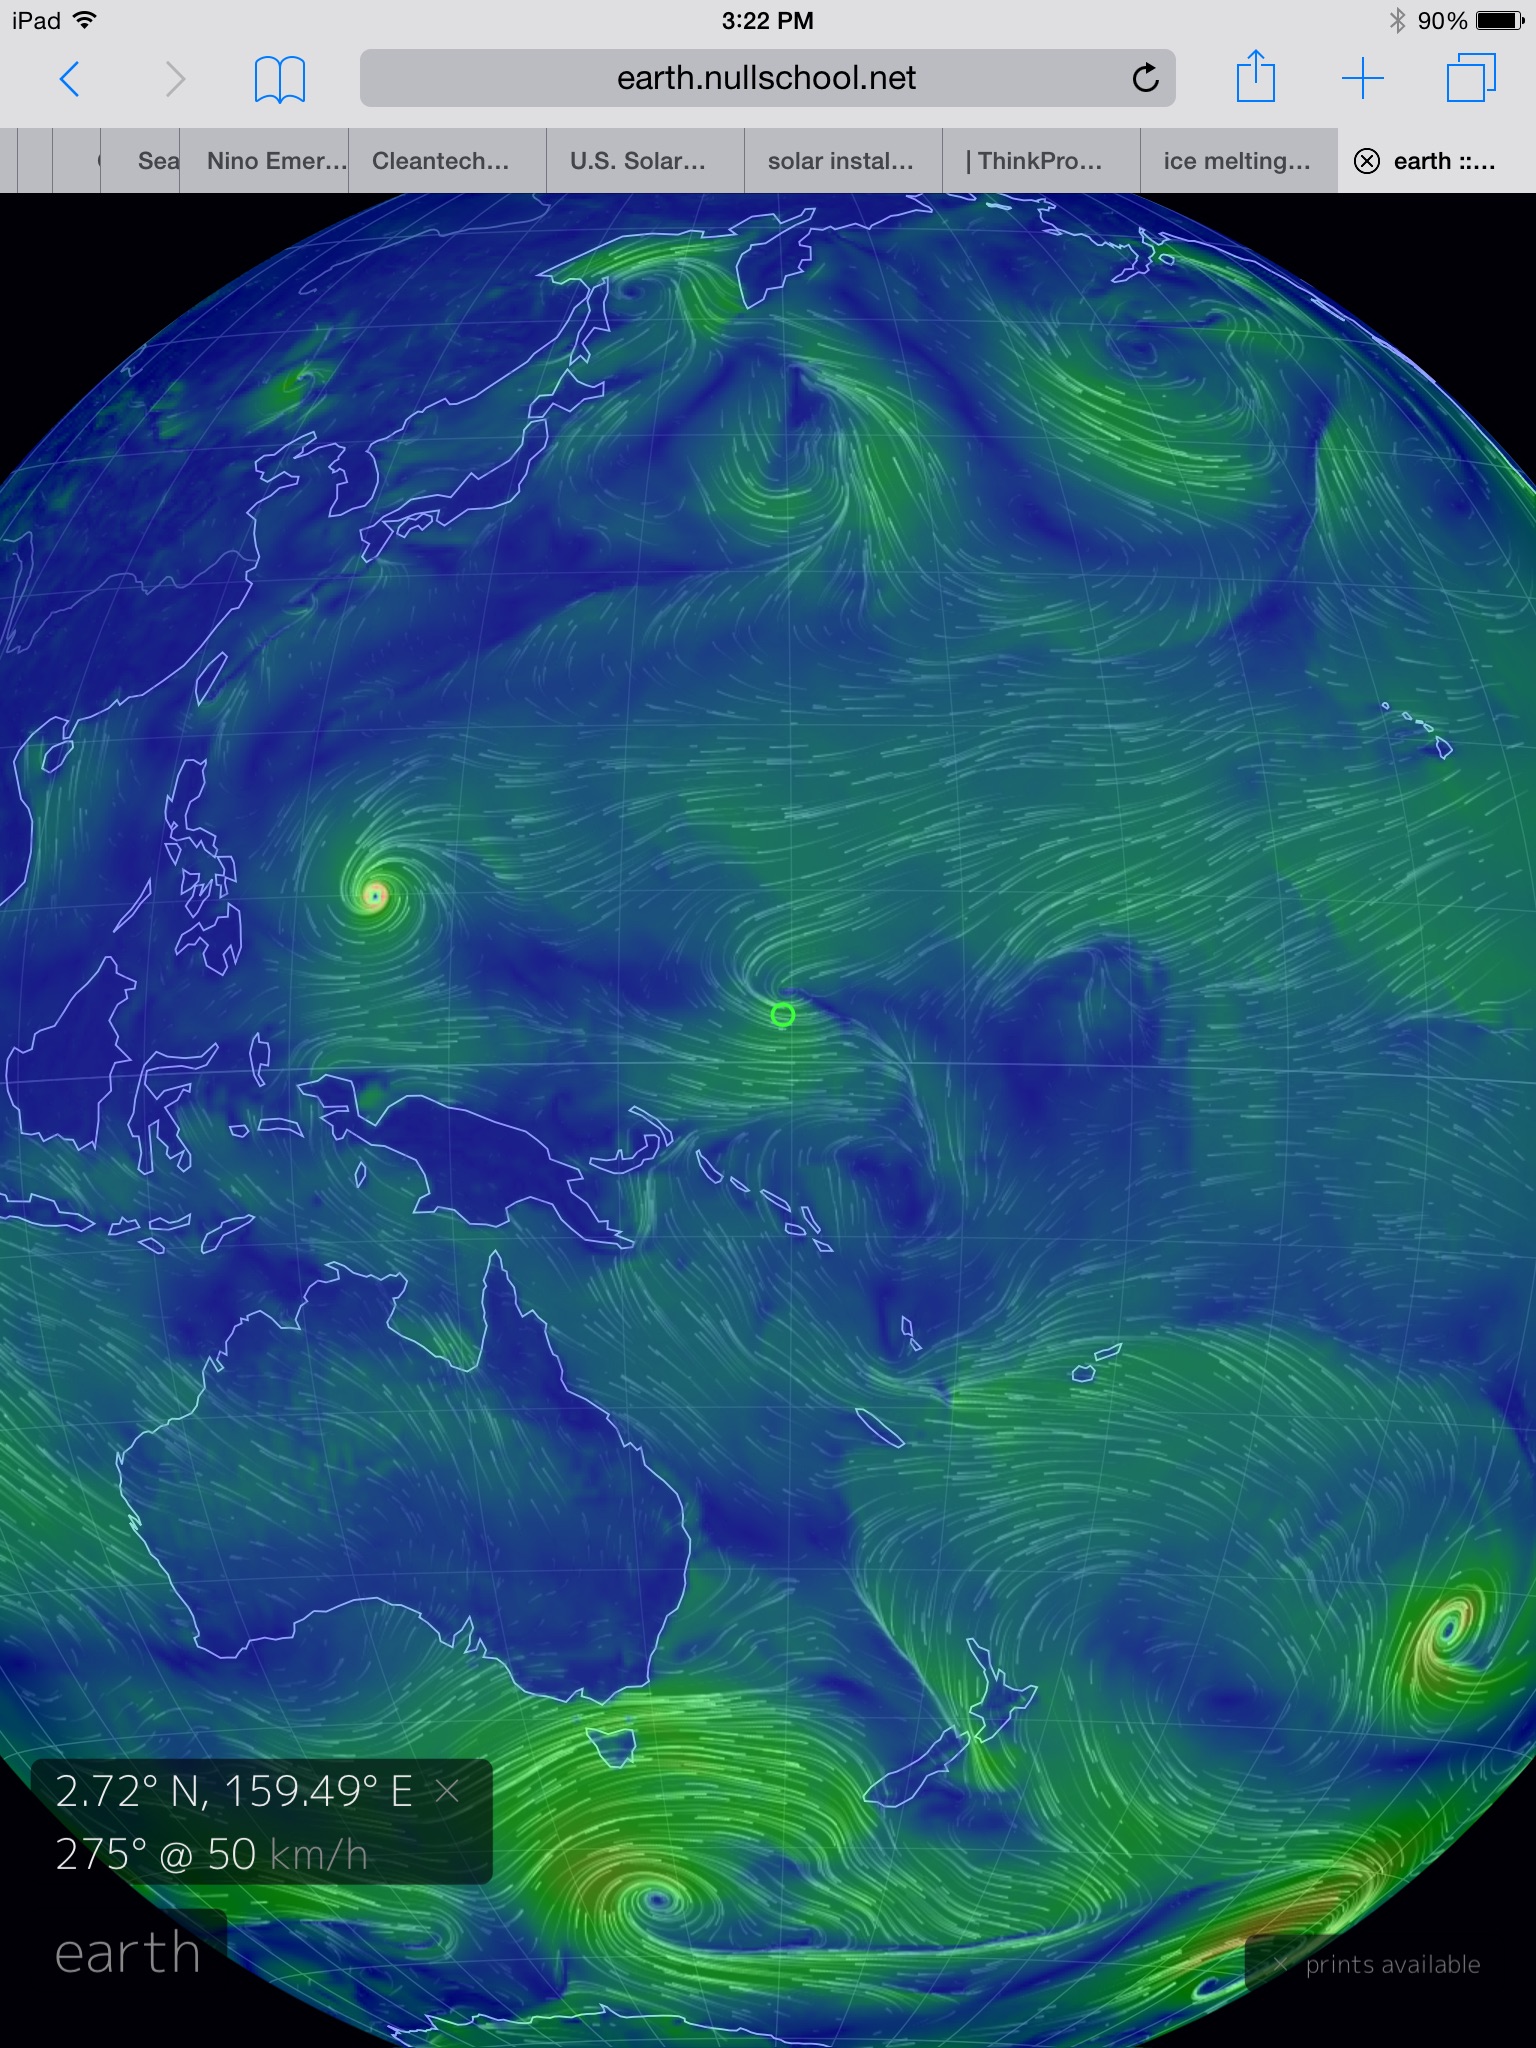
(Strong westerlies emerging in the Western Pacific on May 6 may provide yet another boost to the 2014-2015 El Nino. Image source: Earth Nullschool.)
In the above GFS summary, we find sustained winds in the range of 30 mph with gale force gusts in a region along and just north of the Equator near New Guinea. The winds are in association with a developing cyclone, one that models indicate will reach strong Typhoon status later this week. The westerlies stretch westward along the back of New Guinea and on toward the Philippines. There, they receive a boost from another cyclone — Tropical Storm Noul.
The result is a brisk set of westerlies running against the trades along hundreds of miles of open ocean. The kind of event with the potential to further strengthen an El Nino that is already at respectable intensity.
This week’s CFSv2 NOAA forecast models continued to indicate an extreme strength El Nino by later this year. Weighted models are now showing seasonal anomalies in the Nino 3.4 zone peaking out at +2.3 C. Weighted monthly models are showing peaks in the range of +2.5 C above average for Nino 3.4. And unweighted models are showing peak averages that now exceed +3.1 C. This is a jump from last week’s CFSv2 forecast. Another set in a continued trend for higher intensity.
(NOAA’s forecast models show potential for extreme El Nino starting in June and extending into January. Image source: NOAA.)
Should such an event emerge it would truly be a monster. Something far worse than even the Super El Nino of 1998.
An extraordinary El Nino of this kind would have far-reaching climate and weather related impacts. It would push global temperatures into ever more dangerous ranges. It would strain global carbon sinks. And it would worsen drought and/or set off heavy precipitation events in various, already vulnerable regions of the globe. With model forecasts continuing to hit higher values, with so much available heat to fuel El Nino ranging the Pacific, and with strong westerlies continuing to reinforce the current El Nino, this is a situation that bears very serious continued monitoring.
Links:
Monster El Nino Emerging From the Depths
NOAA’s Climate Prediction Center
March Shows Strongest Madden Julian Oscillation on Record
Starving Sea Lion Pups and Liquified Starfish


wili
/ May 6, 2015Thanks for staying on top of this. It is looking pretty freaky out there. Meanwhile, CA is facing probably its worse fire season in history. 25% reduction in water use was just ordered. People told to let their lawns (but not their trees) die. The last is generally a good idea for everyone, actually–lawns being such horrid water, energy, chemical and time sucks.
LikeLike
wili
/ May 6, 2015“California Approves Mandatory Water Cutbacks To Combat Drought”
http://www.huffingtonpost.com/2015/05/05/california-water-cutbacks_n_7218696.html?utm_hp_ref=green&ir=Green
LikeLike
wili
/ May 6, 2015“Drought forces California into first mandatory rules to save water”
http://www.theguardian.com/environment/2015/may/06/drought-forces-california-into-first-mandatory-rules-to-save-water
LikeLike
robertscribbler
/ May 6, 2015California agriculture is under serious threat this year. Looks like the US is going to need to reorganize how it manages farmland if it wants to keep a healthy volume of produce.
TDG posting articles showing the drought killed 12 million trees last year. Andy showing Lake Mead is heading toward rationing levels soon. And you citing the recent nasty fire season reports.
Very bad year for California. With that hot pool still in place it’s questionable what we’ll see come winter. I think a strong El Nino may over-ride it. If doesn’t, well, that ag industry doesn’t last too long if this keeps up.
LikeLike
Spike
/ May 6, 2015Reminds me of Steven Chu’s interview 6 years ago:
“I don’t think the American public has gripped in its gut what could happen,” Chu told the newspaper. “We’re looking at a scenario where there’s no more agriculture in California.”
LikeLike
robertscribbler
/ May 6, 2015Chu appears prophetic.
What just kills me is we still have this debate over whether the current drought was worsened by climate change. When practically every major climate model pointed toward SW drying, when scientists warned for years and decades that it could happen. Now, the predicted droughts have arrived and we have people saying — well, let’s be sure.
Pay attention folks. This is what climate change looks like in the SW and it just gets worse from here.
LikeLike
Andy in San Diego
/ May 6, 2015900,000 acres left fallow so far this year
LikeLike
robertscribbler
/ May 6, 2015Any new news on Lake Mead? Your earlier figures were amazingly stark.
LikeLike
wili
/ May 6, 2015For those who like to stay updated on all things El Nino, with graphs, analysis, discussion…by science nerds and concerned citizens, there are few better places than neven’s forum: http://forum.arctic-sea-ice.net/index.php/topic,1063.550.html
LikeLike
robertscribbler
/ May 6, 2015Fantastic forum there. Neven runs an excellent shop.
LikeLike
wili
/ May 7, 2015Now I feel a bit like a bee flitting from one forum to the other pollinating the best ideas from each into the other (but no GMO genes!). Here’s deepoctopus’s take on the situation after I linked to this site (my formatting).
“…the gathering WWB will very likely escalate us to a moderate El Niño, upping the odds for a positive feedback loop to set the stage for a strong event months from now.
If IOD goes into a warm event as well, drought in Asia and floods in Africa could be rather serious.
Peat fires in Indonesia would well escalate atmospheric carbon dioxide.
Coral bleaching and marine life in the eastern Pacific are at serious threat of major losses.
Perhaps it will also bust the drought along the North American Pacific coast as a silver lining.
The next 16 months or so should be the warmest period on record globally. Assuming a strong La Niña follows by tradition, hell, the next 2-3 years could be a doozy.”
LikeLike
PCCP82
/ May 6, 2015how extreme was the 98 el nino?
LikeLike
robertscribbler
/ May 6, 2015Peaked out at +2.2 C in Nino 3.4. It was the strongest El Nino in the modern record.
LikeLike
todaysguestis
/ May 6, 2015What climate baselines where used to calculate those anomalies for 1998 and now? How would it affect our exceptions of the severity of an El Ninio if they are different?
LikeLike
robertscribbler
/ May 6, 2015Good question TDG.
Based on NOAA’s own figures it appears the NINO baseline has shifted by about 0.4 C since record keeping began:
https://www.climate.gov/news-features/understanding-climate/watching-el-ni%C3%B1o-and-la-ni%C3%B1a-noaa-adapts-global-warming
LikeLike
sunkensheep
/ May 7, 2015Seems I should be more worried when I see a fair chunk of forecast models exceeding 2.0C then. The ’97-’98 event set off a decade long drought here.
LikeLike
Andy in San Diego
/ May 6, 2015I was living in Orange County at the time, it was unbelievable the amount of rain.
LikeLike
robertscribbler
/ May 7, 2015I can imagine. Those storms just racking up in train after train. Atmospheric moisture blowtorch.
LikeLike
Weir Bohnd
/ May 7, 2015Up in the Monterey Bay area at our house we took to calling it the second coming of the 40 days and 40 nights and then wondered where Noah stashed the plans.
LikeLike
humortra
/ May 6, 2015It feels like Groundhog Day after last year -https://robertscribbler.wordpress.com/2014/03/25/monster-el-nino-emerging-from-the-depths-nose-of-massive-kelvin-wave-breaks-surface-in-eastern-pacific/
Please educate me Robert – is this the same process developing, or is there a seasonal rhythm? Was that the same Niño underperforming in 2014 and now gathering strength, or is 2015’s Niño a new event?
LikeLike
robertscribbler
/ May 6, 20152014-2015 El Nino is a single event which I’ve been tracking since last year. It just appears to be taking its sweet time to develop.
A high volume of atmosphere to ocean heat transfer, a very hot pool of water at depth in the Western Pacific, and a strong switch to positive PDO all seemed to indicate the potential for a very strong event. The initial Powerful EKW set up conditions that seemed to be favorable for a strong to very strong El Nino in 2014. But the ocean-atmosphere was slow to develop synergy.
As a result we have an extended event.
So no, this is not groundhog day, just me tracking an El Nino that, until recently, has been slow to gather steam. And that, at this point, looks like it could kick into a much higher gear.
LikeLike
Phil
/ May 6, 2015Robert, excellent post.
Are there any signs that the ocean and atmosphere are coupling? On Neven’s site, there has been mention of the Walker cell flipping into a weak El Nino mode, and also more cloudiness around the equator. However, they seemed to suggest that it was not a permanent state as yet. Also, easterly winds do not seem to have been very strong – for significant stretches, they have been either weak westerly or little or no wind when no WWB event has been occurring.
Also, my understanding (which may be incorrect) was that under El Nino, you would not expect strong MJO activity in WPAC?
Is there any other metrics pointing to ocean-atmospheric coupling we would associate with a system in an El Nino state? I also recognise we are also now entering or about to enter the season where predictions is the most difficult.
LikeLike
robertscribbler
/ May 6, 2015Increased synergy…
1. Looks like a rather strong WWB from where I’m sitting. 30 mph sustained gusts to 40 mph+. Overall, trades have been weak.
2. Recent shoving of the Walker Cell coupled with strong EKW. Cloudiness near the date line has been enhanced.
3. Strong warming of the Equatorial Pacific. Very strong warming mid ocean, and strong overall Pacific warming.
4. MJO running toward mid ocean can coincide with a shift in equatorial rainfall patterns supportive of El Nino (pushing Walker formation eastward). Strong MJO can also reinforce WWB which enhances warm EKW propagation.
5. Problems include gradient, inconsistent increase in mid and EPAC rainfall and fluttering in a few indicators. But, for the most part, atmospheric indicators are pointing toward El Niño or borderline El Niño. Much better overall synergy than last year.
Also note that NOAA has been in declared El Nino state since March. BM looks like it’s heading that way now. NOAA at moderate El Nino of 1.0 C anomaly in Nino 3.4 for past two reports.
LikeLike
beckjeremy
/ May 6, 2015It’s a first.
March global Ave. CO2 > 400 ppm.
http://www.esrl.noaa.gov/gmd/ccgg/trends/global.html
LikeLike
robertscribbler
/ May 7, 2015Great catch, Jeremy. Some pretty stark numbers, especially the highlighted bit below by rustj.
LikeLike
beckjeremy
/ May 6, 2015Raw data – ftp://aftp.cmdl.noaa.gov/products/trends/co2/co2_mm_gl.txt
LikeLike
rustj2015
/ May 6, 2015Yes, BJ, and what’s most shocking to me:
“It was only a matter of time that we would average 400 parts per million globally,” said Pieter Tans, lead scientist of NOAA’s Global Greenhouse Gas Reference Network. “We first reported 400 ppm when all of our Arctic sites reached that value in the spring of 2012. In 2013 the record at NOAA’s Mauna Loa Observatory first crossed the 400 ppm threshold. Reaching 400 parts per million as a global average is a significant milestone.
“This marks the fact that humans burning fossil fuels have caused global carbon dioxide concentrations to rise more than 120 parts per million since pre-industrial times,” added Tans. **“Half of that rise has occurred since 1980.” **
LikeLike
Andy in San Diego
/ May 6, 2015Not sure if anyone remembers, that El Nino (98) caused levee failures and flooded Olivehurst, Arboga, Wilton, Manteca, and Modesto.
Fast forward to now with ground subsistence due to aquifer depletion…. It is not a matter of “if”, it is a matter of “when”.
Imagine the levees holding the rivers back so that islands of housing tracts can be plunked down (often under the elevation of the river due to silting), relatively high density suburbs.
40 foot walls that when breached would generate instantaneous inundation of huge areas.
Mountainsides are denuded of ground plants, the ground is dry and cracked. This is simply landslide fodder.
If this materializes and is the same or more powerful than the 98 El Nino storms it will be devastating as the drought has laid the groundwork for it’s hell.
LikeLike
robertscribbler
/ May 7, 2015Andy’s right. The ground there is baked, subsided. The pores in the earth closed up, creating a tablet effect for water ponding. The fires have stripped trees and brush from hillsides, resulting in landslide hazard.
And the kind of rainfall a 2.5 to 3 C anomaly event could generate would be extraordinary (especially when we add in the extra atmospheric moisture loading from overall human warming).
For California, it looks like the option for ending epic drought is epic flood.
LikeLike
Griffin
/ May 7, 2015I was in Northern CA for the winter of 97-98 Andy. It rained so much and so hard that there were fears of the Oroville Dam overtoppping and going to uncontrolled flooding. The levees below were already at capacity and more outflow would have been catastrophic. As it was, there were plenty of breaches, and saddest of all, lives lost in inland flooding. Granted, that was rain on snow in the Sierra that led to a wall of water coming off the mountains to add to the rain in the lake, but the amount of water in the atmosphere was staggering. Now, with how much things have changed for heavy precip events, I shudder at the thought.
LikeLike
A. Randomjack
/ May 7, 2015THIS IS A *REQUEST* NOT A COMMENT
Hello Robert. I could not find your e-mail address… I 1st heard of you on Radio Ecoshock. A show I never miss to listen to.
I’m requesting permission to translate and adapt to French this article and use your pictures.
I have a permanent agreement with 2 other bloggers I’ve known for over a year and they both allowed me to use their texts and pictures. I of course refer to them and link to their sites. Sam Carana from Arctic news is most likely the most widely known of them, the other one is Nick Breeze of Envisionation.
Thank you for your very informative blog and excellent work.
Hoping for a soon to come positive reply
Please have a nice day
A. Randomjack
LikeLike
robertscribbler
/ May 7, 2015Hello Randomjack.
Thanks for the kind note. Please feel free to translate this blog for your audience. My request, in return, is a link back and attribution.
Fantastic to hear you enjoyed the ecoshock program. Alex does a wonderful job with it.
LikeLike
Andy in San Diego
/ May 7, 2015I’ve copied it down, I have it in my spam engine, and have scores of goblins preparing emails to you informing you that I am a Barrister who is holding 33 million dollars for you…..(j/k)
LikeLike
robertscribbler
/ May 7, 2015Ha! Going phishin, then? 😉
LikeLike
Andy in San Diego
/ May 7, 2015Gotta make a buck somehow….
LikeLike
A. Randomjack
/ May 7, 2015Thank you very much Robert
I just listened to tonights release of Radio Ecoshock. As always, it was interesting and highly informative. I recommend it to every one who prefers lucidity.
I will of course oblige to your request with great pleasure.
I will drop by every time I use your texts and images and link to my posts.
Now I got work to do 🙂
Take care and see you soon again.
LikeLike
robertscribbler
/ May 7, 2015That would be a link to my original posts along with attribution to me as author. If you do that, it will show up in comments as a track back.
LikeLike
A. Randomjack
/ May 8, 2015Hello Robert,
I posted the El Niño article on my blog, but I don’t see it here…
Perhaps it’s because I use Blogger and not WordPress
Or I missed it, it’s getting late up here.
In any case, here it is : http://leclimatoblogue.blogspot.ca/2015/05/el-nino-2015-apparemment-en-voie-de.html
I got a decent audience for it, and I saw at least one reposting yours as I have French and English speaking followers. I also reposted you California drought with a short summary in French.
Thanks for your cooperation. Working on my next one that will be on methane.
I’ll keep you informed when it comes out. But I’ll need 4 or 5 days to complete that one…
Have a nice day and take care
Jack
LikeLike
Andy in San Diego
/ May 7, 2015Robert,
Lake Mead is at 1078.79
~4 ft from the start of cutoffs. I’ve been reading up on them. It appears Arizona gets hit first at 1075 in some documentation, Nevada in others.
Outflows from Mead were basically shut off Saturday & Sunday. Starting Saturday, outflows from Lake Powell were cranked up by about 1000 cfs. Basically at this point, inflows to Powell are being sent downstream to Mead immediately.
I see a bit of gambling here hoping for decent inflows to Powell in Late May through early July. Unfortunately, snow pack above Powell is pretty much non existent. Powell is at ~44% full pool. Mead is at ~38%.
This will be an interesting summer, it appears that all of the Hail Mary’s have been used for 2015 already.
LikeLike
robertscribbler
/ May 7, 2015To use a Tolkien reference —
It’s Gondor. The gates are shut. The beacons have been lit. And the darkness of Mordor gathers overhead.
It’s going to be a rough summer.
LikeLike
Charlie
/ May 7, 2015I think we’re going to need more than a couple of hobbits slipping past the fossil fuel orcs to make it through this one! Sam may need to teach us all how to garden if California crops get clobbered.
LikeLike
sunkensheep
/ May 7, 2015I see the data is available at http://lakemead.water-data.com/
Acre-feet is meaningless to me, however using a converter I get current storage volume of
12 225 026ML. That is a huge quantity of water.
Anyone know what the dead storage (1050ft?) capacity corresponds to?
Likewise for lake Powell, I see 13 330 153 ML (and this is a drought)! From the viewpoint of the parched lands of Australia, this watershed has astounding storage volume.
LikeLike
rayduray
/ May 7, 2015sunkensheep,
This might help answer your question about the dead pool at Lake Mead.
http://www.nps.gov/lake/learn/nature/storage-capacity-of-lake-mead.htm
The dead pool elevation is 895 feet above sea level. About 2.5 million acre feet would remain behind the dam but would be unusable without pumping it up and out of the reservoir.
LikeLike
Andy in San Diego
/ May 7, 2015Some interesting metrics would be the percentage of the global population in conflict or starvation by year to see if/how El Nino impacts these.
Also, drought severity in India by year to see if there is a correlation to El Nino severity.
LikeLike
robertscribbler
/ May 7, 2015Mid ocean El Niño correlates most strongly with monsoonal disruption. Will see if I can dig up some conflict metrics for next week’s update.
LikeLike
Greg
/ May 7, 2015Huffingtonpost.com leads with the story about 400 average ppm for March carbon levels. “Standing on the shores of disaster”
LikeLike
robertscribbler
/ May 7, 2015Aptly titled!
LikeLike
robertscribbler
/ May 7, 2015Actually, they buried the headliner!
LikeLike
Greg
/ May 7, 2015Post covers how the drought in West is adversely affecting our four legged neighbors:
http://www.washingtonpost.com/national/health-science/animals-in-the-wild-are-dying-for-a-drink-in-the-drought-stricken-west/2015/05/06/260312aa-eac6-11e4-9767-6276fc9b0ada_story.html?tid=HP_more?tid=HP_more
LikeLike
kent
/ May 7, 2015Thanks Robert!
LikeLike
Spike
/ May 7, 2015The North-East of Brasil often stays drier than usual during El Niño according to this informative article – not good news for them.
http://www.knmi.nl/research/global_climate/enso/effects/
LikeLike