(Arctic sea ice losses are a long term trend that has been in place since the early to mid 20th Century. The recent satellite record captures this ongoing loss due to polar warming and triggered primarily by fossil fuel burning. In keeping with this trend, 2018 saw the second lowest sea ice extent maximum on record. Image source: Zack Labe. Data Source: JAXA.)
Arctic sea ice extent measured by JAXA and depicted above by Arctic observer Zack Labe, hit 13.89 million square kilometers on March 17th. Given the fact that warmer Arctic temperatures are now on the way, this is likely the furthest sea ice will extend in the northern polar region during 2018. By comparison, 2017 sea ice extent maxed out at 13.88 million square kilometers on March 6th of that year. As a result, 2017 just barely beat out 2018 as the lowest maximum extent in the satellite record according to JAXA.
Over the next week and a half, Arctic temperatures are expected to range between 0.2 to 0.8 C above average. This may not sound like much compared to the past winter which experienced long periods of 3-5 C above normal temperatures. However, the transition to spring and summer typically shows a regression toward baseline averages. In other words, since winter is where we are seeing most of the climate change related warming at present, even slightly warmer than normal temperatures during spring and summer can have an outsized impact. Especially following a very warm winter like the one we have just seen.
(The ten day forecast is presently predicting a very substantial Arctic warm-up. If this forecast is correct, it could result in a fast start to melt season. With sea ice extents already near record low levels, this potential is rather concerning. Image source: Climate Reanalyzer.)
Keeping this thought in mind, we are more likely to see slowly mounting sea ice losses over the coming days in various regions. Especially on the Pacific side of the Arctic — which is presently seeing above freezing temperatures running up through the Bering and well into the Chukchi seas. Given such a strong warm wind invasion over a key region of ice, we are very unlikely to see sea ice expansion beyond the present maximum.
Looking at the long term forecast, we find that the Arctic is expected to experience substantial warming — especially for spring. And this warming may serve to accelerate melt beyond typical rates for this time of year. The tendency for Pacific emerging warm winds appears to be in place. And by April 1st, a large plume of abnormal warmth is expected to run up from the Pacific and Eastern Siberian side of the Arctic. This plume is forecast to spread deep into the High Arctic — driving overall temperatures for the zone to 4.1 C above average with local temperatures between 20 and 25 C above average. If the present forecast holds, this unseasonal flow will also result in large regions of the East Siberian Sea experiencing above freezing temperatures for brief periods.
Taken in the greater context, if the predicted warm pattern of the next ten days becomes more of a trend for spring of 2018, then the near record low maximum of 2018 could well be followed by significant losses during melt season. Definitely a trend to keep an eye on.
(Severe warming, both at the surface and in the upper atmosphere over the Arctic helped to generate a polar vortex collapse during recent days. This collapse, in turn, generated a number of high amplitude waves in the Jet Stream — one of which produced a record high pressure ridge over the U.S. East Coast on Wednesday, February 21. Image source: Earth Nullschool.)
All these severe weather elements have ties to a climate change related condition called polar amplification. A condition that generates mass sea ice loss and extreme warmth at the northern pole, especially during winter. One that translates into more extreme ridge and trough patterns over the middle latitudes. And due to these features, the weather for both the Arctic and the North Atlantic doesn’t appear to be set to return to anything approximating normal for at least the next five days.
Forecast for More Extreme Warmth…
Far to the north, a long, thin extension in the Jet Stream is setting up to bring predicted above freezing temperatures to the North Pole by Sunday. The surface system anchoring that warm air invasion is a powerful low predicted to bomb out around 930 mb just off the coast of Greenland on Saturday. It will fling hurricane force winds and near to above freezing temperatures over coastal and northeastern sections of this frozen archipelago before translating that significant energy northward into the Arctic by early Sunday.
(Extreme warmth struck both the Arctic and the U.S. East on Wednesday, February 21st. A similar pattern is predicted to repeat by this weekend — pushing temperatures to near or above freezing at the North Pole even as the US southeast swelters. Image source: GFS/Climate Reanalyzer.)
Temperatures over central and northern Greenland are predicted to range between 10 and 25 C above average even as parts of the high Arctic spike to 30 C above average.
… Following Wednesday’s Record-Breaking Ridge
Though much of the recently most extreme weather action has been focused on the Arctic, the mid-latitudes have seen there fair share of climate change wrenched extremes.
Yesterday, a slot of warm air rushing northward built into a powerful ridge over the U.S. East Coast. This ridge was not any typical pulse of warm air at the surface running counter to a much cooler winter time atmosphere. It was heavy and it was tall — translating from the ground and well into the stratosphere.
Not only an extreme #ridge for February, but in the period of record at the observation sites in eastern #ncwx according to SPC climo, the previous earliest 595 dm 500 millibar height was in *June* pic.twitter.com/C4BVQi3PSx
By the weekend, another warm air push is expected to invade the U.S. East. This time, it appears that temperatures in the Southeast will be most intense with highs hitting around 85 F across parts of Georgia and Florida even as a broad region of 75 to 80+ degree readings sweeps from the Gulf Coast on up through Virginia Sunday.
In the Context of Human-Caused Climate Change
We would be remiss if we didn’t note that increasing atmospheric thickness and powerful high pressure ridges are noted features of a warming global environment. New record high temperatures are also a climate change indicator — especially when they occur with such high prevalence and frequency. And this is the case even over the continental U.S. as a rapidly warming Arctic is helping to drive increasing hot and cold temperature extremes in the middle latitudes.
That’s how much warmer than ‘normal’ the entire region of the Arctic above the 66 degree North Latitude Line was earlier today. Areas within this large warm pool saw temperatures spike to a range of 15 to 25 C warmer than the already warmer than normal 1981-2010 base period. And broad regions saw temperature between 10 and 20 C above that 30-year average.
(The entire Arctic is an incredible 5.5 C warmer than normal today. Meanwhile, Arctic sea ice extent has plunged, once-more, into record low ranges. Image source: Climate Reanalyzer.)
And as during last year’s ridiculously warm Arctic winter, the sea ice has taken a considerable pounding. Yesterday dropping to a new record low extent of 13.774 million square kilometers. Beating out the previous record low for the day set just last year. And dipping more than 1.8 million square kilometers below the 1979-1990 average. A period that already featured greatly reduced Arctic sea ice cover when compared to extents seen in the early 20th Century.
(Arctic sea ice extent for 2018 [lower pink line above] dipped into new record low ranges during recent days. Note that the 1979 – 1990 extent average is indicated by the green line at top. Image source: NSIDC.)
The primary cause of these ice losses is warming both of the ocean and of the air. And, as we can see in the ongoing trend, the Arctic is getting more than its fair share of both. Such polar amplification is a direct upshot of the massive volume of harmful greenhouse gasses being injected into the atmosphere through fossil fuel burning. And we are seeing the dark fruits of that burning now in the massive and ongoing winter losses of sea ice, the harm to various Arctic life forms like puffins and polar bears, and the risk of increasing sea level rise, ocean circulation destabilization, and increasingly extreme weather events that all result from the heating-up of polar environments.
Massive disruption which results in cascading failure of basic services such as food, water transport and power. That’s the primary catastrophic risk coming from human forced climate change. And we are now in the process of multiplying the potential for such extreme events by continuing to burn fossil fuels and to dump carbon into the atmosphere.
Maria’s recent landfall in Puerto Rico and resulting unprecedented disruption can be seen as a microcosm of the kind of damage that might ultimately be inflicted upon a whole region or nation. And the various failed responses by the Trump Administration and related denial-based attitudes within the Republican Party do little to inspire confidence in the ability of at least one major party to effectively respond to a rising danger it pretends does not exist at all.
Many of the 3.4 million people still living in Puerto Rico have been forced to go without reliable access to water, food, and power for 54 days now. Trump Administration failure to mobilize a major effort to respond to the largest power outage and infrastructure disruption in U.S. history has been coupled with the allowance of vulture capitalist firms like Whitefish to prey on Puerto Rico by charging excess fees for power restoration.
(Climate Change amplifies hurricane impacts. What this means is that as the world warms, hurricanes produce more damage. If this is the case, then governments are going to have to step up and act responsibly to prevent loss of life. Republicans and the Trump Administration have done exactly the opposite in Puerto Rico. Images source: Climate Signals.)
Lack of power itself can be deadly. Such a loss results in a critical shortage for medical equipment necessary to save people’s lives even as it removes key infrastructures like street lights and communications. Incubators, defibrillators, respirators, pulse monitors and a hundred other life saving devices all go dark when the lights go out. Furthermore, lack of clean water and ready access to food increases instances of infection. And damage to roads prevents access by emergency personnel to people falling into harm’s way.
Vulture Capitalism + Climate Change Denial = Failed Responses and Profiteering in the Face of Rising Disasters
A party that has also done far, far more than its fair share to deny and prevent responses to the human caused climate change from fossil fuel emissions that made Maria far, far worse. For the storm emerged from warmer than normal oceans that helped to pump up its peak intensity. It was one of many storms made worse by climate change — for studies now indicate that at least 63 percent of all extreme weather events have now been pumped up in a warming atmosphere or over a warming ocean. And with just 1.2 C worth of warming achieved, the worse is still to come.
With the republican party both causing these disasters to worsen and ensuring that their damaging impacts are amplified by delayed responses, irresponsible choices for firms contracted to bring infrastructure back up and running, and overall malfeasance, it’s pretty clear that only a numb-skull would vote for such mouth-breathers. But here we are.
I think it can be fairly said that we are a people who believe in a better future. That the ideals of America are founded on building prosperity and expanding prospects — not only for ourselves, but for our fellows and for those generations that are to follow.
Americans have often been described as a ‘can-do’ kind of people. A people who will undertake any challenge to advance or protect our nation and to graciously extend her kind virtues to the huddled masses of a troubled world. Be it the freeing of slaves, the emancipation of women, the facing down of tyrannical dictators, the liberation of scientific inquiry, or the exploration of our Earth and the vast realm of space we have doggedly decided to march forward and on.
The People's Climate March April 29, 2017. Be there! There is no Planet B. https://t.co/a1yliOchAc
But today we are confronted by a new trouble. A trouble that was, in many ways, an unintended consequence of past progress. For as we industrialized, as a nation and as a global society, we also burned ancient carbon deposits long buried beneath the Earth. And so we expelled a great cloud of the most dangerous of gasses into the Earth’s atmosphere.
We didn’t know it so well at the time. But the carbon dioxide spewing from William Blake’s dark Satanic Mills was the same gas that in excess produced the worst and most horrific global die-offs in the great and deep, deep history of our Earth. Times of great mass extinction due to rising global heat that bear the infamous names — Permian, Triassic, Paleocene, Devonian and Ordovician. Blake, living today, would be terrified how right he was to call those mills Satanic. To learn what our scientists now have told us. But even then, he surely had an inkling. For the Bible itself warns — those who destroy the Earth shall be destroyed. And in 1808 the wanton destruction of the Earth and its airs by the pollution caused by fossil fuel burning was visibly evident if not so scientifically proven and explored as it is today.
Today, if we continue to burn fossil fuels as we have for the past 200 years or so, the world will again surely experience another such extinction. We already see the outliers of this crisis now — in the growing number of people bereft of land and home and livelihood as seas rose, or crops were destroyed by worsening storms and droughts, or lands and animals were lost to wildfires, or as reefs and fisheries were killed off by the warming, acidifying waters of our oceans. But what will come over the years and decades and centuries if we do not turn back from this horrid burning of fossil fuels and the dumping of their carbon into the atmosphere will be far, far worse.
What kind of world is this to make for our fellow human beings? What kind of future to leave for the generations that follow? Surely not the better one that we all work and hope for. Surely not one that honors the can-do, make the world a better place spirit of America.
But despite our worsening prospects and the dark and heavy clouds that now hang over the global climate, we have a window of opportunity in which to act. Our tools to confront climate change in the form of renewable energy systems like wind and solar and electrified transportation are growing more capable. And further innovation and change in our actions as people and nations can yet enable us to draw down the awful pall of heat trapping gasses that now hangs above us. These are things we can and must do if we are a moral people with any kind of vision, foresight and compassion.
This is our moment. The moment when we decide to make the choice to act and to save so many of the very precious things we all hold dear or to turn away from action and condemn each and every person and being now living or that will live to an age of terror and darkness the likes of which Earth has not seen in all of half a billion years.
So I’m asking you for your help. I’m asking you to make the choice to act. To join the People in their march for climate justice tomorrow. To support all the voices that are now speaking out. To lift your own voice to our growing chorus.
For the love of life and of all good things — we simply must act now.
There’s a real atmospheric brute towering over the Arctic’s Beaufort Sea at this time. A high pressure system that would put shame to most other anti-cyclonic phenomena that bear the name. It is sending out a broad, clockwise pattern of winds. It is pulling up warm air from the Pacific to invade the Bering, Chukchi, East Siberian and Laptev Seas. And its torquing motion is shattering the already considerably thinned ice beneath it.
(A powerful high pressure system over the Beaufort Sea is predicted to further strengthen by late April 15. Image source: Earth Nullschool.)
Clocking in at 1046 mb of pressure, it makes typically strong 1030 mb high pressure systems seem weak by comparison. Over the next day it is expected to strengthen still — hitting 1048 mb by late April 15th (coming very close to an extraordinary 1050 mb system).
Shattered Sea Ice
This powerful and strengthening system has already been in place for about two weeks — slowly gaining momentum as its circulation has moved in mirror to the waters of the Beaufort Gyre that swirl beneath it. Masked only by a veil of sea ice considerably thinned by human-forced climate change, the waters of the Beaufort are now breaking through. Streaks of dark blue on white in an early break-up enabled both by a terrible Arctic warming and by this powerful spring weather system.
(Side-by-side images of Beaufort sea ice from April 4 [left frame] to April 13 [right frame]. Note the considerable and rapid advance of fracturing in a relatively short period. For reference, bottom edge of frame in both images is 500 miles. Image source: LANCE MODIS.)
Warm Storms
On the Siberian side of the Arctic, this massive high pressure dome is drawing in warm winds from the Pacific Ocean. Gust by gust and front by front, they come in the form of squalls that deliver above freezing temperatures and rains that blanket this thawing section of the Arctic. On Thursday, April 13, these warm winds had driven northward over 2,500 miles of Pacific waters to be drawn into storms that unleashed their fury — driving rains and gales through the already dispersed ice in the Bering Sea and shattering ice floes through the Chukchi. Today, April 14, these winds and rains drove northward to assault the ice of the East Siberian and Laptev seas.
(On April 13, above freezing temperatures, rains, and gale force winds ripped through the sea ice near Wrangle Island in the Chukchi Sea. Image source: Earth Nullschool.)
A Great Atmospheric Stack Drawing Heat into the Arctic
In the past, meteorologists like Stu Ostro envisioned that climate change would tend to produce towering high pressure systems — featuring increasingly strong storms roaring about their fierce outer boundaries. And the massive high lurking over the Arctic at this time is a good example of Ostro’s predictions coming to light in a region that is very sensitive to human-forced warming.
This great atmospheric stack appears to have had a considerable impact on the ice already — helping to push extent measures back into record low ranges by accelerating the melt trend. But these impacts are likely to spike over the coming week as this powerful high expected to remain in place through the next five days — continuing to draw warm air into the region.
(Global Forecast System models predict extreme warming over the Arctic Ocean throughout the next week resulting from the influence of a powerful high pressure system and very strong associated ridge in the Jet Stream. Image source: NCEP Global Forecast System Reanalysis.)
GFS model runs indicate that average temperatures over the Arctic Ocean region will hit a peak as high as 4 degrees Celsius above average by late next week. Meanwhile, the warmest zones are expected to be as much as 18-20 degrees Celsius above average. Such abnormal warmth at this time of year, if it emerges, will put a considerable damper on a freeze that should now be continuing in the High Arctic even as edge melt ramps up with the progression of spring.
This is particularly concerning due to the fact that temperature anomalies in the Arctic tend to fall off during spring and summer. In other words, such a powerful warming trend for the Arctic Ocean would be bad enough during winter — but it is an even more unusual event for spring. An ominous start to a melt season that could produce far-reaching regional and global consequences.
“From 1957 onward, there is no doubt that Humble Oil, which is now Exxon, was clearly on notice” about rising CO2 in the atmosphere and the prospect that it was likely to cause global warming… — Environmental Law Center’s Director Carroll Muffett in The New York Times
*****
We’ve known for some time that failing to respond to climate change is a callous cruelty of the worst kind imaginable. That continuing to burn fossil fuels and to delay a necessary transition to renewable energy will not only melt ice caps, provoke extreme weather the likes of which none of us have seen, flood coastlines and island nations, and threaten global food production, but it will also ultimately set off a hothouse mass extinction that is likely to be as bad or worse than the Permian.
(Nature will surely grant no quarter if we do not hold the climate bad actors to account.)
And because continuing to burn fossil fuels commits so many harms on individuals, on nations, on the world, on children who are now growing up or who have yet to be born, and on the vital skein of nature itself, this activity is increasingly being viewed in the context of liability and criminality.
Corporate Support of Climate Change Denial Invites Accusations of Fraud, Consumer Protection, Environmental Law, and Securities Violations
By 2015, after numerous failures to respond to letters by Congressional Lawmakers and concerned citizens, Exxon was the subject of increasing scrutiny. In October of the same year, the company became the focus of a formal request from more than 40 social justice and environmental organizations to the United States Attorney General that an investigation be opened into its public deception and climate change denial campaigns. Vice President Al Gore, among other national leaders, then called for the revocation of Exxon’s articles of incorporation.
The outcry built as New York Attorney General Eric Schneiderman opened an investigation into Exxon’s activities. At issue was whether or not Exxon committed fraud or violated consumer protection and securities laws. Subsequently, the California Attorney General opened his own investigation into whether Exxon misinformed its shareholders, committed securities fraud, or violated environmental laws. And by mid summer of 2016, seventeen state attorney generals were involved in the growing legal action.
After various Congressional wranglings and court hearings, the case against Exxon is now headed for a New York state trial. It now appears that Exxon is likely to be found guilty of some or all of these charges. A decision that the company is likely to attempt to appeal.
Children Sue National Governments Over Human Rights and Welfare
Also in August of 2015, a group of children in Juliana vs the United States sued the federal government — arguing that its actions have endangered future generations’ rights to the degree that it threatened their survival. The government is argued to have endangered these children and to have failed in its duty to protect their access to crucial natural resources — to include a stable atmosphere and a natural world capable of sustaining the people of the United States.
(In the U.S., a variety of climate impacts ranging from sea level rise devouring coastlines, to worsening droughts, heatwaves, fires, and floods, to increasingly intense storms, to declining ocean health, air and water quality, to harm to the U.S. food and water security all threaten our children’s future well-being and survival. Their lawsuit — compelling the federal government to act decisively on climate change — continues to move forward in federal court. Image source: Common Dreams.)
On April 1 of 2017, a similar lawsuit was also filed by 9 year old Ridhima Pandey against the government of India. Ridhima’s lawsuit argues that India, which is also the world’s third largest carbon emitter, has failed to put into action the promises it made by signing the Paris Agreement on climate change. The case also alleges that India has violated its public trust doctrine, its implied promise to provide inter-generational equality, and a number of national environmental laws. Ridhima’s lawsuit comes as India has increasingly succumbed to dangerous heatwaves, droughts, and floods which have harmed food production, provoked mass suicides by farmers, and put the water security of a number of provinces into increasing jeopardy.
UK Government Faces Lawsuit in 21 Days if it Fails to Act on Carbon Budget
In the UK, promises to cut carbon emissions are now legally binding. Britain’s Climate Change Act required the government to find a way to reduce the amount of carbon hitting the atmosphere by 57 per cent through 2032. And considerable progress has been made toward this goal as a shift away from coal precipitated a 33 percent drop from 1992 through 2014. However, the government’s reliance on fracking, its sand-bagging of renewable energy adoption policies, and its failure to more fully incentivize electric vehicles has now put it in a position where the 57 percent goal is falling out of reach.
(Climate change denial may make you want to laugh or cry. But it’s a deadly serious matter.)
James Thornton, chief executive at ClientEarth, noted:
“We want to work with the government on a strong, effective emissions reduction plan, but all we get is never-ending delays. Government must publish the plan, and must consult with industry and civil society. If it continues to kick this can down the road, we will have no option but to consider legal action.”
Paradigm Shift Running Throughout Civil Society
Legal actions holding powerful corporations accountable for climate harms, holding governments to account for failing to provide for the welfare of future generations, and legally compelling governments to adhere to climate policy obligations represents a pivotal shift in the rules and standards governing western civil societies. It provides an institution that enables citizens and environmental watch-dogs to shape climate policy while holding bad climate actors to account. And this critical social advancement in the presently perilous age when climate impacts are now starting to be realized could not have come soon enough.
Taking traditional coal power out of our energy mix and replacing it with cleaner technologies will significantly reduce our greenhouse gas emissions, improve the health of Canadians, and benefit generations for years to come. —Canada’s Environment Minister Kathleen McKenna
Make no mistake – Trump and his legion of doom cronies are a very real threat to the environment. Apart from the fact that they deny climate change actually exists, they are also quite big fans of coal. — IFL Science
The wide-ranging conflict over renewable energy, carbon emissions, and climate change rages on. And as Donald Trump prepares to enter the Oval Office, or stay within the gilded halls of Trump Tower to the tune of 1 million dollars a day from the U.S. taxpayer (not Trump), it appears that U.S. climate and renewable energy leadership are already starting to lag.
France and Canada join with Britain, the Netherlands, Austria and Denmark who have all announced near-term timetables for phasing out coal burning. And since coal is the worst of the three major fossil fuel sources of CO2 emissions, halting coal burning is a key to addressing the rapidly worsening crisis that is human forced climate change.
Trump’s own statements on global climate summits and carbon emissions reduction commitments are that he wants to back out. An action that has already harmed U.S. trade prospects with France — whose public officials are now signaling that they could slap a carbon tax on U.S. goods if the President-Elect carries through with his threats. But, perhaps even worse, it appears that Trump’s intention to cling to dirty, old industries is also endangering U.S. competitiveness in emerging markets.
Elon Musk Solarizes American Somao
As the world moves ahead with emissions reductions and looks for ways to manage a recalcitrant U.S. under Trump, backers of Trump’s Presidential bid are at this time preparing to attack a key emerging U.S. solar and electrical vehicles industry. This week, Elon Musk’s Tesla announced that it had succeeded in providing 100 percent solar powered electricity to the island territory of Samoa.
(Like many places in the world, American Samoa is threatened by climate change. Now, thanks to Tesla, the island will not contribute to the problem through electricity generation as all such energy is produced by 100 percent solar power. Image source: The Embassy of Samoa.)
And over the next few years, Tesla, a global leader in renewable energy products, promises to create whole new markets even as it helps the world greatly reduce carbon emissions by providing both zero emitting power sources and zero emitting electrical vehicles.
Trump Backers Smear Tesla While Subsidy Support for Fossil Fuels Continues
If there is one major avenue for U.S. growth into new industry and innovation — it comes in the form of renewables. And Tesla is on the cutting edge of renewable energy innovation. The Trump Administration has made big and risky bets on rapid U.S. economic growth to support its own economic policy stance. But Trump backers appear set to try to hobble Tesla and prevent its entry as a global energy leader fostering solutions to climate change, providing products that enable energy independence, and supporting thousands of American jobs.
Trump’s stance in this case is pretty outrageous. It would be like the Reagan Administration attacking personal computers and Microsoft in favor of companies that produced the typewriter after his election in 1980. But as ludicrous as such a policy would have been, it wouldn’t have risked the global calamity that a failure to transition to renewable energy sources results in today.
(A vast amount of public money and support has gone to aid fossil fuel extraction. This extraction, in its turn, has contributed greatly to the problem of human-caused climate change. It’s worth noting that zero-emitting renewable energy, over its industry lifetime has received just 1 percent of the support that the fossil fuel industry has in this country. Image source: Clean Technica.)
Despite the plain fact that expansion of access to renewable energy is necessary to deal with the crisis of human-caused climate change, Trump backers continue to attack these helpful new industries. In the most recent salvo, according to Electrek, a right wing group that aided Trump’s Presidential bid is now spear-heading a PR campaign aimed at damaging Tesla. The group is trying to falsely portray Tesla and the solar industry as a ‘subsidy hog.’ But the group mentions nothing of the massive subsidies going to fossil fuel corporations and to related oil, gas, and coal extraction. The group’s leader, Laura Ingraham, is a Fox News host and is likely acting to protect oil, gas and coal subsidies from a more appealing and less environmentally harmful energy industry competitor. And because groups like the ones fronted by Ingraham have come to prominence by riding in on Trump’s coat-tails, we can expect more and more of the same.
Business Leaders Plead With Trump, But Policy Looks Bad as Bad Can Be
But it’s not just an issue of Trump and his backers targeting Tesla. It’s an issue of Trump vs the sentiment of a major subset of the U.S. business community.
Last week, 365 major U.S. businesses issued an open letter asking Trump to support policies that confront climate change like the Paris Climate Summit. Businesses that included icons like Mars Candy, Nike, IKEA, Intel, Dannon, Dupont, and Hilton were among the signatories. And these industries together represent a huge interest group. One that supports the low carbon and carbon nuetral economy that companies like Tesla are helping to build. So the question is — will Trump turn a deaf ear to a whole segment of the American business community just to defend the interests of the damaging and fading fossil fuel industry (supposing the alternative is the highly unlikely event in which Trump, like Dr. Seuss’s Grinch, undergoes a miraculous change of heart).
Add in the fact that Trump’s cabinet is full of climate change deniers like Myron Ebell — who was the big voice supporting the fake argument that ‘global warming is a hoax’ — and we get the general picture of an Admistration that is hostile to both renewable energy and to the global effort to confront climate change. That is deaf to rational arguments by global political and industrial leaders. And such a brazen failure to engage on an issue that impacts pretty much everyone is the kind of lack of leadership that comes to the U.S. at the absolute worst possible time.
Meanwhile, strange, out-of-season wildfires continued to burn from the U.S. South to North Dakota and New England. In Atlanta, smoke streaming out of nearby wildfires blanketed the city. Red-eyed residents were increasingly forced to don protective masks beneath the choking late-fall pallor. In Chattanooga, over 200 residents were hospitalized from smoke inhalation and shortness of breath.
(NASA satellite image of smoke streaming out from Appalachian wildfires on November 16, 2016. Note that smoke plume stretches over large sections of North Carolina, Kentucky, Tennessee, South Carolina and Georgia — stretching all the way to coast and spilling out over the Atlantic. Image source: LANCE MODIS.)
Asked about the situation, Weather Channel meteorologist Stu Ostro said — “The smoke here in Atlanta has been surreal, and [occurs] in the context of the persistent lack of precip and above average temperatures.”
In a number of cases, it appears that arsonists have ignited some of these fires. But warm conditions more similar to summer than fall have combined with an extreme drought spreading through the affected regions to push fire danger through the roof. So the impact of any ignition source is dramatically compounded by the heat and dryness. And the most intense fires are now burning in a region of extreme to exceptional drought centered on the mountains of North Georgia.
(Odd, unseasonable warmth blankets much of the U.S. and Canada in this surface air temperature anomaly map as wildfires rage in the southeast on November 16. Image source: Climate Reanalyzer.)
Such extreme drought and related intense warmth is not a normal climate feature for the southeast during November. Cool weather often dominates the North Georgia region at this time of year. But 2016, a year when global temperatures are now likely to hit 1.2 C above 1880s averages, brings with it an increasing likelihood of unseasonable heat and related rapidly developing drought in the affected areas. These fires, thus, occur under weather conditions that are consistent with what we would expect from human-caused climate change.
Note: Renowned and respected meteorologist Stu Ostro was generous enough to provide commentary on the smoke/fire situation in Atlanta — which includes a note on how odd he thinks the current situation is. That said, the analysis and assertion that the current situation is not normal and is related to climate change is my own initial observation. Stu’s inclusion in this analysis is in no way meant to imply that he agrees fully or in part with my particular assessment. You may want to seek his own professional opinion on the matter here on Twitter as I have found that he is both friendly and accessible.
Note: Official agencies issue burn warnings during dry times for a reason. Anyone lighting fires during such times of extreme dryness — like the present — represents a hazard to public safety. Health, property, the resiliency of our national forests, and individual livelihoods are all put at risk by careless, reckless or malicious use of fire under these circumstances. Please heed the guidance of local, state and national authorities in such instances.
Long term, there’s no doubt what’s in control of the world’s temperature trend. The vast belching of greenhouse gasses by fossil fuel industry and related non-renewable based machinery has caused atmospheric carbon levels to hit 405 ppm CO2 and 490 ppm CO2e this year. All this added carbon has caused the world to warm by a record 1.22 C since 1880s levels during 2016 (approx). But superimposed over this long term warming trend is the natural variability based ebb and flow of atmospheric and surface ocean heat that is the El Nino Southern Oscillation (ENSO) cycle.
ENSO — A Wave Pattern Overlying the Long Term Warming Trend
Think of it as a smaller wave pattern that overlaps the current global upswing in temperatures. As El Nino builds and comes into the fore, natural forcings caused by periodic ocean surface warming in the Equatorial Pacific push global temperatures higher. This tends to add to the human forced global warming trend. So, often, El Nino years are also record warm years.
(El Nino to La Nina temperature variations create a wavy pattern in the overall global warming trend. Note — the record warm year of 2016 is not included in this graph. Image source: NOAA.)
Conversely, La Nina, which generates a periodic cooling in the Equatorial Pacific tends to pull a bit against the long term warming trend. So periods of La Nina tend to show average global atmospheric temperatures in the annual measure drop off by about 0.2 to 0.4 C from the peak periods of atmospheric heating during El Nino. Of course, since the ENSO variability typically follows a range of +0.2 C to -0.2 C but does not affect long term temperature trends, it only takes about a decade for La Nina years to be about as warm as recent El Nino years.
Slight Warming During Fall of 2016 Despite La Nina
During fall of 2015 and the winter and spring of 2016 a powerful El Nino helped to push global surface temperatures into new record high ranges. This happened because greenhouse gasses the world over had been loading heat into the Earth System for some time and the strong El Nino served as a kind of trip wire that opened the flood gates for a surge of atmospheric heat. Which is why 2016 will be about 1.22 C hotter than 1880s temperatures (1 C hotter than NASA 20th Century baseline temps) and why the years from 2011 to 2016 will average above 1 C hotter than 1880s values overall (0.8 C hotter than 20th Century baselines).
But now, with the 2016 El Nino in the rear view mirror and with a La Nina forming in the Pacific, we would expect global temperatures to cool down somewhat. For the most part, this has happened. Back in January and February, monthly average temperatures were as much as 1.5 C above 1880s averages. Since summer, the averages have dipped to around 1 to 1.1 C above 1880s values.
(Global temperatures bottomed out at around 1 C above 1880s or 0.4 C above the 1981 to 2010 average in this GFS based graph by Karsten Haustein during June then began to slowly climb through fall even as a weak La Nina began to develope.)
With La Nina continuing to form, we would expect these monthly values to continue to fall for a bit as La Nina strengthened. But that doesn’t appear to be happening. Instead, global atmospheric temperatures bottomed out at around 1 to 1.1 C above 1880s levels in June, July, August and September and now they appear to be rebounding.
Polar Amplification Signal Shows Up as a Blip in the Global Measure
In other words, we see a rise in the global temperature trend when we should see a steady counter-trend decline forced by natural variability.
Why is this happening?
The climate evidence points to a rather obvious set of suspects. First, the long term Pacific Decadal Oscillation value has continued to push into the positive range. And this state would tend to favor more heat radiating back into the atmosphere from the ocean surface.
However, if you look at the global climate maps, the major anomaly drivers are not coming from the Pacific, but from the poles. For this fall saw extreme warming both in the northern and southern polar regions of the world. Today, temperature anomalies in both the Arctic and the Antarctic were 5.84 and 4.19 C above average respectively. A rough average between the two poles of +5 C for these high latitude regions. As we’ve mentioned many times before, such severe warming is an obvious signal of climate change based polar amplification where temperatures at the poles warm faster relative to the rest of the Earth during the first phase of greenhouse gas forced warming.
(Extreme warming of the polar regions continued on November 4 of 2016. This warming is pushing against the La Nina trend which would tend to cool the world temporarily. Image source: Climate Reanalyzer.)
By themselves, these abnormally high temperatures at the poles would be odd enough. But when taking into account that La Nina should still be cooling the globe off, it starts to look like this severe polar warming has jostled the La Nina cooling signal a bit — turning it back toward warming by late fall. And if that is what’s really happening, then it would imply that the natural variability signal that is produced by ENSO is starting to be over-ridden by polar amplification based influences. In other words, there appears to be another signal that’s starting to intrude as a polar amplification based temperature spike.
It’s something that has popped up from time to time as a blip in the observational data over the past few years. But fall of 2016 provides one of the stronger signals so far. And it’s a signal related to a set of feedbacks that have the potential to affect the overall pace of planetary warming. Something to definitely keep an eye on.
Only unusually high ocean heat content and high atmospheric moisture levels — as those that have now become more prevalent due to human-forced climate change — could support such a back-to-back strike by powerful storms of this kind running along similar ocean tracks. Typically, a single strong storm would be enough to deplete the oceanic heat and atmospheric moisture stores that serve as fuel for such intense tropical systems. Through the process of Ekman pumping, storms tend to pull up cooler waters from below the surface and leave them behind in their wake. And this is one of the chief reasons why major hurricanes or typhoons do not typically follow one right after another. But in the new world created by human fossil fuel burning this is less and less the case. Ocean heat and atmospheric moisture fuel for these storms abound. And the waters are warmer at depth, so upwelling of cooler waters can become less of an inhibiting factor. So risks for abnormally intense events are higher.
(Sea surface temperatures in the range of 29 to 31 C or 1-2 C above average have helped to fuel Haima and Sarika’s extreme intensity. Unfortunately for the Philippines, waters warm just off shore as these storms have approached — providing a lift to storm strength just prior to landfall. Image source: Earth Nullschool.)
Haima is expected to make landfall in the northern Philippines late on the 19th as a super-typhoon packing 155+ maximum sustained winds, severe rains and an extreme storm surge. Very warm waters in the range of 30 degrees Celsius and low wind shear in Haima’s path also add the possibility for continued strengthening in the 24 hours prior to landfall. As such, this is a very dangerous situation and all interests along the path of this terrible storm should monitor its progress closely and heed any evacuation warnings issued by emergency officials.
It’s September in the Arctic, a time of year when temperatures should be cooling off. But with sea ice at second-lowest levels on record in most monitors and the globe experiencing an unprecedented hot year, it appears that the next week may see the Arctic Ocean reverse its typical seasonal cooling trend and significantly warm up over the coming five to six days.
(GFS model runs show a significant warming is in store for the Arctic Ocean over the coming week — and that’s bad news for sea ice running at second-lowest levels on record in the current daily measures and lowest levels on record for the first eight months of the year so far. Image source: Climate Reanalyzer.)
GFS model runs show a strong pulse of warm air will rise up over the Atlantic Ocean and Barents Sea in the next 72 hours. This warm air then will ride in over the Greenland Sea and invade the Arctic Ocean north of Svalbard. Local temperatures over water are expected to be between 4 and 8 degrees Celsius above average over a broad region of the Arctic. Meanwhile, general departures for the entire region above 66° North Latitude are expected to hit around 2 to 2.5 C above average.
Temperatures for most of the Arctic basin in ice-covered areas are expected to again push to -2 C to +2 C. Generally, air temperatures below -2 C are needed to prevent melt, but in warm water and rough ocean conditions, which have tended to dominate the Arctic recently, air temperatures probably need to average around -4 to -6 C over most of the Arctic to fully halt melt.
Threats to Ice Coming From All Directions
During summer and early fall, the Arctic Ocean tends to help to moderate temperatures over the region, so these are very high predicted temperature departures for this time of year. Such high temperatures are likely due to the effect of added heat bleeding off recently ice-free waters. While sea-ice area and extent measures are in the range of second-lowest on record, there is some indication that sea-ice concentration in the Arctic may be at or near record-low levels.
(AMSR2 animation constructed by Neven shows vigorous ice export and melt through the Canadian Arctic Archipelago. This is a heavy blow to the thin veil of multi-year sea ice remaining in the Arctic. Animation by Neven at the Arctic Sea Ice Forum. Images by Universität Bremen.)
The ice, generally, is extraordinarily weak, thin and dispersed. Large gaps run across an arc covering the Atlantic and Siberian side of the polar zone. In addition, large cracks are appearing in the very thin and unstable multi-year ice north of Greenland (below) as sea-ice export now threatens melt in the Beaufort Sea, Canadian Arctic Archipelago, the Nares Strait, the Fram Strait, and on into the northern edge of the Barents Sea.
Risks Rise for a Long Melt Season
Recent animations by Neven over at the Arctic Sea Ice Forum (above) show particularly strong export and melt in the Canadian Arctic Archipelago — which is a pretty unprecedented melt feature. What this means is that the ice is basically being hit from all sides and that the factors necessary to melt ice are compounding.
(Large section of multi-year ice breaking up north of Greenland on September 9, 2016. In recent years, less and less ice has survived summer melt to make it to the following winter. Ice with an age of more than five years has grown quite scant in the Arctic. The ice shown breaking up in the above image is part of the last bastion of old, thick ice in the Arctic. When that’s gone, the Arctic Ocean will only be a seasonally frozen sea, a possibility that may occur as soon as 2017 to 2025 and will probably occur before 2035. Image source: LANCE MODIS.)
If the big warm-up does occur as predicted this week, there is risk that ice losses will extend through to September 15 and possibly beyond. These melt rates should not be particularly severe, given the time of year, but it is possible that 50,000 to 300,000 square kilometers or more will go. This would be enough to solidify 2016 as the second-lowest year on record for extent and area at the end of melt season. It would also help to fill the big gap between 2007 and 2012 — solidifying already significant decadal melt trends.
Overall, this is a pretty weird forecast, but set in the backdrop of a year that’s on track to be about 1.2 C above 1880s averages — the hottest year on record by far — the possibility of a late-season Arctic warm-up and a late end to a near record melt season is an entirely valid one.
Back in 2005, and again in 2010, the vast Amazon rainforest, which has been aptly described as the world’s lungs, briefly lost its ability to take in atmospheric carbon dioxide. Its drought-stressed trees were not growing and respiring enough to, on balance, draw carbon out of the air. Fires roared through the forest, transforming trees into kindling and releasing the carbon stored in their wood back into the air.
This summer, a similar switch-off appears to be happening again in the Amazon. A severe drought is again stressing trees even as it is fanning wildfires to greater intensity than during 2005 and 2010. Early satellite measures seem to indicate that something even worse may be happening — the rainforest and the lands it inhabits are now being hit so hard by a combination of drought and fire that the forest is starting to bleed carbon back. This gigantic and ancient repository of atmospheric carbon appears to have, at least over the past two months, turned into a carbon source.
(High levels of carbon dioxide, in the range of 410 to 412 parts per million, and methane in the atmosphere over the Amazon rainforest during July and August of 2016 is a preliminary indicator that the great forest may be, for this period, acting as a carbon source. Image source: The Copernicus Observatory.)
Carbon Sinks Can’t Keep Up
Though the story of human-forced climate change starts with fossil-fuel burning, which belches heat-trapping carbon dioxide into the atmosphere, sadly, it doesn’t end there. As that burning causes the Earth to heat up, it puts stress on the places that would, under normal circumstances, draw carbon out of the atmosphere. The carbon-absorbing oceans, boreal forests, and great equatorial rainforests all feel the sting of that heat. This warming causes the oceans to be able to hold less carbon in their near-surface waters and sets off droughts and fires that can reduce a forest’s ability to take in that carbon.
In the context of the global cycle of carbon entering and being removed from the Earth’s atmosphere, oceans and large, healthy forests serve to take in greenhouse gasses. We call these carbon sinks, and throughout the past 10,000 years of our current epoch, the Holocene, they’ve helped to keep these gasses, and by extension, Earth’s temperatures, relatively stable.
(Without the ability of forests, soils and oceans to take in carbon — to act as carbon sinks — global atmospheric CO2 would have already risen well above 500 parts per million by 2009 due to fossil-fuel burning. These sinks are a helpful mitigating factor to the insult of human carbon emissions, but if they become too stressed, they can become sources of carbon instead. Image source: IPCC/CEF.)
However, for a long time now human fossil-fuel emissions have far exceeded the ability of the world’s carbon sinks to draw in excess carbon and keep greenhouse gas levels stable. Though these sinks have taken in more than half of the great volume of carbon emitted from fossil-fuel burning, the total portion of heat-trapping CO2 has risen from 280 ppm to more than 400 ppm. The oceans acidified as they strained beneath the new carbon overburden. And the forests took in this carbon even as they fought off expanding deforestation. As a result of all the excess carbon now in the atmosphere, the Earth has warmed by more than 1 degree Celsius above 1880s levels. And combined with the already strong stress imposed by clear-cutting and slash and burn agriculture, the added heat is a great strain on an essential global resource.
Global Warming Causes Carbon Sinks to Switch Off, or Worse, Turn into Sources
In this tragic context of heat, drought, ocean acidification and deforestation, it appears that the grace period that the Earth’s carbon sinks have given us to get our act together on global warming is coming to an end. Heating the Earth as significantly as we have is causing these sinks to start to break down — to be able to draw in less carbon, as was the case with the Amazon rainforest in 2005 and 2010. At these points in time, the sink was carbon-neutral. It was no longer providing us with the helpful service of drawing carbon out of the atmosphere and storing it in trees or soil. But, more ominously, in 2016, it appears that the Amazon may also to be starting to contribute carbon back to the atmosphere.
(High surface methane readings over the Amazon in excess of 2,000 parts per billion is a drought and wildfire signature. It is also a signal that the rainforest during this period was emitting more carbon than it was taking in. Image source: The Copernicus Observatory.)
After each of these brief periods of failing to draw down carbon in 2005 and 2010, the Amazon carbon sink switched back on and began to function again for a time. But by 2015 and 2016, record global temperatures had again sparked a terrible drought in the Amazon region. According to NASA officials, the new drought was the worst seen since at least 2002 and was sparking worse fire conditions than during 2005 and 2010 — the last times the Amazon’s carbon sink switched off. In July of 2016, the Guardian reported:
“Severe drought conditions at the start of the dry season have set the stage for extreme fire risk in 2016 across the southern Amazon,” Morton said in a statement. The Brazilian states of Amazonas, Mato Grosso, and Pará are reportedly at the highest risk.
Per NASA’s Amazon fire forecast, the wildfire risk for July to October now exceeds the risk in 2005 and 2010 — the last time the region experienced severe drought and wildfires raged across large swaths of the rainforest. So far, the Amazon has seen more fires through June 2016 than in previous years, which NASA scientists said was another indicator of a potentially rough wildfire season.
(Extensive wildfires over the southern Amazon and Brazil coincide with apparent atmospheric methane and CO2 spikes. Indicator that the Amazon carbon sink is experiencing another period of failure. Image source: LANCE MODIS.)
At the same time that drought and related wildfires were starting to tear through the Amazon, atmospheric carbon monitors like the The Copernicus Observatory were picking up the signal of a carbon spike above the Amazon with methane levels higher than 2,000 ppb (which is often a drought and wildfire signature) and carbon dioxide levels in the range of 41o to 412 ppm. It was a spike comparable to those over industrial regions of the world like eastern China, the U.S. and Europe.
In context, these Amazon carbon spikes are occurring at a time of record atmospheric CO2 increases. For the first seven months of 2016, the average increase in CO2 versus 2015 was 3.52 ppm. 2015’s overall rate of CO2 increase in the range of 3.1 ppm year-on-year was the fastest annual increase ever recorded by NOAA and the Mauna Loa Observatory. So far this year, the rate of atmospheric gain in this key greenhouse gas is continuing to rise — this in the context of carbon spikes over a region that should be drawing in CO2, not spewing it out.
From March 25th through June 26th, sea ice extent measures, as provided by Japan’s Arctic data system were in record low ranges. In other words, for about a quarter of a year, and according to this monitor, the Arctic Ocean and its surrounding estuaries have witnessed the lowest ice coverage ever measured for any similar period since record keeping began in the 1979.
This new period of extreme sea ice record lows comes during a time of continuous decadal sea ice losses. Average sea ice coverage for each successive ten year period since the 1980s during the March through June period has fallen by about 400,000 to 500,000 square kilometers. For 2016, the new record lows widened this gap to more than 2 million square kilometers — or a surface area of sea ice coverage lost roughly equivalent the size of Greenland.
Winter/Spring Heat The Driver of New Record Lows This Year
Overall, these losses were driven by an extraordinary warming of the Arctic that has extended and intensified over these time periods. A warming that has itself been forced upon the Arctic by human greenhouse gas emissions which are, for the largest part, the result of fossil fuel burning. This year, the Arctic experienced new record warmth during a Winter that included odd periods when North Pole temperatures rose briefly above freezing.
Alaska, a microcosm of this building Arctic heat, experienced its second warmest winter on record — which was then immediately followed by its warmest spring ever recorded. Across the state, it was warmer than normal pretty much everywhere and mostly all the time.
According to this 25 Alaska city composite index (provided by Climatologist Brian Brettschnieder above) every day but two through June 30 of this year saw above normal temperatures in the related regions. Yet another pretty clear indication that there’s nothing normal about Arctic or near Arctic temperatures these days.
Closer to the 2012 Line But Still in Record Low Range
All this extreme Arctic heat during Winter and Spring was probably the major contributor to new record low sea ice extents continuing for more than three months running. However, storms over the Arctic Ocean have since moderated temperatures into closer to normal ranges for June even as these weather systems’ circulatory patterns have tended to spread the ice out. As a result, rapid rates of melt slowed somewhat into June and the extent monitor has crossed the 2010 line, coming closer to the 2012 line in the JAXA measure, while flipping back and forth over the 2012 line in other major measures (NSIDC).
(Arctic storm churns through the East Siberian and Laptev seas of the Arctic Ocean on July 1 of 2016. Sea ice measures are currently near new record lows, but a steep rate of decline will be required to challenge or break with 2012. Image source: LANCE MODIS.)
The upshot is that the sea ice state during early July doesn’t look quite as bad as it did during late May and early June. Chances for a blue ocean event in which Arctic sea ice volume exceeds an 80 percent loss since the late 1970s, in which sea ice extent falls below 1.5 million square kilometers, or sea ice area falls below 1 million square kilometers seems less likely by end Summer at this time. Such an event would now likely require some rather severe Summer weather episodes including strong highs over the Central Arctic and/or very strong late summer lows pushing heavy swells into the Central Arctic Basin. That’s not to say we shouldn’t be on the lookout for strong negative sea ice departures over the next few months — which are certainly still possible. And given the current trend, 2016 remains in a position to hit near or below 2012 records by end Summer.
(Disclaimer — The views and analysis expressed in this blog are my own. The related analysis is an exploration of current trends and possible future climate states informed by my own best assessment of the science. In no way is this analysis meant to be misconstrued as an absolute authoritative final word on sea ice states. For example, we cannot say with absolute certainty that any one of the following — new record lows, blue ocean events, or a failure to hit new record lows — will happen. As such, the analysis should instead be viewed as a middle-certainty forecast informed by current trends. Further scientific opinion and informed discussion on the issue is welcome.)
(NASA predicts that 20-30 year droughts in the US West will become 80 percent more likely due to human-forced warming. For Lake Mead, the reality of mega-drought appears to already be settling in.)
But these record hot days are just the most recent of many for the river and its water. For over the past 16 years the Colorado River has been assailed by drought. A new kind of mega-drought that has almost certainly been spurred by a human-forced warming of the world. A condition of endemic drying that will likely continue to worsen for the foreseeable future.
Lake Mead Approaching Mandatory Rationing Levels
1072.24 feet — that’s the water level for Lake Mead as of June 21, 2016. It’s about 3 feet below the 1075 mark breached for the first time in the reservoir’s history last year. And if Lake Mead remains below that line by the end of this year, it will mean mandatory cuts to Arizona and Nevada’s water supply.
That could happen either this year (2016) or next (2017) and will almost certainly happen by 2018. In fact, the US Bureau of Reclamation predicts a 64 percent likelihood that Lake Mead will not only remain below the 1075 foot level by 2019, but that it will plunge to as low as 1025 feet at that time.
(Lake Mead may average near or below the 1075 line requiring mandatory cuts in water supplies to Arizona and Nevada this year. Image source: Lake Mead Water Level.)
This level is only 125 feet above Lake Mead’s dead pool line of 900 feet. And hitting such a low water level would result in mandatory water cuts all up and down the Colorado River Basin.
Lake Mead supplies water to 25 million people in Nevada, Arizona, and California. 19 million of these people reside in California alone. And according to the 1922 Colorado River Compact, California retains senior rights to the river’s water supply. What this means is that when there’s a shortage, Nevada and Arizona have to take the first hits. And that’s bad news for the six million people and related industries supported by the river in this region. It means that if the 16 year drought along the Colorado River basin continues — and that will likely be the case due to impacts related to human-caused climate change — then water rationing is almost certain to take effect in Arizona and Nevada over the next few years.
(Weather systems that bring rain to the US Southwest are becoming more rare. Scientific studies indicate that this condition is caused by human forced climate change and will continue to worsen this Century if fossil fuel burning and human based carbon emissions do not halt soon. Image source: Climate Central.)
If the climate change driven drought continues and Bureau of Reclamation forecasts are correct, then hitting 1025 feet at Lake Mead by 2019 to 2022 will result in The Department of the Interior stepping in to take control of Lake Mead’s water management. At that point, all bets are off even for California — which would likely then see a 10 percent reduction in the water provided to it by Lake Mead.
(If you thought the current drought was bad, then this animation will knock your socks off. Loss of soil moisture for the US is ridiculously extreme under business as usual fossil fuel burning in this NASA projection.)
As you can see in the NASA soil moisture prediction measure above, this added heat due to climate change is expected to make currently bad drought conditions absolutely terrible over the coming decades. NASA notes that reductions in fossil fuel emissions help to blunt the intensity of the coming droughts, but that worsening drought conditions will still occur. Considering the current state of Lake Mead and the Colorado River basin, we are likely to see worsening water cuts to communities across the Southwest as climate change related heat and drought conditions worsen.
Loss of water from snow melt in the Himalayas, increasing temperatures and instances of drought over the food-producing plains, and a potential endemic weakening of the annual monsoonal rains. These are all climate change related impacts that appear to be settling in over India as global temperatures consistently begin to hit levels higher than 1 C above 1880s values. Impacts that are setting up conditions for sustained and increasingly severe droughts and heatwaves.
(Most of India baked under a severe heatwave yesterday [April 11] as the number of lives lost to heat stroke mounted and a water train was dispatched to far-flung drought-stricken regions. Image source: Earth Nullschool.)
Overall impacts are quite widespread. Ranchi, the capital of Jharkhand has declared a water emergency. And the Ganges River is now so low that it is unable to provide water to cool one of the largest coal-fired electrical power stations in West Bengal — forcing it to suspend operations.The great river is dramatically shrunken — causing islands of mud to emerge even as pollutants concentrate in its thinning thread. A diminishing flow that India’s 1.3 billion people rely on for much of their water. It’s a greater crisis so extreme that late last month one of BBC’s India correspondents asked — is this the worst water crisis India has ever faced?
Stronger Monsoon for 2016? Or Will A Warming Globe Dim India’s Hopes For Rain?
Reports from India’s Meteorological Division have called for a normal to above normal monsoon to provide replenishing rains this year. However, monsoonal predictions over the past two years were overly optimistic, which is cause for caution over last week’s forecast.
Overall, the early extreme record heat and drought over India provides a barrier to any influx of monsoonal moisture. In addition, El Nino conditions — possibly hanging on in the Central Pacific through June — may help to dull or delay monsoonal development even as a predicted progression to La Nina later in the year provides some hope for additional moisture during late Summer and Fall. A switch to rains that may well be quite intense for some regions given the unprecedented atmospheric moisture content as a result of record high global temperatures.
If it seems we are doing a never-ending marathon of hottest posts, it’s simply because the world right now is ridiculously hot. Hotter than at any time ever seen before and being driven inexorably hotter by a combination of human greenhouse gas emissions and what appears to be a global warming weirdified El Nino that doesn’t look anything like a normal El Nino, but instead shows up as an intense blob of extreme heat sitting in a massive hot blob that makes up pretty much all of the Pacific Ocean from the Equator on north.
(With one month remaining in the December-through-November climate year, global temperature averages for the first 11 months of 2015 are now +0.819 C above the 1950-1981 NASA baseline. With November also likely to come in between +0.90 and +1.1 C hotter than normal, the 2015 yearly average is likely to come in well above the top of the chart. Image source: NASA GISS.)
Taking a glimpse at NASA’s Land-Ocean Temperature Index (LOTI), we find that October of 2015 came in at an extraordinary +1.04 C hotter than the 1950 to 1981 average or about 1.26 C hotter than 1880s averages. That’s an extreme temperature departure hitting within 0.74 C of the so-called safe limit of 2 C warming set by the UN. To put into perspective how weird and scary it is to hit such a high temperature departure, the last time temperatures were so high globally for any period of note, sea levels were between 10 and 30 feet higher than they are today. It’s another unfortunate passing of another bad climate marker on the way toward worse and worse to come if we can’t manage to stop emitting so much carbon into the atmosphere.
Moving on to NASA’s geospatial temperature anomalies map for the month of October, we see that much of the abnormal heat remains centered at the Poles. This despite a Godzilla El Nino belching hot air into the Equatorial region and pushing a strongly positive Arctic Oscillation. High polar temperature anomalies are an odd result during powerful El Nino periods due to the fact that warming at the Equator tends to strengthen the Polar wind field, locking cold into the upper and lower Latitudes. But over the past two months, Polar temperatures have remained extremely high despite what looks like the most powerful El Nino ever recorded tearing its way through the Pacific.
(This is what a record hot world looks like in NASA’s global temperature anomalies map. Note both the heat at the Poles and Equator along with the melt and ocean heat uptake related cool pools in the North Atlantic and Southern Ocean. Image source: NASA GISS.)
With such high polar temperatures giving what amounts to an atmospheric back-hand to the strongest El Nino on record, it’s a sign that a raging greenhouse gas driven polar amplification is becoming ever more heavily entrenched. The poles, in short, are more sensitive to global temperature swings and tend to amplify any overall warming or cooling trend. Such an additional sensitivity is due to a number of unique feedbacks that come into play in the upper Latitudes as greenhouse gas levels and global temperatures rise or fall. A circumstance that was predicted in even the earliest global climate model runs forecasting the impacts of a human forced heating of the Earth System. And it appears that this feedback-generated added warming is starting to take hold with a vengeance.
Overall, we find the highest temperature deltas in the Arctic Ocean just north of the Kara Sea, over various regions of the far South Antarctic, and over Central and Western Australia. These regions ranged into an extreme +4 to +5.1 C positive anomaly for the month. Broader warm regions featuring +2 to +4 C above average temperatures surrounded these hot zones. Strong warm temperature departures in this range also held sway over the Eastern Equatorial Pacific El Nino hot spot, over a band from North Africa through the Middle East, over the Lake Baikal region of Russia, and over South Africa.
Equator-to-Pole heat transport — another feature we really don’t like seeing — also remained plainly visible in the October NASA anomalies graphic. Two slots of warm air transport into the northern polar zone show up clear as day in the above graphic — one maintaining over Western North America and another holding sway over Northeastern Asia.
Somewhat cool regions include the heat sink zone in the Southern Ocean, the tip of South America, Eastern Europe, and the ominous Greenland melt related cool pool in the North Atlantic (something we also really don’t want to see). Overall, most of the world showed above average readings with cooler regions increasingly isolated on the NASA map.
(Zonal anomalies map shows a strong polar amplification despite El Nino. Image source: NASA GISS)
At last coming to the zonal anomalies graphic, we again observe a very strong polar amplification for the month of October. Here we note that the highest global temperature anomalies occur at both the South and North Poles. These extreme temperature spikes in the range of +3.3 to +3.5 C above average for the month are plainly visible in the upward tilting ‘devils horns’ (another unfortunate climate change indicator) at both the left and right border of the graph. As we move toward lower Latitudes, temperature departures rapidly fall off into the global cool and stormy zones between 50 and 60 North and South Latitudes. Anomalies then steadily climb to an El Nino-warmed Equatorial region (+1.2 to +1.4 C).
November of 2015 Also Likely to Test New Records
Looking toward November, early indications are that both the record or near-record global surface temperatures and the tendency for polar amplification continue. Land and ocean temperatures appear to have extended their October jump into new record ranges. El Nino, which under the regime of human-forced warming has often nudged global temperatures toward ever-hotter extremes, likely pushed sea surface temperatures to new all-time highs in the Equatorial Pacific for the month. Such a huge amount of heat bleeding off this broad ocean zone will likely to continue to spike global surface temperatures. Given such a context, it appears that we’ll be under the gun for new global surface temperature records for a period of at least the next 4 months. So what we saw during October was almost certainly just the start of the current global temperature spike.
This is not something that is normal for typically ice-choked Barrow, Alaska. Today, 25 to 35 mile per hour winds and fetch-driven, 10-15 foot high waves are breaking through coastal barriers and flooding the streets and homes of a town that is used to far more placid seas.
(Recently, Barrow city officials had a barrier of sand erected to protect structures from the newly ice liberated waters of the Beaufort Sea. Today, a strong coastal low pressure system’s surf smashed that barrier, flooded the coastal road, broke a channel through to an inland lake, and swamped numerous structures. Image source: Barrow Sea Ice Webcam.)
* * * * *
There’s been quite a lot of potential storm energy building in the Beaufort Sea this season. Nearby waters in the Chukchi have ranged between 3 and 5 degrees Celsius above average. Warmth, moisture and low pressure systems have flooded in from the Pacific off the back side of the Ridiculously Resilient Ridge to the south. It was a pool of warmth and heat just waiting for a trigger.
As August swung toward September, the near polar regions began to cool even as the Summer sun retreated. Temperature differentials between ice free sections of the Chukchi and Beaufort and remaining ice covered regions in the Central Arctic Basin hit new extremes. And, yesterday, a strong low pressure system began to develop off the Northern Alaskan coast (see video of yesterday’s building surf here).
(Fifteen foot waves north and west of Barrow, Alaska as detected by Earth Nullschool at 2:05 PM EST on August 27th. Image source: Earth Nullschool.)
In response, Alaska weather forecasters yesterday issued a High Surf Advisory. They probably should have issued a Coastal Flood Warning instead. For by today, the low had intensified to a 985 mb system. It has wrapped its left side in 35-45 mph winds and 10-15 foot seas. Seas that are now ripping large holes through coastal barriers erected to protect Barrow from a newly ice-liberated and storm-tossed Arctic Ocean.
High waves and surging seas are expected to persist, and possibly intensify, over the next 12-24 hours for Barrow. So currently observed coastal flooding may continue to worsen through tonight and tomorrow.
Coastlines Newly Vulnerable to Open Water Storms
The Northern Alaskan Coastlines, as with many Arctic shores, are used to typically placid or ice-locked waters. In the past, when sea ice dominated the Arctic Ocean during Summer, there were few open stretches of water available for a storm to generate fetch. Now, vast regions of Arctic Ocean remain open for long periods during July, August and September. In addition, with high amplitude waves in the Jet Stream delivering so much heat and moisture from more southerly regions, the late Summer and early Fall Arctic is increasingly primed for storms.
The result is strong storms running through open waters and generating powerful surf. Surf that is aimed at gently sloping beaches and low elevation coastlines with few natural barriers to protect against waves and storm surge. It’s a new vulnerability that today, for Barrow, resulted in a storm riled and ice free Arctic Ocean surging into streets, roadways and homes. Another climate change related situation that is new — if not at all normal.
From the satellite shot, it appears as though Lake Baikal is burning…
(Massive wildfires surrounding Lake Baikal spew huge columns of smoke into the air masking the lake and sending off thousand-mile long clouds of gray from the burning forests and permafrost. Image source: LANCE MODIS.)
* * * * *
Lake Baikal. A great 350 mile long body of water sitting amidst the lands of southeastern Siberia. It’s the largest reservoir of fresh water in the world. From the satellite eye floating far above, it usually appears as a graceful splash of blue among the green hills and plains of summertime.
But today, this enormous lake is almost completely shrouded by smoke. Not a hint of blue. All is steely gray from the smokes vomited out by permafrost and forest fires surrounding the lake. Fires that are old and long-burning. Fires that began back in April when locals reported instances where the dry land — likely thawed and dried out sections of permafrost and duff overburden — “burned like grass.”
A Russian Emergency
During mid-August, Russian Prime Minister Dmitry Medvedev helplessly vented his anger at Russian fire response authorities who seemed unable to deal with the disastrous blazes raging around Lake Baikal. He ordered Puchkov, a top Russian emergency response official, to “Fly there to deal with this…” while making a broader accusation that officials had been ‘complacent’ in dealing with the disaster. Medvedev added in his August 14 statement:
“Unfortunately, as usual in August we have a … number of problems. The situation this year is really hot when it comes to fires. This week fires [were] fought in Yakutia, near Gelendzhik in the Krasnodar region. Now in Siberia and the Far East large wildfires are blazing. [The] most difficult situation[s] [are] in the republics of Buryatia, Tyva, in the Irkutsk region, the TransBaikal region and the Chukotka Autonomous District.”
Contrary to Medvedev’s statement, facing off against large fires in August was not a typical situation for Russia. At least until about the mid 2000s when permafrost thaw began to really ramp up as human-forced warming of the climate provided extra heat and fuels for wildfire ignition. Since that time, Russia has been forced to deploy thousands of firefighters on a yearly basis.
It’s a problem extra resources alone will not be able to solve. For the burning comes due to added atmospheric heat thawing permafrost and providing billions and billions of tons of additional wildfire fuels by turning what was once ice into a peat-like under layer. This thawing creates an understory fuel for the fires spreading over large sections of Siberia. Now, trees will often burn all the way to the roots and the newly thawed land itself will burn to a depth of three feet or deeper. Even worse, some of these fires will continue to smolder beneath the snow and ice throughout Winter — only to explode over the land once again during Springtime.
Such is all-too certainly the case with the massive fires now surrounding and endangering Lake Baikal. Medvedev’s rants aside, it’s a situation that is now endemic to the thawing permafrost itself. One we will have to deal with and one whose outcomes we can only solve if we halt carbon emissions and bring Earth back into temperature ranges that are more natural to the Holocene.
A Threat to the Lake’s Water Supply
(‘The sky is aglow with uncontrolled burning.’ Lake Baikal residents sit helplessly by the waters edge as monstrous plumes of smoke blot out both sky and sun. Image source: The Siberian Times.)
Russians often call Lake Baikal ‘the Jewel of Siberia.’ It’s a jewel that contains 20 percent of all the fresh water on Planet Earth. So it’s understandable why they’re desperate to save it. But the massive fires, spewing out volcano-like plumes of smoke and ash, are, sadly, a threat to this beautiful and valuable resource. For, according to reports from Mikhail Slipenchuk — Russia’s deputy head of ecology and natural resources, near-shore burning wildfires can often cut off the lake’s water arteries. The result is a reduction of water flows to the lake and its ultimate diminishing.
Gulfs of Mexico, California Host Screaming Sea Surface Temperatures
As with so many recent heatwaves with the potential to produce mass casualty events, the story starts with sea surface temperatures in excess of 30 degrees Celsius (86 Fahrenheit). And across a broad region of the Gulf of Mexico and all throughout the Gulf of California ocean surface waters now feature temperatures in the range of 30 to 33 degrees C (86 to 91 F).
(A tell-tale pool of 30 C+ water is gathering in the Gulfs of Mexico and California. Such hot water is a support for deadly wet-bulb readings in the range of 30-33 C. Image source: Earth Nullschool.)
These are waters warmed by increasingly vicious human hothouse conditions. A world ocean facing a global fever that is 1 degree C (1.8 F) hotter than the more placid, less dangerous temperatures of 135 years ago.
In the Gulfs of Mexico and California, this heat has concentrated — pushing the waters there into 1-4 C above average ranges. Generating a dangerous reservoir of latent heat. One featuring ocean temperatures similar to those that kicked off heatwave mass casualty events in India, Pakistan, Japan and Egypt this summer. But this feature of the human hothouse is now focusing in on the Southern US — creating conditions that are increasing the risk of heat stress, heat injury and possibly loss of life.
The steaming waters of our southern gulfs will feed dangerously high wet bulb temperatures throughout a large region from the Carolinas to Florida through the Gulf States and on into the Southwest over the coming days and weeks. Ocean temperatures hot enough to support wet bulb readings in the range of 30 to 33 degrees Celsius. Dangerous levels very close to the maximum human threshold of 35 C.
NOAA Predicts Heat Indexes to Skyrocket
Concordantly, a similar measure used to determine how hot it feels outside is set to skyrocket throughout the southern US over coming days. In many regions heat indexes are predicted to exceed 100, 105, 115 or even 120 degree readings.
(Forecast heat index map for Monday, August 24. Over the next seven days, heat index values are predicted to remain in dangerous ranges across large sections of the Southern United States. Image source: NOAA.)
Regions at greatest risk include Southern California, Arizona, and the Gulf Coast states of Texas, Lousiana, Mississippi, Alabama, Georgia and Florida.
Heat index values in excess of 105 F (40 C) are considered dangerous. Those crossing a 127 F (53 C) threshold are considered exceedingly dangerous. The NOAA forecast now includes dangerous heat indexes predicted for the above regions lasting for at least the next seven days. And with sea surface temperatures likely to remain much hotter than average near the area of highest impact through the end of August, these high-risk heat conditions have the potential to continue for some time.


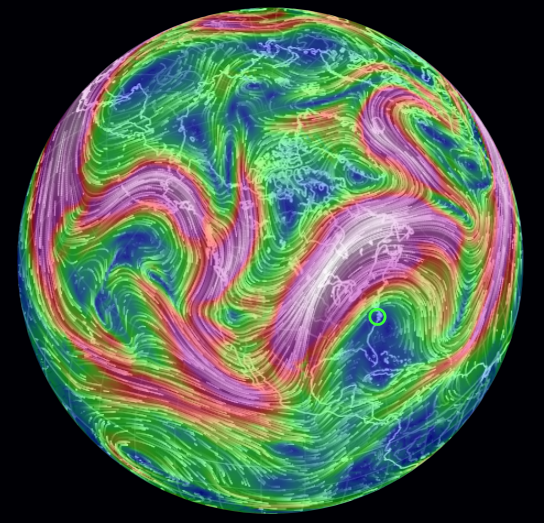


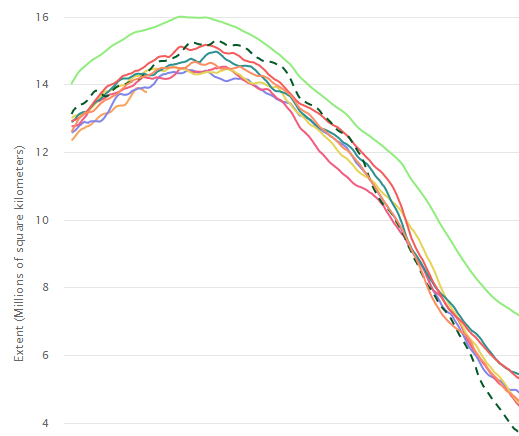


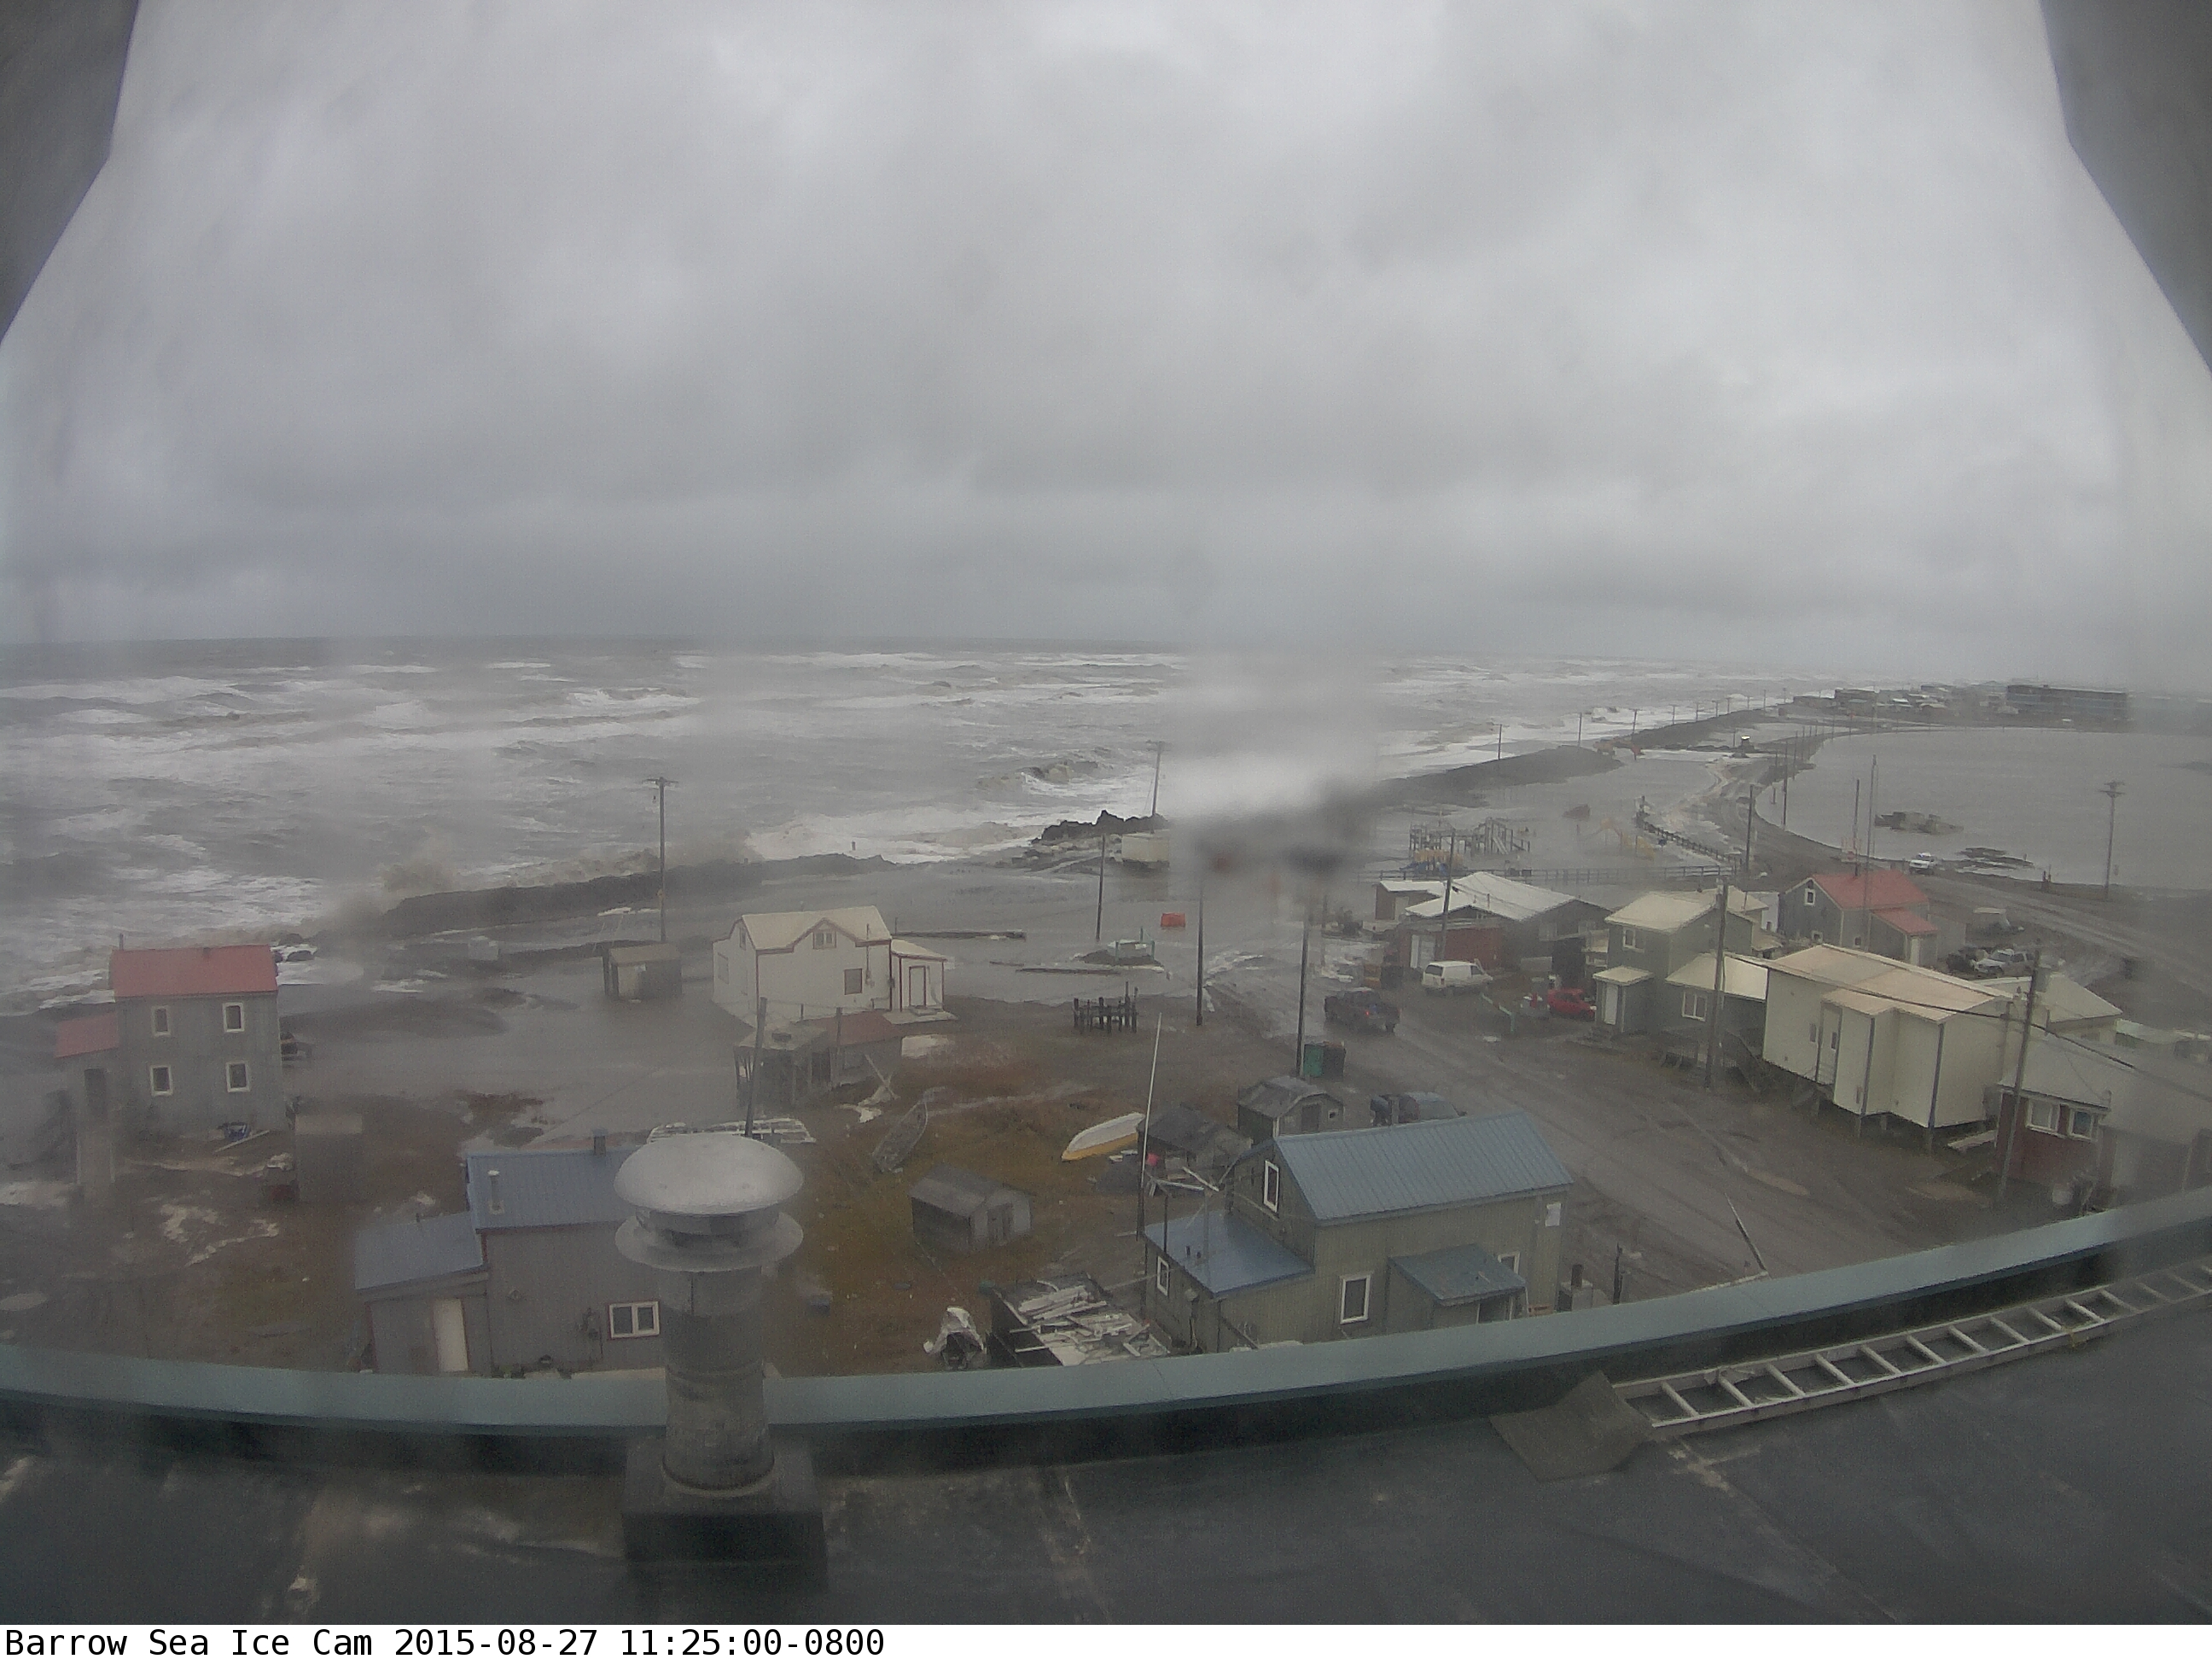
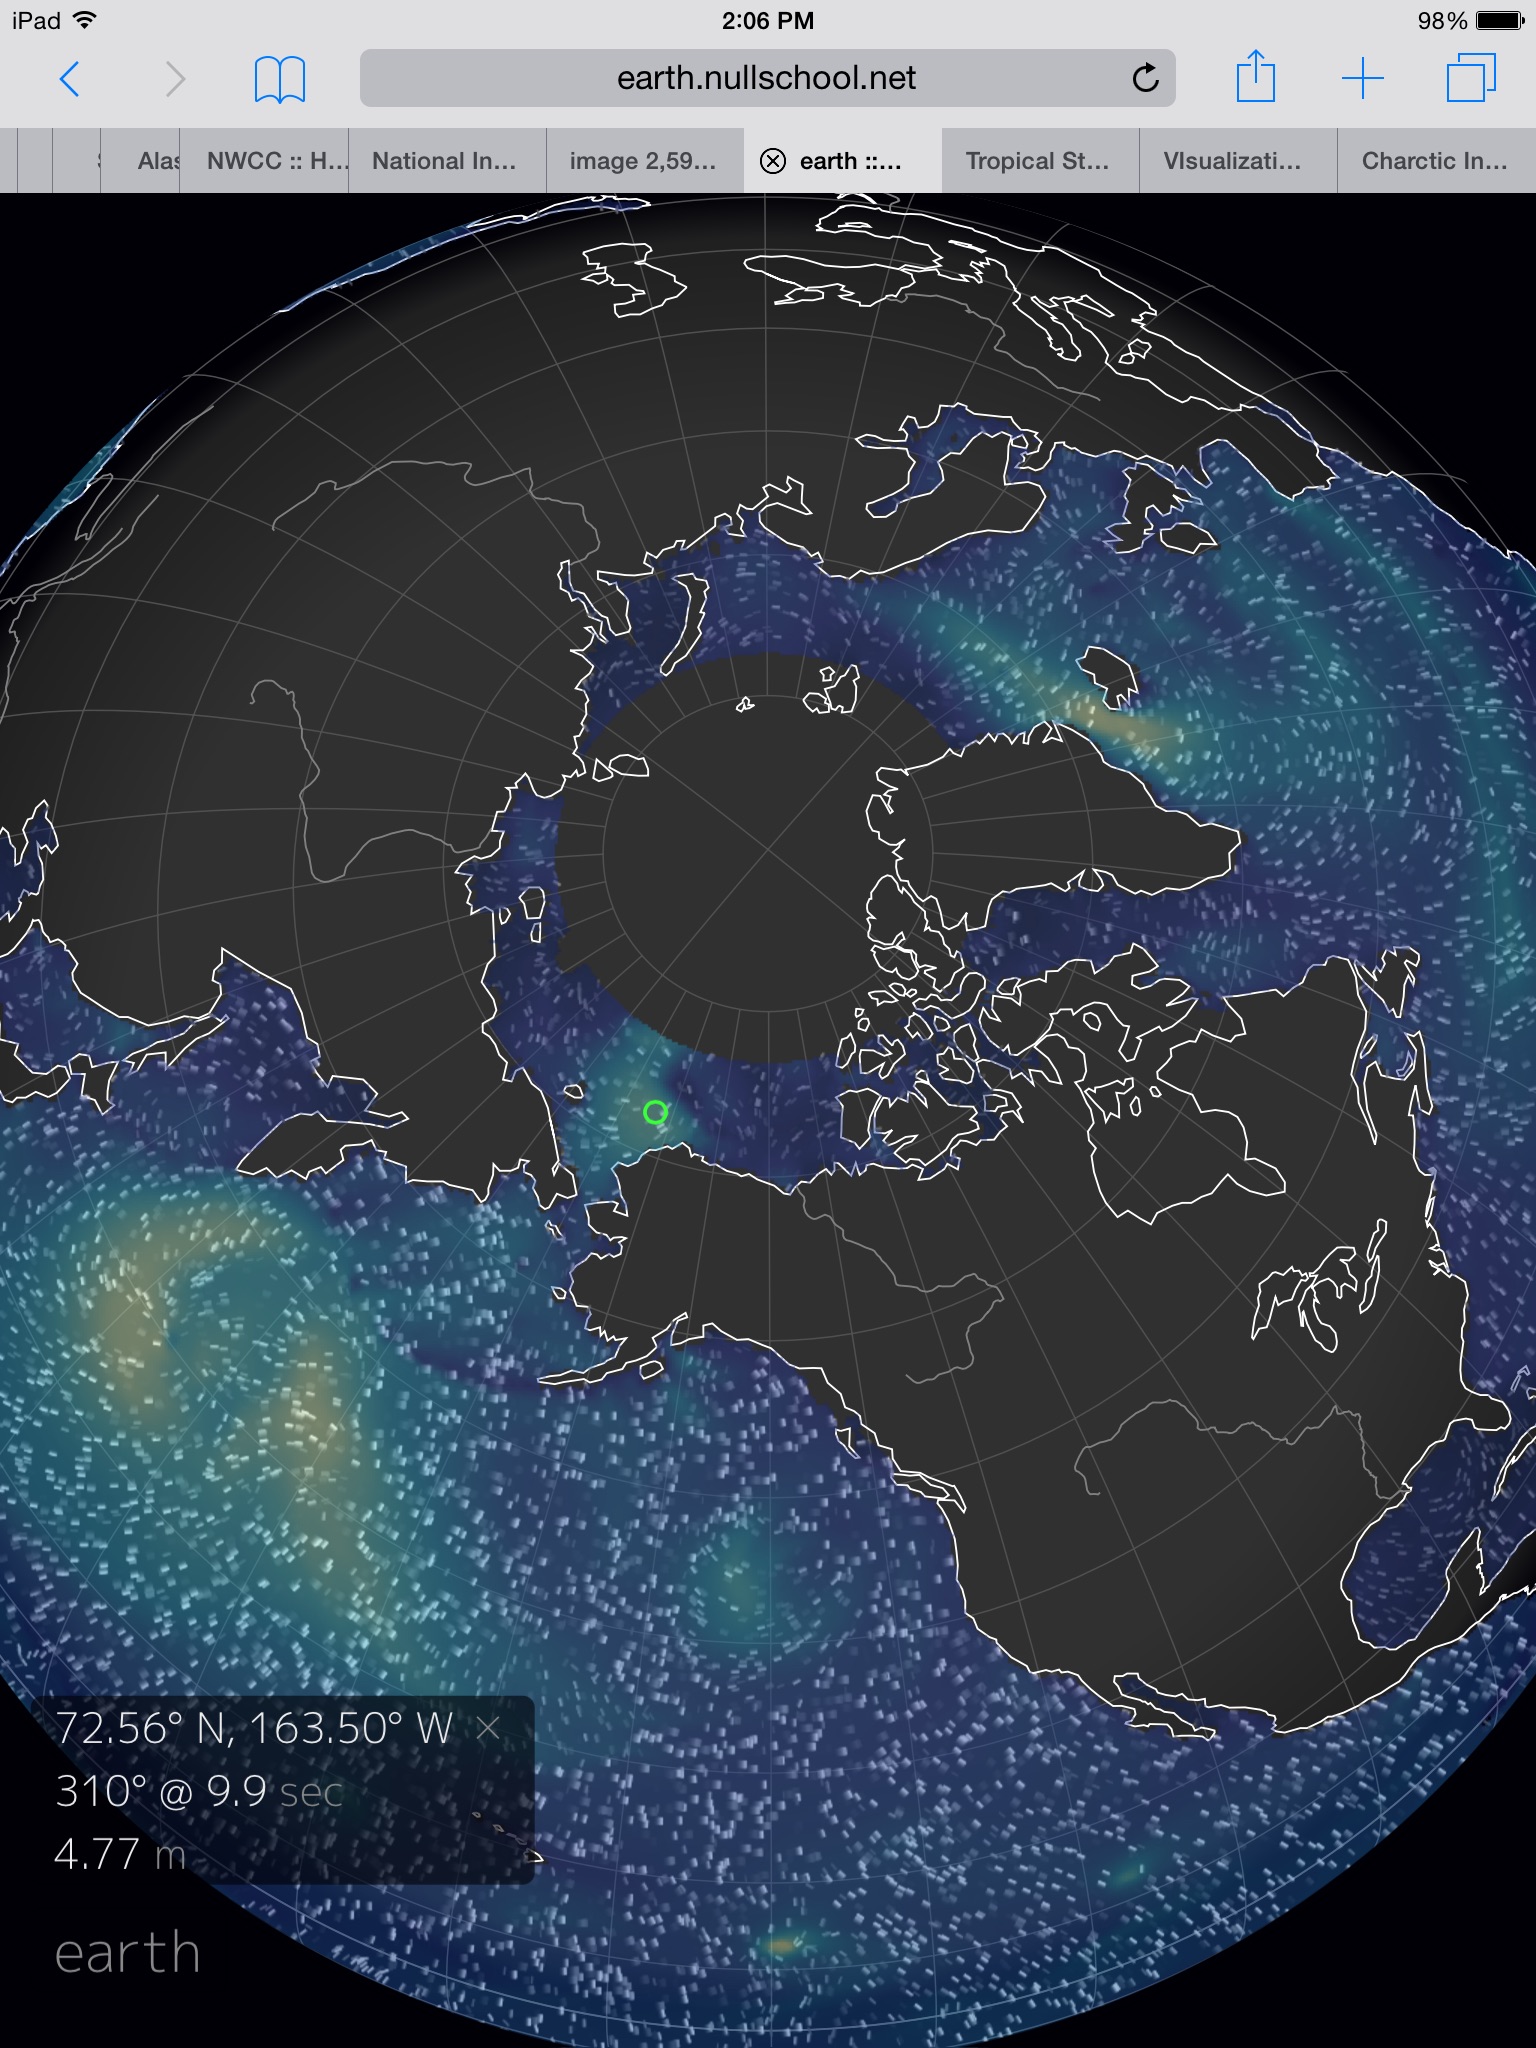

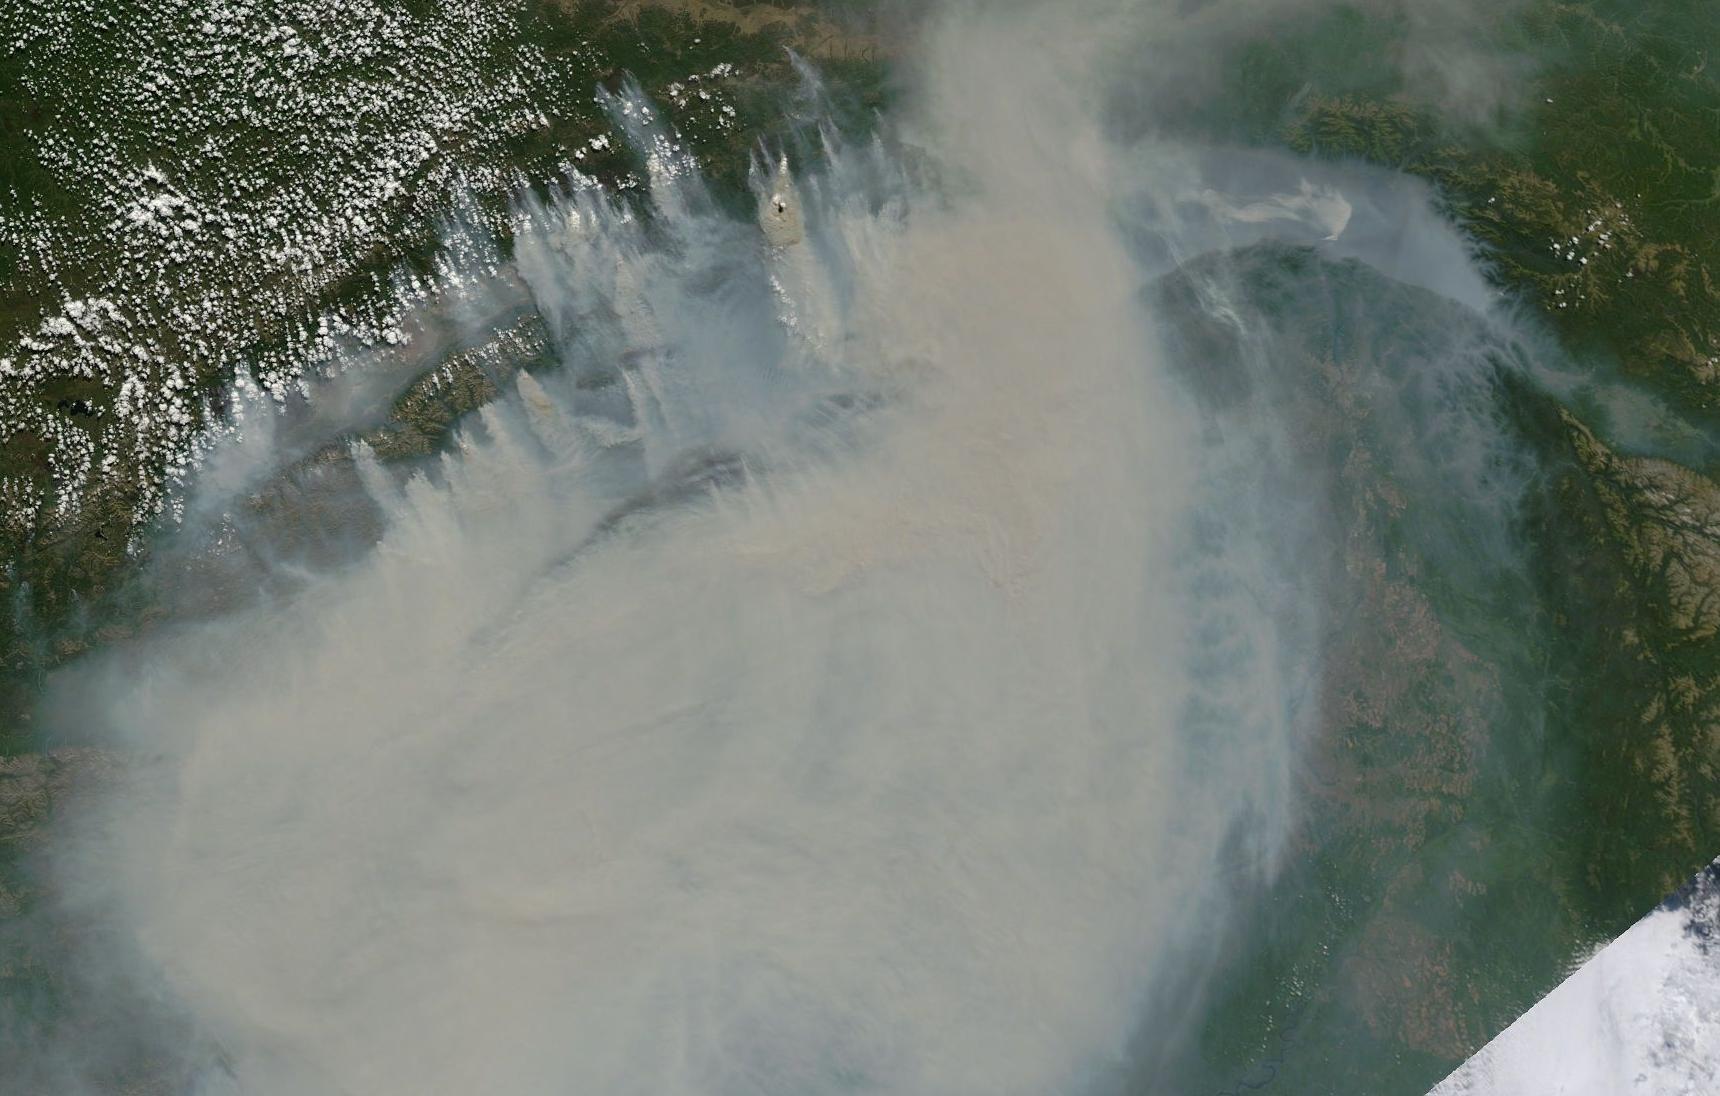
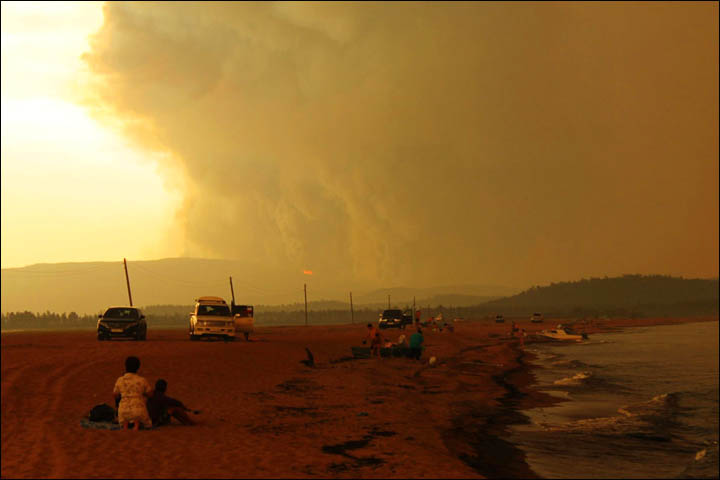

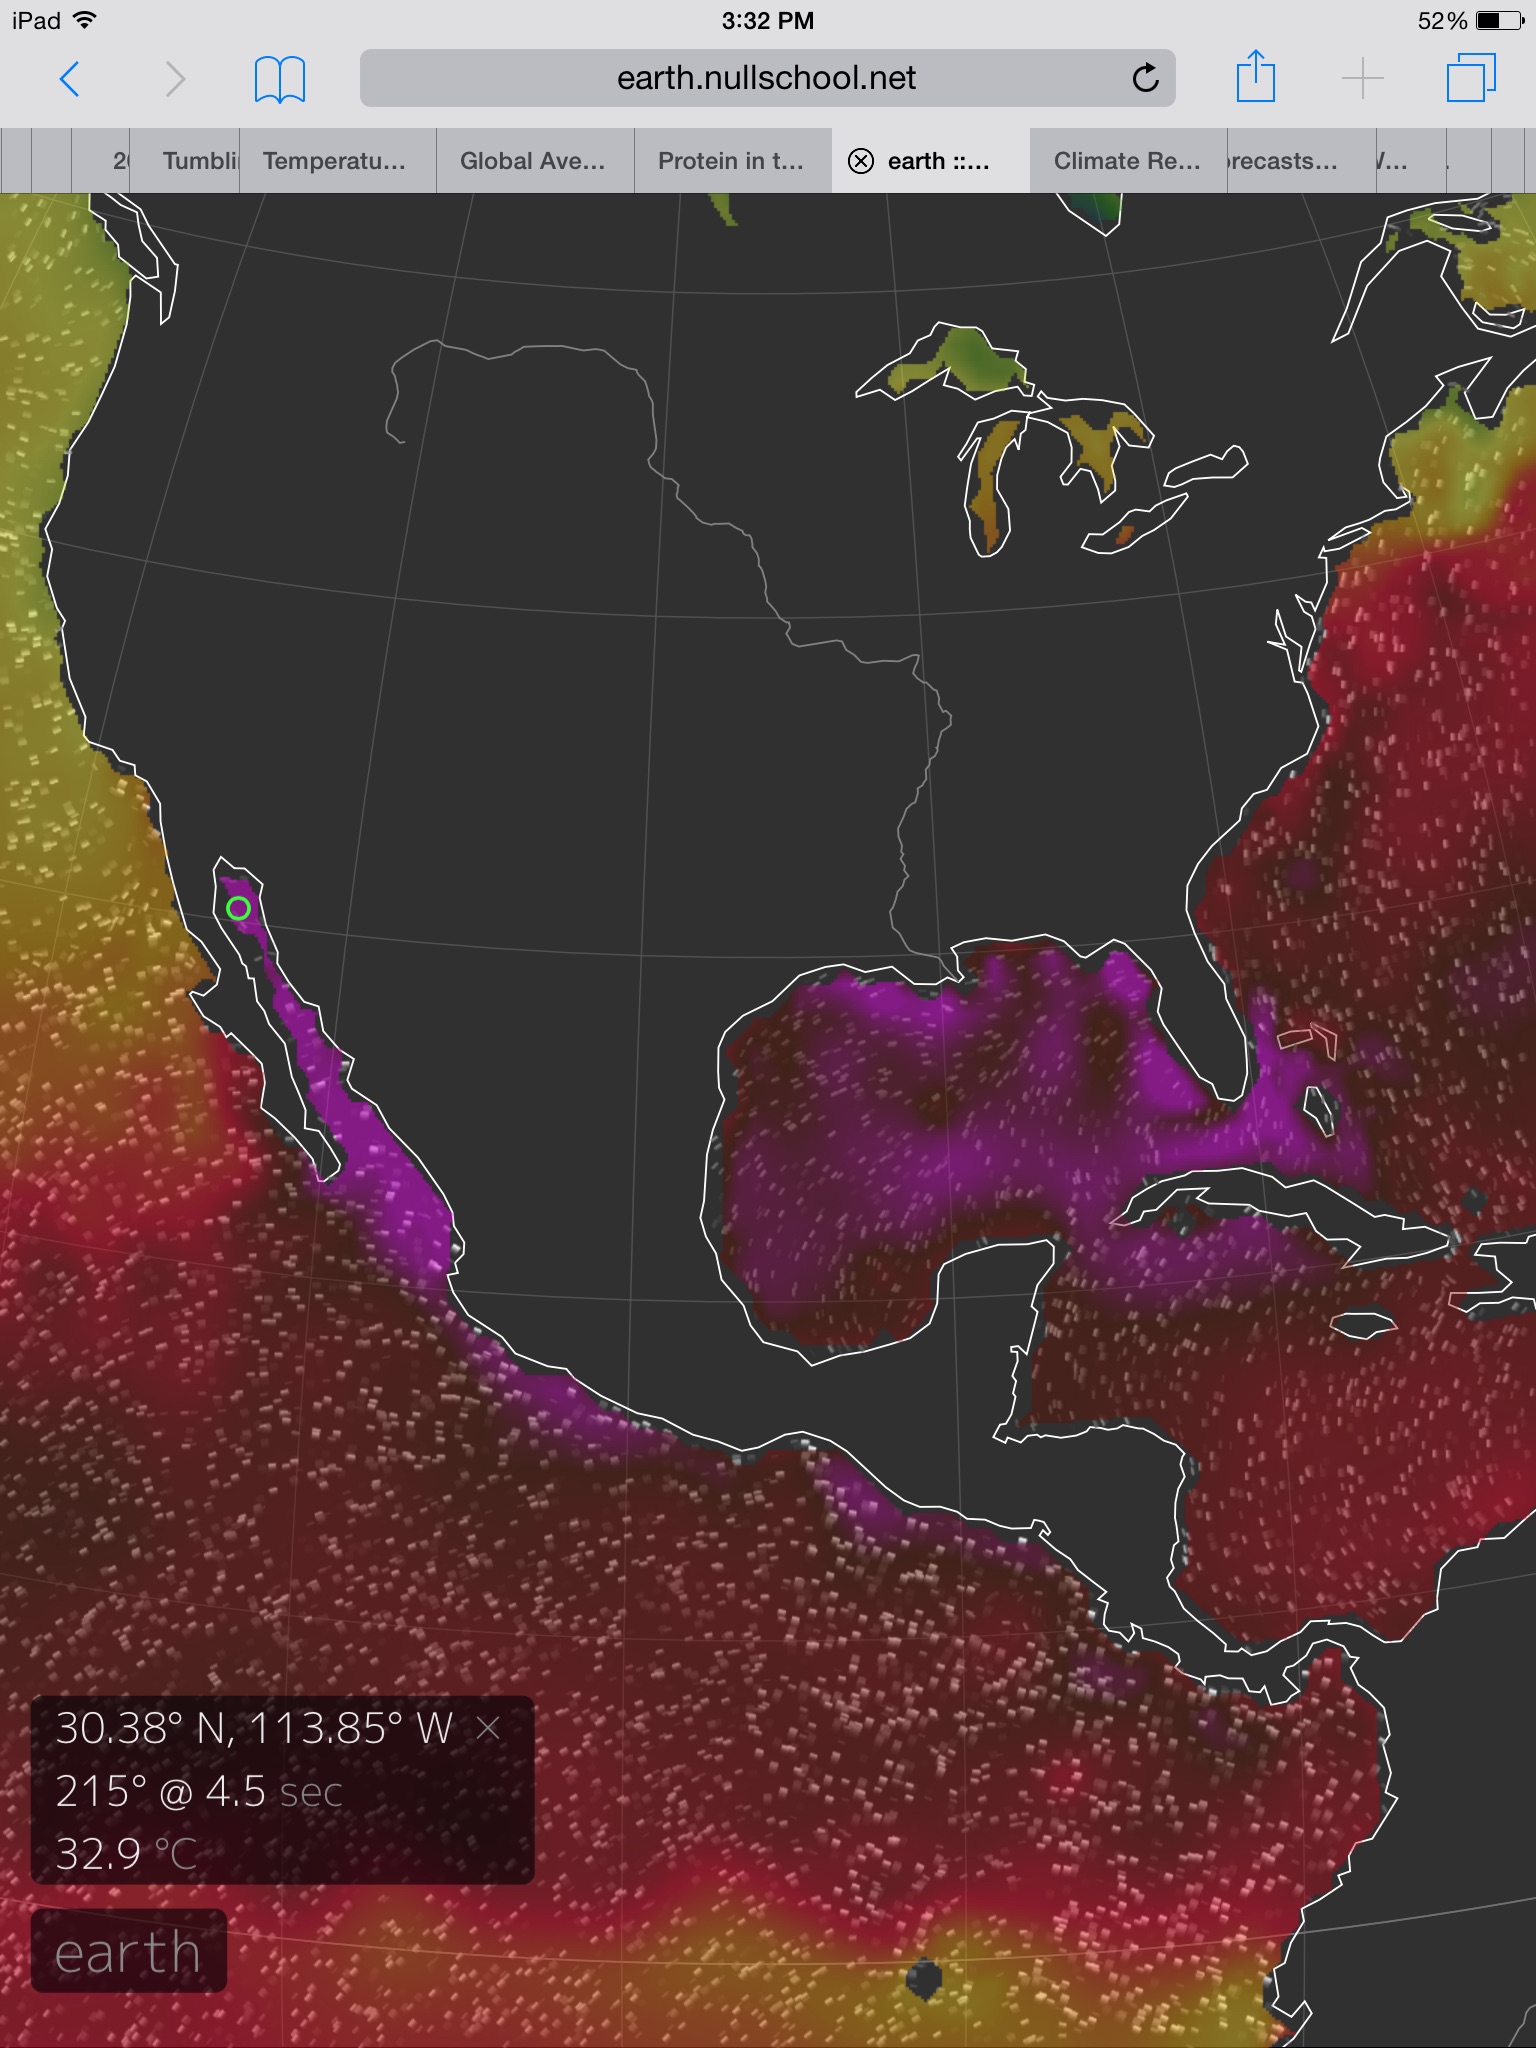


