
Strange and anomalous heating of the Earth’s surface waters. That’s what could best characterize the year of 2014. Waters warm enough to break world records and all arrayed in extraordinarily odd distributions.
***
The Summer of 2014 (June through August) was the hottest in the 135 year global temperature record and likely the hottest in at least 100,000 years. According to the National Climate Data Center, global temperatures were 0.88 degrees Celsius above the 1880 average and 0.71 degrees Celsius above average temperatures for the 20th Century.
Summer of 2014 temperatures slightly edged out previous heat records set in 1998 by 0.01 degrees Celsius. But 1998 was a year during which a raging El Nino was dumping immense volumes of Pacific Ocean heat into the atmosphere. This year, summer conditions displayed Pacific Ocean warmth in the Nino regions — but nowhere near enough heat anomaly to shove the equatorial region into El Nino status. So a luke-warm equatorial Pacific and possible pre El Nino in 2014 when combined with a raging human heat forcing of the atmosphere is enough to beat out the super El Nino of 1998 for record hottest summer, even if only by a hair.
(Summer of 2014 beats out 1998 as hottest on record amidst steady and ongoing rise in global atmospheric temperatures. Image source: NOAA’s National Climate Data Center.)
The hottest summer on record follows the hottest May on record and could well include the hottest September on record. This is a strong trend that may well be building 2014 into the hottest year on record. And all without a pronounced El Nino so far.
For if the final four months of this year all fall within the range of first to fifth hottest, 2014 will be a record breaker.
A Very Hot End to a Hot September
Preliminary GFS measures show that September of 2014 may well be in record-challenging range with global temperatures averaging between +0.4 C to +0.7 C above the already hotter than normal 1979 to 2000 period. It was a period that featured ramping polar heat amplification in both the Arctic and Antarctic. A period that followed summer of 2014 trends showing extreme high temperature departures in the Northern Pacific and even higher sea surface temperature departures in the Arctic Ocean regions near the Bering Strait.
The last day of September closed near the top of this hot temperature range with the global atmospheric anomaly at +0.69 C above the 1979 to 2000 average (which is about 0.3 to 0.4 C above the 20th Century average respectively).
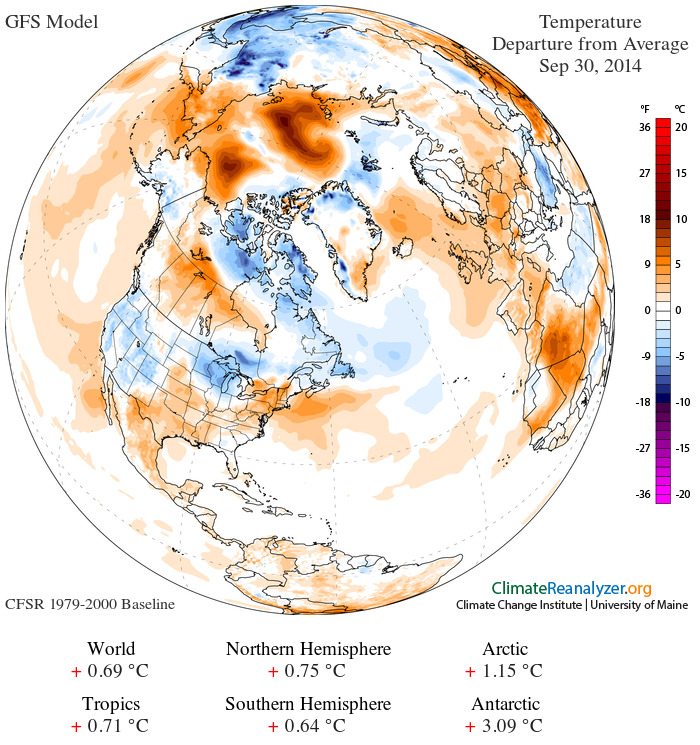
(September 30 global temperature anomaly map. Image source: University of Maine.)
Analyzing the map above, we note strong polar amplification already advancing in the Arctic region with a +1.15 C positive anomaly. We would well expect this trend to continue through fall and winter due to a combination of factors including — the amplified impact of overburden greenhouse gasses during periods of seasonal darkness, a very strong observed heating of the sea surface in Arctic regions providing latent heat through the colder months, and pronounced atmospheric heat transport through ridiculously resilient ridging patterns over the northeastern Pacific and Scandinavia.
In the Southern Hemisphere, we’ve also observed an extraordinary polar heat spike ongoing over the region of West Antarctica in association with an anomalous atmospheric ridge feature in that region as well. West Antarctic temperature departures hit well above +20 C over recent days. This excessive warm anomaly was enough to drive the entire Antarctic zone to an extreme +3.09 C above that polar region’s average for this time of year. Though it is still early spring for the Antarctic, persistence of the West Antarctic ridge could have serious impacts come summer time. So the feature will bear watching.
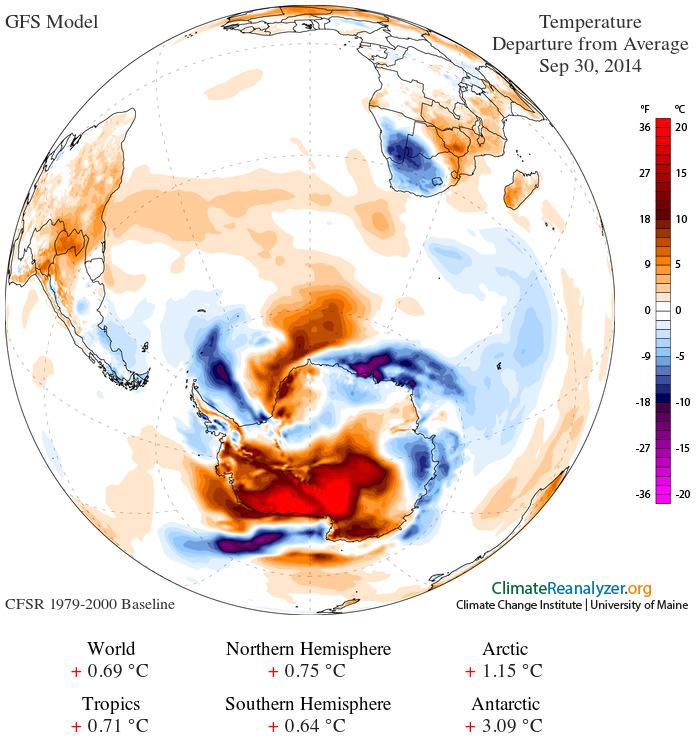
(Extreme positive temperature anomaly over West and Central Antarctica on September 30, 2014. Note the broad area of +20 C positive departure. Image source: University of Maine.)
Troubling Arctic Ocean Heat Spike
But perhaps the most troubling feature for September and, indeed, all of the summer of 2014 is a massive accumulation of far warmer than average surface ocean water in both the Northern Pacific and in the Arctic Ocean.
The Northern Pacific heat has occurred in conjunction with an anomalous 21 month long blocking pattern that has tended to fix in place a south to north flow pattern and far warmer than average land and ocean temperatures for the region. Sea surface temperatures in the range of 2-3 C above average for a swath from California to Alaska have remained in place for nearly two years running.
This feature and now prevailing associated south to north wind pattern appears to be driving warmer than normal waters through the Bering Strait and into the already vulnerable Arctic zone. There, the added warm water appears to have combined with the warming of a deeper, but sometimes surface influencing, warm water flow newly emerging from the Atlantic. These combined warm water flows have resulted in a broad swath of 4 C + above 1979 to 2000 average surface water temperatures ranging from the Bering Sea into the Chukchi, Beaufort, East Siberian, Laptev and Kara Seas of the Arctic Ocean.
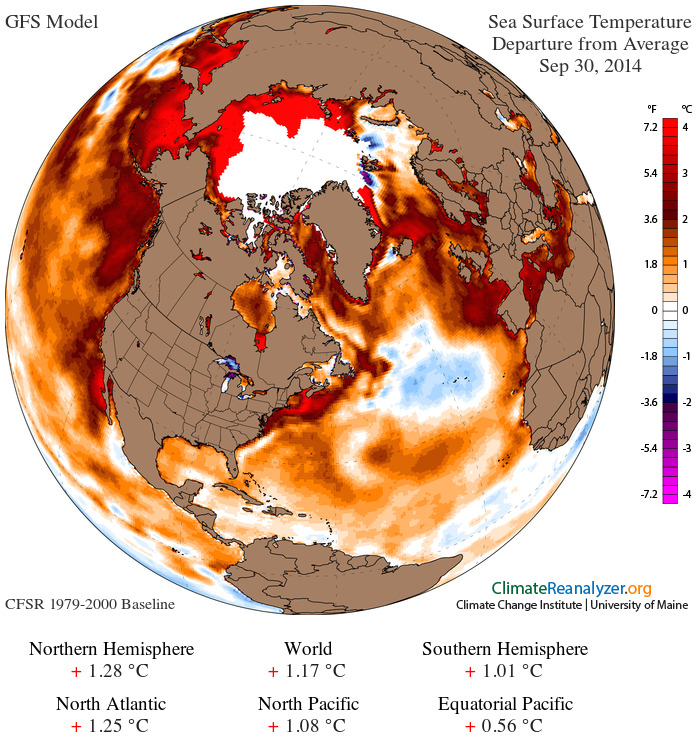
(Extreme global sea surface temperature anomaly of September 30, 2014 features extraordinary +4 C positive temperature departures in the Northern Polar Ocean. Image source: University of Maine.)
During recent years featuring very low Arctic sea ice measures, August, September and October have displayed very strong positive sea surface temperature anomalies in the Arctic. These extraordinary sea surface temperature values have tended to push global temperature averages higher with a number of global heat records set despite the presence of La Nina or ENSO neutral conditions in the Pacific. A clear instance where human-driven polar heat amplification and heating of the northern polar ocean is beginning to have a measurable and substantial impact on global temperature variation as well as overall rate of warming.
In general, we find much of the global ocean heat spike clustered near the northern polar zone. This is clearly visible in the anomaly color display on the map above together with the +0.27 C of added heat in the Northern Hemisphere surface ocean vs the Southern Hemisphere Ocean measure.
A final feature of this enhanced Arctic warming — increased instances of microbial blooms in northern ocean surface waters — was plainly visible in the MODIS shot during late September as well. In this case a massive bloom covering a 550 by 100 mile swath of the Bering Sea just south of the Bering Strait:
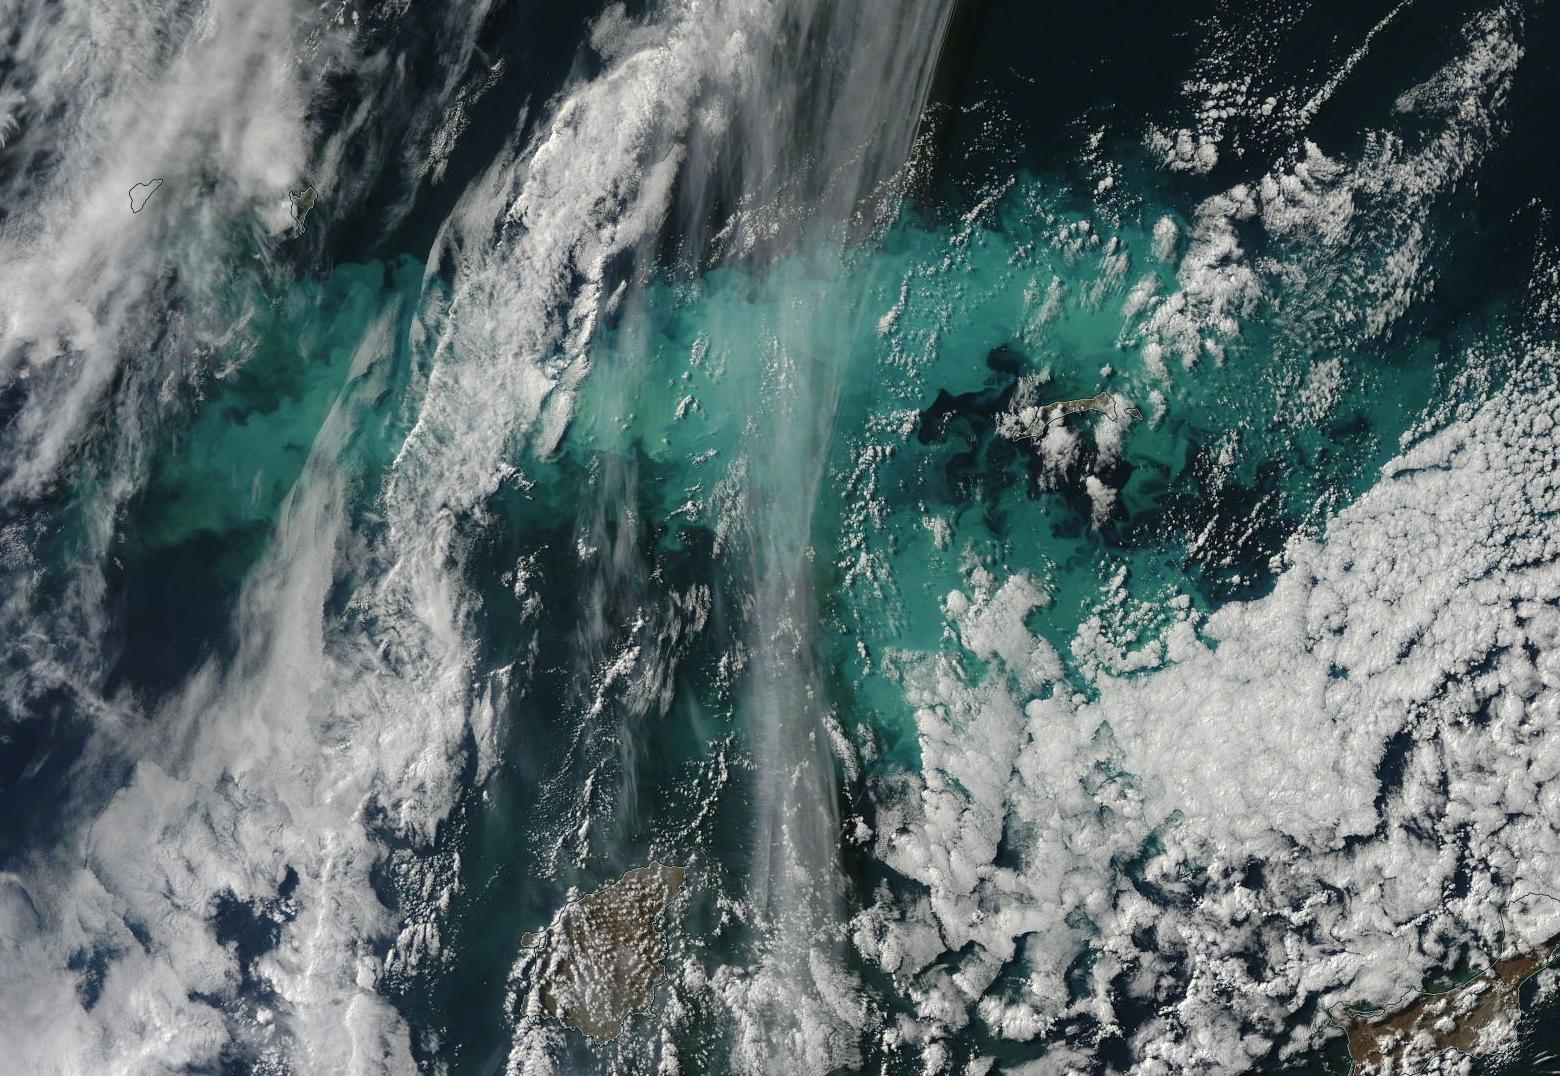
(Massive Bering Sea microbial bloom as visible in the LANCE-MODIS satellite shot on September 28 of 2014. For reference, the Bering Strait is to the right of frame. Bottom edge of frame is about 500 miles. Image source: LANCE-MODIS.)
In these instances, concurrent with human-caused warming, large regions of newly ice free water contain higher nutrient content than more southerly waters. As the human heat forcing spurs these waters to above average temperatures, ocean microbial activity becomes more prolific — since larger numbers of microbes thrive in warmer conditions. The result has been the appearance of very large blooms in far northern waters during recent years.
Within Striking Distance of a Record Hot Year — Serious Implications For Weather and Climate
Despite a Pacific El Nino that appears to be set on slow to low burn, if the event appears at all, it appears possible that 2014 may be setting up for a record breaking year. The factors driving this event include a continued if very mild Pacific Equatorial warming together with far more troubling heat amplification driven by human greenhouse gas warming at the poles. The most troubling of these regions continues to be the Arctic. And the added heat there will almost certainly increase stress on vulnerable carbon stores as well as potentially add to the human-spurred havoc now playing out in northern hemisphere and global weather systems.
The disposition of early fall atmospheric heating with high ocean heat content near the northern polar zone certainly leaves wide the door to future polar vortex disruption come winter 2014-2015 together with providing a Jet Stream weakness that continues to facilitate Northeastern Pacific Ocean ridge development. And, in the case of the Northeastern Pacific especially, there are few challenges to that very disruptive and damaging pattern on the near term horizon (30 day).
Links:
NOAA’s National Climate Data Center


Mark from New England
/ October 1, 2014Fantastic article Robert! Very significant.
So should the northeastern US plan for a massive influx of sub-arctic air again this winter if the polar vortex collapses south again?
LikeLike
robertscribbler
/ October 1, 2014Looking at sea surface temps, which would tend to drive the oceanic Jet Patterns, we see strong heating in the Northern and Eastern Pacific which would continue to aid in the perpetuation of ridging near and over Western North America.
Slightly cooler than average sea surface temps in the central north Atlantic appear to be setting up for more trough development near or over the Eastern US, Eastern Canada and through Hudson and Baffin Bays.
The center of cold air should have a tendency to shift closer to Greenland and away from the far northern polar zones, as we’ve seen during recent winters.
Ridging tendency over Scandinavia, should it continue through winter will aid in driving warmer oceanic air over the pole from the Atlantic side.
Trough development appears to be more prevalent over Western Russia and Eastern Siberia going into fall than last year. If this pattern continues, the overall ridging would have a tendency to shift more toward Central Siberia for the Asian Continent.
We could probably expect some cold air exchange crossing the warmer polar zone and into the cooler continents during winter. The primary cold core will almost certainly center near Greenland, but a second may attempt to develop over Siberia.
This outlook is, of course, preliminary. As patterns can well change through autumn. That said, some of these features have maintained resiliency for months to years. So we can provide some moderate confidence given identifiable trends.
The primary threat to the strong block — a strong or persistent El Nino strengthening the Pacific storm track — is not currently in evidence. Though trends do still hold for some potential for El Nino with an ongoing moderate warm Kelvin Wave and SOI values approaching -8, the tendency still appears to be maintenance of ENSO conditions on the warm side of neutral but just shy of El Nino strength.
Overall, I’d say this doesn’t present a serious threat to the block. And high SSTs in the North and Eastern Pacific serve to reinforce ridging in the region where high pressure formation has been so prevalent. Polar amplification in the Arctic during winter will only reinforce this pattern, with the warmer air to the south seeking linking with the milder air over the pole through a natural weakness in the Jet.
LikeLike
earthfriendrick
/ October 1, 2014Wow Robert, you nailed this emerging condition… I too am concerned about the pervasive pattern in the northern Pacific, jet stream amplitude, and the freaking polar vortex cold that may well sweep down the eastern U.S. Of course, all of us are more concerned about what this portends for the future…
LikeLike
Mark from New England
/ October 1, 2014Yes indeed, and I also wanted to say that the September 30 map of sea surface anomalies is shocking. Our nearby Gulf of Maine is also way above average.
For Halloween, instead of a carved pumpkin, I may put a poster of it in front of my house on big piece of plywood. That SHOULD scare the hell out of anyone.
LikeLike
robertscribbler
/ October 1, 2014Hope you don’t have to use the plywood to protect your windows…
LikeLike
robertscribbler
/ October 1, 2014To paraphrase Dr. Francis.
— Expect interesting weather during fall and winter.
I’d keep a particular eye on the Halloween timeframe. Watch out US East Coast and UK.
LikeLike
Mark from New England
/ October 1, 2014Yes, I will never forget the 2011 ‘Shocktober’ snow and ice storm. While brushing the blizzard of snow off our ornamental dogwood, which still had leaves, I heard and then saw a large limb of the neighbor’s oak tree fall onto the nearby power line, with much popping and sparks flying. I quickly went inside and decided I shouldn’t risk life and limb for our landscaping. We were without power for 6 days.
LikeLike
robertscribbler
/ October 1, 2014Storm track already starting to crank up.
The low off Greenland hit 955 mb yesterday. Probably not so deep today. But very early in the season for these kinds of potentials.
LikeLike
Griffin
/ October 1, 2014Thank you for the great post and this insight on fall weather here Robert. This is lot to take in. Interesting remarks about our upcoming weather given that Cape Cod is under a flood watch (for the first time in a long time) from a coastal low that is driving in moisture off the water. Many nor easter’s have been sliding up the coast lately, but far enough out to sea to not attract much attention. That will change if the track moves in and brings the snow!
LikeLike
robertscribbler
/ October 1, 2014Big feed from GoM through to Greenland and then a straight shot across the North Atlantic. Very robust for September. Watch out for bombs off the East Coast as October advances.
LikeLike
robertscribbler
/ October 1, 2014Glad it’s helpful 🙂
LikeLike
bill shockley
/ October 2, 2014A couple more recent recordings with Jennifer Francis:
Youtube: Two Expert — and Diverging — Views on Arctic’s Impact on Weather ‘Whiplash’
Google: Jennifer Francis and Kevin Trenberth – Is Global Warming Driving Crazy Winters?
She thinks increasing water vapor in the arctic atmosphere may be more responsible for Arctic Amplification than sea ice loss. Says the water vapor is coming into the arctic on winds from the South. She describes this thinking as something new—new offspring since the theory was first conceived. She’s hoping to be able to put together a model within a few years that will “get the sea ice right”.
LikeLike
robertscribbler
/ October 2, 2014Makes sense. Water vapor is an extraordinary greenhouse gas and quite a lot of it will be delivered to the Arctic via warm winds over the coming years.
I’d like to see those model results.
LikeLike
bill shockley
/ October 2, 2014Me too. I’m wondering whether this can be used to show a negative feedback: Arctic amplification==>wet winds heading north==>cloudy skies in spring==>fewer, smaller melt ponds==>less sea-ice melting.
Could be what we’re seeing the last two years. Perhaps a link (not necessarily causal) with the Pacific blocking pattern which it roughly coincides with time-wise?
LikeLike
robertscribbler
/ October 2, 2014Clouds trap more long wave radiation. The net effect is warming, especially during winter. And rain is a powerful heat delivery mechanism to the ice. If the clouds are laden with black or brown carbon even the short wave blocking effect is countered.
Two years does not make a trend. And if there’s a negative feedback it will come in the form of the fresh water wedge.
Watch the ice this winter. Winter power about to kick into higher gear. If not this year, soon.
LikeLike
bill shockley
/ October 2, 2014robert wrote:
“Clouds trap more long wave radiation. The net effect is warming, especially during winter. And rain is a powerful heat delivery mechanism to the ice. If the clouds are laden with black or brown carbon even the short wave blocking effect is countered.”
My premise is anything that doesn’t form melt ponds in the spring is less than optimal for melting, since they are highly correlated with the biggest melt years. So even if clouds are warming, they may not be optimal for the total melt season.
robert wrote:
“Two years does not make a trend.”
True. True. It’s just the magnitude of the rebound gave me pause.
robert wrote:
“And if there’s a negative feedback it will come in the form of the fresh water wedge.”
What is the fresh water wedge?
robert wrote:
“Watch the ice this winter. Winter power about to kick into higher gear. If not this year, soon.”
Wadhams seems to agree and he knows the ice and the arctic and is also privy to the Maslowski model. I wasn’t sure if he was digging in his heels or if he had something up his sleeve.
LikeLike
robertscribbler
/ October 2, 2014“My premise is anything that doesn’t form melt ponds in the spring is less than optimal for melting, since they are highly correlated with the biggest melt years. So even if clouds are warming, they may not be optimal for the total melt season.”
Good point. Solar insolation is traditionally needed for widespread melt pond formation during spring time. Yet the new Arctic is a cloudier one. So clouds are a negative feedback at the start of melt season as they reduce insolation intensity at that time.
My opinion is that other factors such as increasing water temperatures, and greatly increasing annual air temperatures during fall, winter, and spring will over-ride the late spring/early summer negative feedback influence of clouds.
But asking questions about the role of clouds in the 2013 and 2014 pseudo recovery is probably a worthwhile exploration.
My point is that if you remove the months of May, June and July, then clouds are a positive feedback in total. And, including those months, the net annual heat balance adjustment by clouds is positive. So clouds will play a role in lengthening the melt season and reducing the intensity of the freeze season — even if early melt season factors (insolation) are less intense.
“What is the fresh water wedge?”
Large influxes of fresh water into the polar region generate an ocean stratification that shoves warm water toward the bottom and keeps cold water at the surface. This greatly reduces ocean to atmosphere heat transfer. In addition, the leading edge of the fresh water coming into contact with saltier water generates a strong down-welling. The down-welling, in turn, draws atmospheric heat into the ocean depths, generating a local cooling.
In the event of heightening glacial outflows from Greenland and increasing precipitation in the Arctic environment, we can expect an expansion and thickening of the fresh water layer in the Arctic. This will drive tremendous heat sequestration near the Arctic Ocean bottom as well as lead to edge down welling and atmosphere to ocean heat transfer.
In the event of a proliferation of ice bergs flowing from Greenland, the bergs will enhance localized cooling as winds encounter the frozen masses.
In my view, this will be the strongest negative feedback to aid in the preservation of surface sea ice in both the Arctic and the Antarctic going forward. Critical to the level of negative feedback is the rate of fresh water and ice berg outflow from glaciers. As an aside, this will likely play havoc with traditional Atlantic and Southern Ocean overturning patterns and necessarily have a very severe effect on weather.
As for Wadhams — I’m a bit less certain about zero ice by or before 2017 than he and Maslowski. 2013 and 2014 had the impact of likely setting back the worst case timelines to 2018 or later.
If you set sea ice volume on a more linear trend, we hit near zero ice by 2025 to 2030. Returns to the exponential trend get us there by 2018 to 2020.
RE Winterpower… We have so many heat flows riding into the Arctic right now that winters are likely to start getting very odd. The trend began in 2005-2007 but has been very intense during recent years. The Arctic greenhouse gas overburden is now very high in both the CO2 and in the methane measures. Combined with record SSTs at or near the pole and you have a formula for very warm Arctic winters. I think this plays more of a role in melt going forward.
LikeLike
bill shockley
/ October 2, 2014I’m using the 2007 volume number for this year as Neven hasn’t updated his spreadsheet yet. https://docs.google.com/file/d/0B-LCPStYYJl3Q195Q0ptempfRVU/edit They are saying it’s in the vicinity of 2007.
The curve drawn is not statistically calculated–it’s eyeballed. Tilt or bend to your eye’s content.
LikeLike
james cole
/ October 1, 2014This part of European history has been a favorite of mine, mainly because an entire culture of prosperity and growth came crashing down on the back of a climate shift leading to incredible series of storms and bad weather. European society had grown large and wealthy over centuries of warm favorable agricultural weather. ” The onset of the Great Famine coincided with the end of the Medieval Warm Period. Between 1310 and 1330 northern Europe experienced some of the worst and most sustained periods of bad weather in the entire Middle Ages, characterized by severe winters and cold, rainy summers.” Then the above happened, and it shook an entire civilization to the core, even causing changes in religious patterns of belief.
I wonder now that the oceans have taken up so much recent global warming and climate seems ready to either go unstable or shift to a new, unknown norm, how are our prospects of the modern world to do a repeat of the crisis of early 1300’s? That event saw populations crash to levels that did not recover till the 19th century! We are now overpopulated by any normal standard, we are vulnerable to a disruption of agricultural weather patterns, favorable for so many decades, I wonder what a changing climate might unload on us. It has happened before, by a natural event, but now we have loaded the dice and nature is playing a whole new game. My guess is, 1300 < was an insight worth remembering.
LikeLike
robertscribbler
/ October 1, 2014Good points, James. That was one hell of a time for European conflict. Famines, wars — some that lasted for decades and decades, plague, terrible suffering and new forms of punishment. But then came the renaissance too.
As for us… Well, it looks like we’re just at the start of the unloading.
LikeLike
dtlange
/ October 1, 2014Griffin, Mark from New England:

Oct.1 Eastern U.S.: Infrared (GOES-East)
LikeLike
robertscribbler
/ October 1, 2014Very squally Atlantic. Caribbean and GoM moisture feed. Trough to north and west provides atmospheric instability loading.
Nor’easter of rather moderate intensity off NE coast now.
Thanks for the GOES feed, DT.
LikeLike
Griffin
/ October 1, 2014Thank you DT, Mark and Robert. I don’t know about you Mark but it is a little unnerving for me to have Robert give us a heads up about the weather that is coming later in the month!!
I have great respect for what can be thrown at us by the confluence of warm ocean and cold air and your remarks about the Oct. 2011 storm are in my mind. That was a blockbuster storm that caused some kind of damage to nearly every single hardwood tree in our area.
LikeLike
Phil
/ October 1, 2014I see some comments from the arctic sea ice El Nino thread that some models are forecasting the possibility of westerly winds if not WWB over the next fortnight and possibly longer. Will be interesting to see if this eventuates and if it reinforces the current EKW activity.
LikeLike
robertscribbler
/ October 1, 2014The current EKW does appear to have some long period potential.
LikeLike
Leif Knutsen
/ October 15, 2014We’re the first generation to feel the impacts of climate disruption, and the last generation that can do something about it.
With that in mind, there are a few things to keep in mind going forward. Warm air rises, cold air sinks. A large part of the Arctic is no longer ice at well below 0 C but open water at >0 C (A difference of 10s of degrees C.) The Arctic cold air mass thus must shift to areas that cool the fastest, land, and the rising air must be replaced with air from someplace, the now warmer oceans of the Atlantic and Pacific. This tends to split the polar air mass, thus disruption the circumpolar vortex and locking the polar air outbreaks over the continents.
People the world over have no problem accepting the fact that changing a relatively small patch of the South Pacific less than hand full of degrees F and the resultant El Nino river of warm waters across the pacific can have a profound change in yearly climates . Not only here in the USA and the Western Hemisphere but Europe and Africa as well. The reality of changing a much larger patch of the Arctic from supper cold ice to +32 F open waters on our boarders an assuming it will be inconsequential defies reason.
While weather folks talk up El Nino, they are blind to other huge areas of warmth popping up with the equivalent or even larger heat bubbles materializing hither and yon.That puppy in the Gulf of Alaska has been parked there for over a year that I know of and has not received one media mention to my knowledge. Similarly there are other though smaller are not insignificant on the East Coast as well as scattered globally. Each has a tremendous amount of energy represented.
LikeLike
robertscribbler
/ October 15, 2014Changes in the Arctic and around the world are having profound effects on climate and weather. Without that hot pool in the NE Pacific, we’d have no California drought and the RRR would not have so prevalently formed. Without Arctic warming, we’d have no weakness in the Jet Stream in which the ridge could so readily form.
We may have had similar weather in the 1,000 year record, but such events were not driven to the degree that they are now by humans having warmed the Earth System.
There is a tendency to normalize these extreme weather events. That tendency, given the magnitude of current changes, is a false and dangerous representation.
LikeLike