
Today Climate Scientists are chatting about a number of subjects on social media. Let’s help them amplify their messaging.
All posts tagged polar amplification
Climate Science Chat — Polar Amplification, Coal Haulers, and Climate Change Denial

Posted by robertscribbler on February 16, 2023
https://robertscribbler.wordpress.com/2023/02/16/climate-science-chat-polar-amplification-coal-haulers-and-climate-change-denial/
Record Low Sea Ice Spurred by Global Climate Emergency
This special edition of the OBX Wave Report highlights recent observations of global record low sea ice during early 2023. Sea ice has an influence on the health of glaciers. That’s a big deal for surfers and folks who live on the coastline. Mass deploying clean energy can help.
Share this:
Posted by robertscribbler on February 2, 2023
https://robertscribbler.wordpress.com/2023/02/02/record-low-sea-ice-spurred-by-global-climate-emergency/
Melting Ice Everywhere — Arctic Sea Ice Extent Hit New Record Lows in Late July and Early August
If there is one word I’d use for the summer of 2019 it would be awakening. Awakening to a general public awareness of a climate crisis driven by fossil fuel burning we are now entering the throes of.

(According to NOAA, July of 2019 was the hottest July on record for the state of Alaska. This likely presages a July that will be globally the hottest July ever recorded in 2019. Much of this excess July heat was centered on the polar zones during the month — resulting in serious ice loss for both Greenland and the floating Arctic sea ice. Image source: NOAA.)
The global record hot month of June along with its related severe heatwaves, storms, and droughts have certainly served to raise the general awareness of trouble. Our new youth advocates such as Greta Thunberg and an expanding Extinction Rebellion, have certainly served to amplify the much-needed message. But vividly melting ice in tremendous volume — particularly in Antarctica, Greenland and on the ocean surface has also played its role.
The Arctic zone has seen an outrageous hotter than normal period that has extended throughout July and well into August. States and regions within or near the Arctic Circle have experienced temperatures from the upper 70s all the way into the lower 90s. Great wildfires have blanketed large sections of thawing permafrost and boreal forest — casting out smoke plumes covering as much as 4 million square kilometers at a time. Greenland saw a single day in which ice melt exceeded 11 billion tons. By volume, that’s 11 cubic kilometers — roughly equal to 11 moderate sized mountains — gone in a single 24 hour period (what does one cubic kilometer look like? See here.).
Out in the ocean waters of the Arctic, another key feature of our climate system that keeps the Earth environment stable, was getting hammered by the rising heat. For every day from July 22nd through August 9th, Arctic sea ice extent had been running in record low ranges below previous low marks set for this time of year during 2011 and 2012.
2012 in particular was a very severe Arctic melt year. Both sea ice and Greenland saw significant losses at that time. But it appears as we end the decade of the 2010s and start to enter the 2020s, Arctic summers like the one that occured in 2012 will become commonplace even as new hot outliers are more possible. For 2019 has begun to replace some of the previous worst losses seen during 2012.

(Arctic sea ice extent entered new record low ranges below the 2011 and 2012 lines during late July and into early August. By August 11, Arctic sea ice had dropped to 5.249 million square kilometers the second lowest measure for the date. Image source: NSIDC.)
As we get into August, it appears that at least some of 2012’s late season sea ice records will hold. The new August 11 measure of 5.249 million square kilometers is just above 2012’s low mark of 5.190 million square kilometers. And August 10 saw 2019 edging just above the 2012 line in the NSIDC measure.
Looking forward, the second week of August is expected to bring 1.38 C above average temperatures for the Arctic region. This is a rather significant departure for August as Arctic temperature anomalies tend to moderate during summer. And very warm ocean surface temperatures ranging well above 4 C warmer than average for large regions is likely to continue to enhance sea ice melt (see right image below).


(Greatly reduced Arctic sea ice extent [left] faces off against much warmer than normal Arctic ocean waters during August of 2019 [right]. Image sources: Uni Bremen and DMI.)
But a present lack of forecast strong weather systems that typically impact ice at this time of year such as burly high pressure ridges over the Central Arctic or major storms invading from the south may help to maintain at least some of the ice. Nonetheless, with so much heat left in the Arctic system and with sea ice perilously thin for this time of year, I’d be remiss if I didn’t say that anything can happen between now and traditional melt season end in mid September.
(Related video blog above.)
(Want to help fight the climate crisis by transitioning to a clean energy vehicle? Get 1,000 free supercharger miles at this link.)
Share this:

Posted by robertscribbler on August 12, 2019
https://robertscribbler.wordpress.com/2019/08/12/melting-ice-everywhere-arctic-sea-ice-extent-hit-new-record-lows-in-late-july-and-early-august/
Coastal Arctic Temperatures hit 84.2 F Today
Fossil fuel burning is really ramping up the global heat. And for the typically cold Arctic Ocean coastal region, this means that temperatures are now able to strike into the 80s during mid-May.
Today, a very extreme wave in the Jet Stream produced an elongated ridge pattern that ran far to the north over Eastern Europe. This high amplitude wave brought with it temperatures that ranged up to 20 degrees Celsius (36 degrees Fahrenheit) above normal for this time of year. A heat surge which pushed temperatures to 29 C or 84.2 F near Archangel, Russia.

(Severe heat strikes northeastern Europe as part of an extreme jet stream wave pattern. Image source: WX Charts. Hat tip to Peter Sinclair.)
The kind of jet stream wave that spurred this extreme heat has become common over recent years. It’s an atmospheric feature that some scientists have associated with polar amplification — an aspect of human-forced climate change in which the poles warm faster than the lower latitudes.
During 2019, heat transfer into the Arctic has contributed to near record low and record low sea ice extent values in the months of March, April and May. The wavy jet stream patterns have also been associated with a number of severe weather events. Today’s extreme northern heatwave fits into a longer-term pattern of similar occurrences.
(Analysis of recent extreme jet stream pattern over Eastern Europe.)
Wavy, persistent jet streams have recently been associated with worsening weather — heat waves and wild fires in the ridge zones and severe precipitation in the trough zones. Scientists like Dr. Michael E. Mann and Dr. Jennifer Francis have warned that the associated Jet Stream waves are linked to human-forced climate change and are likely contributors to recent events.
The extreme weather we’re seeing around the Northern Hemisphere, such as heat waves, floods, droughts, and wildfires, is related to an unusual, undulating pattern in the jet stream. The other part of this that’s atypical is that this undulating pattern doesn’t usually hold longer than a few days. But this one isn’t going anywhere. Our work shows that this sort of pattern, which has been associated with many of the most extreme, persistent weather events in recent years, including the 2003 European heatwave, the 2010 Moscow wildfires, the 2011 Texas and Oklahoma drought, and the 2016 Alberta wildfires to name a few, is becoming more common because of human-caused climate change, and in particular, because of amplified Arctic warming.
It looks like 2019 is no exception to the longer-term trend. And we have already seen a number of instances of middle latitude extreme weather contributed to by the jet stream features Dr. Mann mentions above this year.
(Want to help fight climate change by switching to an electric vehicle? Get 5,000 free supercharger miles through this link.)
Share this:

Posted by robertscribbler on May 11, 2019
https://robertscribbler.wordpress.com/2019/05/11/coastal-arctic-ocean-temperatures-hit-84-2-f-today/
Arctic Ocean Deep in the Grips of May Temperature Spike; Beastly Summer Melt Season on the Way?

The Arctic Ocean as it appeared from space on May 6, 2018. Image source: NASA Worldview.
The Arctic sea ice is presently at its second lowest extent ever recorded in most of the major monitors. However, May is shaping up to be far, far warmer than normal for the Arctic Ocean region. If such high temperatures over this typically-frozen part of our world continue for much longer than a couple of weeks at this key time of year, precipitous summer melt is sure to follow.
******
During recent years there has been much speculation about when the Arctic Ocean will start to experience ice-free summers as fossil fuel related industries pump higher and higher volumes of greenhouse gasses into the atmosphere. In the early-to-mid 2000s, scientific consensus was that melt would tend to be more gradual and ice-free summers would hold off until the final decades of the 21st Century when the world was around 3-4 C warmer than 19th Century averages.
But the Earth System is far more sensitive to temperature increases than the early forecasts expected. Major Arctic sea ice losses surprised the world during September of 2007 and subsequently in the same month of 2012. Now, it is obvious that a pattern of far more rapid sea ice melt has taken hold. And the scientific consensus appears to have settled on a more likely and much nearer date around the early 2030s — when the world will have warmed by about 1.6 degrees Celsius.
(An oddly warm pattern in which above freezing temperatures have come early to the High Arctic is setting up during May of 2018. Content Source: Climate Reanalyzer. Video source: Scribbler’s Youtube.)
However, when it comes to sea ice, nothing is certain at this time. Any single Arctic year in which temperatures spike — particularly during normal melt season — could result in the losses that we once expected to occur much later in time.
There are many factors that will ultimately determine when a summer ice free state occurs. Warm winters are a major one. And the past two years (2017 and 2018) have seen Arctic winters in which temperatures hit some ridiculous high extremes. But another major factor is the set-up to Arctic summer that takes place during the window months of May and June.
Neven, one of our best Arctic sea ice watchers (you can check his blog out here), notes:
May and June are very important for the rest of the melting season. Not only do we now see these warm air intrusions, but high pressure maintains its presence over parts of the Arctic as well (which means relatively cloudless skies -> insolation -> melt onset and melt pond formation -> preconditioning of the ice pack -> melting momentum that gets expressed during July and August, regardless of the weather)… We have to wait and see what happens, step by step, but this isn’t a good start for the ice.
If May and June are unusually warm, particularly over the Arctic Ocean, then the sea ice — which is already greatly weakened — is bound to face an extended period of above-freezing temperatures. If such a period stretches for 5 months from May through September rather than the typical 4 months (June to September), then we are more likely to see the Arctic Ocean briefly flip into an ice-free or near ice-free state for the first time in human history.

(The coming week is expected to feature between 1 and 10 C above average temperatures for locations across the Arctic Ocean. These are very strong warm departures during May. Last week saw similar extreme warm departures. And we are already starting to see sea ice losses pile up. Image source: Global and Regional Climate Anomalies.)
This year, May is shaping up to be much, much warmer than normal for the High Arctic. Already, a large May temperature spike has occurred (see right image below). A temperature spike which is predicted to continue for at least the next ten days.
Not to put too fine a point on it, but this severe warming trend might end up presenting a bit of a problem. The extended period of melt mentioned above may begin in force — setting off a chain of feedbacks that could tip the Arctic Ocean into a far less frozen or even an ice-free state (under absolute worst case scenarios) this year.
To be clear, this is not a forecast that such a condition is bound to occur during 2018. It is just an analysis of underlying trends and a statement that risks are higher if such trends as we now observe continue. Late May could flip to a cooler than normal regime. June could be cooler and cloudier than normal (as happened during 2016 and 2017). And if that happens again, we may be spared.


(Average Arctic temperatures for 2017 [left] and 2018 [right]. The red line depicts the yearly temperature trend. The green line depicts the Arctic climatological average for 1958-2002 [which was already warmer than normal]. Note the big temperature spike in the right hand graph. That’s where we are now. Image source: DMI. For further reference, see Zack Labe‘s composite temperature analysis for the 80 North region.)
However, we are already on a much higher ramp for spring temperatures in the northern polar region than during 2017. And though 2016 saw a slightly warmer than normal spring near the pole, the May 2018 spike already far exceeds anything we saw at that time. So much, in fact, that present temperatures for May 6 are comparable to those typically seen during early June from the 80 degree N Latitude line to the Pole.
This higher ramp and related record warmth is already accelerating melt. Sea ice losses over recent days have greatly picked up and we are getting closer to record low daily ranges. If melt accelerates to a point, the greatly expanded darker ocean surfaces will draw in more heat from the sun’s rays during June — potentially overcoming the impact of the increased early summer cloudiness we have seen during recent years. Such a scenario, if it continues to develop, would be a nightmare from the climate change perspective.
Share this:

Posted by robertscribbler on May 7, 2018
https://robertscribbler.wordpress.com/2018/05/07/arctic-ocean-deep-in-the-grips-of-may-temperature-spike-beastly-summer-melt-season-on-the-way/
Seven Inches of Snow Dumped on Northeast as Another Major Arctic Warm-Up is Underway
As an April snowstorm strikes the U.S. Northeast, major global weather stories related to climate change are unfolding in real time. For today, we again find that none of the key climate zones feature below average temperatures even as a ten-day-long Arctic warm spell appears to be on tap.
Very Warm Arctic in Early April

(Another big Arctic warm-up drives cold air southward. The result is snow over the U.S. Northeast even as parts of the Arctic Ocean are experiencing an early thaw. Image source: Climate Reanalyzer.)
Warm winds driving northward over eastern Siberia, on the back side of a high pressure ridge, are delivering yet one more big dose of near or above freezing temperatures to this Arctic region. From the Chukchi Sea through the Bering Strait and on into East Siberia, temperatures range from 10 to 22 degrees Celsius above average. The Bering itself has been mostly swept clean of sea ice — with severe record low ice extent readings for this zone during early April.
Throughout winter, the Bering and Chukchi have received wave after wave of much warmer than normal air from the ocean zone to the south. This tendency for warm air propagating northward through the Pacific is one that is often triggered by La Nina — a periodic pattern of Pacific Equatorial surface water cooling that became a dominant feature of 2018 winter weather. However, globally warmer than normal ocean waters and, in particular, much warmer than normal sea surface temperatures in the Northeastern Pacific appear to have greatly enhanced the heat influx.

(Much warmer than normal sea surface temperatures in the Northeastern Pacific this year have provided a pathway for warm air to invade the Arctic. Meanwhile, La Nina and Polar Amplification generate a combined influence that weakens the Jet Stream and facilitates atmospheric ridges in this zone. Image source: Earth Nullschool.)
These warm waters at the middle to northern latitudes have developed a pathway that enhances the northward flow of tropical air masses over the Pacific Ocean. Meanwhile La Nina’s Equatorial cooling combines with climate change’s amplified polar warming to slow down the Jet Stream — further enabling this south-to-north heat transfer. As we have seen time and time again, human-forced global warming generated chiefly by fossil fuel burning is developing an atmospheric and oceanic handshake with past understood synoptic trends to produce an out-sized Arctic warming.
Bering Sea Almost Completely Cleared of Ice
This severe warming is plainly visible as open water is driven by outlandish temperatures well north and through the Bering Strait during early April. A time when ocean ice typically extends more than 150 miles south of Ninivak — bridging the water zone from Bristol Bay to the Kamchatka Peninsula.

(The Bering Sea is typically ice-choked during April. And during a normal year all the water zones in the above image would be covered with ice. But this spring, sea ice extent there is at never-before-seen record low levels. Image source: NASA Worldview.)
The impact is quite dramatic. During February, Bering Sea Ice hit 100,000 square kilometers below previous record lows for the Month. These record low extents continued throughout March and into early April when, today, we find that Bering sea ice extent is between 150,000 to 200,000 square kilometers below the previous record lows for the day and about half a million square kilometers below the seasonal average.
Putting this loss into context, half a million square kilometers is a region that splits the difference in size between the land mass area of California and Texas.
According to GFS model runs, the present Bering-East Siberia warm spell should last for another 2-3 days even as larger Arctic warming in the range of 2.4 to 3.2 degrees Celsius above average for the entire 66 North Latitude zone and on poleward is expected to continue through the ten day horizon. These warmer than normal temperatures should retard typical seasonal sea ice thickening in the far northern regions even as edge ice zones like those in the Bering, Baffin Bay, and the Sea of Okhotsk experience early spring melt and erosion.
New England Spring Snow
As warm air invades the Arctic — a feature that has become more and more prevalent as the globe itself has heated up — it tends to drive cold air southward over the North American, Asian, and European Continents. In this case, the warm air invasion coming from the Siberian side is displacing Arctic air over North America. As a result, and much to the delight of myth-enraptured climate change deniers everywhere, we have been treated to a rare, if not unheard of, spring April snowstorm in New England.

(Increasingly, there have been indications that polar warming related to global warming is influencing storm tracks and ridge and trough patterns in the Northern Hemisphere Jet Stream. The result is a stronger influence on Mid-Latitude Northern Hemisphere weather. Image source: Arctic Change and Possible Influence on Mid-Latitude Climate and Weather.)
According to local weather reports, as much as 7 inches of snow were dumped in intense 2-inch-per-hour bursts over parts of New England last night as a brief but intense storm roared through the region. The cold air, driven south by the recent warm polar air invasion, encountered high atmospheric moisture levels bleeding off a much warmer than normal Gulf Stream lurking just off-shore. The result, as has been the case during recent intense rain and snowstorms, was enhanced convection. This greater atmospheric uplift, in turn, produced an out-sized spring precipitation event. With below freezing temperatures driven far to the south by warm air entering the Arctic, the Northeast saw its first significant April snow event since 1982.
An April 6th to 7th Snowstorm for the U.S. South on the Way?
Further fodder for the climate change denial community supported by the anti-information campaigns of Fox News and others, may emerge by next weekend as another big push of cold air could help to develop a snow and ice storm stretching from Oklahoma through the Carolinas. Cold air driven out of the Arctic and southward over the Eastern and Central U.S. could result in 10 to 18 degree Celsius below average temperatures in that region. Moisture bleeding off the much warmer than normal Gulf of Mexico and Atlantic Ocean could be injected into this cold trough as a related storm develops. The result is a potentially unusual snow and ice storm. And an intense event off this kind, should it develop, would be a very odd weather event during U.S. spring-time.

(Another odd spring U.S. Snowstorm may be on the way for April 6th and 7th according to GFS model forecasts. Image source: Tropical Tidbits.)
Meanwhile, the U.S. tendency in the model forecasts is for warmer than normal temperatures in the West, cooler than normal temperatures in the East through the middle of April. It’s worth noting that the forecast also shows highly variable temperatures with strong swings between warm and cold throughout this period for most U.S. regions. As a result, as the Arctic remains much warmer than normal over the next ten days, the U.S. is likely to experience periods of both extreme warmth and extreme cold relative to climatological averages for this time of year.
Final Points — Intense U.S. Spring Snowfall Events a Likely Upshot of Polar Warming
Putting all these dynamics into context, we can sum up by making the following statements:
- April snow and even April blizzards are not unheard of for the U.S. East. That said, the recent events are odd and outside the context of regular U.S. weather patterns — particularly when it comes to precipitation intensity.
- Arctic warming and loss of regional sea ice, such as that seen in the Bering, is historically unprecedented during 2018. This is a continuation of an observed trend of polar amplification and severe warming seen during recent years.
- No major global climate zones show below normal temperatures on April 2, 2018. That said, a high variance in middle latitude northern hemisphere temperatures presently exists — with regions of intense cool and intense warmth interspersed.
- Snowstorms in the U.S. Northeast during April do not disprove global warming or a related shift to increasing climate extremes. In fact, they appear to be an aspect of it.
Share this:

Posted by robertscribbler on April 2, 2018
https://robertscribbler.wordpress.com/2018/04/02/seven-inches-of-snow-dumped-on-northeast-as-another-major-arctic-warm-up-is-underway/
Why are So Many Powerful Nor’Easters Striking New England?
A major nor’easter is pummeling states from New York through Maine today with heavy snow, near hurricane force winds, and high surf. The storm is expected to dump 1-2 feet of snow over this region even as it pounds coastlines that have already been raked by two other major storms during the past two weeks.
It would be relatively unusual to see one storm of such intensity striking this region during any given March. But as the third in a two-week-long parade of extreme events, the presently intense storm pattern is starting to look more than a little outlandish.
So what the heck is going on? In a couple handfuls of words — influences related to human-caused climate change are spiking East Coast storm intensity while setting in place a general pattern that causes these storms to repeatedly fire.
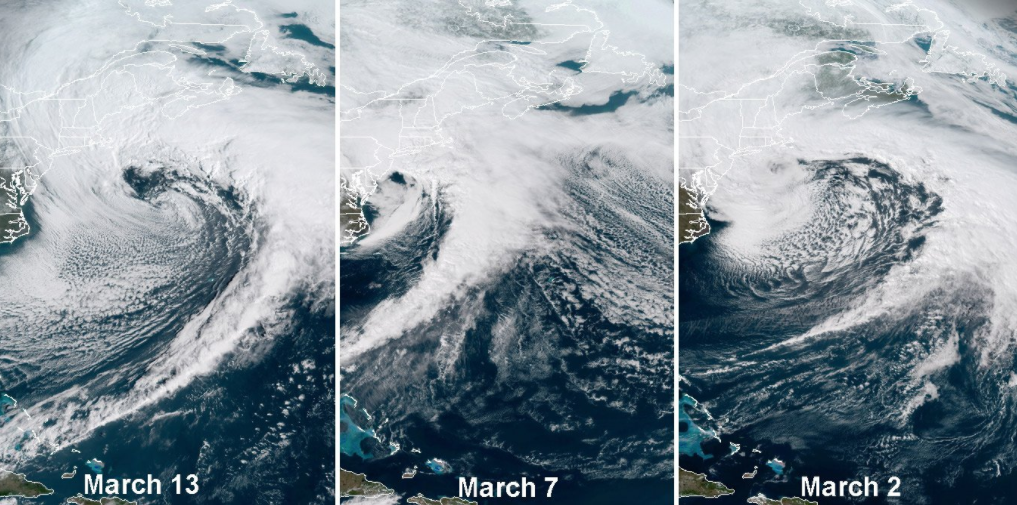
(Over the past 11 days, three major nor’easters have struck the U.S. East Coast. Why have these storms been both so strong and such a persistent feature? Image source: RAMMB/CIRA. H/T to Chris Dolce.)
The Most Recent of Three Powerful Nor’Easters
Presently, the most recent strong storm has an intensity of 970 mb and features winds gusting to hurricane force just off-shore with gusts of up to 69 mph along the coast. Pressures are expected to drop into the upper 960s — making it about as powerful as the system that produced major flooding in parts of New England on March 2nd.
For reference, storm intensity measured by pressure in the range of 970 mb is about as strong as a category 2 hurricane. This is a rough comparison as hurricanes tend to be more intensely concentrated even as nor’easters tend to have broader if more diffuse impacts. But it’s a marker for the high level of atmospheric energy the system is now pumping out and how potentially damaging it could ultimately become.
The storm is thus strong enough to produce record and historic impacts. This is notable enough by itself. But the fact that we have had three systems of similar strength in just 11 days over what is practically the same region is concerning.
(Global warming fuels increased convection as lands waters pump out more heat and moisture. At times, this can result in some unexpected instances of atmospheric pyrotechnics.)
Specifically, on March 7 a 989 mb system raked the same region with gale force winds and instances of intense thundersnow (see above tweet by NOAA). And on March 2nd, a sprawling storm that dipped to around 975 mb generated massive waves and significant coastal flooding.
Atmospheric Train Wreck
Looking for causes, we need to go all the way back to February. At that time, a big polar warming event was taking place. In the upper levels of the atmosphere over the pole, the stratosphere was warming up. But at the same time, surface temperatures at the pole were rising to above freezing. In some locations near Northern Greenland, readings were pushing as high as 63 F above average.
High amplitude Jet Stream waves were eating away at the typically faster polar circulation patterns even as they were helping to inject much warmer than normal air into the Arctic and pull its resident cold air out. Eventually, all this heat running into the various layers of the Arctic atmosphere drove the polar vortex to collapse. This, in turn, resulted in cold Arctic air being ejected south and west into Europe. This massive jet stream dip, in eddy-like fashion produced a large, countervailing high pressure ridge over Greenland.
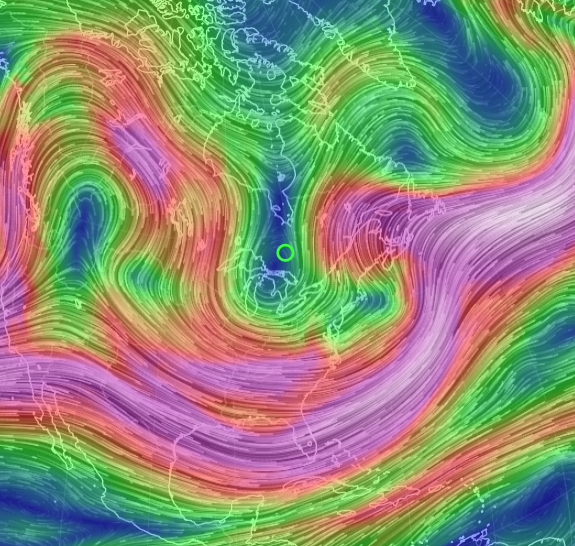
(A deep trough that has consistently lingered over the U.S. East Coast and helped to spawn storm after powerful storm, was initially generated by a very intense polar warming event linked to human-caused climate change. Image source: Earth Nullschool.)
The rippling upper level jumble of winds backed all the way to the U.S. East Coast — forming a deep and persistent trough. The trough funneled numerous disturbances slowly through the region. And it was both the trough’s persistence and depth that enabled strong storms to form repeatedly even as they set off such long-lasting and intense impacts (see Dr Jennifer Francis’s related work on how polar amplification impacts the Jet Stream here).
Much Warmer than Normal Ocean Waters
Though polar amplification — which is another term for how global warming spurs the poles to heat up faster than the rest of the world — helped to generate the upper level features in the atmosphere that would consistently generate storms running across the U.S. East Coast, widespread warmer than normal ocean waters helped to give these storms more fuel.
In the Gulf of Mexico, sea surface temperatures have consistently ranged between 0.5 and 3 C above normal since February. These warm ocean waters contributed to severe floods over the Ohio River Valley at that time by pumping record levels of atmospheric moisture into the storms running south.

(Much warmer than normal sea surface temperatures dominate throughout the Gulf of Mexico and just off the U.S. East Coast. These warmer than normal waters — warmed by climate change — are providing fuel for the powerful nor’easters of recent weeks. Image source: Earth Nullschool.)
As the Jet Stream dip became more oriented toward the East Coast during March, storms that would ultimately blow up over the Atlantic at first got a big plug of moisture from the extra evaporation flowing off that warmer than normal Gulf. But it was over the Atlantic Ocean that the storms would really start to fire. There, ocean temperatures were ranging between 0.5 and as high as 9 C above normal over parts of the Gulf Stream.
Such very warm sea surfaces provide a lot of fuel in the form of moisture and related convection. And, in particular, we saw some rather amazing instances of convective lift during the recent March 2nd and 7th storms as they tapped that incredible Atlantic Ocean heat and moisture.
Conditions in Context
So to sum up, an extreme polar warming event driven in large part by human-caused climate change set up conditions that generated a persistent trough over the U.S. East Coast. This trough was both deep and long-lasting. As low pressure systems moved into the trough zone, they were able to tap abnormal levels of heat and moisture rising off of the Gulf of Mexico and Atlantic Ocean near the coast in order to bloom to abnormally powerful intensity. Both of these factors — Arctic warming and warmer than normal sea surface temperatures — would not have been as acute or intense without the extra push to the climate system that human forced warming provides. As a result, we are seeing a very strong climate change related signal in the present severe storm pattern.
(UPDATES TO FOLLOW)
Share this:

Posted by robertscribbler on March 13, 2018
https://robertscribbler.wordpress.com/2018/03/13/why-are-so-many-powerful-noreasters-striking-new-england/
Sudden Stratospheric Warming and Polar Amplification: How Climate Change Interacts With the Polar Vortex
Over the past few years, the term Polar Vortex has dominated the broadcast weather media — gaining recent notoriety due to increasingly extreme weather events associated with a number of disruptions to Arctic atmospheric circulation patterns. In short, this swirl of cold air over the furthest north regions is being intensely disrupted by warm air invasions — both at the surface and in the upper levels of the atmosphere. A subject that we’ll explore further as part of this analysis.
Take the recent extreme February warming at the North Pole in which temperatures there rose to above freezing even as a major cold snap slammed into Europe this week. We’ve seen such varied headlines as Yes the North Pole is Warmer than Europe Right Now and Arctic Warm Event Stuns Scientists.
When it’s warmer at the pole than in Europe, it’s a sign that the weather is clearly out of whack. Especially when temperatures in a region spanning tens of thousands of square miles over the Arctic rocket to between 40 and 63 degrees Fahrenheit above normal. Scientists are notably concerned. Dr. Michael Mann, one of the world’s foremost experts on climate change characterized the polar warming event as:
…an anomaly among anomalies. It is far enough outside the historical range that it is worrying — it is a suggestion that there are further surprises in store as we continue to poke the angry beast that is our climate.
But what’s driving all this? Dr. Mann gives us a bit of a hint by describing our climate as an angry beast that’s being poked.

(Polar Amplification writ large. The entire region of the Arctic above the 80 degree North Latitude line has been 8.64 degrees Celsius warmer than normal for all of 2018 thus far. This is an extraordinary departure for a region that plays a critical role in how the Earth’s climate system functions. Image source: DMI.)
Perhaps another way to say it is that it’s a warming atmosphere that’s prodding the Jet Stream to take a chunk out of the Polar Vortex.
First, surface warming in the Arctic caused by increased radiative forcing from rising greenhouse gas levels and by follow-on reductions of Arctic sea ice and snow result in less temperature difference between the Pole and the Equator. This surface warming translates into higher levels of the atmosphere through convection.
Temperature difference is what drives the upper level winds. So a lower difference in temperature causes these winds to slow. When the Jet Stream winds slow, they tend to meander — forming large ridges and deep troughs. The elongated ridges and troughs eventually break like waves — pushing against the circulation of the Polar Vortex.

(NOAA graphic shows how a weak jet stream results in changes in atmospheric circulation and increased disruption of the Polar Vortex.)
When this happens, the speed of the winds that make up the Polar Vortex slow down and sometimes reverse. This results in the collapse of the column of upper level air held aloft by the Vortex’s winds. When the air collapses, it compresses, causing the stratosphere to warm. This falling column of warm air then can end up acting like an atmospheric wedge — driving the Polar Vortex apart and causing it to split.
The split then tends to generate smaller funnels that capture polar air and pull it south. Beneath the funnels, it can be quite cold as Arctic air invades places like North America or the UK (as happened this week). But at the Pole, where the cold air should typically reside, it warms up enormously.
That’s how, under a regime of human-forced climate change, you can end up with periods where temperatures are warmer at the Pole than they are in Europe.
It’s worth noting that Polar Vortex collapse events did occur in the past. But not in such a way that generated the kinds of historically extreme Arctic temperatures we see today. The primary driver for the recently increased extremity of weather driven by Polar Vortex collapse events being human-caused climate change, Polar Amplification, and related influences on the Jet Stream.
Share this:

Posted by robertscribbler on February 28, 2018
https://robertscribbler.wordpress.com/2018/02/28/sudden-stratospheric-warming-and-polar-amplification-how-climate-change-interacts-with-the-polar-vortex/
A Large Area of Open Water Forms in the Melting Sea Ice North of Greenland During February
In concert with an unprecedented polar warming event, it now appears that the Atlantic side of the Arctic Ocean is seeing some severe sea ice losses.
Warm winds blowing at up to gale force intensity from the south have assaulted the ice with high waves and above-freezing temperatures for about four days now. The ice edge north of Svalbard is being rapidly beaten back. Perhaps more disturbing, is the fact that the ice pack to the north of Greenland has also now withdrawn — opening up a huge polynya.

(Massive hole in the sea ice expands north of Greenland on February 26th. Image source: NASA.)
Looking at the N. Greenland area, we find a fractured, thinning mess along a region of sea ice that should be meters thick and growing thicker at this time in February. Such a state would be remarkable during summer time, but is much more-so in what should be the dark chill of winter polar night.
To be clear, as Neven notes in his most recent Sea Ice Blog, it’s not simply wind blowing the ice around here. It’s melt due to temperatures rising between 40 and 60 F above average over a large region of the Arctic. A region that yesterday saw a 33-34 F (1-2 F above freezing) temperature at the North Pole.
Closer to the massive expanse of water opening up in the ice, Cape Morris Jesup, the furthest north point in Greenland, has now experienced 61 melting hours during winter in 2018. This is comparable to 2011, which set the previous record for winter and early spring melt at 16 hours for the Morris Jesup location. This weekend, the typically frigid point on Greenland’s north coast saw a 43 degree Fahrenheit high in the 24-hour-long darkness (no sunlight or insolation) and at a time when usual daily peak readings hit a frosty -20 F.
The underside of sea ice melts at around -2 C, due to the salt content in the water. But surface portions of the ice still need above freezing temps to result in melt and ponding. Since this region of the Arctic tends to remain near or well below freezing year-round, the present temperatures are enabling unprecedented winter damage to the ice and the environments it supports.
Overall, Arctic sea ice extent is now at record low levels for this time of year. According to JAXA, hitting 13.64 million square kilometers today — or nearly 2 million square kilometers below 1980s averages.
These record daily and seasonal lows are occurring following a major loss of ice in the Bering Sea and in concert with the rapid sea ice setbacks we are presently seeing on the Atlantic side.
It is possible, given the present trend, that the Arctic will experience back-to-back years of record low seasonal ice during winter. 2016-2017 saw a crash in winter sea ice and we are presently even below the record low extents seen at that time.

(Arctic Basin sea ice is at record lows and trending lower. Image source: The Arctic Sea Ice Blog. Graph by Wipneus.)
Only a month and a half of typical freeze season remains. But ten day forecasts indicate that Arctic region mean temperatures might return closer to normal ranges (0 to 1 C above average as opposed the 3-6 C above average) and could allow for some moderate recovery of the substantially reduced winter ice pack.
Overall, though, the tale so far has been one of highly unusual melt and warming. One that highlights the serious and worsening impacts of human-caused warming and related polar amplification.
(UPDATES TO FOLLOW)
Share this:

Posted by robertscribbler on February 26, 2018
https://robertscribbler.wordpress.com/2018/02/26/a-large-area-of-open-water-forms-in-the-melting-sea-ice-north-of-greenland-during-february/
A Hole in Winter’s Heart: Temperatures Rise to Above Freezing at the North Pole in February
“Weather is not Climate.”
But when a warm air influx carves a wide-ranging above-freezing hole into the heart of what should typically be ice-solid Arctic winter, then maybe it’s time to start re-evaluating the gist of the statement.

(Today, on Sunday February 25, 2018 at 0900 UTC — temperatures rose to above freezing at the North Pole. This event, which is probably unprecedented or, at the very least, an extreme instance in the polar record, is an exemplar — or a good example — of the kinds of wrenching weather changes we can expect as a result of human-caused climate change. Image source: Earth Nullschool. Data source: Global Forecast System Model.)
Weather and climate are inexorably married one to the other. Though weather is often variable and tied to locality, climate is broader-ranging and roughly characterized as average weather over 30 years. When climate changes, it ultimately changes average weather. It thus changes the rules in which weather occurs. So you can end up with weather events that are typically not common or have never been seen before — like category six hurricanes, much more heavy rainfall events, historic and unprecedented droughts, and above freezing temperatures at the North Pole during February even as Arctic air is driven south over Europe.
In the context of climate change, what we’re talking about is average global weather across the span of multiple decades. In some locations, this ongoing climate change has resulted in very little perceptible weather change. In other locations, and this is more and more-so the case, the changes to weather are both disruptive and profound.
https://twitter.com/SarahEMyhre/status/967281971679305728
We could say that they are, as Dr. Sarah Myhre noted in our little climate and weather chat yesterday, exemplars — or good examples of alterations that are characteristic of human-caused climate change.
******
Since late January, we’ve been tracking the potential for just such an exemplar extreme weather event — temperatures rising to above freezing at the North Pole during February.
The persistent weather patterns necessary for such an event were already well in play. At the surface, warm air was continuously running northward just east of Greenland — born pole-ward by powerful storms and frontal systems. At the upper levels of the atmosphere, a huge plug of warm air was developing. One that invaded the stratospheric levels of the atmosphere by the week of February 4-11. This plug, in synergy with surface warming, tore apart the heart of cold at the roof of our world that we call the Polar Vortex.

(Daily mean temperatures for the entire region of the Arctic above the 80 degree north latitude line rocketed upward to new records over recent weeks. Most recent temperatures are comparable to those typically seen during late May. Image source: Zachary Labe, Arctic Temperatures.)
Nodes of cold air from the remnant Polar Vortex spiraled south — bearing with them regional packets of Arctic air and setting off extreme cold weather in the middle latitudes. Meanwhile, the polar zone just kept warming up into ranges that were increasingly uncharacteristic of Arctic winter.
An extreme wave in the Jet Stream was developing and elongating over the North Atlantic, delivering more and more warm air northward.
By February 21st, the wave had extended into a knife-like extension east of Greenland and through the Barents Sea. Beneath this abnormal Jet Stream wave, which was starting to look more and more like a trans-polar river (of a kind predicted by Dr. Jennifer Francis as a result of human-caused Polar Amplification), was an intensifying thrust of outlandishly warm surface air.
![]()
(Jet stream wave originating near Spain extends northward past the North Pole on Sunday, January 25, 2018. Image source: Earth Nullschool.)
Over the past 72 hours, gale force warm, southerly winds gathered in the Atlantic, then blasted north.
At this point, we were starting to see some seriously outlandish temperatures in the higher latitude regions. Cape Morris Jesup, which is the furthest north location on Greenland, by Friday the 23rd experienced 6 C or 43 F temperatures on the shores of what should be a frozen solid Arctic Ocean just 400 miles from the North Pole.
The average high temperature in Cape Morris Jesup is -20 degrees Fahrenheit during February — making Friday’s reading a whopping 63 degrees F warmer than average. For reference, a similar departure for Washington, DC would produce a 105 degree day in February.
But it wasn’t just Cape Morris Jesup that was experiencing July-like conditions for the Arctic during February. For the expanding front of that ridiculously warm winter air by Sunday had expanded into a plume stretching tens of thousands of square miles and including a vast zone of temperatures spiking from 45 to 54+ degrees F above normal.

(The zone of pink-to-white in the above anomaly map shows temperatures ranging from 45 to 54 F [25 to 30 C] above average directly over a broad Arctic region centering on the North Pole. To this weather and climate observer, it looks like a hole in the heart of winter. Also note the region of cold air pushed south over Europe and the present above average [1981-2010] global reading. Image source: Climate Reanalyzer.)
And at the center of the warm air pulse was today’s earlier reading of 1.1 C or 34 F at the North Pole (see image at top of post). What would typically be a summer-time temperature for this furthest north location of our world happening during February. A highlight warm point in the midst of a vast plug of far warmer than normal air. A hole in the heart of winter.
We’ll wait for confirmation from experts like Chris Burt, Bob Henson, and Dr. Jeff Masters at Weather Underground, but it appears that this particular warming event — the highlight of an ongoing polar warming of the past few weeks — is without precedent in the Arctic during February. It is also an exemplar — a good example — of the kind of weather we can expect to frequent the Arctic more and more often as the global crisis that is human-forced climate change deepens and as its primary cause — fossil fuel burning — continues.
(Please also see Neven’s related excellent expert analysis of this unprecedented polar warming event at the Arctic Sea Ice Blog here. More to follow on impacts to sea ice in a developing post.)
Share this:

Posted by robertscribbler on February 25, 2018
https://robertscribbler.wordpress.com/2018/02/25/a-hole-in-winters-heart-temperatures-rise-to-above-freezing-at-the-north-pole-in-february/
North Pole Region Predicted to Experience Another Instance of Above Freezing Temperatures as the Bering Sea Ice is Blasted Away
Those previously rare instances of above freezing temperatures in the Arctic north during winter time are happening more and more often.

(February 20 NASA satellite imagery shows Bering Sea with mostly open water as highly atypical above freezing temperatures drive far north. Note that patches of open water extend well into the Chukchi Sea. Image source: NASA.)
Just Monday and Tuesday of this week, Cape Jessup, Greenland — a mere 400 miles away from the North Pole — experienced above freezing temperatures for two days in a row. This following a February 5 warm air invasion that drove above 32 F temperatures to within 150 miles of this furthest northerly point in our Hemisphere even as, by February 20th, a warm air invasion relentlessly melted the Bering Sea’s typically frozen surface (see image above).
Far Above Average Temperatures Over Our Pole
It’s not just a case of warming near the pole itself. It’s the entire Arctic region above the 66 degree North Latitude line. Over the past few days, Arctic temperature anomalies have exceeded 6 degrees Celsius above the 1981 to 2010 baseline. A period that was already showing a serious warming trend.

(Insane levels of warmth relentlessly invade the Arctic during February — hammering the sea ice and wrecking havoc on local environments. Image source: Climate Reanalyzer.)
For reference, 6 C warmer than normal daily readings for any large region of the Earth’s surface is a very serious temperature departure. And the Arctic is clearly feeling it as it suffers the lowest sea ice extent in our record keeping. The heat is meanwhile wreaking out of control harm on the Arctic environment — endangering key species like seals, walrus, puffins, and polar bears, setting off very rapid coastal erosion as storm waves grow taller, triggering far more extensive and powerful Arctic wildfires, and causing mass land subsidence and various harmful environmental feedbacks from permafrost thaw. It’s also causing Greenland’s massive glaciers to melt faster — contributing to an acceleration in the rate of global sea level rise.
The warm air has been invading primarily from the ocean zones in the Atlantic and the Pacific. Warm storms have frequently roared north through the Barents Sea and up the Greenland Strait near Svalbard. Massive blocking high pressure systems have shoved outlandishly warm temperatures through the Bering Sea on the Pacific side day after day, month after month.
Warm Air Invasions Clear Sea Ice During Winter
A recent warm air invasion has practically cleared the Bering Sea of ice. And the ice edge there is further withdrawn than it has ever been in its history. As we can see from the below animation, this crazy and rapid clearing of ice continues to drive further and further north — ushered in by a relentless invasion of warm air — during February. A time when Bering ice should be expanding, not contracting.
What’s causing such extreme polar weather? In two words — climate change. But drilling down, the details can actually get pretty complicated.
During recent winters, human-caused climate change has been driving temperatures into never-before-seen ranges over our northern pole. Increasingly, Sudden Stratospheric Warming events have been propelling warm air into the upper layers of the atmosphere. The Polar Vortex, which during winter relies on a column of sequestered cold air to maintain stability, is blown off-kilter as these upper level layers heat up. This, in turn, has generated extreme wave patterns in the winter Northern Hemisphere Jet Stream — enabling much warmer than usual temperatures to rocket northward.
An Ongoing Series of Warming Events
On December 30 of 2015, and enabled by a high amplitude Jet Stream wave, a powerful warm storm event pushed a strong wedge of warm, above freezing, air all the way across the 90 North Latitude line. Meanwhile, Jessup Greenland hit above freezing for what was likely the first time ever over the past two winters. Last year’s Arctic sea ice hit the lowest levels ever seen during March due to all the extra heat. And the warm temperature extremes appear to be deepening.
Now, as of mid February, a powerful Sudden Stratospheric Warming Event has again blown the Polar Vortex off kilter — weakening it and enabling warm air to flood into the Arctic even as colder air is displaced southward over Canada, the Western U.S. and Europe. Translating to the surface, this train wreck in the upper level winds has driven the extreme polar warming events of the past 8-10 days even as cold air invasions have overtaken Europe and the U.S. East experiences record-breaking heat.
The polar warming event is still ongoing. And it is expected to deliver another blow to an Arctic environment that typically experiences -30 degree Celsius temperatures this time of year. For another major warm wind invasion is forecast to drive above freezing temperatures over the North Pole by this weekend. Strong south to north winds along an extreme ridge in the Jet Stream are predicted to push 1-2 C temperatures (or approximately 55 F above average temps) over the North Pole on Saturday and Sunday.

(High amplitude Jet Stream wave predicted to drive North Pole temperatures to above freezing by Sunday. Image source: Earth Nullschool.)
Though rare during December, above freezing temperatures at the North Pole during February are practically unheard of. The period of February through April should be a time of strengthening and thickening ice ahead of melt season. But during 2018 this appears not to be the case. The ice instead, in key regions, is being delivered with serious setbacks which is greatly retarding this year’s typical Arctic Ocean ice formation.
If this most recent polar warming event emerges as predicted, it will provide yet one more powerful blow to an already greatly weakened Arctic sea ice pack during a time of year when extents and areas should be reaching their peak. And that’s bad news for both the Arctic and global environments.
Share this:

Posted by robertscribbler on February 21, 2018
https://robertscribbler.wordpress.com/2018/02/21/north-pole-region-predicted-to-experience-another-instance-of-above-freezing-temperatures-as-the-bering-sea-ice-is-blasted-away/
Extremely Warm Cyclone Predicted to Drive 50-60 F Above Average Temperatures Across North Pole
Our lexicon of what’s considered to be normal weather does not include February days in which temperatures at a North Pole shrouded in 24-hour darkness cross into above freezing ranges. But that’s exactly what some of our more accurate weather models are predicting will happen over the next five days.
Another Unusually Warm and Powerful Storm
During this time, a powerful 950 to 960 mb low is expected to develop over Baffin Bay. Hurling hurricane force gusts running from the south and digging deep across the North Atlantic, Barents, and Arctic Ocean, the low is projected to drive a knife of 50-60 F above average temperatures toward the North Pole by February 5th.

(20-25 foot surf heading for the increasingly fragile sea ice in this February 4 wave model forecast. Note the 30-40 foot waves off Iceland and associated with the same storm system that is predicted to bring above freezing temperatures to the North Pole on February 5th. Image source: Earth Nullschool.)
These warm winds are predicted to bring above freezing temperatures to areas that typically see -20 to -30 F readings in February. They are expected to rage over a sea ice pack that is at record low levels. And if the storm emerges, it will hammer that same dwindling ice pack with 20 to 25 foot or higher surf.
Fragile Arctic Sea Ice Faces a Hammering
Presently, Arctic sea ice extent is trending about 200,000 square kilometers below record lows set just last year for the period of late February. And recent scientific research indicates that warm winter storms like the one that is now predicted to form can have a detrimental impact on sea ice.

(Arctic sea ice extent is presently at around 13 million square kilometers [bottom red line] — a new record low for this time of year. It should be around 15 million square kilometers and would be if the world hadn’t warmed considerably since the 1980s. Image source: JAXA.)
Not only do the storms bring warmer temperatures with them — a kind of heat wave that interrupts the typical period of winter freezing — they also drive heavy surf into a thinner and weaker ice pack. The surf, drawn up from the south churns warmer water up from the ocean depths. And the net effect can dissolve or weaken large sections of ice.
The presently developing event is expected to begin to take shape on February 4th, with warm gale and hurricane force winds driving above freezing temperatures near or over the North Pole on February 4th – 6th. To say that such an event, should it occur, would be practically unprecedented is the common understatement of our time. In other words, this is not typical winter weather for the North Pole. It is instead something we would expect to see from a global climate that is rapidly warming and undergoing serious systemic changes.

(February 5 GFS model run shows above freezing temperatures crossing the North Pole. Temperatures in this range are between 50 and 60 degrees [F] above average for this time of year. If the extremely warm cyclone event occurs as predicted, it will be a clear record-breaker. It will also further harm Arctic sea ice levels that are already in record low ranges. Image source: Climate Reanalyzer.)
Extreme Cyclone Beneath an Extreme Jet Stream
In the predicted forecast we see more of the extreme jet stream waves that Dr. Jennifer Francis predicted as an upshot of human-forced polar amplification (a condition where the poles warm faster than the rest of the globe under a larger warming regime). The particular wave in question for the present forecast involves a high amplitude ridge running very far to the north over Svalbard and knifing on into the high Arctic. The facing trough over Baffin Bay, Greenland, and North America is also quite pronounced and elongated. A feature that appears to want to become a cut off bubble of displaced polar air in a number of the model forecasts.
High amplitude Jet Stream waves during Northern Hemisphere winter as a signature of global warming are predicted by Francis and others to generate greater temperature and precipitation extremes in the middle latitudes. They are a feature of the kind of stuck and/or upside down weather we’ve been experiencing lately where temperatures in the Northeast have been periodically colder than typically frigid locations in Alaska. These flash freezes have, at times, faded back into odd balmy days in the 50s and 60s (F) before plunging back into cold. But the overall pattern appears to get stuck this way for extended periods of time.

(Very high amplitude ridge and trough pattern at the Jet Stream level of the circumpolar winds is thought by a number of scientists to be a feature of human caused global warming. One that is related to polar amplification in the Arctic. Image source: Earth Nullschool.)
Heat in the Arctic is driving sections of cold air south even as warm air invades through places like Alaska, Northeast Siberia, and the Barents Sea. But the main variables of this story are global heat, global warming, fixed extreme temperature and precipitation patterns, and warm air invasion. The winnowing streamers of cold air driven out over places like the U.S. Northeast are just a side effect of the overall warming trend. One that is starkly apparent in the very odd western warmth that has grown more and more entrenched with each passing year.
For Now, It’s Still Just a Forecast
As with any five day forecast, we can take this one with more than just a grain of salt at the present time. But such an extreme event is entirely possible during the present age of human-forced climate change. During late December of 2015, we identified a predicted major storm that ultimately drove North Pole temperatures to above freezing. At the time, that storm was considered unusual if not unprecedented. However, since February is typically a colder period for the North Pole region, a warm storm drawing above freezing air into that zone would be even more unusual. It would also be a feature of the larger trend of loss of typical seasonal winter weather that we’ve been experiencing for some time now.
5 FEB UPDATE: Storm and Heat a Bit Further South and East Than Predicted
A powerful warm storm in the 952 mb range did form and track across Greenland to exit over the Greenland Strait earlier today. The storm drove warm air far north, pushing above freezing temperatures past Svalbard and over the dark and frozen sea ice. It hurled gale force winds, hurricane gusts, and massive swells into the ice. But it did not push temperatures to above freezing at the North Pole as some models had earlier predicted.

(Warm cyclone hurls much warmer than normal temperatures across the Barents Sea and Arctic Ocean on 5 Feb, 2018. Image source: Earth Nullschool.)
It did, however crank temperature there up to -4.3 C or about 26 C above average for this time of year.
The storm is now predicted to drive above freezing temperatures across the Barents Sea, over Novaya Zemlya, through the Kara Sea and ultimately into Northern Siberia over the next 24-48 hours. In numerous regions, temperatures are already hitting near 30 C (54 F) above average. This extremely warm spike relative to typical conditions — associated with a high amplitude Jet Stream wave and related cyclone — will continue to ripple through the Arctic over the next few days.
Overall, total Arctic region temperature anomalies are predicted to range from 2.5 to 3.5 C above the 30 year average for the next few days. These are very warm departures. But not so warm as recent spikes in the range of 4 to 5 C above average for the region. In addition, there appears to be a tendency for powerful warm storms to continue to develop near Svalbard in the longer 5-15 day model runs. So the North Pole isn’t out of the woods yet for potential above freezing temperatures this February.
Share this:

Posted by robertscribbler on January 31, 2018
https://robertscribbler.wordpress.com/2018/01/31/extremely-warm-cyclone-predicted-to-drive-50-60-f-above-average-temperatures-across-north-pole/
Record Warmth Blankets Alberta
Extreme warmth associated with a powerful western high pressure ridge and conditions related to climate change has broken temperature records across Western Canada during recent days.
On December 9, the southern Alberta cities of Lethbridge and Grand Prairie saw temperatures rising to record highs of 14 C or 57 degrees Fahrenheit. Meanwhile, Calgary experienced 15.4 C temperatures (60 degrees F) — which shattered the previous record of 14.4 C that had stood for 127 years. Four other cities in southern Alberta also saw record warm temperatures on Saturday.
For context, temperatures for this region typically range between -1 to -13 C this time of year.

(The first 11 days of December show far above average temperatures for most of Western North America and the Arctic. Image source: Global and Regional Climate Anomalies.)
The primary feature driving such extreme temperatures is a power high pressure ridge that has been anchored in place during November and December. The ridge has been drawing warm air north and generating unusually warm weather for regions from the U.S. West through central and western Canada and on up into the Northwest Territories and Alaska.
Very slow reformation of sea ice in the Chukchi and Bering Seas is a likely contributing factor to the ridge. A physical feature associated with human-caused climate change. La Nina is likely also enabling the synoptic transfer of heat into both the Arctic and the North American West through a very pronounced Rossby type wave pattern in the Jet Stream. But present Arctic warmth in the range of 3-5 C above climatological averages is well beyond 20th Century norms during La Nina years. It is instead primarily an upshot of polar amplification — where human-forced warming due to greenhouse gas emissions generates more warming at the poles than in the lower latitudes. So climate change related factors are also influencing this overall warmer than normal pattern.

(Above freezing temperatures aren’t typical for Alberta this time of year. But the region was blanketed by 40-60 degree [F] highs on Saturday. That’s 9 to 27 degrees [F] above average. Image source: Earth Nullschool.)
As a result, places like Calgary haven’t received any snowfall so far this year during December. A situation that is likely to continue for at least the next five days as warmer than normal conditions are expected to persist.
December is typically a rather snowy month for Calgary — receiving 8 days of snow during a normal year. But this year isn’t really that normal and the climate, with global temperatures exceeding 1 C above 1880s averages, isn’t normal anymore either.
CREDITS:
Hat tip to Dobby
Share this:

Posted by robertscribbler on December 12, 2017
https://robertscribbler.wordpress.com/2017/12/12/record-warmth-blankets-alberta/
54 Fahrenheit Above Average: Extreme Warming Event For Greenland, Baffin Bay Underway
At the mouth of Baffin Bay just off the West Coast of Greenland today hurricane force wind gusts are blowing in from the south.
This roaring invasion of warm air originates from the Central Atlantic along a latitude line south of the Azores. It climbs hundreds of miles north to where it is intensified between a grinding 975 mb low off Labrador and a massive 1042 mb high squatting over Central Greenland. Temperatures in this warm air mass range from near 50 degrees (F) over Southwestern Greenland to around 40 degrees (F) over the mouth of Baffin Bay. Or between 9 and 36 degrees (F) above normal for this time of year.
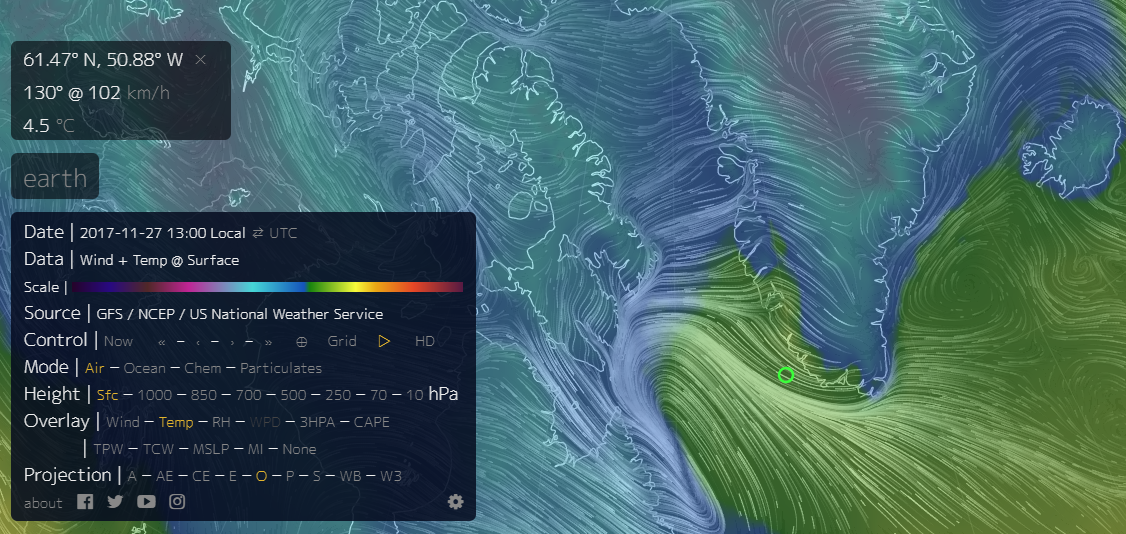
(Hurricane force wind gusts are driving a wedge of above freezing air into Baffin Bay and over Western Greenland at a time when these regions should be seeing well below freezing conditions. Image source: Earth Nullschool.)
This warm wind driven air mass is expected to move north over the next 24 to 48 hours. It will steadily blanket both glaciers and areas typically covered with sea ice. And as it does so, it will push temperatures above freezing for large sections of both Baffin Bay and Western Greenland with above 32 F readings progressing as far as the Petermann Glacier.
What this means is that temperatures will likely hit record ranges of up to 54 degrees Fahrenheit above average in some locations near the far northern extent of this expected warm air invasion. Overall, Greenland itself is expected to see 15 degree (F) above average readings for the entire island. This will generate brief surface melt conditions for parts of Greenland during late November.

(Large region of 20 to 30 C, or 36 to 54 F, above average temperatures is predicted to blanket Greenland and the Canadian Archipelago after moving north through Baffin Bay over the next two days. Image source: Global and Regional Climate Anomalies.)
Strong warm air invasions of the Arctic at this time of year are a signal coming from human-forced climate change. As the northern pole darkens with winter, a global warming related phenomena called polar amplification ramps up. In addition, during recent years, we’ve seen warm air slots tend to develop beneath strong ridging features in the upper level Jet Stream. This year, the warm air slots have tended to form over the Bering Sea along the Pacific side of the Arctic and progress northward into the Chukchi. This has resulted in a large zone of ice free waters for a typically frozen region between Alaska and Siberia as warm winds and storm force waves have continuously beat the ice back.
The present warm air invasion for Greenland may be a signal that a similar warm air slot is attempting to develop over Baffin Bay going forward. Or it may be a fluke in the overall pattern. Watch this space.
UPDATE 11/29/2017: As predicted, temperatures over the Petermann Glacier hit above freezing at around 2200 UTC yesterday. According to climate reanalysis, temperatures for the region are ranging between 50-54 F above average in present model estimates for 11/29. In other words, the warm air invasion progressed as expected and resulted in above freezing temperatures for brief periods across Western and Northern Greenland.
Overall temperatures for Greenland are presently 15.5 F (8.6 C) above average in the models while the Arctic as a whole is 9.9 F (5.5 C) above average.
Share this:

Posted by robertscribbler on November 27, 2017
https://robertscribbler.wordpress.com/2017/11/27/54-fahrenheit-above-average-extreme-warming-event-for-greenland-baffin-bay-underway/
Predicted Record 94 Degree (F) November Temperatures for Dallas as Globe Warms Despite Trend Toward La Nina
The globe should be cooling relative to recent and near record warm summer temperatures. But it isn’t. La Nina like conditions, the Pacific Ocean pattern that generally precipitates globally cooler weather, is again spreading across the Equatorial Pacific. Yet if you’re living in Dallas, Texas, or many other places across the globe, you wouldn’t know it.
For this week, temperatures in Dallas are expected to exceed all previous records since monitoring began back in 1898.

(Record warm temperatures predicted for Dallas later this week. Image source: Euro Model.)
According to meteorologist Ryan Maue, and to reanalysis of Euro weather model data, Dallas is expected to see temperatures between 90 and 94 degrees Fahrenheit by Friday of this week. Readings that would be considered pretty hot for a normal summer day occurring on November 3rd. That’s really odd. Especially when you consider the fact that Dallas has never experienced a 90+ degree high temperature from October 31 through December 29 in all of the past 119 years.
If Dallas does hit 94 on Friday, that will be 21 degrees (F) above typical high temperatures there for this time of year.

(According to GFS Model Reanalysis, the globe has warmed through Northern Hemisphere Fall despite a trend toward La Nina. Image source: Global and Regional Climate Anomalies.)
Drawing back from focus on the Dallas region, we find that the world overall is also warming relative to June through September temperature departures. A climate change associated warming that appears to have been kicked off, primarily, by warmer than normal temperatures at the poles (see previous article). This despite cooling Equatorial Pacific Ocean surface waters associated with a 55 to 65 percent of La Nina formation by winter.
In a normal climate system, we would expect a trend toward La Nina to produce relative cooling. But this does not appear to be happening as June warm temperature departures were lower than those during August through October. Preliminary GFS reanalysis indicates that October warm temperature departures were higher than those occurring in September — likely hitting around 1.1 C above 1880s averages (see image above).
So despite a weak La Nina forming, it again appears that polar warming is a major driver for global temperatures as fall moves into winter. Climatologists take note.
RELATED STATEMENTS AND INFORMATION:
Links:
Global and Regional Climate Anomalies
Share this:

Posted by robertscribbler on November 1, 2017
https://robertscribbler.wordpress.com/2017/11/01/predicted-94-degree-f-november-temperatures-for-dallas-as-globe-warms-despite-trend-toward-la-nina/
A Visibly Extreme Jet Stream in Advance of Irma
On Tuesday, I wrote this blog about how Jet Stream behavior and related severe weather during summer of 2017 jibed with the findings of recent climate science. About how human-forced polar warming appears to be impacting extreme summer weather patterns by altering the upper level winds — with a particular focus on impacts to North America.
Yesterday, I looked at the upper level wind patterns running over North America in advance of Irma’s approach and saw this:

(Classic ridge-trough pattern like that identified by Dr Jennifer Francis and Dr Michael Mann. One that, according to their related research, increases the likelihood of certain kinds of extreme weather patterns and events. One that these scientists associate with polar warming set off by human-caused climate change. Image capture from 1500 UTC on September 6. Image source: Earth Nullschool.)
It’s a classic high amplitude wave form in the Jet Stream. One that shows an extremely deep trough digging all the way down to the Gulf Coast in the east and arching back up into a pointed ridge north of Alaska and into the Arctic Ocean in the west. This kind of high amplitude wave pattern is not typical. Or if such a pattern did appear in the past, it tended not to stick around for so long. But during this summer, such intense high amplitude ridges have been forming again and again over the west and such deep troughs have been forming again and again in the east.
New Precipitation and Temperature Extremes
The most apparent visible effect of this ridge-west — trough-east pattern has been to produce record heat, drought, and wildfires in the west and record rainfall in conjunction with an extremely stormy weather pattern in the south and east. You can plainly see this dipolar relationship in the precipitation and temperature anomaly maps provided by NOAA below:

These maps cover precipitation and temperature observations for the last 30 days compared to climatological averages. In the west we find that precipitation for large regions has been less than 10 percent of normal (less than 1/10th normal). Meanwhile temperatures in the west have ranged between 1 and 4 C above average. In the south and east, large regions have seen between 200 and 800 percent of typical precipitation amounts (2 to 8 times the norm). Temperatures, meanwhile have ranged between 1 and 3 C below average.
This is the very definition of heightened extremes. Looking at the prevalent upper level air pattern over the U.S. for the summer of 2017, it’s clear that south to north upper level winds pulling air up from the Equatorial zone toward the pole are facilitating one side of the extreme and that a countervailing upper level wind originating near the pole and running south toward the tropics is driving the opposite extreme.
Slowing Upper Level Winds in a North-South Orientation Weakens the Steering Currents
Unfortunately, prevalent and long lasting heat or heavy rainfall isn’t the only apparent impact of this new pattern. Another aspect of this extreme dipole is a weakening of the west to east steering currents that typically begin to pick up in a region between 25 and 30 degrees North Latitude and to intensify further beyond the 30 N line. This effect is due to the fact that upper level wind patterns are oriented more in a north-south (west) or south-north (east) direction and due to the fact that under such large Jet Stream meanders the upper level steering winds tend to slow down.
https://twitter.com/RyanMaue/status/905689235486887936
(It’s not just Harvey and Irma. Weak upper level steering currents are contributing to a long range potential that Jose might loop back to strike South Florida.)
For Hurricanes like Harvey and Irma, stronger west to east steering winds have had two protective effects for the United States. First, they have helped storms to keep moving — working to generally prevent the kind of long duration stall we saw that helped to produce such catastrophic flooding during Harvey. Second, they have tended to deflect storms away from the U.S. East Coast. And for Irma, what this means is that this storm is more likely to strike the U.S. East Coast if the upper level steering winds that would typically turn it to the east are weak.
This is a dynamic upstream aspect of human-forced polar warming. One that produces added extreme weather risks on top of those already generated by warming ocean waters — which increase peak potential storm intensity — and rising atmospheric water vapor — which helps to add latent heat, lift and related convective available potential energy that increases top limits for storm intensity and heavy rainfall.
And as we sit here hoping and praying that Irma will re-curve away from the U.S. east coast, we should consider how polar warming may be helping to make such a terrible strike more likely — increasing risks to so many people and to so much that we all hold dear.
RELATED STATEMENTS AND INFORMATION:
Links:
GFS Model Runs illustrated by Earth Nullschool
Extreme Weather Events Linked to Climate Change’s Impact on Jet Stream
This is the Pattern Climate Scientists Warned us About
Hat tip to Scott
Hat tip to Wharf Rat
Share this:

Posted by robertscribbler on September 7, 2017
https://robertscribbler.wordpress.com/2017/09/07/a-visibly-extreme-jet-stream-in-advance-of-irma/
April of 2017 was the Second Hottest in 137 Year Climate Record
According to measurements by NASA’s GISS global temperature monitoring service, April of 2017 was warmer than all past Aprils in the climate record with the single exception of 2016.
The month came in at 0.88 degrees Celsius above NASA’s 20th Century baseline and fully 1.1 degrees Celsius above 1880s averages. This measure was just 0.01 C warmer than now third warmest 2010 and 0.18 C shy of last year’s record. All of the top ten hottest Aprils on record have occurred since 1998 and six of the top ten hottest Aprils have occurred since 2010.

(During April of 2017, and with only a few moderate exceptions, most of the world experienced above normal to considerably above normal surface temperatures. Image source: NASA GISS.)
The first four months of 2017 now average around 1.21 degrees Celsius warmer than 1880s ranges. This number is about tied with 2016’s overall record warmth which was spurred by a combined strong El Nino and the incredible buildup of greenhouse gasses in the Earth’s atmosphere that we have seen for over more than a century. It is also a warming that is now strong enough to start bringing on serious geophysical changes to the Earth System. The longer readings remain so warm or continue to increase, the more likely it is that instances of global harm in the form of glacial melt, sea level rise, ocean health decline, severe storms and other extreme weather will worsen or emerge.
This year, ENSO neutral conditions trending toward the cooler side of average during the first quarter should have helped to moderate global temperatures somewhat. As is, though a slight cooling vs the first quarter of 2016 is somewhat evident, the broader, more general counter-trend cooling that we would expect following a strong El Nino is practically non-apparent.

(A mildly warm Kelvin Wave forming in the Equatorial Pacific brings with it the chance of a weak El Nino by summer of 2017. This warming of such a broad region of surface waters may combine with atmospheric CO2 and CO2e in the range of 405 and 493 ppm respectively to keep global temperatures near record highs of around 1.2 C above 1880s averages during 2017. Image source: NOAA EL Nino.)
Very strong Northern Hemisphere polar warming during the winter months appears to be a primary driver pushing overall global temperatures higher during recent months. Meanwhile, southern hemisphere polar amplification is becoming more and more apparent over time.
In April, the trend of Northern Hemisphere polar amplification/warming was readily apparent in the NASA measure despite a seasonal relative cooling. Under global warming related heat forcing, we would expect to see the highest temperature departures during late fall through winter. And as 2016 transitioned into 2017, this kind of warming was amazingly evident.

(Only the very far north and the very far south saw below average temperatures in NASA’s zonal measure. Meanwhile, temperatures in the lower Arctic were particularly warm. Image source: NASA GISS.)
Anomalies during April in the higher latitudes did cool somewhat to 2 to 2.6 C above average in the key 65 to 75 N Latitude zone. Highest departures continued to be very considerable for April — ranging from 4 C to as much as 7.5 C above average over Northeastern Siberian, the East Siberian Arctic Shelf, the Bering Sea and parts of Northwest Alaska. Meanwhile, temperatures over the Central Arctic dipped to slightly below average as polar amplification in the southern hemisphere appeared to take a break before warming again in March.
Globally, according to GFS model reanalysis data, temperatures appeared to cool through the end of April. However, by early May another warm-up was underway and, if the GFS measure is any guide, it appears that May will likely be about as warm as April overall. This track would tend to make May of 2017 the 1rst to 4th warmest on record if the trends analysis bears out.
Links:
Global and Regional Climate Anomalies
Share this:

Posted by robertscribbler on May 17, 2017
https://robertscribbler.wordpress.com/2017/05/17/april-of-2017-was-the-second-hottest-in-137-year-climate-record/
North Atlantic May Cough up Another Out of Season Tropical Cyclone this Week
Like pretty much everywhere else in the world ocean these days, and due primarily to a rampant injection of greenhouse gasses into the Earth’s atmosphere through fossil fuel burning, the North Atlantic is now considerably warmer than during the 19th and 20th Centuries…
Warming Waters and An Angry Jet Stream
That extra heat provides more available fuel for tropical storm and hurricane formation. It increases the top potential peak intensity of the most powerful storms. And it extends the period in which such tropical cyclones are capable of forming — for sea surface temperatures of at least 70-75 degrees Fahrenheit are often necessary to fuel such systems (please also see the present science on how climate change is impacting tropical cyclones).

(Sea surface temperatures in the North Atlantic now range between 1 and 7 degrees Celsius above average for most regions. These warmer than normal sea surfaces provide more fuel for storms even as they extend the period during which tropical storm and hurricane formation is possible. Image source: Earth Nullschool.)
But it’s worth noting that warm ocean waters are not the only ingredient that add to the potential for the formation and strengthening of these powerful storms. Instability and cloud formation are often necessary to seed such systems. And the more extreme warm and cold temperature anomalies associated with wavier Jet Stream patterns inject exactly this form of instability into the middle latitudes at a higher rate than was witnessed during past decades.
Due to its proximity both to a melting Greenland and to a rapidly warming Arctic, the North Atlantic is particularly vulnerable to the production of powerful swirls of warm and cold air. Warming tropics collide with the cold air producing pools of glacial freshwater melt and the enlarging meanders of the Northern Hemisphere Jet Stream. And it’s the proliferation of these unstable vortices forming over warming waters throughout the North Atlantic that may start to generate a more and more noticeable higher incidence of both out of season cyclones and stronger storm systems.

(A persistent swirl of disorganized clouds in the Central North Atlantic — continuously re-charged by frontal systems sweeping down from Baffin Bay and feeding on warmer than normal sea surface temperatures may become the first tropical cyclone of 2017. If it later forms into a tropical storm, it will become the third out-of-season named storm to form in the Atlantic over the last 15 months. Image source: LANCE MODIS.)
Last year, extremely warm sea surface temperatures combined with this kind of observed instability to spur the formation of Hurricane Alex during January. Tropical storm Bonnie also formed out of season during May. Similar very warm ocean conditions then helped to kick-start the late November formation of Category 3 Hurricane Otto (though November is still technically hurricane season, it’s supposed to be very rare to see so strong a storm form so late in the year).
Possible April Cyclone Underlines Recent High Incidence of Out of Season Storms
Fast forward to April of 2017. According to the National Hurricane Center, there’s now a 30 percent chance that a tropical depression may form in the Central Atlantic over the next 48 hours. Ultimately, such a system could gather into the first Atlantic named storm of 2017 — Arlene. Such an event would mark the third time in just 15 months that the Atlantic basin had produced an out-of-season tropical storm or hurricane.

(A vast majority — 97 percent — of tropical storms and hurricanes in the Atlantic form during hurricane season from June 1 to November 30. That said, human forced climate change may now be in the process of providing more fuel for the formation of out-of-season storms. Image source: North Atlantic Tropical Cyclone Climatology.)
Incidence of out-of-season tropical storms or hurricanes in the Atlantic is rather rare. Over 158 years from 1851 to 2009, perhaps one such system formed, on average, each year. Moreover, these storms primarily formed during May — which by itself produced more out-of-season storms than December through April combined. And a vast majority of these systems were tropical storms — not hurricanes or major hurricanes.
In 2016 and 2017, Alex formed as a hurricane during January — which is practically unheard of. Bonnie formed during late May, which was less unusual but still out-of-season. Otto formed as a category 3 major hurricane during late November — another anomalous event. Meanwhile, if Arlene forms this April it will represent 1 out of only about 20 such systems that formed during the month in the period of 1851 through 2009.
But even if we don’t get a tropical cyclone in the middle of the North Atlantic during April of 2017, it’s becoming increasingly obvious that conditions have changed. That forecasters now need to be more alert for out-of-season tropical cyclones and to the various new weather phenomena that are now being precipitated by a warming climate.
Links:
Extreme Weather Events Linked to Climate Change Impact on Jet Stream
North Atlantic Tropical Cyclone Climatology
Hat tip to Vaughn
Hat tip to Hilary
Share this:

Posted by robertscribbler on April 17, 2017
https://robertscribbler.wordpress.com/2017/04/17/north-atlantic-may-cough-up-another-out-of-season-tropical-cyclone-this-week/
So Far, 2017 is in the Running to be the 4th Consecutive Hottest Year on Record
We haven’t quite gotten to the global ‘year without a winter’ yet. But it sure looks like we’re heading in that direction –fast.
Due to the highest volume of heat-trapping gasses hitting the Earth’s atmosphere in all of the past 4-15 million years combining with a warming of Pacific Ocean surface waters, the period of 2014 through 2016 saw an unprecedented three consecutive record hot years. With Pacific Ocean waters cooling during late 2016, it appeared that 2017 would become ‘just’ the 2nd to 5th hottest year ever recorded. But that was before the waters off South America’s west coast began to blaze with unexpected heat during early 2017 even as temperatures at the poles climbed to surprisingly warm levels.

(Due to the combined effects of extremely high levels of heat trapping gasses in the Earth’s atmosphere and a switch to the warmer phase of natural variability, the global rate of temperature increase has rocketed over the past three years. 2017 was not expected to continue this trend. But it might. Image source: Karsten Haustein. Data Source: NASA GISS.)
These two sources of unexpected added heat have left their mark. And though it’s still early in the global warming game for 2017, there appears to be an odd, but not entirely outlandish, chance that this year could beat out 2016 as the hottest year ever recorded.
The month of January 2017 came in at 1.14 C hotter than 1880s averages. Meanwhile February measured 1.32 C hotter than this 19th Century benchmark. In total, the first two months of 2017 averaged about 1.23 C hotter than 1880s — which is a hair hotter than 2016’s never-before-seen by modern humans annual average temperature.
(Extreme warmth over parts of Siberia and the Arctic appear to have helped push March of 2017 into the range of second hottest on record. The first three months of 2017 currently appear to be running in a range that’s ahead of 2016 annual record hot average.)
Looking ahead, early indications are that March was also around 1.3 C hotter than 1880s. If a first or second hottest March on record pans out as indicated by early NCEP and GFS model reanalysis, then the first three months of 2017 will come in nearly 0.1 C hotter than all of last year.
During the present human-forced warming trend, it has tended to take about ten years for a global temperature increase of 0.15 degrees Celsius to occur. And that rate of warming is about 30 times faster than the warming that occurred at the end of the last ice age. Since 2013, the world has warmed 0.25 C — which could jump to 0.3 to 0.35 C in the period of 2013 to 2017 if the present trend for this year continues.
There are many months still to go in 2017. So this potential isn’t at all certain at this time. However, with the Pacific Ocean heating up again, it appears that 2017 is going to give 2016 a real run for its ‘hottest ever’ title.
Links:
Hat tip to Colorado Bob
Share this:

Posted by robertscribbler on April 3, 2017
https://robertscribbler.wordpress.com/2017/04/03/so-far-2017-is-in-the-running-to-be-the-4th-consecutive-hottest-year-on-record/
A Halo of Storms and Heatwaves — New Study Confirms that Global Warming is Wrecking the Northern Hemisphere Jet Stream
“We came as close as one can to demonstrating a direct link between climate change and a large family of extreme recent weather events.” — Michael Mann
*****
The Earth is warming, the weather is growing more extreme, and from the observational perspective, it appears that the Northern Hemisphere Jet Stream has undergone some seriously disturbing changes. Over the past five years, this subject has been one that’s spurred heated debate among scientists, meteorologists, and global climate and weather watchers. Now, a new model study finds that it’s likely that the Jet Stream is being significantly altered by human-forced climate change and that this alteration is helping to drive extreme weather events like the 2003 European heat wave, the 2010 Pakistan flood and Russian heat wave, the 2011 Texas heat wave and recent floods in Europe.

(More extreme variation in upper level wind speeds is an upshot of polar warming during boreal summer. The result is that risks of severe heatwaves, droughts, wildfires and floods increases as the Earth warms. Image source: Michael Mann, Penn State.)
From the study:
… our analysis of both historical model simulations and observational surface temperature data, strongly suggests that anthropogenic warming is impacting the zonal mean temperature profile in a manner conducive to wave resonance and a consequent increase in persistent weather extremes in the boreal summer.
What this means is that the new study provides still more evidence that the Jet Stream’s north to south variance is increasing during summer. As a result, it is enabling powerful heat domes to form in regions where winds run from south to north. In regions where the upper level winds run from north to south, it creates cooler zones in which powerful storms can flood large swaths of countryside. In other words, increasingly juxtapposed zones of extreme temperature anomalies and higher atmospheric instability and moisture loading tend to form more and more often. And this results in weather patterns that we have never really seen before.
(An Inconvenient Sequel is a call for action on climate change like we’ve never seen before. And the imperative to act on climate is now stronger than it ever was.)
The fact that the Mann study uses observational and model assessments to find that such changes are likely to very likely now being caused by human-forced warming and related polar amplification is a highly significant scientific finding. It adds one more attribution tie to the extreme weather events that we’ve been seeing with increasing frequency. A tie directly to global warming. And it does so through model studies that identify the underlying physical mechanisms at work. It’s a pivotal moment in the atmospheric sciences. And everyone needs to sit up and pay attention.
Credits:
Hat tip to Colorado Bob
Hat tip to Cate
Scientific hat tip to Dr Michael Mann
(Please support publicly-funded, non-special interest based science that is now under assault by the climate change denying Trump Administration)
Share this:

Posted by robertscribbler on March 30, 2017
https://robertscribbler.wordpress.com/2017/03/30/a-halo-of-storms-and-heatwaves-new-study-confirms-that-global-warming-is-wrecking-the-northern-hemisphere-jet-stream/
Please Help Support Our Ongoing Efforts

Climate of Pandemic — A COVID-19 Special Report

GROWTH SHOCK

Luthiel’s Song: Dreams of the Ringed Vale

Luthiel’s Song: The War of Mists

Climate Progress

The Secular Jurist

Exposing Misinformation Spread by Anthony Watts

Colorado Bob’s Climate Feed

Arctic Sea Ice Blog

Science Blogs

Climate State


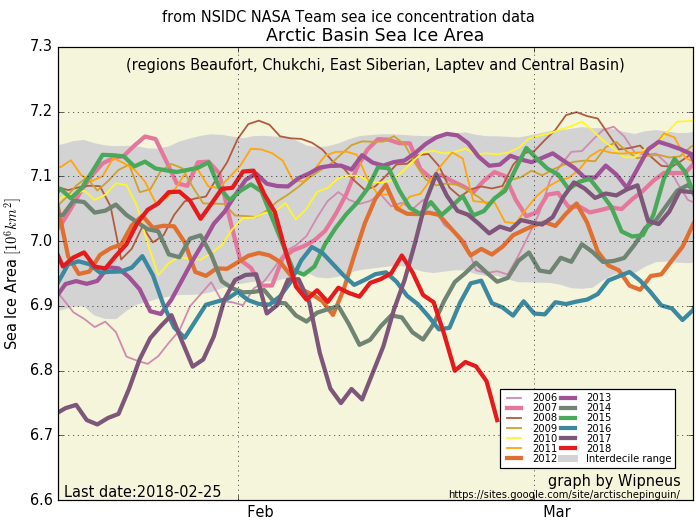