
Strange and anomalous heating of the Earth’s surface waters. That’s what could best characterize the year of 2014. Waters warm enough to break world records and all arrayed in extraordinarily odd distributions.
***
The Summer of 2014 (June through August) was the hottest in the 135 year global temperature record and likely the hottest in at least 100,000 years. According to the National Climate Data Center, global temperatures were 0.88 degrees Celsius above the 1880 average and 0.71 degrees Celsius above average temperatures for the 20th Century.
Summer of 2014 temperatures slightly edged out previous heat records set in 1998 by 0.01 degrees Celsius. But 1998 was a year during which a raging El Nino was dumping immense volumes of Pacific Ocean heat into the atmosphere. This year, summer conditions displayed Pacific Ocean warmth in the Nino regions — but nowhere near enough heat anomaly to shove the equatorial region into El Nino status. So a luke-warm equatorial Pacific and possible pre El Nino in 2014 when combined with a raging human heat forcing of the atmosphere is enough to beat out the super El Nino of 1998 for record hottest summer, even if only by a hair.
(Summer of 2014 beats out 1998 as hottest on record amidst steady and ongoing rise in global atmospheric temperatures. Image source: NOAA’s National Climate Data Center.)
The hottest summer on record follows the hottest May on record and could well include the hottest September on record. This is a strong trend that may well be building 2014 into the hottest year on record. And all without a pronounced El Nino so far.
For if the final four months of this year all fall within the range of first to fifth hottest, 2014 will be a record breaker.
A Very Hot End to a Hot September
Preliminary GFS measures show that September of 2014 may well be in record-challenging range with global temperatures averaging between +0.4 C to +0.7 C above the already hotter than normal 1979 to 2000 period. It was a period that featured ramping polar heat amplification in both the Arctic and Antarctic. A period that followed summer of 2014 trends showing extreme high temperature departures in the Northern Pacific and even higher sea surface temperature departures in the Arctic Ocean regions near the Bering Strait.
The last day of September closed near the top of this hot temperature range with the global atmospheric anomaly at +0.69 C above the 1979 to 2000 average (which is about 0.3 to 0.4 C above the 20th Century average respectively).
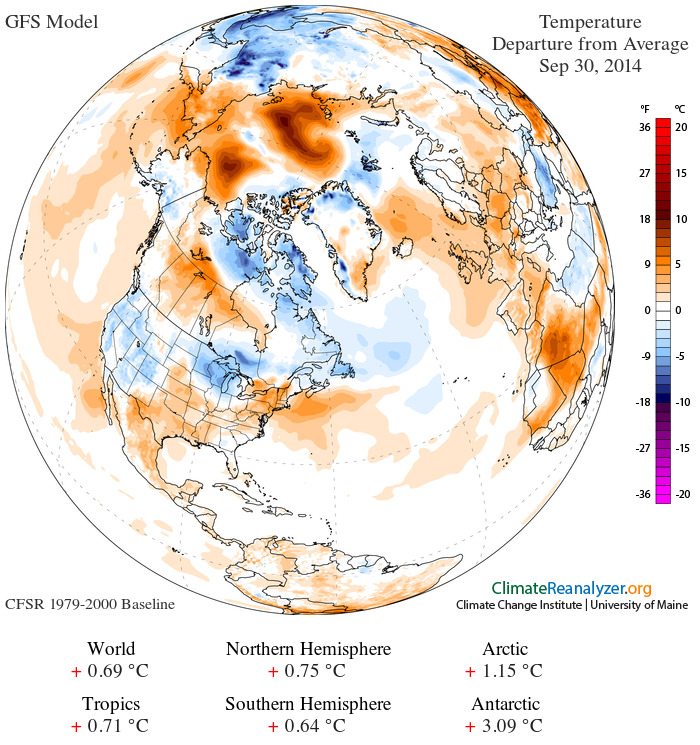
(September 30 global temperature anomaly map. Image source: University of Maine.)
Analyzing the map above, we note strong polar amplification already advancing in the Arctic region with a +1.15 C positive anomaly. We would well expect this trend to continue through fall and winter due to a combination of factors including — the amplified impact of overburden greenhouse gasses during periods of seasonal darkness, a very strong observed heating of the sea surface in Arctic regions providing latent heat through the colder months, and pronounced atmospheric heat transport through ridiculously resilient ridging patterns over the northeastern Pacific and Scandinavia.
In the Southern Hemisphere, we’ve also observed an extraordinary polar heat spike ongoing over the region of West Antarctica in association with an anomalous atmospheric ridge feature in that region as well. West Antarctic temperature departures hit well above +20 C over recent days. This excessive warm anomaly was enough to drive the entire Antarctic zone to an extreme +3.09 C above that polar region’s average for this time of year. Though it is still early spring for the Antarctic, persistence of the West Antarctic ridge could have serious impacts come summer time. So the feature will bear watching.
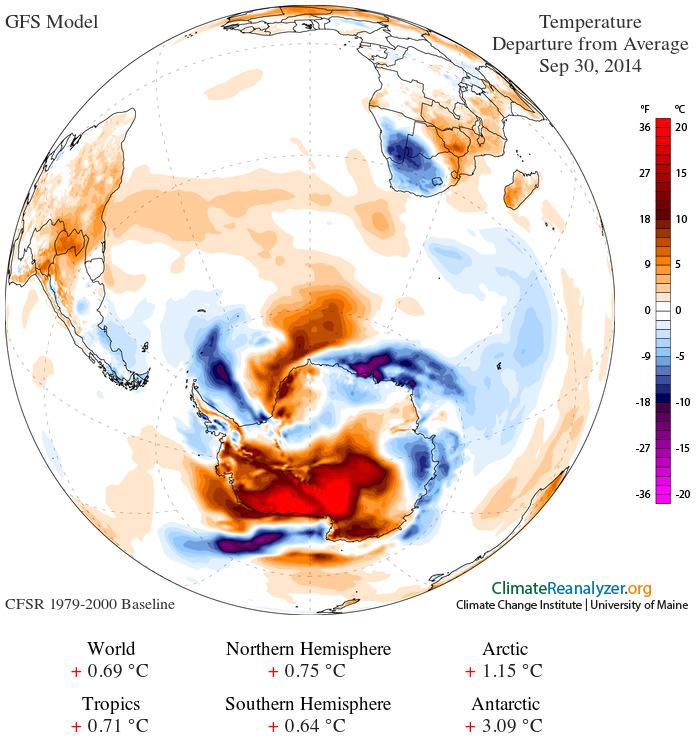
(Extreme positive temperature anomaly over West and Central Antarctica on September 30, 2014. Note the broad area of +20 C positive departure. Image source: University of Maine.)
Troubling Arctic Ocean Heat Spike
But perhaps the most troubling feature for September and, indeed, all of the summer of 2014 is a massive accumulation of far warmer than average surface ocean water in both the Northern Pacific and in the Arctic Ocean.
The Northern Pacific heat has occurred in conjunction with an anomalous 21 month long blocking pattern that has tended to fix in place a south to north flow pattern and far warmer than average land and ocean temperatures for the region. Sea surface temperatures in the range of 2-3 C above average for a swath from California to Alaska have remained in place for nearly two years running.
This feature and now prevailing associated south to north wind pattern appears to be driving warmer than normal waters through the Bering Strait and into the already vulnerable Arctic zone. There, the added warm water appears to have combined with the warming of a deeper, but sometimes surface influencing, warm water flow newly emerging from the Atlantic. These combined warm water flows have resulted in a broad swath of 4 C + above 1979 to 2000 average surface water temperatures ranging from the Bering Sea into the Chukchi, Beaufort, East Siberian, Laptev and Kara Seas of the Arctic Ocean.
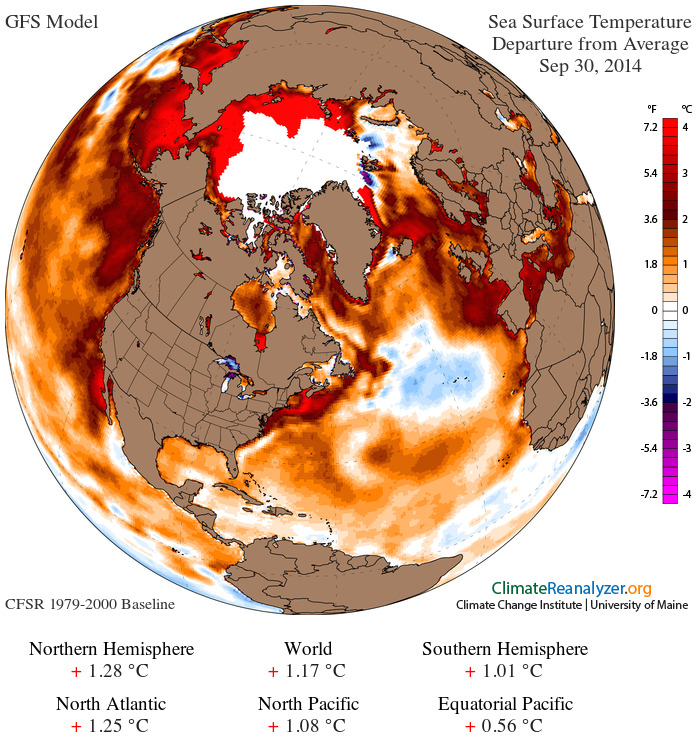
(Extreme global sea surface temperature anomaly of September 30, 2014 features extraordinary +4 C positive temperature departures in the Northern Polar Ocean. Image source: University of Maine.)
During recent years featuring very low Arctic sea ice measures, August, September and October have displayed very strong positive sea surface temperature anomalies in the Arctic. These extraordinary sea surface temperature values have tended to push global temperature averages higher with a number of global heat records set despite the presence of La Nina or ENSO neutral conditions in the Pacific. A clear instance where human-driven polar heat amplification and heating of the northern polar ocean is beginning to have a measurable and substantial impact on global temperature variation as well as overall rate of warming.
In general, we find much of the global ocean heat spike clustered near the northern polar zone. This is clearly visible in the anomaly color display on the map above together with the +0.27 C of added heat in the Northern Hemisphere surface ocean vs the Southern Hemisphere Ocean measure.
A final feature of this enhanced Arctic warming — increased instances of microbial blooms in northern ocean surface waters — was plainly visible in the MODIS shot during late September as well. In this case a massive bloom covering a 550 by 100 mile swath of the Bering Sea just south of the Bering Strait:
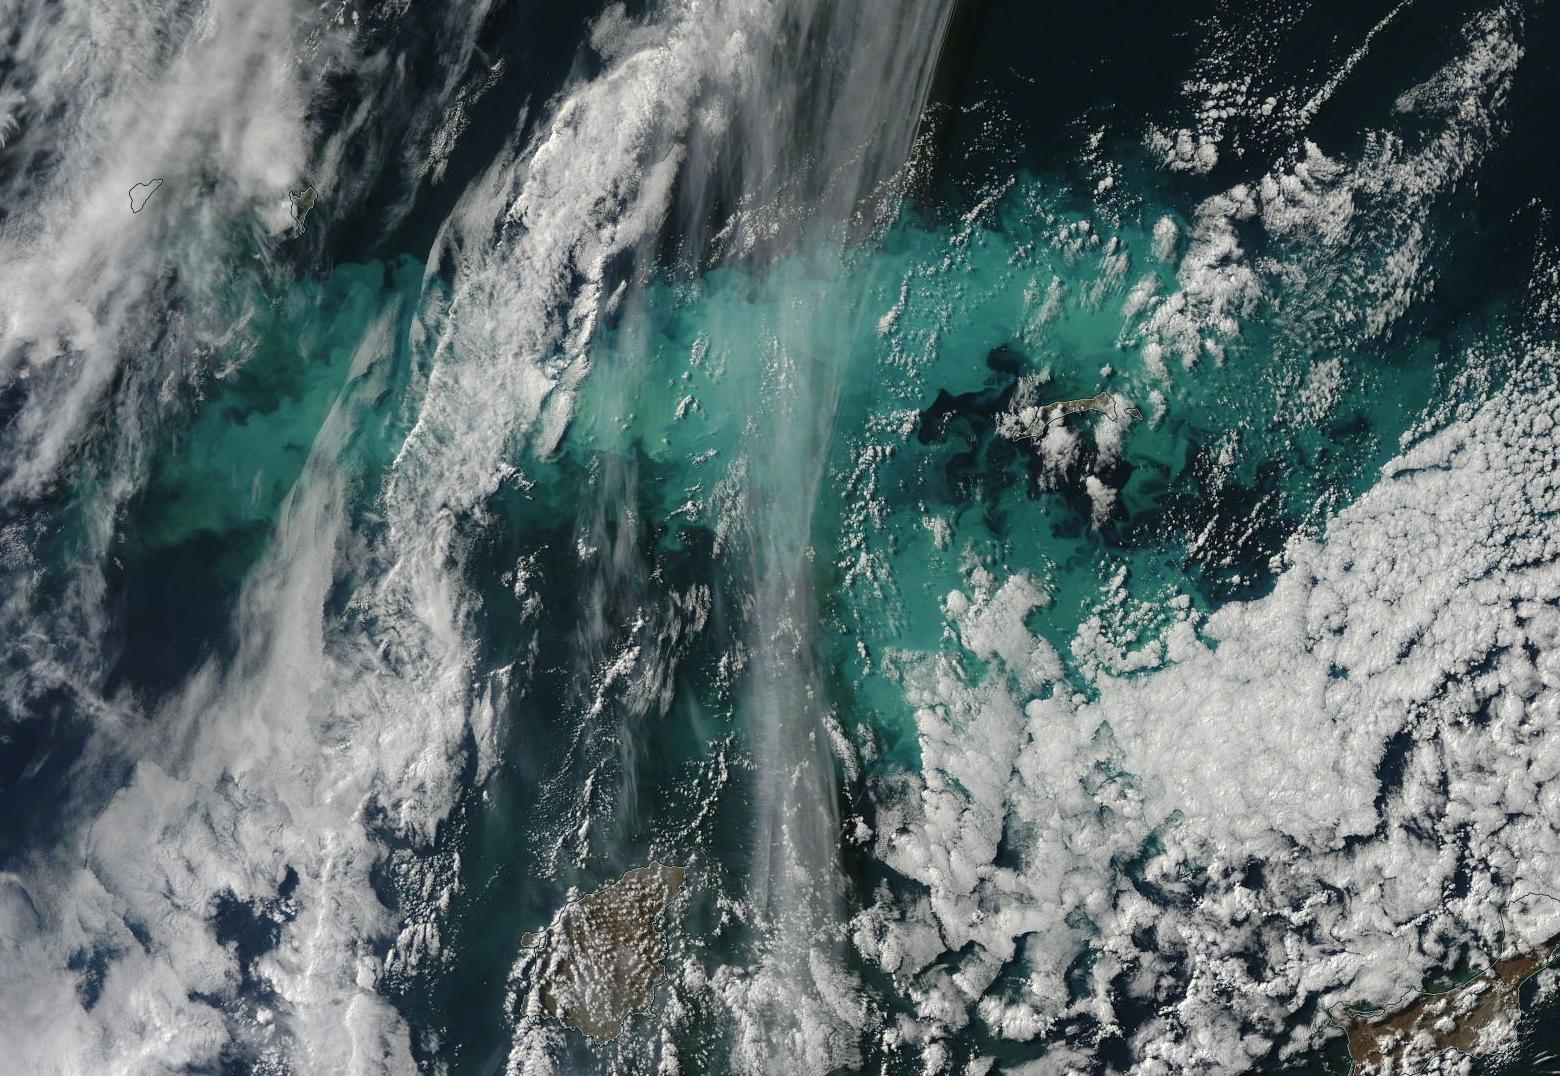
(Massive Bering Sea microbial bloom as visible in the LANCE-MODIS satellite shot on September 28 of 2014. For reference, the Bering Strait is to the right of frame. Bottom edge of frame is about 500 miles. Image source: LANCE-MODIS.)
In these instances, concurrent with human-caused warming, large regions of newly ice free water contain higher nutrient content than more southerly waters. As the human heat forcing spurs these waters to above average temperatures, ocean microbial activity becomes more prolific — since larger numbers of microbes thrive in warmer conditions. The result has been the appearance of very large blooms in far northern waters during recent years.
Within Striking Distance of a Record Hot Year — Serious Implications For Weather and Climate
Despite a Pacific El Nino that appears to be set on slow to low burn, if the event appears at all, it appears possible that 2014 may be setting up for a record breaking year. The factors driving this event include a continued if very mild Pacific Equatorial warming together with far more troubling heat amplification driven by human greenhouse gas warming at the poles. The most troubling of these regions continues to be the Arctic. And the added heat there will almost certainly increase stress on vulnerable carbon stores as well as potentially add to the human-spurred havoc now playing out in northern hemisphere and global weather systems.
The disposition of early fall atmospheric heating with high ocean heat content near the northern polar zone certainly leaves wide the door to future polar vortex disruption come winter 2014-2015 together with providing a Jet Stream weakness that continues to facilitate Northeastern Pacific Ocean ridge development. And, in the case of the Northeastern Pacific especially, there are few challenges to that very disruptive and damaging pattern on the near term horizon (30 day).
Links:
NOAA’s National Climate Data Center


