
Five point five degrees Celsius above average.
That’s how much warmer than ‘normal’ the entire region of the Arctic above the 66 degree North Latitude Line was earlier today. Areas within this large warm pool saw temperatures spike to a range of 15 to 25 C warmer than the already warmer than normal 1981-2010 base period. And broad regions saw temperature between 10 and 20 C above that 30-year average.

(The entire Arctic is an incredible 5.5 C warmer than normal today. Meanwhile, Arctic sea ice extent has plunged, once-more, into record low ranges. Image source: Climate Reanalyzer.)
It’s just a snapshot. But day after day, week after week, month after month, the story has been much the same throughout Fall and Winter of 2017-2018.
And as during last year’s ridiculously warm Arctic winter, the sea ice has taken a considerable pounding. Yesterday dropping to a new record low extent of 13.774 million square kilometers. Beating out the previous record low for the day set just last year. And dipping more than 1.8 million square kilometers below the 1979-1990 average. A period that already featured greatly reduced Arctic sea ice cover when compared to extents seen in the early 20th Century.
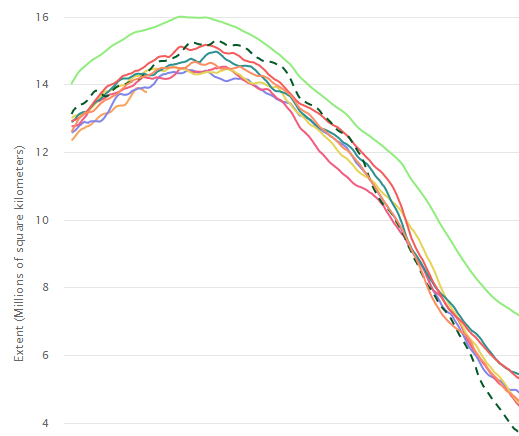
(Arctic sea ice extent for 2018 [lower pink line above] dipped into new record low ranges during recent days. Note that the 1979 – 1990 extent average is indicated by the green line at top. Image source: NSIDC.)
The primary cause of these ice losses is warming both of the ocean and of the air. And, as we can see in the ongoing trend, the Arctic is getting more than its fair share of both. Such polar amplification is a direct upshot of the massive volume of harmful greenhouse gasses being injected into the atmosphere through fossil fuel burning. And we are seeing the dark fruits of that burning now in the massive and ongoing winter losses of sea ice, the harm to various Arctic life forms like puffins and polar bears, and the risk of increasing sea level rise, ocean circulation destabilization, and increasingly extreme weather events that all result from the heating-up of polar environments.


Exposing the Big Game
/ February 12, 2018Reblogged this on The Extinction Chronicles.
LikeLike
Andy_in_SD
/ February 12, 2018Research team detects an acceleration in the 25-year satellite sea level record
https://phys.org/news/2018-02-team-year-satellite-sea.html
LikeLike
robertscribbler
/ February 12, 2018Worth noting that this is an average annual rate of acceleration. So a 3.15 mm sea level rise this year becomes 3.23 mm next year and 3.31 mm the following year and so on.
Not guaranteed to be uniform. The above is just for illustration.
Thanks for this, Andy.
LikeLike
Andy_in_SD
/ February 13, 2018One of the items that researchers are cautious about is the 2nd / 3rd derivatives of the acceleration. Thus projections are generally conservative.
LikeLike
Robert in New Orleans
/ February 12, 2018Abstract
Using a 25-y time series of precision satellite altimeter data from TOPEX/Poseidon, Jason-1, Jason-2, and Jason-3, we estimate the climate-change–driven acceleration of global mean sea level over the last 25 y to be 0.084 ± 0.025 mm/y2. Coupled with the average climate-change–driven rate of sea level rise over these same 25 y of 2.9 mm/y, simple extrapolation of the quadratic implies global mean sea level could rise 65 ± 12 cm by 2100 compared with 2005, roughly in agreement with the Intergovernmental Panel on Climate Change (IPCC) 5th Assessment Report (AR5) model projections.
http://www.pnas.org/content/early/2018/02/06/1717312115
LikeLike
robertscribbler
/ February 12, 2018Worth noting this is rear view mirror for the past 25 years when average temperatures were around 0.8 C above 1880s thresholds.
LikeLike
Mblanc
/ February 13, 2018Slowly but surely the estimates are creeping up. We are at about 1cm every 3 years as far as I remember, and 1cm/year is implied for 2100 with these conservative numbers.
1cm/year is a scary rate. and obviously we are on course to hit it well before the end of the century.
LikeLike
rhymeswithgoalie
/ February 13, 2018Obligatory caveat regarding SLR:
Global Mean SLR should only be used as an overall metric of increased ocean volume.
Practically speaking, ALL SEA LEVEL IS LOCAL. Each stretch of shoreline has its own dynamics. Maryland is a good example of multiple influences for local SLR:
LikeLike
Robert in New Orleans
/ February 12, 2018There is a big question that all of us who live at or near sea-level (or in my case below sea level) are waiting for with a peculiar sense interest and dread. Is when do the major reinsurance companies like Munich Re and Swiss Re say it is game over the issuance of new insurance and re issuance of existing insurance for coastal policy holders? I am thinking that the time frame will be sooner rather than later, maybe within the next five years from now.
LikeLike
Andy_in_SD
/ February 12, 2018Properties with the most exposure to sea level rise in Miami are dropping in value. a 7% discount so far. The discount is climbing as insurance companies are beginning to avoid them as well as people.
“This discount has grown over time,” the authors wrote, “and is driven by sophisticated buyers and communities worried about global warming.”
He said mayors and city managers shared their anxiety about what rising seas mean for their cities’ property values. Those worries range from the mundane—finding more money to update infrastructure damaged by storms—to the existential: How long will banks keep issuing 30-year mortgages?
https://www.bloomberg.com/news/features/2017-12-29/south-florida-s-real-estate-reckoning-could-be-closer-than-you-think
LikeLike
DJ
/ February 13, 2018It amazes me that anybody is willing to buy, or insure, properties that sit within a couple of feet of sea level. There’s absolutely nothing that’s going to keep these properties above sea level in the next 50 years, even if we completely stop fossil fuel use today.
LikeLike
robertscribbler
/ February 13, 2018See Florida in the early 1900s through 1920s. Now extrapolate that to all the world’s coastlines. That’s what we’re looking at over the next few decades. It gets worse, somewhat worse if we halt fossil fuel burning soon. A lot worse if we don’t.
LikeLike
Robert in New Orleans
/ February 13, 2018Two older articles about sea level rise:
RIMS 2016: Sea Level Rise Will Be Worse and Come Sooner
Margaret Davidson, NOAA’s senior advisor for coastal inundation and resilience science and services, and Michael Angelina, executive director of the Academy of Risk Management and Insurance, offered their take on climate change data in a conference session titled “Environmental Intelligence: Quantifying the Risks of Climate Change.”
Davidson said recent data that has been collected but has yet to be made official indicates sea levels could rise by roughly 3 meters or 9 feet by 2050-2060, far higher and quicker than current projections. Until now most projections have warned of seal level rise of up to 4 feet by 2100.
These new findings will likely be released in the latest sets of reports on climate change due out in the next few years.
“The latest field data out of West Antarctic is kind of an OMG thing,” she said.
https://www.insurancejournal.com/news/national/2016/04/12/405089.htm
As this article is almost two years old, I am curious as to what Ms. Davidson would say about it now. That is assuming she would not be muzzled by the trump administration.
U.S. Climate Envoy Jonathan Pershing: Five Feet Of Sea Level Rise By 2050 Possible
The mood in Marrakech was somber when top climate envoy for President Barack Obama Jonathan Pershing dropped a bombshell on observers gathered there: The rapid warming in polar regions the world is now witnessing may result in five feet—or 1.5 meters— of sea level rise by 2050.
Pershing had met earlier with State Department Secretary John Kerry in Morocco at the 22nd UN Conference of the Parties to the UN Framework Convention on Climate Change, or COP22. Kerry had just returned from a trip to Antarctica. According to Pershing, Kerry told him that the Pine Island Glacier in Antarctica “is moving very fast and when it goes, we will see 1.5 meters of sea level rise by 2050.”
“Five feet of sea level rise in less than 35 years — that is really soon,” said Pershing.
https://www.huffingtonpost.com/daphne-wysham/us-climate-envoy-jonathan_b_13070296.html
LikeLike
Andy_in_SD
/ February 13, 2018Insurance companies and associations (ie: condo’s) are already factoring the threat in as a risk premium, or simple outright refusal to insure. They will be the ones that stop the merry go round most likely in vulnerable locales (ie: Miami).
LikeLike
Hilary
/ February 13, 2018Cyclone Gita: Fiji braces for 295km winds; coastal communities prepare to evacuate
http://www.nzherald.co.nz/world/news/article.cfm?c_id=2&objectid=11993437
“Fiji Red Cross secretary general Filipe Nainoca said they would likely be unable to travel to the island group from the main island Viti Levu until Thursday or even Friday.
“We expect the islands to be inaccessible today and tomorrow,” he told the Herald.
“They are closer to Tonga than they are to Viti Levu.
“On Thursday we might be able to do air surveillance, but we will have to wait for the waves to settle before we can get there by boat.”
There were about 400 people living on both Oni-i-Lau and Vatoa, the islands likely to be hit the hardest.
“The main problem is they are low-lying attols and will be greatly affected by storm surges. There could be issues with shelter and water supplies becoming contaminated with sea water. That was a major problem in similar islands during Cyclone Winston.
“Winston was a category 5, and this is category 4. We hope it stays that way, or even goes lower.”,,,
“After Cyclone Gita hits Fiji it will track over open water towards New Caledonia and Norfolk Island. It still forecast to grow into a category 5 cyclone.
WeatherWatch has predicted that Cyclone Gita is likely to swing out into the Tasman Sea then curve back around a make a direct hit into New Zealand. However it is not known whether it will retain its storm conditions. It could make landfall in New Zealand any time from this Sunday to next Wednesday.”
& update from Tonga here, a lot of structures damaged:
http://www.nzherald.co.nz/world/news/article.cfm?c_id=2&objectid=11993261
LikeLike
mlp in nc
/ February 13, 2018OT but today Metop-2 methane max at 2913. Has been fluctuating above 2200 for some time now.

LikeLike
Leland Palmer
/ February 13, 2018Twin sea surface temperature anomalies near Svalbard:
https://earth.nullschool.net/#2018/02/11/0000Z/ocean/surface/currents/overlay=sea_surface_temp_anomaly/orthographic=-10.90,80.77,2861/loc=31.371,75.770
It’s kind of hard to form sea ice on areas of water that are 10 degrees C (18 degrees F) higher than the recent historical average.
These anomalies have been pretty stable since 2015, summer and winter. What’s going on with these sea surface temperature anomalies?
LikeLike
Leland Palmer
/ February 13, 2018What might have happened after the ice sheets in the Barents sea retreated thousands of years ago – formation of hundreds of millions of pockmarks from methane release:
Click to access NJG4_Vol94_4_Rise_Scr.pdf
These pockmarks are thought to have occurred when warm water originating in the Gulf Stream intruded into the Barents Sea after the ice sheets retreated in that area. Relic methane hydrate formed under the ice sheets, outside the gas hydrate stability zone after the ice sheet is removed, may have been heated enough to dissociate.
A new intrusion of abnormally warm Gulf Stream water into the Barents Sea may be happening now.
LikeLike
DJ
/ February 13, 2018Nothing in the 10 day GFS forecast for the Arctic under 4 degrees C above normal. It’s been this way all winter.
http://cci-reanalyzer.org/wx/fcst/#gfs.arc-lea.t2anom
LikeLike
Dredd
/ February 13, 2018Bad news.
LikeLike
Shawn Redmond
/ February 13, 2018….but but it’s good for commerce!
http://www.climatechangenews.com/2018/02/12/timelapse-video-shipping-first-lng-tanker-crosses-arctic-winter-without-icebreaker-escort/
LikeLike
Shawn Redmond
/ February 13, 2018After watching the time lapse video in the article I noticed a lot of open leads and what appears to be vey thin ice. Me thinks the satellite sensors are over estimating the volume and extend in the Arctic.
LikeLike
robertscribbler
/ February 13, 2018You gain a shipping passage. You lose so, so much else.
LikeLike
Robert in Subsiding New Orleans
/ February 13, 2018How Humans Sank New Orleans
https://www.theatlantic.com/technology/archive/2018/02/how-humans-sank-new-orleans/552323/
LikeLike
Robert in Subsiding New Orleans
/ February 13, 2018A small treasure trove of good articles (at least in my opinion) is:
https://www.insurancejournal.com/
Just type in sea level rise or climate change in the search box.
LikeLike
Vernon Hamilton
/ February 14, 2018good reference. The Insurance groups, along with the London Bookies, are the most clear-eyed about all this.
LikeLike
Steve Bloom
/ February 15, 2018Robert, please post on https://www.technologyreview.com/s/609974/how-nuclear-weapons-research-revealed-new-climate-threats/. Amazing backstory (most intensive climate modeling effort ever AFAIK — thanks, failed huge nuclear weapons project!), plus it means that paper has far more weight. (Other recent projections don’t show the precip decrease, and some even disagree about ridging persistence.) Of course there will be other downstream effects on northern hemisphere and tropical circulation; more papers to come from this group, I expect..
LikeLike