How Greenland Melt Can Kick off A Warm “Ill Wind” Near Antarctica

Sixteen thousand years ago, Greenland melt set off a cascade of impacts to the world ocean and atmosphere that led to the dredging of carbon rich waters from deep below the Pacific surface. These waters then disgorged enough carbon into the atmosphere to ultimately raise CO2 levels by 40 parts per million.

(Related: Bad Climate Wind Rises.)

A recent report in Nature Communications found that:

“During this earlier period, known as Heinrich stadial 1, atmospheric CO2 increased by a total of ~40ppm, Antarctic surface atmospheric temperatures increased by around 5°C and Southern Ocean temperatures increased by 3°C.”

How did it all happen? According to the science, Greenland melt slowed down North Atlantic Deep Water formation. This, in turn, caused the North Atlantic to cool and the South Atlantic to warm. The resulting change in temperature then shoved the band of stormy weather called the Inter-Tropical-Convergence-Zone southward. Subsequently, the westerlies in the Southern Hemisphere were shifted poleward and strengthened. Stronger, more southward running winds around the southern pole dredged up carbon rich deep water near the pole and on into the Pacific. This carbon then transferred to the atmosphere.

It’s an interesting bit of science. But it has a good degree of relevance to the present day. That’s because Greenland is again melting greater volumes of water into the North Atlantic. The North Atlantic is again cooling. And the Southern Ocean winds are again being driven south as they strengthen.

(How Greenland melt pulled carbon from the Southern Ocean. A process that is being driven to repeat by present human-forced climate change. Image source: Nature Communications.)

According to lead author Dr. Laurie Menviel:

“With this in mind, the contraction and strengthening of westerly winds today could have significant implications for atmospheric CO2 concentrations and our future climate.”

This is a kind of feedback that results from the warming humans have caused that can result in more carbon being wrung from the ocean. And it’s a concern because it shortens the available time-frame in which to respond to the crisis that is climate change.

(Greenland melt, the North Atlantic cool pool, and strengthening, southward moving Southern Ocean winds. These dynamics set off a carbon feedback about 16,000 years ago. Similar dynamics are coming into play today due to human caused climate change. Image source: Earth Nullschool.)

To be clear, present rates of fossil fuel burning are dumping an amount of carbon into the atmosphere at a much higher rate than this identified Earth System response could ever match. But, as the study authors note, the Southern Ocean has already sequestered 10 percent of carbon emitted by humans. If that sequestration halts and then reverses, then the rate of atmospheric CO2 accumulation, even if emissions stay stable, will rise by about 0.2 to 0.4 ppm per year.

This report lends further urgency to global efforts by responsible institutions and individuals to reduce global carbon emissions and transition to clean energy. Bringing the more difficult outcomes of rising heat trapping gasses closer and closer to the present day.

Please read more here.

Hat tip to mlp in NC.

Nature — Plants Belched 3 Billion Tons of Carbon into Atmosphere During Monster El Nino of 2014-2016

El Nino. This periodic warming of the Equatorial Pacific has long been known to trigger droughts, wildfires, and higher temperatures throughout the tropics. And, according to a new satellite data based report out of the scientific journal Nature, these very same El Nino feedbacks combined with record global heat to squeeze a massive volume of carbon out of the world’s tropical forests during 2014-2016. From the report:

The monster El Niño weather pattern of 2014–16 caused tropical forests to burp up 3 billion tonnes of carbon, according to a new analysis. That’s equivalent to nearly 20% of the emissions produced during the same period by burning fossil fuels and making cement.

Global Warming + El Nino Sparked Massive Fires, Droughts and Heatwaves in the Tropics During 2014-2016…

The monster El Nino of 2014 to 2016 created serious disruptions to the world’s weather and climate patterns. Emerging during a time when human-forced global warming was rapidly ramping up, this strong natural variability feature generated a severe heat spike in the tropical regions. With the heat near the Equator already at high tide due to human-caused warming, this very strong El Nino produced some of the most severe heatwaves, droughts and wildfires ever experienced during modern times in places like Brazil, Africa, and Southeast Asia.

(Massive Southeast Asia wildfires during a record warm El Nino like these in Borneo during September of 2015 helped to squeeze 3 billion tons of carbon out of tropical forests. A feedback feature related to El Nino and human-caused climate change. Image source: Earth Observatory.)

The Amazon Rainforest, according to a seperate study, experienced record-breaking heat and drought — with the area of drought stretching 20 percent further than during past El Nino years. Temperatures in the Amazon were 1.5 degrees Celsius warmer than during the extreme El Nino event of 1997-1998. Both signals that a climate change + El Nino interaction was amplifying the severity of impacts to this crucial tropical forest system.

In Africa and Southeast Asia, the heat was similarly intense — producing numerous 30-100 year or worse droughts, fires, and record high temperatures. Another signal that this harmful interaction was in full swing.

… This, in Turn, Generated a Major Release of Forest-Stored Carbon …

As the droughts and heatwaves were baking deep, and as the forests were stunting, burning, or exhaling more CO2, high overhead, one of Earth’s climate sentinel satellites — the Orbiting Carbon Observatory 2 — was dutifully taking measurements. And what it found was that all this extra tropical heat resulted in a severe loss of soil and vegetative carbon. That the heat and droughts were sparking forest fires, causing stress, and stunting forest growth. That these processes were dumping prodigious volumes of carbon back into the Earth’s atmosphere.

From the study:

Measurements taken by NASA’s Orbiting Carbon Observatory-2 (OCO-2) satellite, which measures the level of carbon dioxide in the atmosphere, suggest that El Niño boosted emissions in three ways. A combination of high temperatures and drought increased the number and severity of wildfires in southeast Asia, while drought stunted plant growth in the Amazon rainforest, reducing the amount of carbon it absorbed. And in Africa, a combination of warming temperatures and near-normal rainfall increased the rate at which forests exhaled CO2.

Overall, the Nature study notes that 3 billion tons of carbon were added to the atmosphere as a result of harm done to forests and soils during this particularly hot El Nino period.

… Which Helped to Spike Annual Rates of Atmospheric CO2 Accumulation

(Record rates of atmospheric CO2 accumulation during 2015 and 2016 correspond with large belches of carbon from tropical forests as a result of severe heat. Image source: NOAA ESRL.)

Elsewhere, this added burst of carbon did not go unnoticed. And measurements from NOAA’s Earth Systems Research Laboratory indicates that rates of atmospheric carbon accumulation sped up as El Nino and global warming based heat baked the tropical lands. During 2015, rates of atmospheric carbon accumulation accelerated to their fastest pace on record — growing at 3.03 parts per million per year. And in 2016, the second fastest rate of atmospheric CO2 accumulation on record was recorded — 2.98 parts per million per year. This compares to an average 2.2 parts per million annual accumulation that’s primarily driven by fossil fuel burning.

So what we have here is evidence that a heat and El Nino based carbon feedback occurred in the tropics during 2014-2016 and that this feedback resulted in a significant spike in the rate of atmospheric CO2 accumulation even as human based carbon emissions were leveling off (at record high ranges). With El Nino fading, that tropical carbon feedback should abate. But we shouldn’t allow ourselves to breathe too easy. For with Earth now in the range of 1 to 1.25 C warmer than preindustrial times, carbon stored in soil, forests, permafrost and oceans is now being placed under increasing heat related stress. And continuing to burn fossil fuels keeps adding to the heat gain that further increases the risk of a warmth-amplifying release from all of these stores.

Links:

Massive El Nino Sent Greenhouse Gas Emissions Soaring

Record Heat and Drought Seen in Amazon During 2015-2016 El Nino

NASA’s Earth Observatory

NOAA ESRL

Hat tip to mlparrish

Hat tip to Spike

2016 on Track for Record Rate of Atmospheric CO2 Increase

During 2016, the annual rate of atmospheric carbon dioxide increase will have hit a record 3.2 to 3.55 parts per million (ppm). By 2017, the amount of carbon dioxide in the Earth’s atmosphere will be roughly equivalent to concentrations last seen during the Middle Miocene climate epoch (404 to 410 ppm average). In other words, atmospheric CO2 is rising at a record rate and we are hitting levels of this heat-trapping gas that have not been seen in about 15 million years.

Record Rates of CO2 Increase

The world is struggling to make the necessary turn toward reducing fossil fuel-based carbon emissions. Global emissions have plateaued at or near new record highs during the past three years. Conflicts over fossil fuel cuts and transitioning to renewable energy embroil numerous countries. Climate change deniers hold significant power in places like the United States, the United Kingdom, Canada, and Australia. And facing off against those who would defend the harmful interests of what could well be called the most destructive industry to ever inhabit the planet, are a broad group of environmentalists, scientists, concerned citizens, and renewable energy advocates.

carbon-dioxide-october-2016-global

(Global carbon dioxide is approaching a level not seen since the Middle Miocene period around 15 million years ago when atmospheric concentrations typically averaged above 405 ppm and global temperatures were 3-4 degrees Celsius hotter than 19th-century averages. Record annual rates of CO2 increase in excess of 3 ppm each year for 2015 and 2016 are swiftly propelling us into a climate state that is more similar to this ancient epoch — a shift that is producing increasingly harmful global consequences. Image source: The Copernicus Observatory.)

As the political turmoil ramps up, it appears that the Earth’s oceans and biosphere are straining to draw in the massive volumes of these gasses that we’ve been pumping out. Annual atmospheric CO2 growth rates for 2015 were a record 3.05 ppm. 2016 appears to be on track to beat that high mark, being likely to see a new annual increase of between 3.2 and 3.55 ppm.

Hot Lands and Oceans Tend to Produce a Carbon Feedback

The previous most rapid annual rate of atmospheric CO2 increase was 2.93 ppm during the strong El Niño year of 1998. Back then, high ocean surface temperatures combined with warming-related wildfires and droughts which spanned the globe to reduce the Earth’s capacity to take in carbon. More carbon was squeezed out of hot soils, burning forests, and warming oceans. Less was drawn down. New record rates of atmospheric CO2 increase were breached.

the-keeling-curve-2-years

(Except for a couple of days, all of 2016 saw atmospheric CO2 levels above 400 ppm. Peak values as measured at the Mauna Loa Observatory in May were 407.7 ppm. By May 2017, atmospheric CO2 levels are likely to hit near 410 ppm — a level not seen in about 15 million years. Image source: The Keeling Curve/Scripps Institution of Oceanography.)

Even during the period of heightened heat stress that occurred in 1998, we did not see a year in which annual rates of CO2 increase exceeded 3 ppm. We have never, until 2015-2016, seen a time when there were two back-to-back years of such rapid rates of increase. Similar but worsening heat stress impacts have likely flagged what at first appeared to be an increased rate of carbon uptake from the biosphere during the late 2000s. Ocean heat content is now dramatically greater than during 1998 and this significant warming is likely having at least a periodic impact on the ocean’s rate of carbon uptake. Wildfires are now far more prolific, generating more atmospheric carbon. Droughts are more widespread and these tend to squeeze carbon from the soil. The Arctic is the warmest it’s been in 115,000 years and, as a result, some new Earth system carbon sources are starting to pop up.

Record High Rates of Fossil Fuel Emissions Hitting a Plateau

In the intervening years since 1998, global carbon emissions from fossil fuels have also jumped dramatically. During 1998, yearly CO2 emissions were in the range of 26 billion tons per year. By 2014-2015, these greenhouse gas releases had soared to around 35.8 billion tons per year. Through this period, average annual rates of CO2 increase continued to climb during the 2000s and 2010s.

global-carbon-project-emissions-2015

(Global carbon emission increases stalled during 2013, 2014, and 2015 according to The Global Carbon Project. But despite this recent pause, atmospheric rates of carbon dioxide increase have continued to ramp up. Due to a number of factors, including atmospheric and ocean inertia as well as temperature and saturation stress to global carbon stores, it is likely that significant reductions in carbon emissions from fossil fuels will be necessary to have a marked impact on annual rates of atmospheric CO2 increase.)

According to NOAA, the 1980s and 1990s saw yearly jumps in CO2 at the rate of about 1.5 ppm each year. By the 2000s, this average rate of increase had leaped to about 2 ppm per year. For the first six years of the 2010s, the average rate will likely be around 2.5 ppm per year.

New Records Provide Urgency For Rapid Emissions Cuts

This rate of increase roughly matches the overall rate of increase in emissions. As yet, there is no major global trend sign in the atmospheric CO2 data showing that carbon uptake from the oceans and the biosphere has been significantly curtailed, at least not to the point that it has shown up in the long term global trend. There are, however, widespread signs of stress to the Earth’s carbon storage system, and two years of 3 ppm-plus increase back-to-back is a warning blip on the climate radar.

In other words, these new record rates of CO2 increase are disturbing. If the annual increases do not fall back into the low 2-ppm per year range in 2017 and 2018, it will be an indication that some of the Earth’s ability to draw down carbon has been significantly hampered. If that is the case, then the urgency to draw down emissions is considerably greater.

Links:

NOAA ESRL

Middle Miocene

The Global Carbon Project

The Copernicus Observatory

The Keeling Curve

Doubling Down on Our Faustian Bargain

Hat tip to SmallblueMike

(Note: This post focuses primarily on CO2 as an indicator. Overall CO2e levels will be covered in a separate exploration.)

New Report: ‘Blowtorch’-Like Ocean Warming Advances Killer Seas, Shifts El Nino, Heats Hydrates

Tampering can be dangerous. Nature can be vengeful. We should have a great deal of respect for the planet on which we live. — Carl-Gustaf Rossby

But as the [IUCN] study points out, 90% of the extra heat that our greenhouse gases trap is actually absorbed by the oceans. That means that the upper few meters of the sea have been steadily warming more than a tenth of a degree celsius per decade, a figure that’s accelerating. When you think of the volume of water that represents, and then try to imagine the energy necessary to raise its temperature, you get an idea of the blowtorch that our civilization has become. — Bill McKibben

The scale of ocean warming is truly staggering with the numbers so large that it is difficult for most people to comprehend. — from the IUCN report Explaining Ocean Warming: Causes, scale, effects and consequences

*****

If there’s one simple fact about past Earth climates that should keep you awake at night, it’s this — warming the world ocean eventually produces a killing mechanism that is unrivaled by any other in Earth’s deep past. Great asteroids, gamma-ray bursters, earthquakes, tsunamis and volcanism — none of these can rival the vast damage to life on planet Earth that is resulting from ocean warming.

As a study of the sciences, this assertion would be merely an academic one if the human race weren’t now involved in a great injection of an unprecedented volume of greenhouse gasses into the Earth’s airs. As a critical new ocean report from the International Union for Conservation of Nature (IUCN) points out, these gasses are trapping an extraordinary amount of heat at the top of the world’s atmosphere. In turn, the atmosphere is transferring the lion’s share of this heat — more than 90 percent — into the waters of our world.

The Extreme Amount of Heat Energy Piling up in Our Warming Ocean

As a result, the surface of the world ocean is warming by 0.1 degree Celsius per decade. That may not sound like much, but it takes about four times the amount of energy to warm one gram of water by 0.1 C as it does one gram of air. This property, called specific heat, is a defining aspect of water. Water has the highest specific heat of any common substance.

heat-accumulation-human-forced-zillions-of-joules

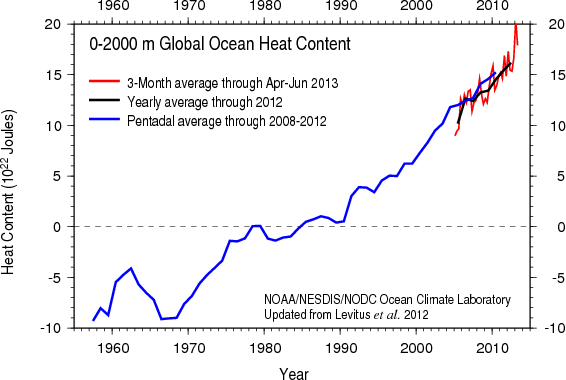
(Since the 1970s, about 300 zettajoules’ (ZJ) worth of heat energy has accumulated in the Earth System due to fossil-fuel burning and related greenhouse gas emissions. That’s about 5 Hiroshima bombs worth of heat accumulating every second. Most of that energy has gone into the world’s oceans. So much heat is bound to have consequences, and these impacts are starting to show up in the form of declining ocean health, melting sea ice and glaciers, shifting climate zones and weather patterns, worsening droughts and storms, and threats of Earth System carbon feedbacks. Image source: Explaining Ocean Warming.)

Liquid water is also far denser than air. And this density generates an even higher impact heat energy transfer multiplier. So not only does it take four times more energy to warm a similar weight of water vs air, once warmed, that water contains that higher level of specific heat energy in a much more tightly concentrated package. And when that high heat concentration liquid water comes into contact with other substances — like ice in the form of ocean contact, or air in the form of evaporation, or frozen hydrates on the sea bed — it can pack a serious heat punch.

The vast volume of water in our oceans, therefore, serves as a kind of heat and energy regulator. It takes a lot of energy to warm it up, but once it does, serious environmental changes start to happen as a result. In other words, the temperature of the global ocean could be viewed as the point on which the whole of the Earth climate system pivots. Once the oceans are set in thermal motion, serious changes to the rest of the world are going to take place. To get an idea how much energy the oceans now contain, of how much potential they now have to dramatically alter our world, consider that if these vast waters were not present, the atmosphere now would have already warmed by 36 degrees C due to the heat-trapping effect of greenhouse gasses already in our atmosphere.

Fossil-fuel blowtorch indeed.

Heating Seas Ultimately Become Killer Seas

There’s a starker message to convey here, one that focuses on this simple yet dire question — how do warming oceans kill? In basic terms, they become toxic and anoxic. Warming oceans melt ocean-contacting glaciers. The glacial melt forces seas to rise and forms a freshwater lid on the global ocean, breaking down ocean conveyor belts and preventing mixing. This freshwater lid also deflects heat toward the ocean bottom. This process in turn helps to thaw methane hydrates. Warm waters that don’t mix and that are filled with bubbling hydrates become very oxygen-poor.

barents-algae-bloom

(Massive algae bloom covers tens of thousands of square miles of open water in the Barents Sea during August of 2016. As glaciers melt, oceans stratify and warm; as water oxygen levels drop, and as hydrates vent due to warming, such blooms result in significant reductions to ocean health and a related global mass-extinction threat. Image source: LANCE MODIS.)

As the land glaciers bleed out into the oceans, the stratified, oxygen-deprived waters become less and less able to support advanced life. The kinds of life warm, oxygen-deprived waters do support are poison-producing microbes. These microbes thrive in the warm, oxygen-poor waters. If ocean heating continues to progress, the warming seas will eventually fill up with their deadly byproducts. Among the most nasty of these is hydrogen sulfide. If enough of it is produced, it will spill out from the ocean into the nearby air, resulting in land animal mortality as well.

In microcosm, we saw a mild taste of some of these effects this past year in Florida as toxic algae blooms filled the warming state’s waterways and coastlines, even forcing some riverside marinas to close due to toxic gasses wafting up from the purple-green, oxygen-starved waters. These effects are a snapshot of a possible future for Earth’s oceans if we don’t get our act together yesterday.

El Niño Shifted, Ocean Hydrates Threatened

As alluded to earlier in this post, a new report, Explaining Ocean Warming, provides some pretty hard evidence that the oceans are on the move toward a much more harmful global climate state. The study, which has rightly received a great deal of media attention, issues a ‘shot across the bow’ warning to pretty much everyone living today. And it finds serious impacts to the ocean and linked climate systems due to a very rapid human-forced global warming.

These hard findings are worth reading directly:

  1. Sea-surface temperature, ocean heat content, sea-level rise, melting of glaciers and ice sheets, CO2 emissions and atmospheric concentrations are increasing at an accelerating rate with significant consequences for humanity and the marine species and ecosystems of the ocean.
  2. There is likely to be an increase in mean global ocean temperature of 1-4 degrees C by 2100. The greatest ocean warming overall is occurring in the Southern Hemisphere and is contributing to the subsurface melting of Antarctic ice shelves. Since the 1990s the atmosphere in the polar regions has been warming at about twice the average rate of global warming.
  3. There is likely to be Arctic warming and ice loss, and possibly the essential removal, in some years, of the summer Arctic sea ice within the next few decades.
  4. Over the last 20 years there has been an intensification and distinct change in the El Niño events, with a shift of the mean location of sea-surface temperature anomalies towards the central Pacific.
  5. Currently 2.5 Gt of frozen methane hydrate are stored in the sea floor at water depths of 200 to 2000 m. Increasing water temperature could release this source of carbon into the ocean and ultimately into the atmosphere.

These are all Earth-shattering scientific statements. For those who frequent this blog, points 1 through 3 are probably pretty familiar. The last two, however, require more in-depth explanation.

global-warming-el-nino

(Some scientific studies have pointed out that warming the world ocean will result in a shift of El Niño toward the central Pacific. A new ocean report finds that it’s already happening. Image source: Global Warming May Dent El Niño’s Protective Hurricane Shield, Increase Droughts.)

For a long time now, scientists have believed that El Niño wouldn’t be affected by climate change until the end of this century. But as with sea ice, it appears that such impacts may well be advancing faster than expected. As we’ve alluded to here, there’s been an apparent shift in El Niño toward the central Pacific over recent decades. This may well be a climate change-related shift. The fact that the IUCN report highlights this change is a sign that the broader sciences are starting to tackle the notion of early alterations to El Niño due to climate change as well.

However, the most ominous language here centers around methane hydrate. For years, there’s been adamant push-back against potential risks to hydrates coming from well-respected sections of the climate sciences. Nonetheless, those downplaying the threat of warming to hydrates have yet to produce any conclusive proof as to why warming the ocean bottom and applying heat to hydrates won’t result in at least some feedback from these carbon stores (especially under the higher-range warming scenarios). The IUCN report reiterates this risk by identifying 2.5 billion tons of frozen seabed methane at shallow and mid-ocean depths that will ultimately be exposed to warming — risking both an ocean and an atmospheric release.

These last points serve to underline some pretty basic facts, the chief of which is that pushing Nature, and heating up her life-blood world ocean waters, is a very, very dangerous game. And if this poignant new report sends any message at all it could simply boil down to this — turn back before it’s too late.

Links:

IUCN Report: Explaining Ocean Warming

Specific Heat

Ocean Warming

Awakening the Horrors of the Ancient Hothouse

LANCE MODIS

Slimy Green Algae Invades Florida

The oceans are heating up. That’s a big problem on a blue planet.

Global Warming May Dent El Niño’s Protective Hurricane Shield, Increase Droughts

Hat tip to Cate

Hat tip to George Hayduke

Unconfirmed Reports of Giant, 1 Kilometer, Methane Crater Found in Siberia

“We have just learnt that in Yakutia, new information has emerged about a giant crater one kilometre (0.6 miles) in diameter,” the deputy director of the Oil and Gas Research Institute of the Russian Academy of Sciences, Vasily Bogoyavlensky, told AFP.

*   *   *   *

Sometimes, when writing a blog about the latest cutting edge climate science, you feel like you’re tracing the footprints of a Godzilla-like monster. One of Steven Pascala’s proverbial ‘climate monsters in the closet.’ This week has been filled with those days. Days when you get the sense that one might have gotten out.

METOP Methane 2359 ppb

(Arctic methane overburden continues. NOAA’s IASI METOP sensor again shows elevated methane readings today peaking at 2349 ppb [average 1819 ppb] with highest levels [pink] concentrated over the Arctic and upper Northern Hemisphere Latitudes in the 18,000 foot altitude layer. Image source: METOP.)

Just this Monday, I penned a narrative analysis of the signs of methane and carbon store destabilization in the Arctic, the various risks involved, and the potential that the methane blow holes we’ve been witnessing may be linked to giant craters previously found on the ocean floor. Craters ranging from 250 meters to seven miles across.

Yesterday, the deputy director of the Oil and Gas Research Institute of the Russian Academy of Sciences (RAS) issued the above statement to the Associated Press, in which he described a newly discovered 1000 meter crater in the Yakutia region. The statement was then circulated in the Guardian and at Physics.org.

The Maw of Yamal Crater
(The Yamal Crater, as seen above, would be miniscule compared to a Yakutia Crater reported by Russian Scientists yesterday. Image source: The Siberian Times via Vasily Bogoyavlensky.)

The statement was a few paragraphs down in a report that announced a likely link between climate change and the seven other methane craters discovered throughout northern Siberia over the past eight months. It provided no additional context, simply reporting a massive crater. One that, if it proves to be a confirmed recent event, could completely reshape the way we look at how thawing lands and sea beds impact sequestered methane and carbon stores in the Arctic.

But there is still quite a lot we do not know about this crater, including its potential age.

The first Crater, discovered in Yamal was just a bit more than 100 feet across and 220 feet in depth. Of all the craters discovered up until yesterday, it was the largest. According to reports from the Russian Academy of Sciences and from the Russian Center of Arctic Exploration, often through the Siberian Times, these craters were likely caused by explosions of methane under high pressure through a top layer of melting permafrost. The reports identified destabilized relic methane hydrate as a likely source of the eruptions, which the scientists are now stating are somewhat similar to volcanic explosions.

Global Temperature Anomalies

(Global temperature anomalies from the University of Maine’s Climate Reanalyzer today shows extraordinary temperature departures in the range of +20 C above average over Yakutia, Russia. A region that has experienced an extraordinary pace of warming coincident with raging polar amplification. Data Source: Global Forecast System Model.)

The new crater is said to be located in a region of Yakutia, which is a Siberian province many hundreds of miles east of the Yamal Crater. Yakutia hosts some of the densest permafrost deposits in the Arctic. It has also experienced extraordinarily rapid warming similar to the Yamal increase of 2 degrees Celsius in just 14 years. Over coming years, the pace of warming is predicted to be equally rapid. Climate models for the region indicate as much as 8 degrees Celsius warming through the end of this Century. The result is that we see Yakutia, as much of Siberia, in a state of very rapid and destabilizing climate change.

Stresses to permafrost due to this raging rate of warming are extraordinary and involve not only permafrost melt and subsidence but also horrific wildfires that individually burn hundreds of square miles. These enormous wildfires are not normal, garden variety infernos. They often alter the weather, forming enormous fire thunderstorms overhead. They have been reported to burn so hot as to ignite the soil itself, incinerating everything to at least three feet of depth. Near surface methane pockets also likely become involved in these fires and the peat-like structure of the permafrost, once thawed, can result in continued basement smoldering long after the surface fire is extinguished.

siberian-fires-july-23
(Massive wildfires belching out immense plumes of smoke on July 23, 2014 in the Yakutia region of Russia. For reference, bottom edge of frame is about 2000 miles. Image source: LANCE-MODIS.)

These massive, fearsome fires are anything but normal. They are directly linked to the rate of warming, permafrost thaw, and carbon store release in Arctic Siberia. And it appears that for Yakutia, which has seen some of the worst of these fires, a rather large scale methane eruption risk — enough to produce 1000 meter craters — may also now be involved as well.

Links:

Concern Over Catastrophic Methane Release
Russian Scientists Say Climate Change to Blame for Mysterious Siberian Craters
More Giant Craters Spotted in Russian Far North
More Siberian Blowholes Found in the Permafrost
LANCE-MODIS
The Siberian Times
METOP

Hat tip to Colorado Bob

Hat tip to Ouse, MD

Scientific hat tip to The Russian Academy of Sciences