
Last year, on March 30th, I wrote this:
Over the past decade, an increased prominence of blocking patterns has emerged. These events happen when the polar jet stream gets stuck in large meanders. These meanders result in a long persistence of weather for regions affected by these blocking patterns. New papers by Jennifer Francis and other polar researchers last year linked the increasing occurrence of these new blocking patterns to an erosion of Arctic sea ice…
Low pressure systems keep forming over the Bering and Okhotsk seas. Warmer air temps keep invading the American and Canadian west. The eastern part of the North American continent sees a continuous colder air invasion from the Arctic. The Arctic remains much warmer than average…
I may have well written the same thing today. For the weather pattern is mostly unaltered.

(High amplitude blocking pattern plainly visible over the US and Canadian West along with associated trough over the Central and Eastern US in the February 24 Jet Stream model. Image source: University of Washington.)
In fact, if anything, this winter only saw its intensification with numerous polar vortex disruption events, a vicious Arctic heat anomaly that featured and Alaskan thaw in January and Sea Ice setting new record lows for the month of February, and an extraordinary western drought leading to a collapse in California farming and a 10-15 percent hike in prices at US grocery stores.
For a blocking pattern to have persisted for such a long time is somewhat unprecedented. According to the standard definition of blocks (what I’m referring to as blocking patterns) the systems generally tend to last for days or weeks. The most powerful of blocks, like the Bermuda High, tend to last, at most, for a season. But this West Coast and Pacific block has now remained in place for nearly a year. A more solid validation of Dr. Jennifer Francis’ hypothesis — that sea ice melt can result in large Jet Stream meanders and ‘stuck’ weather patterns — is difficult to find.
Dr. Francis, writing for Yale 360 in 2012 queried:
Does it seem as though your weather has become increasingly “stuck” lately? Day after day of cold, rain, heat, or blue skies may not be a figment of your imagination. While various oceanic and atmospheric patterns such as El Niño, La Niña, and the North Atlantic Oscillation have been blamed for the spate of unusual weather recently, there’s now a new culprit in the wind: Arctic amplification. Directly related to sea-ice loss and earlier snowmelt in the Far North, it is affecting the jet stream around the Northern Hemisphere, with potentially far-reaching effects on the weather.
If we were to look for further validation, we might point to a period of storminess of epic intensity that re-shaped England’s coastline, tossed multi-ton boulders about as if they were toys, wrecked rail lines, and dumped so much rain over the English countryside that aquifers began erupting from out of the ground. Since mid December England has suffered its most intense and extended period of stormy weather ever on record. An ongoing disaster that has caused the government to re-consider all its previous assumptions about storm preparedness and should be causing it to reconsider its fossil fuel use as well.

(UK home surrounded by floods. Image source: WTOP.)
For if anyone would say their weather seemed stuck, it would probably be the, still soggy, British. And perhaps those brave souls will provide some validation for Francis’ hypothesis and the predictive power it contains for any who dare to wield it.
Earlier this winter, noting that the shape of the Jet Stream hadn’t changed much since early 2013 and that the Pacific block still remained in place, I penned an article entitled: Winter 2013-2014 — Sea Ice Loss Locks Jet Stream into Severe Winter Storm Pattern for Much of US. The article still receives a remarkable flow of traffic, probably due to the fact that is was predictive of a set of conditions that are ongoing now, 70 days after it was written. And to whom do I owe the ability to generate such an insight? Why the author of the theory herself — Dr. Jennifer Francis.
Simply put, she predicted the weather would probably be extreme and that it would probably end up stuck. And so it has for at least three years running now. Don’t believe me? Just look at the US over the past three years. 2012 featured a drought that drove Mississippi river traffic into mud banks and wrecked a huge swath of the US corn crop before giving way to major flooding and heavy precipitation events that lasted long into 2013. The drought retreated westward where, by 2014, a ravaged California cut off all water to farmers. Meanwhile, the Eastern and Central US suffers a string of weather extremes that include swings in temperature of greater than fifty degrees over the course of just a few days, major winter storm events, flash melts, followed by flash freezes and tornadoes over snow.
Dr. Kenneth E. Kunkel, research professor for NOAA’s National Climate Data Center observed that the occurrence of extreme weather events for the US Midwest had increased by 40 percent over the past 20 years stating:
The number of extreme precipitation events in the Midwest has been increasing over the last 20 years, which is consistent with what we would expect from climate change, which has caused increased amounts of water vapor in the atmosphere. While the heavy snow of this winter is primarily a consequence of the persistent storm track, it may have been enhanced by the increasing amounts of water vapor in the atmosphere.
And this leads us nicely back to how climate change is currently wrecking the world’s weather — by weakening the Jet Stream and by amplifying the hydrological cycle. Both instances we have seen in glaring relief over the past few years of very extreme weather. Dr. Francis, in her own research found that Jet Stream winds over the US had weakened by as much as 20% during the period of 1948 to 2010. A significant reduction in its own right:
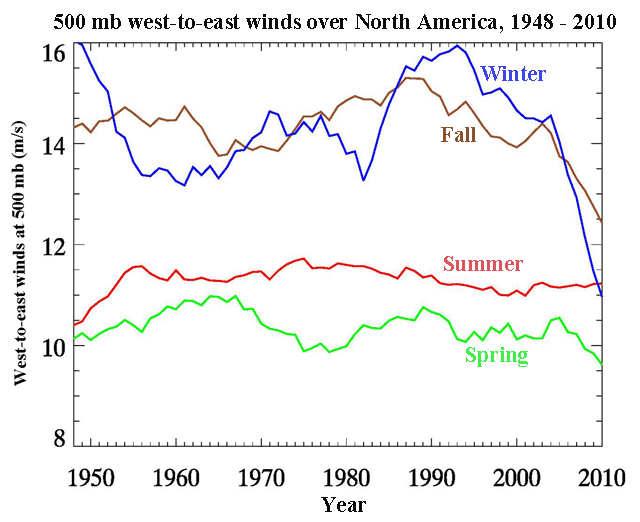
(Slowing of 500 mb winds from 1948 to 2010. Image source: Weather Underground.)
I bring up these instances and proofs to show, at least in the context of currently ongoing weather, that Dr. Francis’ claims have born out. Some scientists disagree, however, and appear to be using their clout to shut down what is now a useful tool for extreme weather prediction. And this is a sad event, because the climate state in which Dr. Francis’ predictions hold true probably won’t last for more than a few decades. The weather will certainly remain extreme. But by the time polar amplification has pushed the ice sheets to swiftly melt and human warming has pushed the tropics into a phase of rapid heating, the Jet Stream is likely to again intensify even as it re-centers around Greenland and the North Atlantic. Such changes will probably bring an entirely different set of weather concerns.
But, for now, as the northern polar region amplifies, Dr. Francis’ predictions bear out remarkably well. And this is as obvious as the daily weather report, awkward explanations of why the polar vortex collapsed so many times this year or why the Jet Stream is running so far north over Alaska aside…
Links:
Linking Weird Weather to Rapid Warming in the Arctic
Climate Change or Just the Weather: Experts Sound Off
Dr. Jeff Masters: Our Extreme Weather Arctic Changes to Blame?
Arctic Warming, Extreme Weather Link Unclear


ccgwebmaster
/ February 26, 2014Actually, I wonder if the jet stream would really strengthen again. Isn’t it possible the polar cell disappears entirely, leaving only the Hadley and Ferrell cells? There is some suggestion that at times in the past it may have been only the Hadley cell for that matter.
Also, why would we expect equatorial warming to overtake polar warming? I think we can expect more equivalence between the two – the polar regions are warming so fast right now equatorial warming would be rather improbable to widen or even maintain the gap between the two regions?
A relatively small change in the equatorial regions does however have disproportionate effects as most things living (including people, their crops and local infrastructure) are not adapted to variable conditions. The variance between seasons is small and so shifting the system even a little is worse in many ways than towards the poles?
LikeLike
Miep
/ February 26, 2014Wouldn’t we have to reach some new equilibrium state where heat differentials drove whatever jets we had going without all these distortions driven by such as melting, for them to level back out?
LikeLike
ccgwebmaster
/ February 26, 2014I haven’t looked into this stuff properly – I mean – I’ve read the link – but I really need to set aside some proper time to understand better how the cells work and to try to find more information about this idea, but still – it’s interesting…
http://www.seas.harvard.edu/climate/eli/research/equable/hadley.html
LikeLike
Miep
/ February 26, 2014Thanks very much for the link, I was just thinking this was what I need to get a better handle on.
LikeLike
ccgwebmaster
/ February 26, 2014Incidentally the Intertropical Convergence Zone (ITCZ) is already moving northwards. That has important ramifications for where rain falls. If memory serves it marks the boundary between the Hadley and Ferrel cells – winds nowhere near as strong as the jet stream – but still important. If it’s moving north – does that mean the polar cell is being squashed? Francis states the amplitude of the meanders is increasing and if memory serves she also states that the jet stream itself is tending to track further north?
So can it fall off the planet? Can the polar cell disappear? What happens then to the ITCZ? Can we reach a two cell system? How widely would it change rainfall and weather patterns globally if so? How fast could it happen? (I suspect quite abruptly actually). How about a one cell pattern? We know the polar regions will tend to warm far more than the equatorial ones – so I don’t see the strength of the thermal gradient being restored in a planet with ever less ice somehow… and the atmosphere is also thickening (at some heights at least) as the Arctic warms (again, if memory serves from Francis but also Stu Ostro).
It isn’t quite as excitingly explosive and obviously doom filled as the methane question – but I think it’s still rather important. After all, we are seeing effects to the polar jet stream that are increasingly obvious and yet we are still in the very early days of even the transition to seasonally ice free conditions (in terms of effects – I think we will see a rapid change in the near future, as events are still accelerating fast up there). Regular rainfall for those who still enjoy it is something of significant importance…
LikeLike
robertscribbler
/ February 26, 2014If the pole cools due to a large melt outburst relative to a warming temperate and tropical zone, this would likely drive an intensification of the Jet Stream during that period.
LikeLike
robertscribbler
/ February 26, 2014Eventually, that will probably be the case. But what many of the climate models are showing is strong localized cooling around Greenland as rapid melt gets underway and, at the same time, rapid warming in the tropics. This cooling is spurred by large fresh water pulses and the ice berg cooling effect.
LikeLike
ccgwebmaster
/ February 26, 2014Ice berg cooling effect – a Heinrich event? I guess the question is – can such an event really match or exceed the potency of the extensive perennial sea ice cover we will have lost at that point?
If one presumes the sea ice cover might return with enough cooling, it’s hard to see how that could possibly be sustained as the moment you increase the strength of the jet stream again the implication is more heat must move polewards – clearing out your ice for food?
LikeLike
robertscribbler
/ February 26, 2014When I get back to my desk, I’ll pull the Hansen analysis and model assessments that these assumptions are based on.
In general, though, the issue is all that cold stored in Greenland ice. When it melts, it moves and expands into the region around Greenland. The magnitude of the event is directly related to Greenland’s pace of contribution to sea level rise. If we see about 1.5 meters of sea level increase, with half from Greenland, over the next 50 years, we end up with strong local cooling around Greenland on the order of -2 to -5 C below the mean. The result is the creation of a large cold air pool off-set to the pole and invading the North Atlantic.
To tamp down controversy, this is not a new ice age, just an episodic event that generated severe instability over the warming cycle.
At the same time, the tropics are gathering heat and pushing the cells north. The polar cell is now lopsided and directly in the path of powerful warming trying to circulated around the globe.
The result is extraordinary instability and storminess with a periodic unraveling of the polar (Greenland) cell that, according to Hansen, sparks devastating frontal storms.
In short, those ice sheets are breaks to warming which will not happen in a linear fashion but will most likely progress in fits and starts. BAU is enough to take all the ice sheets down over the course of hundreds of years, but the process will be messy and highly unstable.
So, in the process, we don’t end up with a neat progression of the Hadley cell northward. We get initial expansion, rapid melt, weather and circulation instability and conflict, and then a reinvigoration of expansion as the heat wins out. That, too, is probably too simplified. But it gives a better picture of likely progression of events.
In the end, we’ll probably see the polar cell/vortex take on a number of odd and bizarre shapes as it’s mashed by competing forces. The extreme weather we are seeing now is nothing compared to what is likely to occur by mid century.
LikeLike
Miep
/ February 26, 2014So there would be your heat differential, for as long as it lasted. So would things still get stuck and wander around away from Greenland?
I know, I’m asking simple questions about a ridiculously complex process.
LikeLike
robertscribbler
/ February 26, 2014Hey Miep. I covered this in my reply to CCG below. But, basically, yes. Eventually the polar cell re centers to Greenland as ocean and continental warmth progresses. We see that, in part, now with the vortex roving over Hudson and Baffin Bay for much of this winter. That heating Arctic Ocean is in the process of cutting the polar vortex in half. One node is over Russia the other over Canada and the heat bleeding out of the thinly iced waters prevents a strong vortex formation over what used to be a pretty solid ice cap. Not the case currently.
Oh, we may see some winters when there’s an attempt at central vortex re-establishment. But that’s going to be less and less likely going forward.
LikeLike
Miep
/ February 26, 2014Thanks Robert!
It would be so much fun learning about all this, if I, y’know, lived on a different planet. That’s a lot of the cognitive dissonance for me. I want to get all involved with this puzzle, I love puzzles. But this one has a gaping hole at the bottom.
LikeLike
robertscribbler
/ February 26, 2014It’s not pretty. But I still think we can stave off the worst of it. Thing with feathers and all that jazz.
LikeLike
Miep
/ February 26, 2014Right, right. Feathers, yay!
I just finished watching a somewhat deranged video comparing WIPP to Fukushima. Before that I read an RT article referring to our town lunatic Martin Mills as a credible source.
I’ve often heard RT was not to be trusted, and now I have first-hand evidence. “Mayoral candidate” Martin got four votes last time he ran, he’s notorious for relentlessly harassing women, including me (I’ve never so much as been introduced to the guy), he’s been jailed for stalking, everybody I’ve ever discussed this dude with agrees that he’s totally out to lunch.
Martin has, I’ve heard, also run for governor, and municipal judge.
I enjoyed commenting on RT about this but at this point I consider them a comedy site.
LikeLike
robertscribbler
/ February 26, 2014So what exactly happened with WIPP. Was the leak small, medium, or large?
LikeLike
Miep
/ February 26, 2014A salt truck caught fire down underground, and about ten days later a radiation release was recorded from the vents. It’s not clear whether these are related events. The filtering system kicked in but there was a brief release. They don’t know what caused it. CEMRC has been monitering the situation (that’s CEMRC’s mission, to monitor WIPP) and they found small amounts of plutonium and americanium above ground nearby. There is a lot of online talk about how this blew to Oklahoma but these are heavy particles and I’m not convinced, I’m not seeing any valid citing, just stuff people online draw on maps, presumably related to wind patterns.
It’s been shut down for incoming waste since the salt truck incident. There is a lot of dithering about how they’re going to fix this. I don’t see how they even open it back up without more release. Also how are they supposed to find what’s leaking without even more exposure? And what about the filtering system, won’t the filters need cleaning?
Basically somebody blew it, there’s something unsealed down there. This could kill their whole mission project, and it’s a huge poke in the eye for nuclear apologists.
Overall I think they’ve been very careful, but human perfection just ain’t doable…
LikeLike
robertscribbler
/ February 27, 2014All too true. But I honestly wonder if the site had been run and managed by women, if this wouldn’t have happened?
Yet one more nuclear mess — however small. Some tools are just too powerful and best left unused.
I wonder if this disposal site can be brought back into operation or if they’ll have to find another area? Based on your response it appears that the situation is still developing. Let’s hope they can get this beast under control without any more damage.
Plutonium and americanium? That’s weapons grade materials. How lovely…
LikeLike
Miep
/ February 27, 2014The WIPP incident is still totally up in the air, far as I can see. My guess is that this is going to drag on for a long time.
I would not say things would have gone better if women were in charge, though, because the problem is assuming that perfection is possible. Dealing with extremely toxic substances requires perfection. Neither men nor women are perfect. That’s the whole problem right there with dealing with nukes.
LikeLike
robertscribbler
/ February 27, 2014It seems to me women have a talent for attention to detail that men seem to lack. That said, I agree. And I should have put a 😉 after the comment as I was being a bit tongue in cheek.
Hope this doesn’t grind out too long.
LikeLike
Miep
/ February 27, 2014It will drag on and on. And on and on and on. It will be like Fukushima, only lightweight. No one will no what to do, ever.
And I’d never consider you sexist, not after reading your novels. Best Female Protaganist Ever.
LikeLike
robertscribbler
/ February 27, 2014Wow. Well, that’s an amazing complement. My heart went into Luthiel and much of it still goes…
LikeLike
Miep
/ February 27, 2014Oh, you got it Robert. Luthiel is just great. Also I loved how you wrote about how you were giving props to your mom.
Luthiel being so young is so important. She’s just becoming an adult and she has all this hugely difficult stuff to deal with, yet she manages.
And the vampires turning out to be heros is fantastic. And the werewolf and the mini-dragon.
I do see the theme, and it’s a beautiful one. People you think are bad guys can change, they can turn out to be your friends.
Really powerful stuff, and very pro-feminist! Also her sister is a terrific character.
LikeLike
robertscribbler
/ February 27, 2014I have a lot of strong women in my life. They keep inspiring me. My wife and her sister have a very strong relationship which, in part, inspired the interplay between Luthiel and Leowin.
And, sometimes, you can turn the monsters, if you’re willing to dive into the darkness for a little ways with them to discover where they went wrong in the first place. Very dangerous, though, and doesn’t always work out.
The idea is that there’s strength in communication and sharing, of walking in someone else’s shoes and learning how they work. Connection is what gives Luthiel her magic and her strength. The conflict comes when she wants to pull back or when the connection is overwhelmed by malice on the other end.
Luthiel/ water through stone / is Earth or a metaphor of a person connected to the Earth and life itself. An angel of the Earth, as it were. But she arises in a time when things have gone horribly wrong and so she is deeply conflicted and in danger. She doesn’t see as clearly as she should and, like our natural world now, she is pushed out of balance even as she seeks to regain it. And all this in a vulnerable 15 year old girl.
I have trouble writing the story because I keep feeling I might get something wrong. It’s a huge effort for me with a lot of mental heavy lifting. The second book, I believe, needs a bit of a polish. And the third, well, that one’s a beast I’ve been wrestling with for many years now.
In any case. I honestly believe if we had more women in leadership and, more importantly, if we supported feminism, rather than attempting to turn women into men, then we would be far better off. If you look at most of the positive social movements of the 19th and 20th century, a majority were started by women. In many cases, they were started by women who were upset or outraged by men behaving badly. They were key to the advancement of civil rights and to a great social enlightenment that appeared over that time, only to be stomped back as we reached the 80s.
In my view, the more women are encouraged to hold up their ideals to solve problems in their own unique and far less violent fashion, the better off we will be. In my view, we need to hold up and reawaken the notion of Goddess and all the other feminine ideals and mindsets to follow. We desperately need connection with our world, with all life, and with others. There is no way out of our current crisis without it. Pure masculine domination and conquest is wrecking us and laying everything to waste.
And that’s why I’ve written so passionately about Luthiel. Why that fantasy will probably end up as a life’s work — succeed or fail.
LikeLike
ccgwebmaster
/ February 26, 2014Incidentally if the locus of the cool end of the heat engine moved over Greenland like that – once albedo was lost in the seasonal land snow pack and the sea ice – how big an impact do you suppose that would have on northern hemisphere weather? It strikes me it could be significant even if the 3 cell system were still operating in a recognisable fashion?
That said if blocking patterns became persistent enough – lasting for multiple years at a time – that’s actually better as it’s more predictable. Variability between drought and flood is a big problem – but a fixed drought or flood (within reason of course) and you can try to plan your crops accordingly (infrastructure is a little trickier).
LikeLike
Miep
/ February 26, 2014If you had reason to think there was a decent chance the flooding had moved out for awhile, you could be a flood-follower and then leave when the aquifer went down again. But you’d have to be migratory and as you say there would have to be some predictability, not an entirely chaotic state.
LikeLike
robertscribbler
/ February 26, 2014Terrifying weather. What we see now is just prelude. Infrastructure, crops, everything in serious trouble should that dynamic bear out.
LikeLike
Tom
/ February 26, 2014Another factor is the slowing thermohaline conveyor, weakening the Gulf Stream (among other knock-on effects). This could change winters from wet to snowy in England or Eastern Europe into the middle of the continent (or further).
LikeLike
Danabanana
/ February 26, 2014Hi Robert,
The stuck pattern happened all around the northern hemisphere for the last 5 years at least. It became more obvious after 2007 melt out with 2010/11 and 2011/12 winters in UK particularly long and cold. This was followed by wash out summer running from May till early October.
Winter 2013 in the UK started in January and went on till end of May with a max daily of 4°C-5°C from the end of May all the way through Summer which was mainly dry with a failr stable 19°C until late August with above average temperatures thereon untill end of December when the heavens opened for pretty much 2 months solid.
I’m sure we could look at Siberia and find similar long lengtht periods of weather but I supopose that in the UK, having a variable weather, the stuck patterns are more obvious.
Unfortunately people only notice this when the weather is bad and make no mention of it if the stuck pattern results in a long sunny summer.
Also I think Professor Francis is spot on (in spite of some other study challenging hers) but I also think that High Pressure systems may be getting stronger, as predicted with GW, and the combination of both makes the stuck pattern more severe.
LikeLike
robertscribbler
/ February 26, 2014Good points. But I also think it likely that the meandering Jet Stream and strong highs are related. Weak Jet allows for more powerful highs, more powerful highs bully the Jet. There may well be a number of other warming related factors at play (heightening troposphere etc).
LikeLike
Mark Archambault
/ February 26, 2014Robert – excellent article as always. What I relate below is WAY OFF TOPIC, but its something I’d like some advice on.
I’ve forwarded your articles to a particular friend of mine who blames the shift in the jet stream and just about all other global warming impacts to, wait for it…: ‘chemtrails’ and HAARP.
This person can be otherwise intelligent on many matters, but doesn’t seem to grasp that you don’t need ‘chemtrails’ and HAARP to explain what we’re seeing in terms of climate change, that the physics of increasing greenhouse gases is all you need to generate what we’re seeing. She believes that persistent contrails are producing more clouds which are trapping heat close to the earths’ surface. When I tell her that CO2 alone will do that, she doesn’t seem to want to hear that.
I’ve told her that if there’s any truth to this chemtrail business, that most likely it’s experimentation on geo-engineering to cool things down, not deliberately heat things up. (I recall reading that Edward Teller has proposed spraying aerosols into the atmosphere to cool things off.) Then I cite the experience of the days after 9-11-2001, when all planes in the US were grounded. Didn’t the temperature over the continental US go up by a significant amount for a week or so? I seem to recall seeing such a study.
On several occasions I’ve seen the tic-tac toe grid in the skies, and it has caused me to wonder if something nefarious and secretive is going on, but my scientific understanding is that if you don’t need to ‘go there’ to chemtrails for an explanation, then they are likely irrelevant to the discussion. Is it possible that humidity levels or other atmospheric factors at the height jet planes fly has changed so that regular contrails are lasting longer?
The only thing that irritates me more than creationism is denial of human-caused climate change, or more specifically, claims that emissions of GHG are not to blame. I bring this up because this person does have some sway over others, having her own local radio show that reaches a few thousand people perhaps. It’s all I can do to not call her an idiot and jeopardize our friendship.
If anyone has any advice or links that may help me set the record straight with this person, it would be appreciated.
LikeLike
Mark Archambault
/ February 26, 2014I’ve done some Googling and found a few good chemtrail debunking sites, like these:
http://conspiracies.skepticproject.com/articles/chemtrails/#wtf_are_chemtrails
and http://contrailscience.com/
which I’ll read closely.
Still, it may be a worthy article and discussion to consider the various denier arguments out there and how to counter their arguments in two minutes or less!
LikeLike
Miep
/ February 26, 2014Well, it’s certainly interesting to read here that contrails linger longer now because of atmospheric changes. Really useful information.
LikeLike
robertscribbler
/ February 26, 2014Expanding troposphere and a proliferation of higher level clouds is one amplifying feedback of human caused warming that keeps the heat trapped in. The jet traffic, in effect, seeds the feedback. It’s just one more of our impacts.
LikeLike
robertscribbler
/ February 26, 2014A large helping of anti-government conspiracy theory with a little dash of truth just to make the misinformation seem valid.
Increasing high clouds due to atmospheric changes is one feedback that is likely to generate increased warming. Jets, traveling at 30,000 feet + and producing condensation trails, have a role in amplifying this process by increasing upper level cloud cover that traps more heat.
This is not a government conspiracy, just an in essential upshot of expanding high altitude jet traffic.
HAARP is a government/military communications facility. And it is one of many such antenna arrays used for circum-global communication with submarines, special forces teams and other highly mobile groups. Some of these facilities bounce transmissions off the ionosphere. And this particular aspect seems to have really riled the conspiracy folks. At first, the mighty powers attributed to HAARP involved a kind of global mind control. Now, for some reason, human caused climate change is blamed on HAARP.
Spraying of sulfur dioxide and other aerosols as a form of geo engineering — as you mentioned — is one plan on the books to attempt to slow down human caused warming. If such an action is now ongoing, it is being conducted in secret. I find this to be highly unlikely. But, in any case, the goal would be cooling not heating.
I guess the main question I have is if you believe the government is evil, nefarious, and secretly bent on killing everyone off, then why would they be going to all the effort of warming the Earth when all they would have to do is just let the fossil fuel companies do the dirty work for them? They, if they really are these satanic creatures the conspiracy theorists imagine, don’t need HAARP or chemtrails to warm the Earth. And the other question I have is what motivates them. Most conquests pre-suppose an object of value to capture. But a world with a wrecked climate is hardly a prize worthy of the effort. The imagined villains are simply beyond belief.
As with any climate change denier, you’re not likely to directly defeat their particular mindset. But you can point out that all of science has validated human caused warming. NASA, NOAA, the world meteorological organization, the weather channel, the UN, pretty much every nation in the world. So why should you believe her? What makes her more of an authority on the issue than NASA?
I’d just say something of that nature and leave it there. Some minds cannot and will not be changed. Go around them and work on those that are less closed.
LikeLike
Miep
/ February 26, 2014This:
“I guess the main question I have is if you believe the government is evil, nefarious, and secretly bent on killing everyone off, then why would they be going to all the effort of warming the Earth when all they would have to do is just let the fossil fuel companies do the dirty work for them?”
LikeLike
Danabanana
/ February 26, 2014“Is it possible that humidity levels or other atmospheric factors at the height jet planes fly has changed so that regular contrails are lasting longer? ”
Not only possible but true. I have posted a link to a Contrail study in the Guardian’s article on Geo-Engineering but there are others out there that confirm that increased humidty and an increased fleet are the cause.
LikeLike
Mark Archambault
/ February 26, 2014Thanks much Robert and Danabanana. Though I’m not a scientist, it’s good to know that I can still think critically some of the time! I credit that to a refresher course I received in critical thinking, as applied to the ‘debate’ about climate change, found in the book “What’s the Worst that Could Happen?” by Greg Craven. I should hand that book out to skeptics.
LikeLike
Mark Archambault
/ February 26, 2014I also wanted to say that I’m learning a lot from the very intelligent and well-researched comments by ccgwebmaster, Colorado Bob, Miep, and many others throughout this recent series of articles by Robert. I used to frequent Joseph Romm’s climate blog at Thinkprogress, but am now finding I prefer Robert’s for staying up to date on the rapidly evolving understanding of climate change. I consider this the best climate blog on the Net.
LikeLike
Miep
/ February 26, 2014hah, you give me too much credit, I can’t hold a candle to these guys. Also mikkel is fascinating and xraymike has a lot to offer.
I’m glad you appreciate the discussion, though. I agree this is the most interesting climate blog online, far as I’ve found anyway. The level of sophistication of the discussion is often beyond my paygrade but I just keep reading all of it and it gradually sinks in.
LikeLike
mikkel
/ February 26, 2014“I used to frequent Joseph Romm’s climate blog at Thinkprogress, but am now finding I prefer Robert’s for staying up to date on the rapidly evolving understanding of climate change.”
Yes..this is because Romm’s blog is focusing more and more on scoring political points (perhaps why he doesn’t directly post that often any more). Robert has the courage and freedom to tell unvarnished perception of truth even if it is not politically expedient!
I believe that Robert has much more potential to actually contribute to influence and change vs. Romm because we need bottom up reorganization instead of narrow top down policy “solutions.”
LikeLike
mikkel
/ February 26, 2014Thanks miep. I’ll pass it on to my partner. She gives me flack for spending time contributing on another person’s blog because she feels that it’d be better spent having my own blog focusing on practical organization. You know, whenever someone comes along and says they are moved by Robert’s writing and ask how they should personally respond? He prevaricates a bit because it is difficult to come up with suggestions that help individuals immediately but also contribute to the whole in a reinforcing manner (going off the grid and learning to grow your own stuff doesn’t directly help with the latter part). We’re working on frameworks to help people plug in, making the possibilities more concrete.
However, it takes much less mental energy to react to what other people are writing than trying to guide the conversation. So Robert finding important stuff where I can just provide my (unique) take is crucial. As long as it helps someone, at least it’s not a waste of time.
LikeLike
Miep
/ February 26, 2014It’s all good, mikkel. All recognition of the problem(s) and what needs to be changed is good. If we give up hope we might as well just slit our wrists, and if we attack each other for not being or doing enough, we’re just wasting each other’s energy and making it more difficult to listen to each other. I know I don’t do enough, but being around people who get it keeps me going, gives me some impetus to do something, at least. And that is where everyone begins.
There is a lot of good energy and thinking going on here, and your contributions matter.
LikeLike
robertscribbler
/ February 27, 2014Everyone here contributes and the blog would be far, far less without you. I consider it an honor to host such intelligent, compassionate and insightful people here and to have the opportunity to facilitate this amazing dialogue.
In any case, I’ll do my best to live up to the high praise. It takes a huge effort to put the research, writing, and tone together. And I always feel that I should be writing faster or developing a sharper edge.
As for helping individuals respond… I appreciate you jumping in and filling any gaps. I’d also encourage you to consider writing a book on the subject. I’d be more than happy to review and promote it here. In addition, if you’ve developed a specific service or plan of action, please let me know and I’d be more than happy to cover it.
LikeLike
Miep
/ February 27, 2014Back atcha, Robert.
This is all so scary. Knowing people to talk to about it is huge. It’s the difference between terrifying freezing isolation, and thinking; okay, we can calm down some and make some decisions, work to change, talk about it, figure out options.
LikeLike
mikkel
/ February 27, 2014Thanks Robert. I am afraid I won’t be writing a book on this any time soon. All the creative energies are towards business/technical creations — when I do get in the writing mood then I prefer to focus on fun fiction. I do not believe there is much to contribute on a theoretical level anyway, it is about creating organizations and methodologies on the ground.
As I’ve mentioned to you in the past, one project I’m working on aims to reduce energy consumption on the household level by 50%+ without the need for the homeowner to pay much upfront. We are currently at an interesting juncture because we have all the players agreeing it can work quite elegantly but there is no investment money readily available since it won’t make anyone a billionaire. That is the only criteria for professional investors these days — unfortunately even in NZ.
As such, we’re going to crowd source funds from the populace, with equity available (except I’m not sure about being able to offer equity to US citizens. The US acts like citizens are beholden subjects and thus dictates what they can and can’t do even when overseas). These funds will be used to demonstrate the feasibility of the concept in 400+ homes we’ve lined up with the support of multiple local governments. After that, it will allow us to create bonds as investments, with the intent of getting people to divest from the globalized financial system.
If you wish, I could explain the model in detail so you can post a critique (pointing out both positive and negative reaction — I don’t approve of techno-hagiographies of course). It is replicable for many ideas that provide tangible output for core necessities. It is our intention to copy the methods and technology to different areas to help provide jobs/opportunities so people can work on something worthwhile.
LikeLike
robertscribbler
/ February 27, 2014I’d be very interested in writing an article/critique on your efforts. If you have materials I can read, I’ll work it up for you as soon as you need. In addition, I’d be more than happy to help your crowd-sourcing effort by linking it in the article.
LikeLike
Timothy Chase
/ February 26, 2014Robert, you write in the essay:
I hope you don’t mind my asking, but what tool are you speaking of? As far as I can tell, the useful tool in this case is actually her theory, but while one might deride a theory, I can’t really see how one might shut it down. Do you have something else in mind?
LikeLike
robertscribbler
/ February 26, 2014If the theory is accepted as potentially valid, it becomes a useful tool for weather and climate prediction.
In this case, Francis’ observations bear out in reality. We have longer periods of ‘stuck’ weather. We have more persistent blocking patterns. We have periods when the Jet Stream is much weaker than it would typically be. And we have jet stream invasions into the far, far north.
The net effect of the backlash against Francis has been to stop and reduce discussion on these topics, which are plainly visible to anyone engaged in basic observation.
In any case, the tool is Francis’ theory. Which is predictive in the current climate state.
LikeLike
Timothy Chase
/ February 26, 2014I am somewhat puzzled by the reaction as well. It certainly seems Francis is on to something.
LikeLike
Timothy Chase
/ February 27, 2014Something that may also be of interest, this time from the Guardian UK… a map of the unusual weather throughout the world for the month of January, with much of the northern hemisphere’s unusual weather being tied to the jet stream:
http://www.theguardian.com/environment/datablog/ng-interactive/2014/feb/25/interactive-map-january-2014-extreme-weather-worldwide
LikeLike
robertscribbler
/ February 27, 2014Thanks for this one, Timothy. A huge resource that, especially with so many events ongoing.
LikeLike
mikkel
/ February 27, 2014I wish there was a dedicated source for this. One time I emailed Romm in order to ask whether he’d use Climate Progress resources to keep a database but never got a response. This map is a bit much but it makes sense only being for a month. I proposed a database of 100, 500 and 1000 year events so then it’s easy to keep track over years or decades.
LikeLike
robertscribbler
/ February 27, 2014It’s worth noting that the current blocking pattern keeps threatening to break down. The models show another flickering this week. We’ll see if it re-asserts or if we get another strange pattern.
Ocean kelvin wave in the Pacific indicates El Nino is pretty certain come late-spring summer and may be a strong one. In the past, El Ninos have tended to flatten the Jet Stream by increasing temperature difference north to south. Didn’t happen in 2010, though. So we’ll see if this El Nino, which is predicted to be relatively strong, has a flattening effect or not.
If we still see large rossby waves and warm air invasions into the Arctic during El Nino, I’d see that as very strong validation for Francis’ theory.
LikeLike
james cole
/ February 27, 2014Long before I ever read about the blocking patterns and the new rapid arctic sea ice melt, I and my neighbors ALL have noticed and commented on the changed way in which weather functions around here. 50 years ago, we had something of a 5 day pattern, 1 day sunny, 2 days partly cloudy, 1 day of rain, 1 day cloudy without rain. Of course this varied, but the rule we all lived by was that it rained 1 out of every five days.
the last decade, we experience normal patterns of of extended periods of stuck weather. Months on end with no rain and few clouds, followed by record rain fall events, then back to months of no rain. Now we are locked in snow and cold, for 3 months we have had no departure from this pattern. In summer, we often go 3-4 months without a drop of rain. This is not the weather of 30 years ago, it is totally changed, and I am not alone in noticing this. And of course we all have noted to constant temperature rise. And the increased level of rain events, while their number has dropped drastically.
LikeLike
robertscribbler
/ February 27, 2014In what region do you live, James?
LikeLike
james cole
/ February 28, 2014Northern Minnesota up on the Canadian border and on the shore of Lake Superior.
LikeLike
robertscribbler
/ February 28, 2014That’s a rough zone to be in right now. Please take good care of you and yours.
LikeLike
Timothy Chase
/ February 27, 2014An analysis by UK Met Office that may be of interest. It ties together intense rains in Indonesia, the cold winter in the eastern United States, the chain of storms hitting the UK, the .jet stream and polar vortex….
LikeLike
robertscribbler
/ February 27, 2014Excellent. Now we have a good summary of events and some food for further analysis.
But the other question they need to ask is:
IF/HOW DID POLAR AMPLIFICATION AFFECT THESE CONDITIONS??
If there’s one glaring hole in the summary, that’s it. Ignore that and you’re missing the elephant in the Northern Hemisphere.
LikeLike
Timothy Chase
/ February 27, 2014robertscribbler wrote:
That is why I brought it up: I enjoy reading your analysis and sharing your insights.
The closest they come to acknowledging that polar amplification may be playing a role in this extreme weather is on page 22:
… with the footnote to:
LikeLike
robertscribbler
/ February 27, 2014Check what I last said.
GFS shows three storms over-riding. Euro only shows one. Then the blocking pattern re-establishes. Interesting times…
LikeLike
Timothy Chase
/ February 27, 2014Regarding the second paper in the footnote, like all PNAS papers after the first six months, it is Open Access. In the abstract, it states:
Later in the paper, they state:
Stefan Rahmstorf of Real Climate is listed as one of the authors.
LikeLike
robertscribbler
/ February 27, 2014Thank you for digging up these references. It’s worth noting that the amplification of the Pacific ridge has been extraordinary this winter, often extending into the Arctic Ocean. The pulses don’t last and tend to get cut off. But they are extraordinarily high amplitude.
One ongoing now (now in cut off phase) is, in my view, helping to kick off a new set of severe weather extremes falling in line for Saturday, Sunday, and Monday in both the UK and for the Central and Eastern US.
LikeLike
robertscribbler
/ February 27, 2014Just want to note that the Pacific Jet is now over-riding the block out west. Looks like three storms on the way if the over-ride continues. The Siberian excursion of the polar vortex appears to locally strengthen the Jet over the Pacific as the Greenland/Hudson Bay excursion strengthens it over the Atlantic. Such events appear to be amplifying the storm track. Meanwhile, we have Arctic anomalies back above +2.5 C for the entire region.
LikeLike
Timothy Chase
/ February 27, 2014mikkel writes:
It isn’t a database, but you might try Ross Gelbspan’s “Heat is Online” which has a section devoted to extreme weather events. Judging from what he has, the latter half of last year was slow, his summary having links to only 4 stories, but for the earlier half of last year he has a summary that links to 23 different stories.
Please see:
He does his summaries in six month installments, Jan-Jun, Jul-Dec, with the last ending in December. He may public the next installment to be added to as things progress rather than waiting until the end of June. It has been his pattern in the past, but I can’t really say.
Incidentally, the one place I can think of that might be better able to take on such a project as tracking extreme weather events might be Skeptical Science. They seem to have a fair amount of manpower. But I am not sure that it would be the sort of thing they would be interested in.
LikeLike
Timothy Chase
/ February 27, 2014CORRECTION to second to last paragraph, second sentence:
LikeLike
mikkel
/ February 27, 2014This is a start. I’d prefer reports in the 100+ year format because that’s what’s used for zoning, insurance and the like. It is how to prove to actuaries that we need to change things.
LikeLike
mikkel
/ February 27, 2014It’s difficult though because you need access to regional data in order to ascertain how extreme an event actually is. That’s the other reason why I want it quantified like that — extreme events have always happened and people can dismiss current stuff when talking about “a flood”, etc. and it’s only through saying “there have been four 100 year floods in 10 years” that turns it from anecdote to data.
LikeLike
Timothy Chase
/ February 27, 2014I think part of the problem with saying that some event is a five hundred year heatwave or what have you is that there often has to be a certain amount of historical and statistical analysis done to establish how often we can expect such an event. A good example would be the Russian Heatwave of 2010. Assuming a bell distribution, that heat wave would have been a 1.5 in 100,000 year event. However, heat waves in Russia do not follow a bell distribution, but in fact the distribution has a long tail. Consequently Tamino calculated the frequency at more around 1 in 1,000 year event.
Please see:
Extreme Heat
As such, what you are looking for sounds like it may require more in terms of analysis. As such, while it may not be what you want, you might nevertheless find value in:
Explaining Extreme Events of 2012
http://www.ncdc.noaa.gov/news/explaining-extreme-events-2012-climate-perspective
NOAA is supposed to publish one of these each year.
LikeLike
Timothy Chase
/ February 27, 2014Mikkel, I think part of the problem with saying that some event is a five hundred year heatwave or what have you is that there often has to be a certain amount of historical and statistical analysis done to establish how often we can expect such an event. A good example would be the Russian Heatwave of 2010. Assuming a bell distribution, that heat wave would have been a 1.5 in 100,000 year event. However, heat waves in Russia do not follow a bell distribution, but in fact the distribution has a long tail. Consequently Tamino calculated the frequency at more around 1 in 1,000 year event.
Please see:
Extreme Heat
LikeLike
Timothy Chase
/ February 27, 2014Continuing along those lines, what you are looking for sounds like it may require more in terms of analysis. As such, while it may not be what you want, you might nevertheless find value in:
Explaining Extreme Events of 2012
http://www.ncdc.noaa.gov/news/explaining-extreme-events-2012-climate-perspective
NOAA is supposed to publish one of these each year.
LikeLike
mikkel
/ February 27, 2014Well Timothy of course the weather isn’t actually a bell curve, but that is how everyone assumes things. The reason I want the database has nothing to do with physical reality, it has to do with social reality. All the flood plains, crop predictions, and so forth are made given a model and so the extreme events should be presented in the same model to show that something is seriously wrong.
As far as actually reality is concerned, we’re quickly approaching the point where it’s not actually possible to calculate a distribution. Tamino does a good job of showing how warming is skewing things dramatically already but I would be surprised if any techniques can hold together for much longer than another decade or two.
LikeLike
Timothy Chase
/ February 27, 2014mikkel, you write:
I don’t have a background in statistics, but it would seem that when speaking of a historical distribution curve that is well-defined in the wings, one is presupposing a quasi-stationary system in which the same distribution would be applicable at any given time. If the distribution has been stable for the past 10,000, then this would seem to be a good enough approximation to meaningfully speak of a 500 year event. However, if the distribution has undergone considerable evolution in the past 1,000 years, then speaking of a given event as being 10,000 year event would seem problematic.
Is this essentially what you are thinking? Of course, someone might try to argue that one might extrapolate the distribution from the period over which it has been stable for meaningfully arriving at the frequency of such events, but personally I suspect such any such approach would be invalid,
LikeLike
mikkel
/ February 27, 2014Timothy — correct. Once you enter a nonstationary period then the statistical moments fall apart and any distribution is impossible to calculate.
The argument, as you allude to, is what data to include in the distribution to define “stationarity.” This is an open question largely subject to interpretation and intent of the analysis.
From a complexity analysis standpoint there is emphasis on temporal patterning, fractal dimensionality, etc. In almost all real (healthy) processes, the distribution is almost always some sort of power law with varying amounts of skew and kurtosis. If you look at a subset of data small enough that it is truly stationary, then most of the time it’s not interesting. If you’re looking at a subset large enough to be interesting, it’s hard to argue it’s stationary.
In the last several thousand years, you can argue that the climate has been quasi-stationary and therefore “boring.” Which is a good thing when it comes to planning. If you started to include the abrupt state changes caused by the beginning of an interglacial then it’s hard to argue the distribution makes sense because the temporal patterning is so strong as to render QQ plots or whatnot worthless [well highly misleading at best]..
Warming is occurring so rapidly compared to baseline variance that it’s hard to do calculate residuals on the regressions directly. Technically you can detrend but only looks at variability around the trend, for example whether the swings are getting wilder. Whenever I look at sea ice or something and notice the baseline includes the entire record I shake my head a bit because their standard deviations are rapidly being pulled down due to the recent exponential decay. In a few years, we might find ourselves back to “normal” from a statistical standpoint!
Modelling about temperature shifts once the PDO shifts back shows such violent and abrupt warming that it will really destroy the ability to make any comparison. Tamino’s analysis was fine, but you can tell it is near the breaking point; he said as much.
LikeLike
robertscribbler
/ February 27, 2014Exactly. The system is pushed into anomaly, and parameters become skewed in that direction. Somehow, you need to establish a base line of what was normal and show the distribution above that base-line (not a sliding scale) to capture the level of extremity.
LikeLike
mikkel
/ February 27, 2014This picture gives a good example of what I’m talking about: http://www.skepticalscience.com/images/Temperature_Interglacials.gif
You could include the entire thing and create a distribution, but it’d be quite meaningless since obviously 0C can either be an extreme heatwave (during the depths of the glacial period) or a “mini ice age” if you’re at the peak of the interglacial.
From an attractor point of view however, the calculation is quite tractable since the cycles are fairly easy to distinguish — and that’s the support for Milankovitch cycles. Similarly, from this same view, anything much about 2C is terrifying because it is outside the bounds of the state limits and generally speaking…when systems are pushed out of boundaries they rapidly and violently jump to a new state. I would not be surprised to see warming on the scale of the glacial to interglacial spike rather quickly.
LikeLike
mikkel
/ February 27, 2014I mean, I wouldn’t see it, I’d be dead. But you get the gist. The way systems behave generally, it’s hard to talk about seeing 3-4C of warming; it could very well be less than 2C or 7-8C at peak. The paleoclimatic evidence that Robbert stays on top of suggests as much. In this graph you can easily see three rough “states” http://en.wikipedia.org/wiki/File:65_Myr_Climate_Change.png
I think we’re headed towards shooting to the middle one and just like the interglacial boundary, will probably shoot up towards it rapidly and then slowly decrease as weathering etc. sucks in CO2. The Ecocene range is unlikely but not even sure people will be around if it did occur.
LikeLike
Timothy Chase
/ February 27, 2014mikkel wrote:
This makes sense to me. Different attractors would have different probability distributions.
Although I think one thing the attractor approach might be missing, at least at this level, is that the phase space for a system of this complexity involves a great many more dimensions than simply temperature. In this case, what makes for the position of the system in its phase space will also be a function of ocean circulation, planetary tilt and eccentricity of orbit, solar output, and atmospheric concentrations of long-lived greenhouse gases, primarily carbon dioxide.
More abstractly, attractors work, but they have to do so within the system’s phase space. One could of course treat these other dimensions as boundary conditions of the system, in much the same way that Charney Climate Sensitivity does with slow feedbacks. But for our purposes, at the very least we would also want to include the atmospheric concentration of carbon dioxide as one of the dimensions of the phase space.
LikeLike
mikkel
/ February 27, 2014Absolutely true. But looking at the attractor as a whole, viewing the temperature still gives insight into boundary conditions like you note.
From my perspective, I’m not so interested in building a predictive model but instead look at it from a control systems standpoint. If you are trying to be predictive then you need to understand all the internal relationships, but from a control systems standpoint then staying within boundary conditions is essential — once it goes outside who knows what will happen.
LikeLike
robertscribbler
/ February 27, 2014I am thinking that attractor should, instead, be called race track. At least for common parlance.
LikeLike
jyyh
/ February 27, 2014Drive-by comment (without reading any other comments), the blocking might be the cause for the increased tradewinds too, if the winds can’t get over N.America they turn north AND south so perhaps when the block dissipates the so called ‘hiatus’ ends as well.
LikeLike
robertscribbler
/ February 27, 2014El Nino is coming…
LikeLike
Greg Smith
/ February 27, 2014I am new here. I know Stu Ostro at the weather channel has an ongoing powerpoint that he has been updating for several years now and it has grown to hundreds of slides that not only documents these extreme and unusual events but adds extra expert meteorological commentary and context. He updates it semi-annually. I’ll try to find a link and post it here later today if one of you doesn’t beat me to it first, thanks.
LikeLike
Greg Smith
/ February 27, 2014The link is
Click to access StuOstro_GWweather_latestupdate.pdf
and the slides are now over 1150 and updated as of Feb 4, 2014. He tells a story at the beginning of his transformation from skeptic to climate hawk as well.
LikeLike
mikkel
/ February 27, 2014Wow that is the most epic power point ever
LikeLike
robertscribbler
/ February 27, 2014Ah, good ol’ Stu. Excellent work that!
LikeLike
Colorado Bob
/ February 27, 2014A much more toxic, fast-producing oceanic algae is replacing the Swan River’s phytoplankton, according to a world-renowned environmental scientist.
Curtin University researcher Dr Jacob John has studied algae in Perth’s river systems for more than 30 years and says a decline in rainfall is pushing sea algae, known as red tide organisms, into the upper reaches of the Swan River.
Dr John says that historically, the river was flushed with fresh water every winter, but a decrease in rainfall has allowed salty conditions to linger longer and higher up in the system. The salt water sits above increasingly nutrient-rich sediment, feeding algae and sparking blooms.
“Over the years in the Swan River we find that the diatoms [algae] are increasingly replaced by another group of algae called dinoflagellates, or red tide organisms,” Dr John says.
“They are the ones that multiply very fast and some of them could be toxic to fish and other organisms.”
Dinoflagellates also produce a powerful neurotoxin, which paralyses the central nervous system of fish, killing them by suffocation. Shellfish can carry the toxin which can poison humans if eaten.
Read more: http://www.watoday.com.au/environment/save-our-swan/more-toxic-sea-algae-invading-swan-river-system-20130920-2u4le.html#ixzz2uVmJo2hO
LikeLike
robertscribbler
/ February 27, 2014They also rapidly consume oxygen…
So we have another link between new weather patterns (extreme drought/ flood) and the provision of nutrients that result in harmful microbe explosions.
LikeLike
xraymike79
/ February 27, 2014The future of the oceans?…
Mass strandings of marine mammals blamed on toxic algae: Clues unearthed in ancient whale graveyard Posted: 25 Feb 2014 04:34 PM PST
Modern whale strandings can be investigated and their causes identified. Events that happened millions of years ago, however, are far harder to analyze — frequently leaving their cause a mystery. Scientists examined a large fossil site in the Atacama Desert of Northern Chile — the first definitive example of repeated mass strandings of marine mammals in the fossil record. It reflected four distinct strandings over time, indicating a repeated and similar cause: toxic algae…
LikeLike
robertscribbler
/ February 27, 2014Finally!!
LikeLike
Colorado Bob
/ February 27, 2014Acidic Waters Kill 10 Million Scallops Off Vancouver
A mass die-off of scallops near Qualicum Beach on Vancouver Island is being linked to the increasingly acidic waters that are threatening marine life and aquatic industries along the West Coast.
Rob Saunders, CEO of Island Scallops, estimates his company has lost three years worth of scallops and $10 million dollars — forcing him to lay off approximately one-third of his staff.
http://thinkprogress.org/climate/2014/02/26/3332141/ocean-acidification-kills-scallops/
LikeLike
Colorado Bob
/ February 27, 2014Lack of rainy days smashes city records
Meanwhile, temperatures have averaged 31.9 degrees Celsius during summer – Perth’s average summer maximum temperature is normally 30.2 degrees.
The persistent hot, dry weather is caused by a lack of cold fronts moving up from the south-west allowing continual high pressure systems to sit over the city for months on end.
“All we have seen is high pressure systems moving in one after the other,” Mr Bennett said.
Read more: http://www.watoday.com.au/wa-news/lack-of-rainy-days-smashes-city-records-20140227-33kls.html#ixzz2uVyd7Yer
LikeLike
robertscribbler
/ February 27, 2014The Hadley Cell is expanding south, crushing the Jet Stream as it moves. So tropical warming can mangle the Jet as well… And here we see droughts or very brief but violent outbursts of rainfall. Seems both Trenberth and Francis are correct depending on hemisphere.
Good to see your posts, sir. IMO, no-one can do research like you.
LikeLike
Tanya
/ February 27, 2014Your blog has been one of the few resources I’ve found to help me understand all this. Mainstream media barely touches this kind of analysis of our current strange weather.
LikeLike
robertscribbler
/ February 27, 2014Oh, they avoid it like the plague.
LikeLike
Colorado Bob
/ February 27, 2014British Storms Unbury an Ancient Welsh Forest
Are the petrified trees of Borth part of the mythical kingdom of Cantre’r Gwaelod?
http://news.nationalgeographic.com/news/2014/02/140226-wales-borth-bronze-age-forest-legend/?google_editors_picks=true
LikeLike
Colorado Bob
/ February 27, 2014This Will Shatter Your View of Apex Predators: How Wolves Change Rivers
LikeLike
Colorado Bob
/ February 27, 2014A spokesman for the Met Office says it has been the wettest winter on record across England and Wales – where the precipitation records date back to 1766.
Some 435mm (17.1 inches) of rain fell from December 1 to February 24, beating the previous highest total of 423mm (16.6 inches) set in 1915.
http://www.itv.com/news/update/2014-02-27/met-office-outlines-record-winter-rainfall/
LikeLike
Colorado Bob
/ February 28, 201421,000 Birds Killed In France By Winter Storms
France has not seen a bird “slaughter” this large since 1900, the Agence France-Presse reports.
http://www.weather.com/news/science/nature/storms-dead-birds-france-20140227
LikeLike
robertscribbler
/ February 28, 2014Saw this. Pretty sad to see so many go.
LikeLike
Colorado Bob
/ February 28, 2014Untold numbers of everything gone, I cannot image how creatures that over winter in the earth have fared.
LikeLike
robertscribbler
/ February 28, 2014Hopefully they made it to higher ground. We should have prevented this.
LikeLike
Colorado Bob
/ February 28, 2014The submerged forest at Borth was not the only ancient site to have been uncovered by recent storms. Another submerged forest appeared at Mount’s Bay, Cornwall. An ichthyosaur skeleton was discovered on the Jurassic Coast of Dorset and East Devon. At Happisburgh, Norfolk, footprints discovered in storm-exposed rocks are believed to be the earliest evidence of humans outside Africa, dating back 850,000 years. (See “Oldest Human Footprints Found Outside of Africa.”)
THIS WINTER’S storms and floods have brought a rise in the number of unexploded bombs tackled by disposal experts.
Six devices have been made safe by teams in as many weeks in the South West and West Wales, which bore the brunt of the bad weather.
http://www.plymouthherald.co.uk/Warning-storms-floods-expose-bombs-near-Plymouth/story-20685842-detail/story.html
Meanwhile vessels in the English Channel have been warned to watch out for empty shipping containers washed from the Danish-owned Svendborg Maersk cargo ship during the Valentine Day’s storm.
About 520 containers were lost and Falmouth Coastguard said: ‘There are a lot and they’re a hazard. The owners are trying to recover what they can.’
LikeLike
robertscribbler
/ February 28, 2014Strange and amazing, Bob. We’ve uncovered a new world in more ways than one.
LikeLike
Colorado Bob
/ February 28, 2014Speaking of strange and amazing –
St. Vincent – Digital Witness
Tell me I’m not still hip.
LikeLike
robertscribbler
/ February 28, 2014Very strange. But pretty damn cool.
LikeLike
Colorado Bob
/ February 28, 2014Now we all jump off the edge of the world. Everybody hold hands , it’s a long way down.
LikeLike
Colorado Bob
/ February 28, 2014Off to watch the Vikings
LikeLike
robertscribbler
/ February 28, 2014It’s fantastic. Hope you enjoy it as much as I did.
LikeLike
Colorado Bob
/ February 28, 2014This makes “Roots”, “Mad Men” , and ” Breaking Bad ” freshmen efforts. The writing is amazing,
LikeLike
robertscribbler
/ February 28, 2014It is. A high effort in the art of truth telling. Life was torturous, brutal, and short. They pull no punches.
LikeLike
Colorado Bob
/ February 28, 2014The 12 man jury was invented by those pagan Vikings. Not those jack-asses from the bible.
LikeLike
Colorado Bob
/ February 28, 2014The best part, season #2 starts in 796 . There’s a hell of lot of history to come.
We’re all in Ragnor’s ship.
LikeLike
robertscribbler
/ February 28, 2014Ah, what a mess.
LikeLike