
A polar vortex smashed by warm winds from the North Atlantic and a bomb cyclone in Baffin Bay drove cold air and howling 127 mph hurricane gusts over Mt Washington to generate a record -108 F wind chill.
All posts tagged warm winds
Arctic Warming Pumped up by Bomb Cyclone Nor’Easter Spurs -108 F Wind Chill

Posted by robertscribbler on February 4, 2023
https://robertscribbler.wordpress.com/2023/02/04/arctic-warming-pumped-up-by-bomb-cyclone-noreaster-spurs-108-f-wind-chill/
Seven Inches of Snow Dumped on Northeast as Another Major Arctic Warm-Up is Underway
As an April snowstorm strikes the U.S. Northeast, major global weather stories related to climate change are unfolding in real time. For today, we again find that none of the key climate zones feature below average temperatures even as a ten-day-long Arctic warm spell appears to be on tap.
Very Warm Arctic in Early April

(Another big Arctic warm-up drives cold air southward. The result is snow over the U.S. Northeast even as parts of the Arctic Ocean are experiencing an early thaw. Image source: Climate Reanalyzer.)
Warm winds driving northward over eastern Siberia, on the back side of a high pressure ridge, are delivering yet one more big dose of near or above freezing temperatures to this Arctic region. From the Chukchi Sea through the Bering Strait and on into East Siberia, temperatures range from 10 to 22 degrees Celsius above average. The Bering itself has been mostly swept clean of sea ice — with severe record low ice extent readings for this zone during early April.
Throughout winter, the Bering and Chukchi have received wave after wave of much warmer than normal air from the ocean zone to the south. This tendency for warm air propagating northward through the Pacific is one that is often triggered by La Nina — a periodic pattern of Pacific Equatorial surface water cooling that became a dominant feature of 2018 winter weather. However, globally warmer than normal ocean waters and, in particular, much warmer than normal sea surface temperatures in the Northeastern Pacific appear to have greatly enhanced the heat influx.

(Much warmer than normal sea surface temperatures in the Northeastern Pacific this year have provided a pathway for warm air to invade the Arctic. Meanwhile, La Nina and Polar Amplification generate a combined influence that weakens the Jet Stream and facilitates atmospheric ridges in this zone. Image source: Earth Nullschool.)
These warm waters at the middle to northern latitudes have developed a pathway that enhances the northward flow of tropical air masses over the Pacific Ocean. Meanwhile La Nina’s Equatorial cooling combines with climate change’s amplified polar warming to slow down the Jet Stream — further enabling this south-to-north heat transfer. As we have seen time and time again, human-forced global warming generated chiefly by fossil fuel burning is developing an atmospheric and oceanic handshake with past understood synoptic trends to produce an out-sized Arctic warming.
Bering Sea Almost Completely Cleared of Ice
This severe warming is plainly visible as open water is driven by outlandish temperatures well north and through the Bering Strait during early April. A time when ocean ice typically extends more than 150 miles south of Ninivak — bridging the water zone from Bristol Bay to the Kamchatka Peninsula.

(The Bering Sea is typically ice-choked during April. And during a normal year all the water zones in the above image would be covered with ice. But this spring, sea ice extent there is at never-before-seen record low levels. Image source: NASA Worldview.)
The impact is quite dramatic. During February, Bering Sea Ice hit 100,000 square kilometers below previous record lows for the Month. These record low extents continued throughout March and into early April when, today, we find that Bering sea ice extent is between 150,000 to 200,000 square kilometers below the previous record lows for the day and about half a million square kilometers below the seasonal average.
Putting this loss into context, half a million square kilometers is a region that splits the difference in size between the land mass area of California and Texas.
According to GFS model runs, the present Bering-East Siberia warm spell should last for another 2-3 days even as larger Arctic warming in the range of 2.4 to 3.2 degrees Celsius above average for the entire 66 North Latitude zone and on poleward is expected to continue through the ten day horizon. These warmer than normal temperatures should retard typical seasonal sea ice thickening in the far northern regions even as edge ice zones like those in the Bering, Baffin Bay, and the Sea of Okhotsk experience early spring melt and erosion.
New England Spring Snow
As warm air invades the Arctic — a feature that has become more and more prevalent as the globe itself has heated up — it tends to drive cold air southward over the North American, Asian, and European Continents. In this case, the warm air invasion coming from the Siberian side is displacing Arctic air over North America. As a result, and much to the delight of myth-enraptured climate change deniers everywhere, we have been treated to a rare, if not unheard of, spring April snowstorm in New England.

(Increasingly, there have been indications that polar warming related to global warming is influencing storm tracks and ridge and trough patterns in the Northern Hemisphere Jet Stream. The result is a stronger influence on Mid-Latitude Northern Hemisphere weather. Image source: Arctic Change and Possible Influence on Mid-Latitude Climate and Weather.)
According to local weather reports, as much as 7 inches of snow were dumped in intense 2-inch-per-hour bursts over parts of New England last night as a brief but intense storm roared through the region. The cold air, driven south by the recent warm polar air invasion, encountered high atmospheric moisture levels bleeding off a much warmer than normal Gulf Stream lurking just off-shore. The result, as has been the case during recent intense rain and snowstorms, was enhanced convection. This greater atmospheric uplift, in turn, produced an out-sized spring precipitation event. With below freezing temperatures driven far to the south by warm air entering the Arctic, the Northeast saw its first significant April snow event since 1982.
An April 6th to 7th Snowstorm for the U.S. South on the Way?
Further fodder for the climate change denial community supported by the anti-information campaigns of Fox News and others, may emerge by next weekend as another big push of cold air could help to develop a snow and ice storm stretching from Oklahoma through the Carolinas. Cold air driven out of the Arctic and southward over the Eastern and Central U.S. could result in 10 to 18 degree Celsius below average temperatures in that region. Moisture bleeding off the much warmer than normal Gulf of Mexico and Atlantic Ocean could be injected into this cold trough as a related storm develops. The result is a potentially unusual snow and ice storm. And an intense event off this kind, should it develop, would be a very odd weather event during U.S. spring-time.

(Another odd spring U.S. Snowstorm may be on the way for April 6th and 7th according to GFS model forecasts. Image source: Tropical Tidbits.)
Meanwhile, the U.S. tendency in the model forecasts is for warmer than normal temperatures in the West, cooler than normal temperatures in the East through the middle of April. It’s worth noting that the forecast also shows highly variable temperatures with strong swings between warm and cold throughout this period for most U.S. regions. As a result, as the Arctic remains much warmer than normal over the next ten days, the U.S. is likely to experience periods of both extreme warmth and extreme cold relative to climatological averages for this time of year.
Final Points — Intense U.S. Spring Snowfall Events a Likely Upshot of Polar Warming
Putting all these dynamics into context, we can sum up by making the following statements:
- April snow and even April blizzards are not unheard of for the U.S. East. That said, the recent events are odd and outside the context of regular U.S. weather patterns — particularly when it comes to precipitation intensity.
- Arctic warming and loss of regional sea ice, such as that seen in the Bering, is historically unprecedented during 2018. This is a continuation of an observed trend of polar amplification and severe warming seen during recent years.
- No major global climate zones show below normal temperatures on April 2, 2018. That said, a high variance in middle latitude northern hemisphere temperatures presently exists — with regions of intense cool and intense warmth interspersed.
- Snowstorms in the U.S. Northeast during April do not disprove global warming or a related shift to increasing climate extremes. In fact, they appear to be an aspect of it.
Share this:

Posted by robertscribbler on April 2, 2018
https://robertscribbler.wordpress.com/2018/04/02/seven-inches-of-snow-dumped-on-northeast-as-another-major-arctic-warm-up-is-underway/
Arctic Sea Ice Melt Analysis: The Concerning Development of a Beaufort Warm Pool During Late June
During 2016-2017, the Arctic sea ice, overall, has been hammered by far warmer than normal temperatures. The result has been continued record low Arctic sea ice volume and record low or near record low extent throughout the present period stretching from October of 2016 to late June of 2017. Now, the development of a pool of warm water in the Beaufort Sea even as a strengthening ridge is poised to inject more heat into this key region threatens to increase sea ice melt pressure as we enter mid-summer.

(Far warmer than normal conditions greatly impacted Northern Hemisphere sea ice during 2016 and 2017. Due to this heat spike, the sea ice is presently far more susceptible to summer melt pressure. Image source: NASA GISS.)
Counter-Trend Cooling in May — But Sea Ice Still in Record Low Ranges
Cooler than normal temperatures in the High Arctic during May and near average temperatures over the Arctic Ocean during June resulted in somewhat less less late spring and early summer melt than some had feared.
This counter-trend cooling has set up conditions where sea ice measures in both volume and extent have bounced closer to the 2012 line with PIOMAS departures remaining in record low ranges and JAXA and NSIDC extent measures tracking near second or third lowest on record.
(Region of interest for Beaufort warm pool development and predicted warm air injection over the coming days. The above graphic by Zack Labe compares present Beaufort and CAA conditions with those of last year when melt in the region was rapidly progressing.)
But despite a brief May respite from the most extreme heat of human-forced climate change, the Arctic sea ice remains very fragile and any added warmth at this time from either the ocean, the atmosphere or both can have an out-sized impact on end melt season totals.
Beaufort Warm Pool Development
Moving into Arctic mid-summer, primary factors of concern include both land and ocean surface temperatures as well as the potential development of various weather features harmful to sea ice. Trough development on the Russian side with ridge development over the Beaufort region is generally viewed as harmful — forming warm surface waters that can considerably erode old ice in the Beaufort and near the Canadian Archipelago, while generating a dipole temperature and pressure feature that produces winds which tend to enhance sea ice export through the Fram Strait.

(Warm surface water pool development in the Beaufort and Chukchi seas represents a melt hazard to sea ice if it continues to grow and gather heat. Hot spots currently forming in the Beaufort at 5 C above average in the DMI measure is therefore cause for some concern. The predicted development of a strong high pressure ridge injecting much warmer than usual temperatures into the region will tend to feed energy into these already-warm surface waters. Image source: DMI.)
Throughout June, this form of dipole has tended to emerge — with weak highs forming consistently over the Beaufort and with moderate-to-strong lows gathering on the Russian side centering on the Laptev Sea, but ranging into the Kara, East Siberian Sea, and on into the Central Arctic. This persistent dipole has also aided in the production of warm surface waters in both the Beaufort Sea and in the Chukchi. Sea surface temperatures in this region have already formed into a considerable warm pool with anomalies ranging from 2-5 degrees Celsius above average over an expanding region.
Predicted Injection of Warm Air of the Beaufort
During the coming days, a ridge extending over Northern Canada is predicted to drag a surge of warm air across both the Canadian Archipelago and the Beaufort Sea. Over-ocean temperatures in the Beaufort are expected to considerably vary above the norm — hitting as high as 48.6 degrees Fahrenheit (9.2 C) in some regions. An over-ocean value that is around 7-9 C above average for this time of year.

(Ridge development is expected to inject much warmer than normal temperatures over the already warm Beaufort Sea by July 2nd. This predicted event presents increasing risks of sea ice melt for a key Arctic region. Image source: Earth Nullschool.)
Since oceans tend to moderate both summer heat and winter cold, these are considerable local extremes. And in conjunction with a developing warm pool of ocean surface waters, such above average atmospheric readings represent a melt hazard to sea ice in the critical Beaufort basin and in adjacent regions. Ice in the Canadian Archipelago will also come under melt stress in the event that such a forecast trend develops. Meanwhile, the greatly reduced subset of multi-year ice floating just to the north of the Archipelago will also be subject to the warm air injected by the ridge as well as to the warming of nearby surface waters.
Risks Worth Monitoring
During 2012, the persistent development of a warm water pool in the Beaufort contributed to record low sea ice readings by late summer. This warm pool ate away at the ice edge, wrecking the multi-year ice even as it was eventually thrust into the Central Arctic by a powerful storm emerging over the East Siberian Sea during August. Similar warm pool formation at this time and continuing through July is cause for some concern, which is why a nascent warm pool development during late June is worth continued monitoring.
Links:
Hat tip to Zack Labe
Hat tip to Greg
Hat tip to Wili
Share this:

Posted by robertscribbler on June 28, 2017
https://robertscribbler.wordpress.com/2017/06/28/arctic-sea-ice-melt-analysis-the-concerning-development-of-a-beaufort-warm-pool-during-late-june/
The Rains of Antarctica are Coming — Warm Summer Storms Melted Texas-Sized Section of Ross Ice Shelf Surface During 2016
“In West Antarctica, we have a tug-of-war going on between the influence of El Niños and the westerly winds, and it looks like the El Niños are winning. It’s a pattern that is emerging. And because we expect stronger, more frequent El Niños in the future with a warming climate, we can expect more major surface melt events in West Antarctica (emphasis added).” — David Bromwhich, co-author of a recent study identifying massive summer surface melt in West Antarctica during 2016.
******
If you’re concerned about human-caused global warming, then you should also be concerned about ice. In particular — how warming might melt a miles-high pile of the frozen stuff covering the massive continent of Antarctica.
During recent years, scientists have become more and more worried as they’ve observed warming oceans eating away at the undersides of floating ice sheets. This particular process threatens numerous cities and coastal regions with swiftening sea level rise as ice margins melt and glaciers the size of mountain ranges clamor for release into the world’s oceans.
Major Antarctic Surface Melt Event During 2016
But another potential process in a still warmer world threatens to compound the impact of the heating waters that are already melting so many of the world’s glaciers from the bottom up — large scale surface melt.

(A major warming event during January of 2016 turned a Texas-sized section of Antarctica’s surface into slush. This occurred as a storm running in from the Southern Ocean delivered warm air and rainfall to sections of West Antarctica. Scientists are concerned that more major surface melt is on the way for Antarctica as the Earth’s climate heats up and that repeated warming and rainfall events in this typically-frozen region may further quicken rates of sea level rise. Image source: Earth Nullschool.)
During January of 2016, as a very strong El Nino was combining with human-caused global warming to spike atmospheric temperatures to 1.2 C above 1880s levels, something pretty strange and concerning happened. Over the course of about 15 days, a 300,000 square mile section of the Ross Ice Shelf surface and nearby lands over West Antarctica experienced melting. This mass slushing across Antarctica’s surface occurred as a warm storm swept in from the Southern Ocean (see image above) to deliver an unheard of rainfall event to the region.
West Antarctica is typically too cold for such weather. It is also often too dry. The region is well know by climate researchers as a frozen desert. But as human-forced climate change has warmed the nearby ocean, warm, moist winds blowing in from these heating waters have become more frequent.
Westerlies Interrupted by Warming Ocean
Antarctica is typically protected by strong westerly winds that keep both heat and moisture out. But a warming ocean environment, according to Ohio State researchers, is enabling El Nino to interrupt these westerlies and hurl increasing volumes of heat and moisture over the glaciers of Antarctica. In 2016, countervailing winds pushing against the typically prevailing westerlies bore with them an odd rainstorm that set off a massive surface melt event.

(Surface melt over a large section of West Antarctica lasted for as much as 15 days as heat and moisture from the surrounding ocean beat back a protective barrier of westerly winds and invaded the frozen continent. According to scientists, these events are likely to become more frequent and long-lasting as the climate warms. Image source: Ohio State University.)
When combined with already-active melt from ocean warming, surface melt could further serve to destabilize ice sheets and swiften sea level rise. This was exactly the concern that David Bromwich, an Antarctic researcher at Ohio State and co-author of the paper that identified this strange event highlighted in this statement (please see related Washington Post article here):
“It provides us with a possible glimpse of the future. You probably have read these analyses of West Antarctica, many people think it’s slowly disintegrating right now, and it’s mostly thought to be from the warm water eating away at the bottom of critical ice shelves. Well, that’s today. In the future, we could see action at the surface of these ice shelves as well from surface melting. So that makes them potentially much more unstable (emphasis added).”
It’s worth noting that this particular storm, though unusual and noteworthy, did not produce too much in the way of surface melt ponding. Instead, the storm turned a large section of the Antarctic surface to a slurpee-like slush. But this event did deliver a considerable amount of heat to the Ross Ice Shelf region. And repeated instances could serve to seriously soften this massive ice formation.
Eventually, as warming worsens, significant surface melt and flooding could help to shatter large buttressing ice shelves like Ross or even generate risks of surface glacial outburst flooding in instances where permanent surface melt lakes form behind an ice dam. But the primary concern at this time is that these warm rain events provide a compounding melt influence that adds to risks for more rapid sea level rise this Century.
Links:
Widespread Snowmelt in Antarctica During Unusually Warm Summer
Scientists Stunned by Antarctic Rainfall and Melt Area Bigger Than Texas
Scientists Report Large Scale Surface Melting Event in Antarctica During 2015-2016 El Nino
Hat tip to TodaysGuestIs
Share this:

Posted by robertscribbler on June 15, 2017
https://robertscribbler.wordpress.com/2017/06/15/the-rains-of-antarctica-are-coming-warm-summer-storms-melted-texas-sized-section-of-ross-ice-shelf-surface-during-2016/
Under the Arctic Dome — Brutish High Pressure System is Wrecking the Already Thinned Sea Ice
There’s a real atmospheric brute towering over the Arctic’s Beaufort Sea at this time. A high pressure system that would put shame to most other anti-cyclonic phenomena that bear the name. It is sending out a broad, clockwise pattern of winds. It is pulling up warm air from the Pacific to invade the Bering, Chukchi, East Siberian and Laptev Seas. And its torquing motion is shattering the already considerably thinned ice beneath it.

(A powerful high pressure system over the Beaufort Sea is predicted to further strengthen by late April 15. Image source: Earth Nullschool.)
Clocking in at 1046 mb of pressure, it makes typically strong 1030 mb high pressure systems seem weak by comparison. Over the next day it is expected to strengthen still — hitting 1048 mb by late April 15th (coming very close to an extraordinary 1050 mb system).
Shattered Sea Ice
This powerful and strengthening system has already been in place for about two weeks — slowly gaining momentum as its circulation has moved in mirror to the waters of the Beaufort Gyre that swirl beneath it. Masked only by a veil of sea ice considerably thinned by human-forced climate change, the waters of the Beaufort are now breaking through. Streaks of dark blue on white in an early break-up enabled both by a terrible Arctic warming and by this powerful spring weather system.


(Side-by-side images of Beaufort sea ice from April 4 [left frame] to April 13 [right frame]. Note the considerable and rapid advance of fracturing in a relatively short period. For reference, bottom edge of frame in both images is 500 miles. Image source: LANCE MODIS.)
Warm Storms
On the Siberian side of the Arctic, this massive high pressure dome is drawing in warm winds from the Pacific Ocean. Gust by gust and front by front, they come in the form of squalls that deliver above freezing temperatures and rains that blanket this thawing section of the Arctic. On Thursday, April 13, these warm winds had driven northward over 2,500 miles of Pacific waters to be drawn into storms that unleashed their fury — driving rains and gales through the already dispersed ice in the Bering Sea and shattering ice floes through the Chukchi. Today, April 14, these winds and rains drove northward to assault the ice of the East Siberian and Laptev seas.

(On April 13, above freezing temperatures, rains, and gale force winds ripped through the sea ice near Wrangle Island in the Chukchi Sea. Image source: Earth Nullschool.)
A Great Atmospheric Stack Drawing Heat into the Arctic
In the past, meteorologists like Stu Ostro envisioned that climate change would tend to produce towering high pressure systems — featuring increasingly strong storms roaring about their fierce outer boundaries. And the massive high lurking over the Arctic at this time is a good example of Ostro’s predictions coming to light in a region that is very sensitive to human-forced warming.
This great atmospheric stack appears to have had a considerable impact on the ice already — helping to push extent measures back into record low ranges by accelerating the melt trend. But these impacts are likely to spike over the coming week as this powerful high expected to remain in place through the next five days — continuing to draw warm air into the region. 
(Global Forecast System models predict extreme warming over the Arctic Ocean throughout the next week resulting from the influence of a powerful high pressure system and very strong associated ridge in the Jet Stream. Image source: NCEP Global Forecast System Reanalysis.)
GFS model runs indicate that average temperatures over the Arctic Ocean region will hit a peak as high as 4 degrees Celsius above average by late next week. Meanwhile, the warmest zones are expected to be as much as 18-20 degrees Celsius above average. Such abnormal warmth at this time of year, if it emerges, will put a considerable damper on a freeze that should now be continuing in the High Arctic even as edge melt ramps up with the progression of spring.
This is particularly concerning due to the fact that temperature anomalies in the Arctic tend to fall off during spring and summer. In other words, such a powerful warming trend for the Arctic Ocean would be bad enough during winter — but it is an even more unusual event for spring. An ominous start to a melt season that could produce far-reaching regional and global consequences.
Links:
NCEP Global Forecast System Reanalysis
Hat tip to Colorado Bob
Hat tip to Andy in San Diego
Share this:

Posted by robertscribbler on April 14, 2017
https://robertscribbler.wordpress.com/2017/04/14/under-the-arctic-dome-brutish-high-pressure-system-is-wrecking-the-already-thinned-sea-ice/
Warm, Southerly Winds Gust to Hurricane Force Over Greenland in Staggering Early Season Heatwave — Temperatures Now Hitting up to 41 Degrees (F) Above Average at Summit
The wavy, crazy Jet Stream.
Over the past few years, it’s become more and more clear that a human-forced heating of the Arctic has basically driven the Jet Stream mad. Big loops, omega blocks, and huge ridges and troughs have all become a feature of the new climate we’re experiencing. Related to these features have been a number of superstorms, severe droughts, ocean hot and cold pools, and extreme rainfall events.

(The Jet Stream once again mangled. A strong trough shoved cool air over the US East Coast this weekend as a facing ridge prepared to hurl a bulge of extreme warmth up and over Greenland on Monday. Image source: Earth Nullschool.)
As we have seen with Sandy, the Pacific Hot Blob, the UK floods, The California Drought, the record Alaska and Canadian Wildfire Seasons of 2015, the Russian Heatwave and Fires of 2011, the Pakistan Floods of 2011, and so, so many more extreme weather events, these new climate features present a risk of generating extraordinary or never before seen weather. Intense storms, extreme winds, and extreme cold flashes and heatwaves can all be generated as the result of such mangled weather patterns. And for much of the North Atlantic this past weekend, such abnormal conditions dominated. The US East Coast experienced a freak cold flash, the UK was pummeled by yet one more unseasonable gale, but perhaps worst of all — a head of extraordinarily warm air roared northward, riding upon gale to hurricane force winds, setting sights on Greenland.
Cool Flash for Eastern US, Extreme Heat for Greenland
This past weekend, the US weather news was all awash with comments on Winter-like conditions in April for the Northeast and Mid-Atlantic US as a deep trough tore down from the Canadian Archipelago and Hudson Bay. The trough brought with it snow flurries, freeze warnings, and rather cold conditions for April to this region of the US. Temperatures ranged from 10-20 degrees (F) below average for this area. But compared to what was setting up to happen in the ridge zone over the Atlantic, the East Coast cool spell was quite mild considering the relative extreme heat readying for a Greenland invasion.
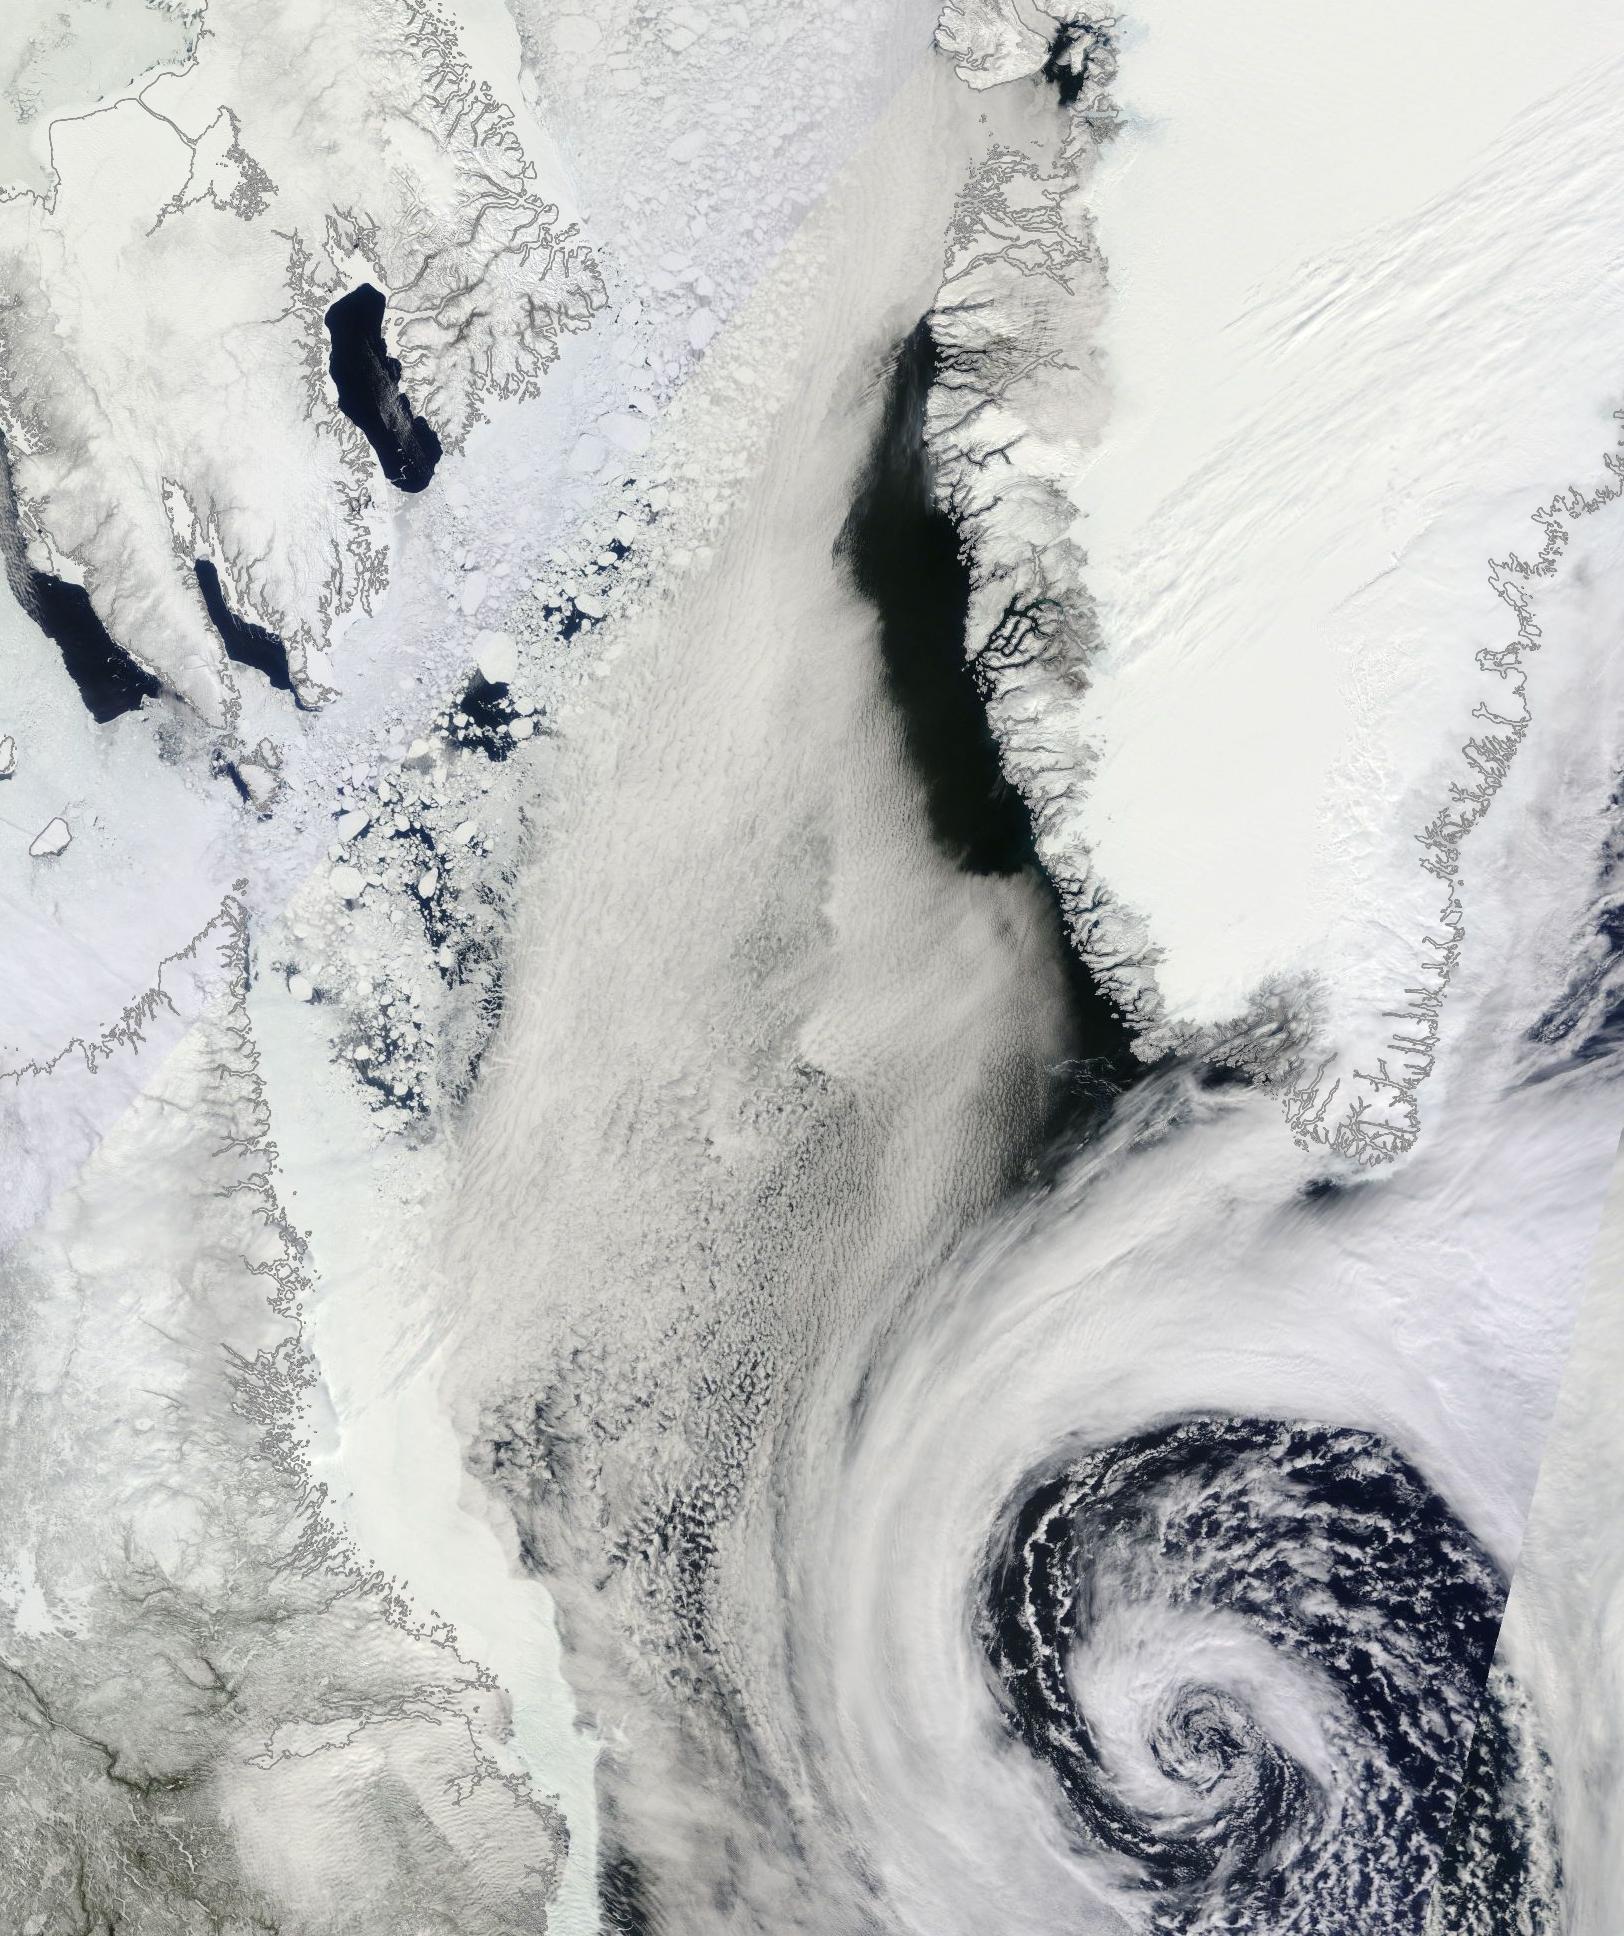
The warm wind pulse began in the North Atlantic in a tropical region near 26 North, 55 West. This warm air flooded in train over thousands of miles of open ocean. Running northward, it roared along the back of a high pressure system centered over the Mid Atlantic Ridge and in front of two strong lows — one centered near Newfoundland and a second over southwestern Baffin Bay.
In places, the pressure gradient between the lows and highs was so tightly packed that the northward flowing airs hit hurricane force. Off the southwest tip of Greenland, winds consistently achieved hurricane force gusts. And these winds flowed on northward, bringing with them a surge of above freezing temperatures to much of Baffin Bay and a large section of Western Greenland.
By 10:00 UTC, Monday, April 11th — Thule, on the Northwest Coast of Greenland near the Nares Strait was experiencing sustained southerly winds along the northern edge of this warm air pulse at 45 mph with gusts hitting a hurricane force 75 mph. Temperatures for Thule by that time had hit 34 degrees (F) or about 32 degrees (F ) above average.

(Extreme Arctic heat strikes Greenland on April 11, 2016. There readings for a large area hit a range 36 degrees Fahrenheit or more above average for a large region over Baffin Bay and Greenland. This extreme pulse of unseasonable warm air contributed to overall temperature departures of +4.75 C (8.55 F) above average for the Arctic. A very high departure for this region of the world at this time of year and an extension to a period of record Arctic warmth in 2016. Image source: Climate Reanalyzer.)
Further south, Nuuk was experiencing 45 F readings (or about 20 F above average) coordinate with heavy rain and strong southerly winds. Yet further south, in Kangerlussuaq near the southwest coast of Greenland, temperatures spiked to 61 F — or 36 F above the average April 11 reading of 25 F.
Perhaps more remarkable and disturbing were the predicted extreme readings at Summit Greenland — expected to hit 21 degrees Fahrenheit on Monday or about 41 degrees (F) above a typical daily high of -20 (F) for this time of year. It’s worth noting that in July average high temperatures for Summit Greenland usually range near 12 degrees (F). So current expected highs for April 11, 2016 are nearly 10 degrees warmer than a normal July day. By comparison, if such an extreme high temperature departure were to have occurred in my hometown of Gaithersburg, MD on the same date (April 11th), readings would have exceeded a remarkable 106 Degrees Fahrenheit.
Year of Record Arctic Warmth Continues
The recent warm, wet wind outbreak over Greenland is but one more odd event in a year of extreme warmth for the Arctic. Warm wind invasions over the North Atlantic, Barents, Baffin Bay, Greenland Sea, Western Europe, Alaska, Western Canada, the Barents, and sections of Central Asia have been a persistent feature throughout both Winter and Spring. Meanwhile, consistent temperature spikes to near freezing or above freezing over the Arctic Ocean and related waters have contributed to Arctic sea ice hitting new seasonal lows.

(Arctic heat has been literally off-the charts for the region above 80 degrees North during 2016. This area has now experienced nearly 1,000 fewer freezing degree days than during a typical year of the already warmer than normal 1980-2010 period. Extreme Arctic warmth of this kind has negative impacts both to the health of Arctic sea ice and to that of the various glacier systems in Greenland, Svalbard and Northern Canada. Image source: NOAA/CFSv2/CFSR.)
Overall, the Arctic has experienced unprecedented warmth for 2016. In reference to this fact, NOAA measures recording freezing degree days indicate that both the Arctic and the High Arctic above 80 degrees North Latitude are experiencing their warmest year ever recorded. These new extreme high temperatures are achieving an extraordinary departure above previous temperature measures and are a feature of the highest anomalies occurring over any portion of a record warm world. In other words, if you were to look for the region of the world that’s being hit hardest by a human-forced warming spurred on by rampant fossil fuel burning, the Arctic would light up like a fireworks display on the 4th of July.
Tropical heat, in the form of a record El Nino generated warmth, has tended to transfer pole-ward in the Northern Hemisphere during 2016 due to various weaknesses in the Jet Stream. A primary region for this transfer has occurred over the North Atlantic and Europe with secondary transfer zones over the Eastern Pacific, Western North America, and over a shifting zone throughout Northern Asia.
An extraordinary polar amplification of this kind — one that includes Equator-to-Pole heat transfers — risks hitting or increasing the intensity of a number of harmful climate tipping points. These include the amplifying feedbacks of increasing rates of sea ice melt and Arctic carbon store response. In addition, extreme warmth over Greenland risks further glacial destabilization, increasing rates of sea level rise, and increasing weather instability in the North Atlantic.
Links:
Thule Air Base Weather Statistics
Thule Air Base Current Weather Conditions
Kangerlussuaq Average Temperatures
Hat Tip to Kevin Jones
Scientific Hat Tip to Dr. James Hansen
Scientific Hat Tip to Dr. Jennifer Francis
Scientific Hat Tip to Dr. Jeff Masters
Share this:

Posted by robertscribbler on April 11, 2016
https://robertscribbler.wordpress.com/2016/04/11/warm-southerly-winds-gust-at-hurricane-force-over-greenland-in-staggering-early-season-heatwave-temperatures-now-hitting-up-to-41-degrees-f-above-average-at-summit/
Warm Arctic Storm To Hurl Hurricane Force Winds at UK and Iceland, Push Temps to 36-72+ Degrees (F) Above Normal at North Pole
We’ve probably never seen weather like what’s being predicted for a vast region stretching from the North Atlantic to the North Pole and on into the broader Arctic this coming week. But it’s all in the forecast — an Icelandic low that’s stronger than most hurricanes featuring a wind field stretching over hundreds and hundreds of miles. One that taps warm tropical air and hurls it all the way to the North Pole and beyond during Winter time. And it all just reeks of a human-forced warming of the Earth’s climate…
Freak North Atlantic Storm Featuring Extremely Low Pressures
Sunday afternoon, a powerful, hurricane force low pressure system was in the process of rounding the southern tip of Greenland. This burly 960 mb beast roared out of an increasingly unstable Baffin Bay on Christmas. As it rounded Greenland and entered the North Atlantic, it pulled behind it a thousand-mile-wide gale force wind field even as it lashed the tip of Greenland with Hurricane force gusts. To its east, the storm now links with three other lows. Lows that are, even now, drawing south-to-north winds up from a region just west of Gibraltar, on past the UK, up beyond Iceland, over Svalbard, and into the Arctic Ocean itself.

(GFS forecasts predict a storm bombing out between 920 and 930 mb over Iceland by Wednesday. It’s a storm that could rival some of the strongest such systems ever recorded for the North Atlantic. But this storm’s influence is unique in its potential to shove an unprecedented amount of warm air into the Arctic. A warm storm for the Arctic Winter time. Image source: Earth Nullschool.)
Over the next few days these three lows are predicted to combine into a storm the likes of which the far North Atlantic rarely ever sees. This storm is expected to center over Iceland. But it will have far-reaching impacts ranging from the UK and on north to the pole itself. As the lows combine, GFS predicts them to bomb out into an unprecedentedly deep low featuring 920 to 930 mb (and possibly lower) minimum central pressures by this coming Wednesday. These pressures are comparable to the very extreme storm systems that raged through the North Atlantic during the Winter of 2013. Systems that featured minimum pressures in the range of 928 to 930 mb.
It’s worth noting that the lowest pressure ever recorded for the North Atlantic occurred in the much further southward forming Hurricane Wilma at 882 mb. In the far north, a January 11 1993 storm between Iceland and Scotland featured 913-915 mb pressures. It’s also worth considering that the GFS model currently puts the predicted storm within striking distance of setting a new record for the far north. Meanwhile, ECMWF models predict a somewhat less extreme low in the range of 940 mb (updated: ECMWF now predicts a 920 mb class storm). By comparison, Hurricane Sandy bottomed out at around 940 mb as well.
Regardless of peak strength, the expected storm is predicted to be both very intense and wide-ranging as both model forecasts feature numerous lows linked in chain with a much deeper storm center near Iceland. Among these and further north, two more strong lows in the range of 965 to 975 mb will round out this daisy chain of what is now shaping up to be a truly extreme storm system. The Icelandic coast and near off-shore regions are expected to see heavy precipitation hurled over the island by 90 to 100 mile per hour or stronger winds raging out of 35-40 foot seas. Meanwhile, the UK will find itself in the grips of an extraordinarily strong southerly gale running over the backs of 30 foot swells.
Warm Winds to Force Above Freezing Temperatures For the North Pole

(By early Wednesday, temperatures at the North Pole are expected to exceed 1 degree Celsius readings. Such temperatures are in the range of more than 40 degrees Celsius (72 degrees Fahrenheit) above average. Image source: Earth Nullschool.)
All along the eastern side of this storm, powerful warm winds are expected to funnel northward. Originating along the 35 degree North Latitude line west of Spain, these winds will force a train of warm air and moisture pole-ward ahead of our storm. The winds will rush up over a very riled North Sea, they will howl into a far warmer than normal Barents, and they will roar on past Svalbard — finally turning as they pass beyond the North Pole.
These winds will bring with them extraordinarily warm temperatures for the High Arctic region during Winter time. By Wednesday, the North Pole is expected to see temperatures in the range of 1-2 degrees Celsius or 41-42 degrees C above Woods Hole and NASA baseline Winter-time temperatures (73-75 degrees Fahrenheit above the normal daily temperature of -40 F for a typical Winter day). Such an extreme departure would be like seeing a 120 degree (Fahrenheit) December day in my hometown of Gaithersburg, MD.
NCAR and reanalysis data for the North Pole at this time of year put daily averages in the range of -30 C (-22 F) and -20 C (-4 F) respectively. Taking all these measures into account, it appears that we’ll be seeing temperatures in the range of 36-72 degrees above normal North Pole readings for late December, depending on which baseline you use.
By any yardstick, these are extremely warm and likely record readings for the North Pole. Winter Temperatures have only approached the freezing mark on one previous occasion in the NCAR data record. And the predicted temperatures for Wednesday appear set to surpass this odd record. Needless to say, a 1-2 C reading at the North Pole during late December is about as odd as witnessing Hell freezing over. But, in this case, the latest wave of warmth issuing from a human-driven shift toward climatological hell appears to be on schedule to arrive at the North Pole by Wednesday.
From Slate on Tuesday, December 29:
“I contacted a team of climate scientists at the University of Washington who maintain a fleet of weather monitoring equipment near the North Pole. James Morison, the principal investigator of the North Pole Environmental Observatory, said he’s “never heard of” temperatures above freezing in the wintertime there. Looking closer at the weather data, it appears this event is in fact unprecedented during the time period from late December through late April”

(The Arctic region as a whole is expected to experience a [frankly quite insane] temperature anomaly in the range of 4 degrees Celsius above average by January 3rd of 2016. Note the broad regions over Northern Canada, Siberia, and the Arctic Ocean that are predicted to experience temperatures in the range of 20 degrees Celsius above the already hotter than normal 1979 to 2000 baseline readings. For some areas — particularly in Northern Canada — this will mean near or even above freezing temperatures for tundra and permafrost zones in the depths of Winter. A set of conditions that has serious implications for permafrost thaw and related carbon store feedbacks. Image source: Climate Reanalyzer.)
New Freakish Weather Patterns Concordant With Human-Forced Climate Change
The deep, northward-driving synoptic pattern associated with both powerful high Latitude storms and warm winds is only something we’ve begun to see during recent years. The warming polar environment itself generates weaknesses in the Jet Stream which tends to allow these warm air invasions. In addition the warming oceans — which hold heat for longer than land masses — generate pathways for warm air invasions of the Arctic during Winter time. The Barents Sea, for example, has been particularly warm during recent years which has resulted in numerous warm wind invasion events issuing northward over Svalbard and regions eastward during recent years.
A final ingredient to this highly altered weather pattern appears to be a cooling of the sea surface in the North Atlantic just south of Greenland. This cooling has been set off by an increase in fresh water melt outflows from Greenland as glacial melt there has accelerated concordant with human-forced warming. The cool pool of glacial melt water south of Greenland has aided in the generation of a dipole featuring cool air to the west, warm air to the east. This year, warm air has tended to flow northward over Spain, the UK, and along a region between Iceland and Scandinavia. During the Winter of 2015-2016, this warm air slot has also been the breeding ground for very unstable weather and a number of powerful storm systems.

(It’s an El Nino year. But despite a climate feature that would typically strengthen the Jet Stream, what we see is another Arctic warm air invasion reminiscent of the recent polar vortex collapse events of Winters 2012 through 2014-2015. Note that the region of coldest air, which would typically tend to center over the North Pole has been driven south toward Greenland and Baffin Bay. A pattern that we’d expect concordant with world ocean warming and Greenland melt as a result of human-forced climate change. Image source: ECMWF.)
Unfortunately, this larger overall pattern marks a progression away from typical North Atlantic weather and toward a much more stormy environment. It’s an environment that is all too likely to be marked by features of warm air invasions moving up through the Barents and into the High Arctic during Winter. Of the Northern Hemisphere storm circulation tending to wrap around Greenland as the center of cold air shifts from the North Pole to the last bastion of dense glacial ice. And of a very unstable storm generating cold water and surface air temperature zone deepening and gaining an ever-stronger hold within the North Atlantic.
These are influences we see now. Ones that are impacting both the current powerful storm over Iceland and the unprecedented surge of warm air that is now preparing to invade the High Arctic. And though El Nino likely also played a part in the shifting of the storm generation zone toward Iceland, the far northward propagation of warm air into the Barents and High Arctic along with the extreme strength of the predicted storm are both likely new features of an overall altered pattern. What we witness here are both climates and weather features changing before our eyes in the form of what to us may seem a freak event — but what is actually part of a dangerous transition period away from the stable climates of the Holocene.
UPDATE: ECMWF model runs now predict an extraordinarily strong 920 mb low striking Iceland by Wednesday. With GFS model runs coming into agreement, the certainty of this extreme forecast intensity increases. NOAA’s Ocean Prediction Center now has an updated forecast of 90 knot winds for the region in conjunction with this very impressive storm system.
Finally, as the Washington Post indicates in this excellent article, though some scientists are increasingly concerned that current powerful North Atlantic storms have a climate change influence, others remain unconvinced. For my own part, and based on continued observations of the weather data, model attribution studies, sea surface temperature, and glacial melt indicators, I believe there is a strengthening case for climate change attribution in the instance of more frequent, intense North Atlantic storms and especially in the recent very frequent Arctic warm air invasion events. In addition, it will unfortunately take years-to-decades for the institutions of modern science to come to a consensus on this and other climate change related issues. Given that events are now likely in play that will generate rapid changes to global and, in particular, North Atlantic weather patterns, it is impractical to wait for a scientific consensus to develop before reporting on these emerging issues. Waiting, at this time, would be irresponsible as it would result in a general lack of awareness of the overall threat.
To paraphrase Dr. Jennifer Francis — at this point it is not practical to wait for us to achieve perfect knowledge. And, in fact, we have more than enough indicators at this time to show that something is quite dreadfully wrong.
SECOND UPDATE TUESDAY, DECEMBER 29
THIRD UPDATE 12:36 AM EST, WEDNESDAY, DECEMBER 30:
As of early Wednesday morning temperatures at the North Pole had risen to 1.1 C or 34 degrees F representing the highest temperatures ever recorded at the North Pole for this time of year and the first time this region of the high Arctic has experienced temperatures substantially above freezing during Winter.

(1.1 C reading at the North Pole by Midnight, EST is a historic high temperature for the, what should be frigid, top of our world. It’s also yet one more bit of evidence showing that global weather is now in the process of going far off-kilter. Image source: Earth Nullschool.)
Links:
Very Low Minima of North Atlantic Cyclones During Winter of 2013
Warning From Scientists Age of Storms, Rapid Sea Level Rise is Coming Soon
Dr Jennifer Francis on Jet Stream Changes and Increasing Instances of Extreme Weather
NOAA Ocean Prediction Center Atlantic Analysis
NCAR North Pole Temperature Graphic
Slate on Extreme Weather (It’s worth noting that the storm causing extreme weather in the Central US is not the same one that’s bombing out over Iceland and driving this severe polar warming event, though these storms are certainly both part of the same odd overall weather pattern.)
Washington Post on Freak North Atlantic Storm
Hat Tip to DT Lange
Hat Tip to Colorado Bob (Remember — “Hot seeks Cold.”)
Hat Tip to TodaysGuestis
Special Mention to JDAllen and the Arctic Sea Ice Blog (I just became aware they began a discussion on the topic of unprecedented Arctic warming on December 26. ASIB deserves mention for their unfailing monitoring of the Northern Hemisphere sea ice and cryosphere as well as for their extraordinarily informative discussions.)
Share this:

Posted by robertscribbler on December 27, 2015
https://robertscribbler.wordpress.com/2015/12/27/warm-arctic-storm-to-hurl-hurricane-force-winds-at-uk-and-iceland-push-temps-to-72-degrees-f-above-normal-at-north-pole/
Record Hot Arctic: NOAA’s 2015 Report Card Shows Signs of Failing Climates
In NOAA’s most recent annual Arctic Report Card, the records just keep falling as the litany of global warming related events appearing throughout the far north continued to crop up with ever-more dizzying frequency…
(NOAA’s Arctic report is a stark expose of the state of the Arctic climate. What we view now is a system undergoing a rapid and dynamic transition from its previously stable state to something that is entirely new and alien to human civilization. Video source: NOAA.)
The 12 month period of October 2014 to September 2015 was the hottest one year time-frame since record keeping began for the Arctic back in 1900. As a result of these record warm temperatures, Arctic sea ice during the Winter hit its lowest maximum extent ever seen. Summer sea ice extent was likewise greatly reduced hitting its 4th lowest extent ever recorded. Old, thick sea ice which represented 20 percent of the ice pack in 1985, has precipitously declined to a mere 3 percent of the ice pack today. Snow cover also took a hit, declining to its second lowest extent on record during 2015 and striking a range of 50 percent below the typical average for the month.
Overall warming of the Arctic is at a much more rapid pace than the rest of the world. This accelerated pace of warming is due, in large part, to loss of snow and sea ice reflectivity during the Spring and Summer months. As a result, more heat is absorbed into dark land and ocean surfaces — a heat that is retained throughout the Arctic over longer and longer periods. And, though NOAA doesn’t report it in the above video, overall higher concentrations of greenhouse gasses like methane and CO2 in or near the Arctic region also contribute to a higher rate of warming (see NOAA’s ESRL figures). In a world that is now rapidly proceeding beyond the 400 ppm CO2 and 485 ppm CO2e threshold, this is exactly the kind of Northern Hemisphere polar amplification we would expect to see.
Warm Winds, Greenland Ice Sheet Melt, and Mass Migrations
NOAA notes a marked change in the distribution of life with mass migrations of all life forms well underway in and around the Arctic. Transitions and disruptions are most highly visible among marine mammals like walruses and polar bears — who are increasingly forced to live on land during the summer months. Meanwhile, an ever-broadening number of non-native fish are invading the Arctic from the south.

(South to north weather patterns, like the one featured above, have increasingly drawn warm winds up and over Alaska. An anomalous new weather feature that has merited comment in NOAA’s recent annual Arctic report card. Image from “Arctic Heatwave to Rip Polar Vortex in Half”.)
NOAA also links the warm wind invasion events reported on widely here to the second worst wildfire season ever to strike Alaska in 2015. A dipole feature that displays teleconnections between Arctic snow and ice loss, the hot blob of water in the Northeastern Pacific, and the persistent trough that prevailed over the US East Coast during the Winter of 2014-2015.
Finally, Greenland Ice Sheet surface melt hit a maximum coverage above 50 percent for the first time since the extreme melt that occurred in 2012. NOAA notes that the amount of ice delivered to the ocean by glaciers also increased across Greenland even as recent studies continued to find an increasing prevalence of glacial destabilization and acceleration among Greenland’s ocean-terminating glaciers.
NOAA concludes: “Taken together, 2015 shows a continuing set of major changes in the Arctic.”
Links:
Major Arctic Wildfire Outbreak
Arctic Heatwave to Rip Polar Vortex in Half
El Nino, Polar Amplification or Both?
Hat Tip to Alexandr
Share this:

Posted by robertscribbler on December 21, 2015
https://robertscribbler.wordpress.com/2015/12/21/record-hot-arctic-noaas-2015-report-card-shows-signs-of-failing-climates/
Warm Arctic Winds Rip Polar Vortex in Half, Blast East Face of Greenland Ice Sheet
Last night, at around 9 PM Eastern Time, a broad region just south of the North Pole was undergoing an extraordinary warm-up. Temperatures along the 37 W Longitude line just 80 miles south of the pole had surged to 33 degrees Fahrenheit. A reading warmer than a region of central Michigan thousands of miles to the south but running over an area of sea ice more accustomed to -5 F or lower temperatures during the great dark of the December night.

(Knife of warm air drives above freezing temperatures to within 80 miles of the North Pole on December 1 of 2014. Image source: Earth Nullschool. Data Source: UCAR, OSCAR, NCEP.)
It was the much warmer than normal core of an intense and anomalous Arctic heat surge. One that blasted up over Svalbard and flooded into the high Arctic. Meeting with a similar but weaker air surge to the south, both surface and upper layers of the Arctic Ocean atmosphere hosted a joining of rivers of warm air.
This warm air double envelopment neatly sliced the polar vortex in twain. The remnant cold air cores at the Jet Stream level slipped down over both the Canadian Archipelago and Central Asia. Leaving open the lane for warm, maritime air to surge over the Arctic Ocean region.

(Jet Stream level atmospheric circulation shows polar vortex cut in two with one circulation over the Canadian Arctic Archipelago and the other over Yamal, Siberia — scene to the freakish methane blowholes earlier this year. Image source: Earth Nullschool. Data Source: UCAR, OSCAR, NCEP.)
It is a pattern of negative phase Arctic Oscillation (AO) — featuring a warming in the central Arctic which flushes the cold air out. But this ripping of the polar vortex in half is also related to polar amplification due to the human heat forcing. In which the high Arctic has warmed dramatically in comparison with the rest of the globe. So the heat anomalies we see now are much higher than they would otherwise be, with abnormal warmth remaining even into a positive phase of the AO (which we may see a bit more of, should El Nino finally emerge).
It’s a feature also related to a warming of the upper atmosphere at stratospheric levels. Such Sudden Stratospheric Warming (SSW) events can often be associated with the kind of polar vortex split we are seeing now. And, from recent observations, we find temperatures over the Arctic Stratosphere are now in record range.
According to weather blogger, Matthew Holliday:
Even though I wouldn’t categorize this as a *sudden* stratospheric event as of yet, the warming that has already occurred will likely have effects by middle December. In fact, the warming that has occurred is currently at record levels for this time of year.
Extraordinary Arctic Warming
For much of November, readings in the Arctic as a whole have ranged from +1.5 to +2.5 degrees Celsius above the global average. A region featuring the highest global anomalies in a world that just saw its hottest ten months in the past 136 years, and probably its hottest ten months in many thousands of years. A region well known for its cold — but warming far faster than almost anywhere else.

(The Arctic hits an extraordinary early December +3.16 C positive anomaly on the first day of the month amidst a flood of warm air from the Atlantic and Pacific Oceans. Image source: The University of Maine. Data Source: Global Forecast System Model.)
Today, beset by this abnormal heat, overall Arctic departures hit 3.16 C above the already hotter than normal 1979 to 2000 average. Regions within this warm zone showed readings well above 36 F higher than average. A kind of winter Arctic heatwave. One that will keep worsening as the human heat forcing continues its terrible advance.
Near Freezing Temperatures Over Zachariae Glacier During Meteorological Winter
Much of the added heat expanded through the region between the North Pole and Greenland, wrapping in a surface circulation that has tended more and more to envelop the frozen isle, Baffin Bay and the accompanying Canadian Archipelago.

(Warm front off Atlantic Ocean featuring blow torch like wind flow over the Zahcariae Glacier collides with Greenland, pushes far into Arctic Ocean. Image source: Earth Nullschool. Data source: Data Source: UCAR, OSCAR, NCEP.)
This morning, some of that circulation and its entrapped warm air flow rode up over the East Coast of Greenland, surging over the ocean-facing cliffs of the Zachariae Glacier. Pushing temperatures to almost above freezing in a period where much deeper cold should be firmly established.
A great flood of abnormal winter warmth and moisture. The leading edge of a flow of ocean and atmospheric heat driven all too obviously by human warming.
Links:
James Hansen: If It’s Warm, Why is it So Damned Cold?
Changes in Northern Hemisphere Stratospheric Variability Under Increased CO2 Concentrations
Hat Tip to Wili
Share this:

Posted by robertscribbler on December 2, 2014
https://robertscribbler.wordpress.com/2014/12/02/warm-arctic-winds-rip-polar-vortex-in-half-blast-east-face-of-greenland-ice-sheet/
2012 Record Challenged as 40% of Greenland Ice Sheet Surface Melts on June 17th
Yesterday, 40% of the surface of Greenland melted.
It was still mid-June, yet a month before melt values typically peak. But a persistent high pressure system over Greenland, a rapidly melting Baffin Bay and warm winds riding up the west coast were enough to spur a surface melting event that shoved melt coverage firmly above the two standard deviation threshold and into record range.

(Greenland Melt Extent as of June 17, 2014. Image source: NSIDC.)
Temperatures along the west coast of Greenland and on through the southern ice-covered tip ranged between 30 and 55 degrees Fahrenheit, while 30-43 degree readings surrounded much of the periphery. Warm winds and rain to mixed precipitation accompanied a moisture-laden storm emerging from Baffin Bay and passing over the western ice sheet to add further and extreme early season melt pressure.
The warm storm and rains compounded already rapid melt pond formation along Greenland’s southwestern coasts. Large blue ponds varying between .5 to 3 kilometers in width had already formed over southern and western sections of the ice sheet by June 16, before they were covered in clouds and squally wet weather on June 17th. By today, the clouds cleared as the passing storm moved on to reveal melt ponds further swelled by a combination of warmth and wet weather:

(Large expanse of melt ponds near the outlet to the Jacobshavn Glacier on June 18, 2014. The smallest blue dots represent glacial melt ponds of about 300 meters in width. The largest exceed 3 kilometers at the widest point. Image source: LANCE-MODIS.)
Melt ponds add heat amplification to the glacier surface by reducing albedo even as they provide melt drainage to the glacial base. Floods of water from melt ponds add to glacier speed and buoyancy by reducing friction at a moving glacier’s base and by flooding geographic low points beneath the glacier. Melt ponds also reduce overall ice sheet integrity by permeating the ice with holes and fractures.
The Jacobshavn Glacier in the satellite shot above is Greenland’s fastest. It is now involved in a very rapid rush toward the ocean at a rate of 46 meters per day. A rush that has been facilitated in recent years by a major proliferation of melt ponds during summer time.
During extreme events, melt ponds can combine and over-top or break ice dams in dangerous glacial outburst floods. It is worth noting that Greenland melt pond proliferation has not yet reached a threshold for high risk of such events. But the now decade-long proliferation of melt ponds over the ice sheet surface during summer time remains a troubling occurrence.
40% melt coverage in mid June is an extraordinarily high number. Last year, melt coverage peaked at 47% in late July with June values approaching the high 20s in late June. July of 2012 saw a 97% melt coverage — an event last seen about 120 years ago and one that is, unfortunately, likely to be repeated soon under current human heat forcing. It is worth noting, however, that the record year of 2012 saw Greenland melt coverages periodically exceeding 40% from mid-to-late June.

(Greenland melt coverage on June 17 of 2014. Image source: NSIDC.)
Early melt and proliferation of melt ponds along with persistent high pressure systems over Greenland tend to have a compounding effect that amplifies over-all melt coverage. Low mists and clouds tend to form during such conditions, trapping heat near the ice surface even as albedo over the ice sheet falls due to wide-scale melt pond formation.
Though yesterday’s melt coverage is an early challenge to melt levels seen during 2012, current conditions would have to both persist and intensify for the broad extent of melt seen during late June and through July of 2012 to show a rough repeat. That said, a 40% melt coverage on this date is a record-challenging level that bears watching.
Links:
Greenland Undergoing Record 120 Year Melt
The Glacial Megaflood: Growing Glacial Outburst Flood Risk
Hat tip to Andy from San Diego
Share this:

Posted by robertscribbler on June 18, 2014
https://robertscribbler.wordpress.com/2014/06/18/2012-record-challenged-as-40-of-the-greenland-ice-sheet-surface-melts-on-june-17th/
Warm Winds Gather to Invade the Arctic: Summer Sea Ice Melt and The Storms of 2014
If there’s an aspect of global warming science that remains unsettled, it’s the general state of prediction and analysis over the fate of Northern Hemisphere sea ice. As is well known by now, model predictions greatly underestimated the pace of sea ice loss as a response to human-caused warming. Big melt years like 2007 and 2012 brought sea ice extent and area, by end 2012, to less than 50% of 1979 values. Sea ice volume for the same period was nearly 80% lower than 1979 measures. Such lows were generally not predicted to appear until the 2060s at the earliest.
Ice response to rapid human warming and polar amplification, in these cases, was, for lack of a better description, outrageously stunning. And the weather impacts of such amazing losses were increasingly dangerous and far-reaching. Climate systems inertia, in the case of sea ice, seemed to be no match at all for the strong and likely unprecedented warming forces we’d already unleashed.
Sifting through the sea ice tea leaves
Though much of what happened was and continues to be unexpected, a few overall patterns emerge in the data. Dynamic melt trends for area and extent were composed of massive melt years (2007 and 2012) followed by pseudo recovery years (2008, 2013) where the ice seemed to bounce back a little before inching again toward previous record lows (2009, 2010) or setting minor new melt records (2011 area) before the next big hit.
Sea ice volume measures were somewhat less messy with massive melt years (2007, 2010), more minor melt years (2011, 2012), one minor pseudo-recovery year (2008) and one major pseudo-recovery year (2013). In this set, one year (2009) stands out as neither showing a new record low volume nor showing pseudo-recovery as end season volume fell off slightly from the previous year. The fact that 2009 followed a pseudo-recovery year (2008) may or may not be instructive for the current melt season.
It is worth noting that in the volume progression, four out of seven years during the 2007 to 2013 period all showed new record lows.
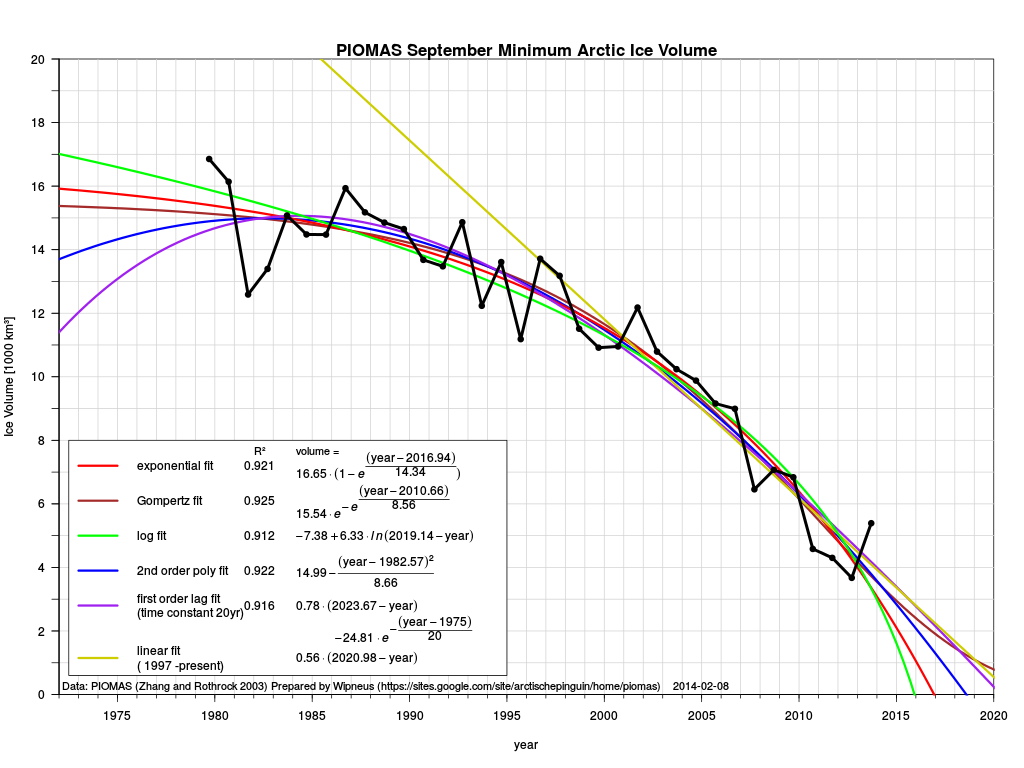
(Graph of minimum Arctic sea ice volume as measured by PIOMAS since 1979 with various trend line projections. Data source: PIOMAS Image source: Wipneus.)
What one can read from these data points is that strong pseudo-recovery years (like 2013 and 2008) have typically been followed in recent years by a return to the decline trend but not to new record lows. So, statistically, this is what we would expect for 2014.
That said, keep in mind that though it remains extraordinarily difficult to predict end sea ice states for any single year, the overall trend of major and unprecedented melt is most likely to continue and the window for a total sea ice loss by end season before 2020 remains wide open. Further, statistical analysis will, in every case, bow to emerging conditions on and beneath the ice.
Evolution of the early 2014 melt season
For the 2014 melt season, the fickle Arctic does not at all disappoint. By late April and early May of 2014, an extraordinarily warm winter period had wiped out most of the 2013 recovery in sea ice volume measures. By mid April, PIOMAS was showing volume in the range of second or third lowest year on record for the date.
By today, May 12, sea ice area and extent measures were in the range of 4th to 5th lowest on record with both measures approximately mirroring 2007 values for the date.
Given the potential for very rapid melt during June and July, as displayed in recent melt years, these values are within striking distance of new record lows should the weather conditions for rapid melt emerge.
Observed conditions for early to mid May 2014
It is worth noting that May does not generally tend to be a predictive month for sea ice loss. In most cases, it is more a bottleneck period where values tend to crunch together as the sea ice softens up but generally shows few breaks toward the more rapid melt trends typically seen in June or toward a slower melt due to weather that is less favorable for ice degradation.
That said, a few currently ongoing conditions may provide some strong indicators for how the 2014 melt season could progress.
High amplitude Jet Stream waves through Eastern Siberia, the Bering Sea and Alaska. A doggedly persistent weakness in the polar Jet Stream along an arc from East Siberia to Western Canada has resulted in much warmer than usual conditions for the Bering Sea, the Chukchi Sea and regions of the Beaufort adjacent to the Alaskan and Canadian coasts. Warm air originating over a pool of much hotter than normal water in the Northern Pacific just south of Alaska has continued to flow up through the Bering Sea, into the Chukchi, and over Alaska and Western Canada and on into the Beaufort.
Tracking this warm air flow resulted in a bit of incredulity as day after day observation showed the air continuing on through the Beaufort, past the North Pole zone, down over Svalbard and the Fram Strait, into the North Atlantic and finally being swept east in the strong cross-ocean wind pattern toward England and Ireland. In this way, air from 40 North Latitude in the Pacific jumped the pole to end up in the Atlantic near England.
A persistence of this weather pattern would have numerous and potential critical impacts for the Arctic during the summer of 2014. First, it would result in a constant pressure of warmer than usual conditions for sea ice along an arc from the Mackenzie Delta and Adjacent Canadian Arctic Archipelago to the East Siberian Sea. Warm winds would assault the ice from launching pads over warmer land masses in this zone, resulting in increased and early ice erosions.
Already, we can see such conditions emerging in the following MODIS satellite shots provided by NASA:
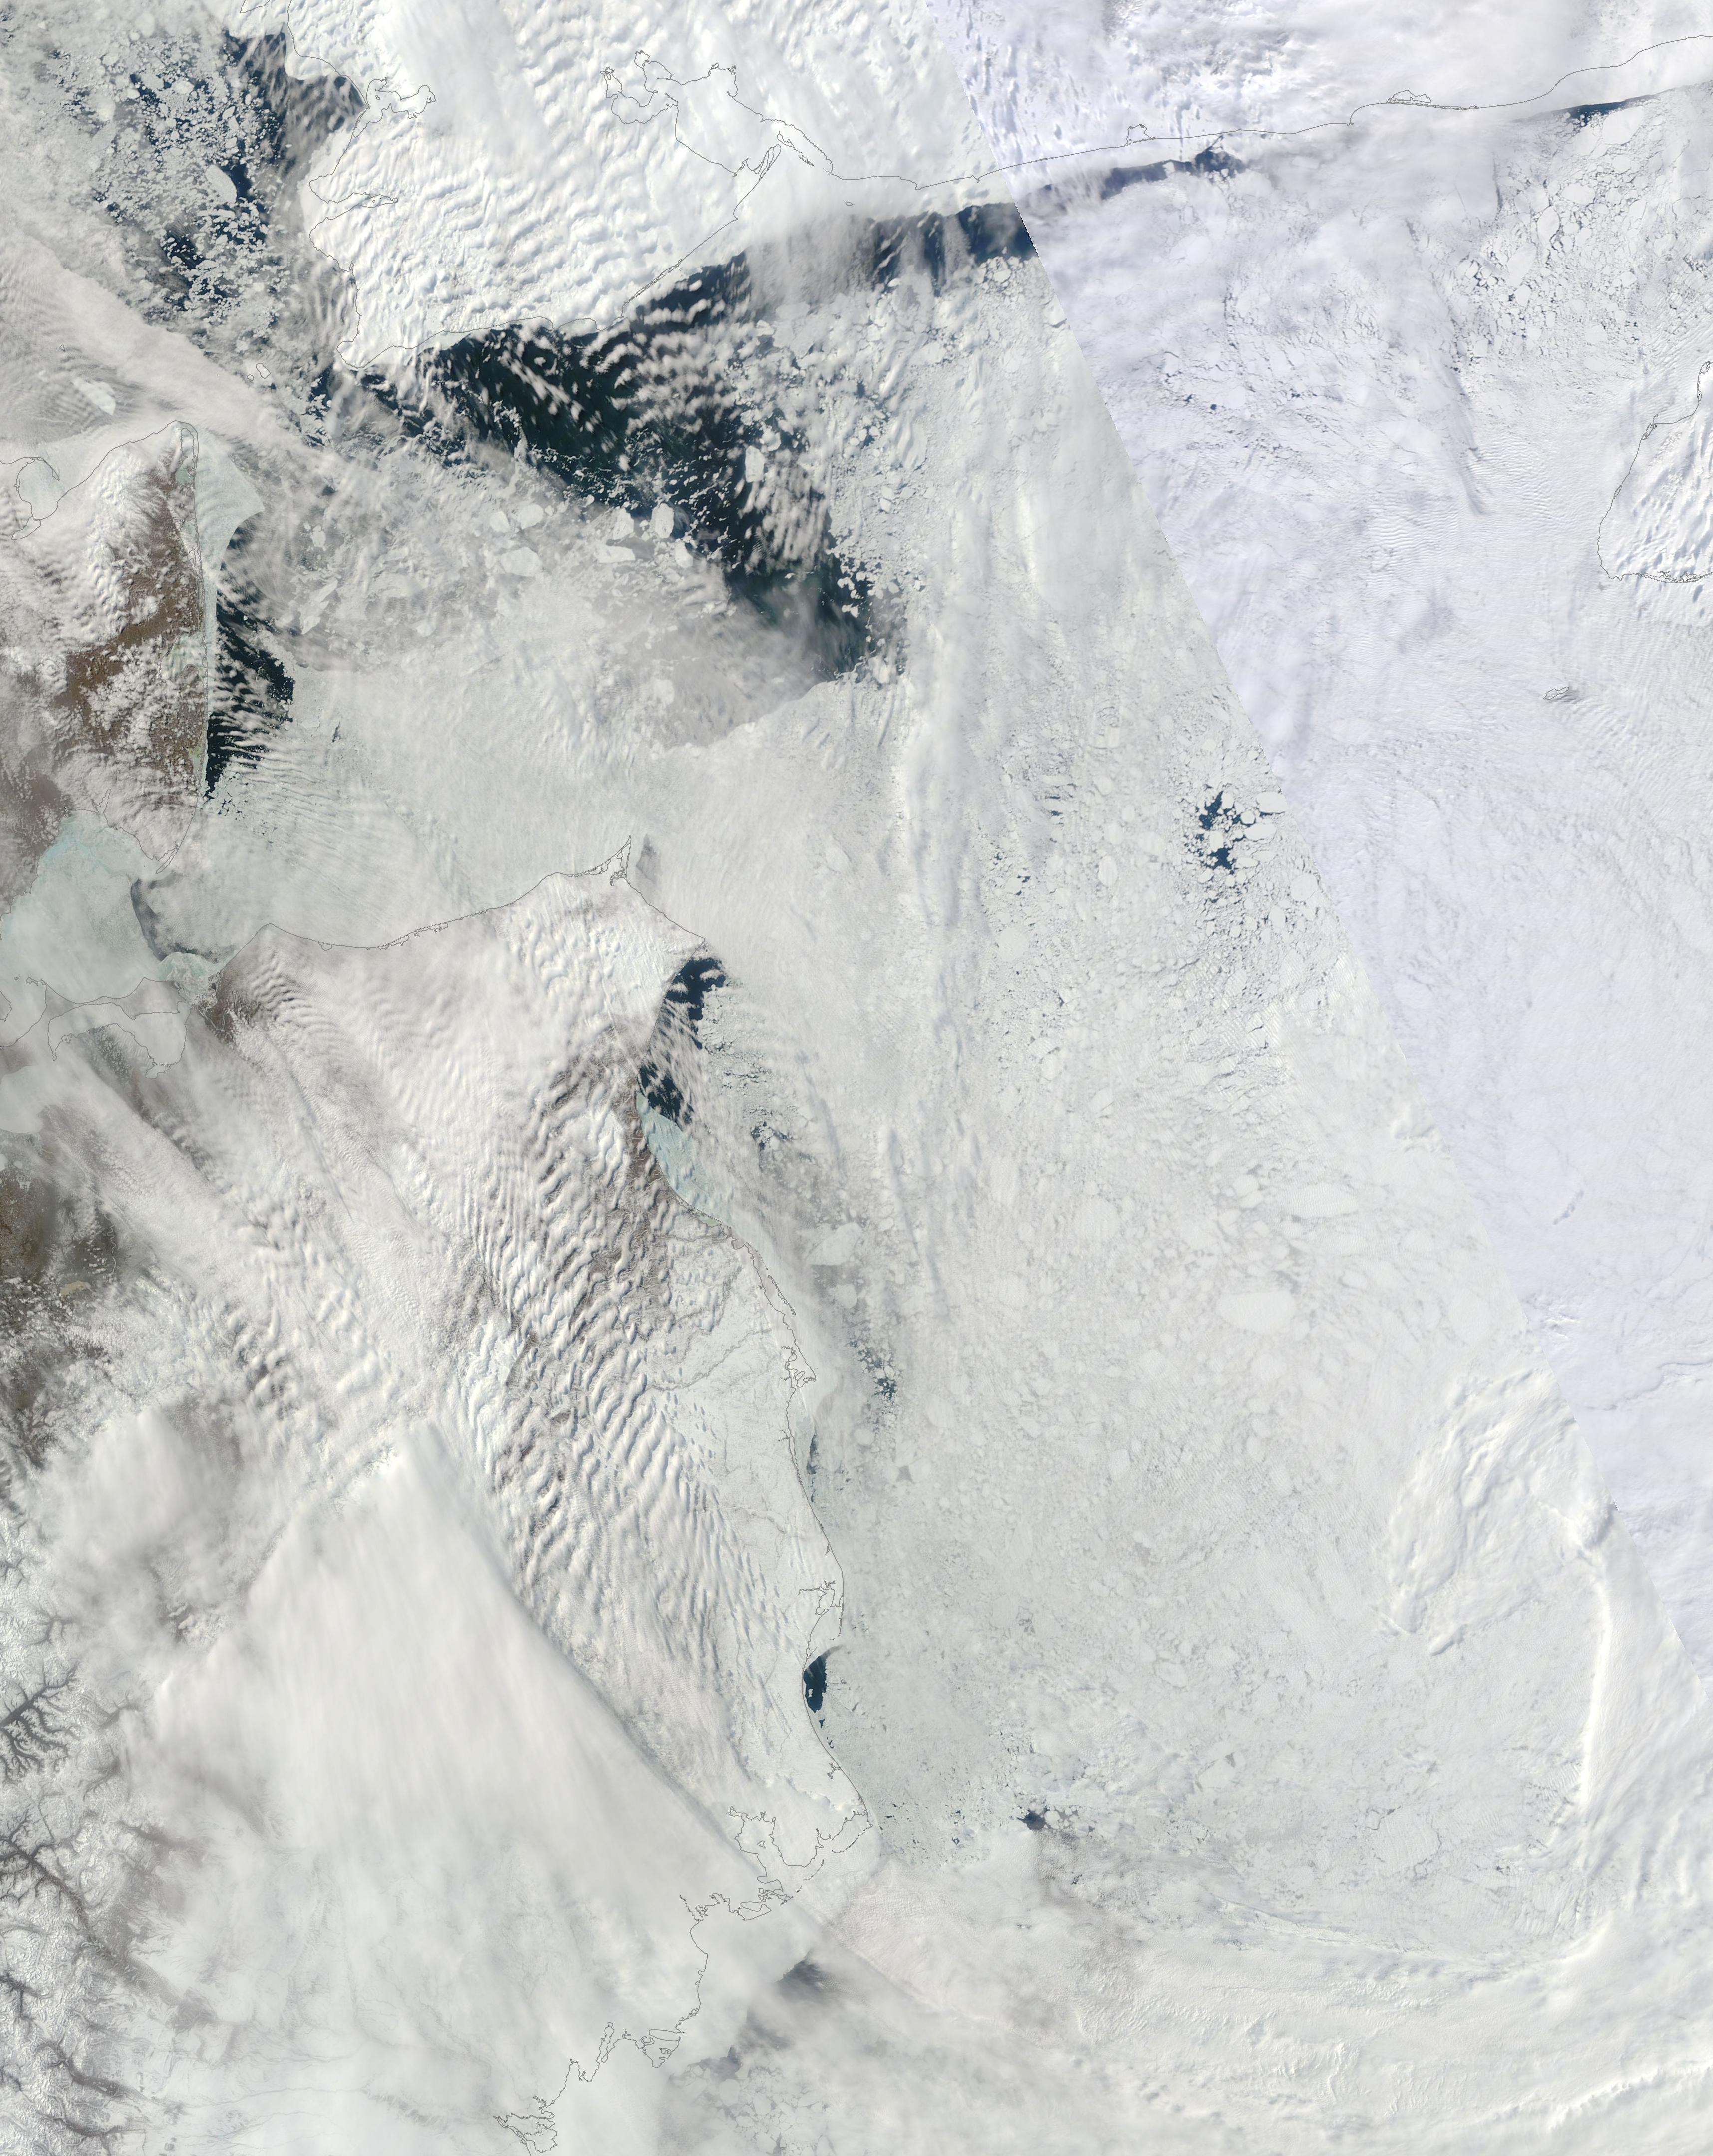
(The Mackenzie Delta [upper left] and adjacent Canadian Archipelago waters. Image source: LANCE-MODIS.)
The above image shows the Mackenzie Delta and the Canadian Arctic Archipelago on May 11 of 2014. In these images, we can seen the result of continued warm winds from the south and near-or-above freezing temperatures. For the Mackenzie Delta, temperatures since early May have ranged between 23 and 42 F, or between 5 and 25 F above average for this time of year. The high temperatures have brought the snow melt line all the way to the coast very early and have resulted in both ice melt and retarded refreeze in the broken ice and large polynyas offshore in the nearby Beaufort. Note that an additional heat influx to these coastal waters will occur once the shallow Mackenzie River fully melts, likely resulting in the early break-up of land-fast ice near the delta.
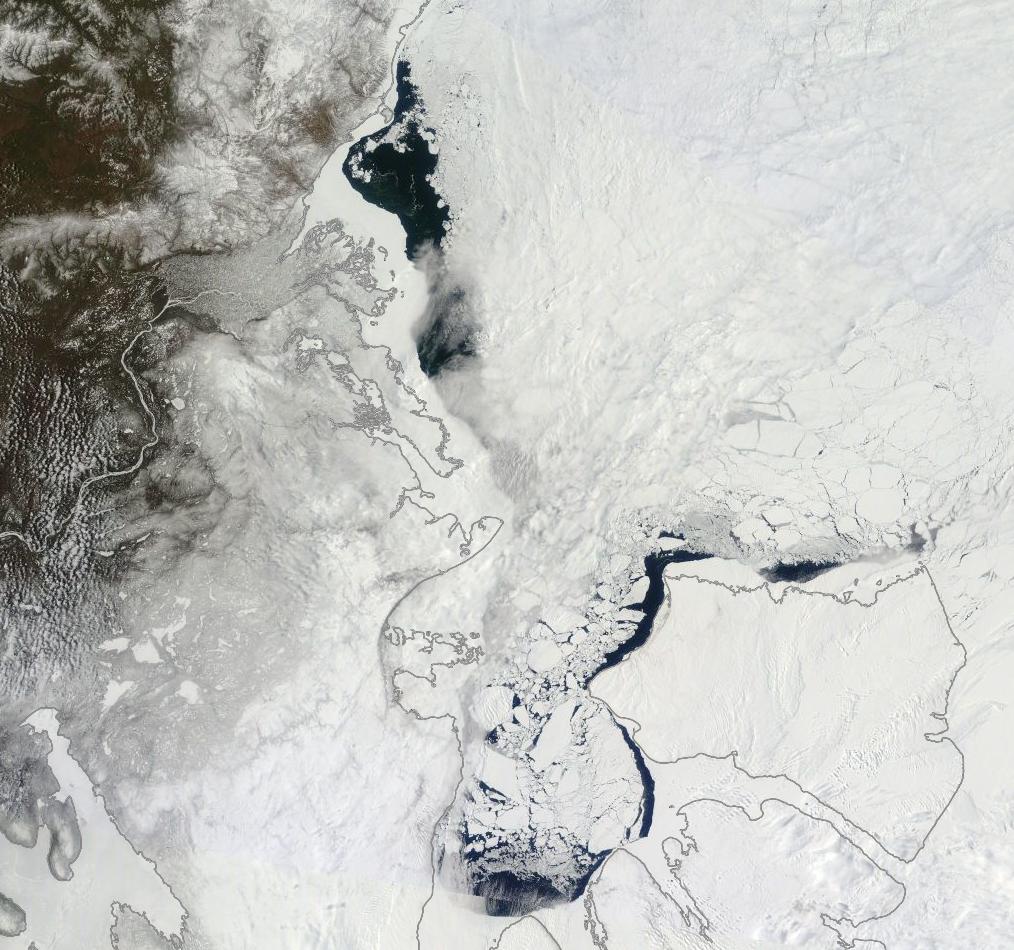
(The Chukchi and Beaufort Seas on May 11, 2014 from the Bering Strait [upper left] to past Barrow, Alaska [lower center]. Image source: LANCE-MODIS.)
Further along the Canadian and Alaskan coasts, we find a continuation of sea ice weakness and break up in the off-shore regions north of Barrow Alaska and on into the Chukchi Sea. Large polynyas remain open throughout the region and exhibit no refreeze in the open water sections. Past the Bering Strait zone, Chukchi melt is very well advanced for early-to-mid May due to a combination of near constant warm southerly wind influx and an advancing warm water wedge through the Bering Strait.
This warm wind pattern through Eastern Siberia, Alaska and Canada and into the Arctic Ocean is reinforced by a combination of ongoing factors including a weakened polar Jet Stream which has tended to generate high amplitude ridges in this zone, a very warm pool of water in the Northern Pacific south of Alaska, and an emerging El Nino which historically has tended to push a high amplitude split in the Jet Stream up toward Alaska. These self-reinforcing factors make it likely that the overall pattern of warm southerly winds over the region will continue to persist and have an impact well into summer.
Finally, it is worth noting that the current and ongoing warm air influx through this region provides a constant source of energy for Arctic storm genesis, a factor that may well become more significant as melt season progresses. Forecasts for the next 24 hours show a storm pulling warm, above-freezing temperatures deep into the Beaufort as it begins a transition toward the northern polar zone. It is the second system to exhibit such anomalous warm air inflow and progression into the Central Arctic during the month of May.
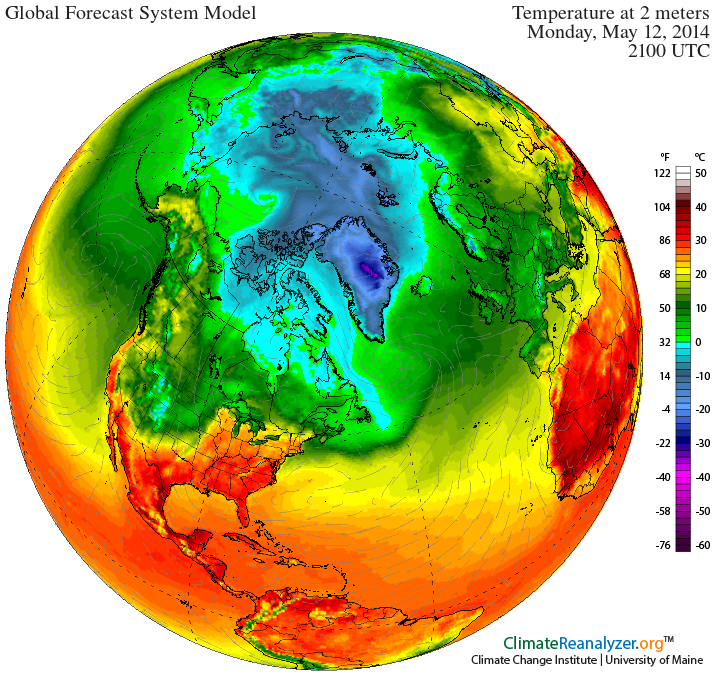
(GFS model summary showing warm storm with associated above-freezing temperatures invading deep into the Beaufort Sea during late Monday and early Tuesday of this week. Image source: University of Maine.)
A third warm air invasion, this time from Eastern Siberia, and potential related storm development is also projected for late this week or early next week.
The Arctic dipole: storms over the Arctic Basin, high pressure over Greenland. Today, we track three Arctic low pressure systems — one emerging from the warm air influx over the Beaufort, one over the Laptev and one north and east of Svalbard. Greenland, meanwhile, shows a high pressure system centered almost directly over its large ice sheet. The net effect of these lows and highs is to funnel the warm wind streaming up from the Beaufort over the Northern polar zone near the Canadian Arctic Archipelago and out over the Fram Strait and Svalbard.
It is a dipole of high pressure over Greenland and low pressure over the Arctic Basin on the Central and Eastern Siberian side that has lasted for about two months through Northern Hemisphere Spring. This set-up creates a strong and consistent wind pressure providing transport of sea ice out of the Fram Strait. It is worth noting that Fram Strait export was one of the primary factors involved in the record low sea ice total seen during 2007, so a consistent dipole pattern of storms over the Arctic basin and highs over Greenland promoting ice export could well weigh heavily as melt season progresses.
Warming over Western Russia and Eastern Europe. A second zone showing consistent ridge development, polar Jet Stream weakness and coincident anomalous warming has emerged over western Russia and Eastern Europe. Such warming was seen during the weak El Nino of 2010 and resulted in severe heatwaves and wildfires for the region. A similar pattern has emerged in tandem with the rising and potentially far stronger 2014-2015 El Nino currently developing in the Eastern Pacific. Though it is too early to tell if this emerging hot zone will reach the extremes seen in 2010, this heat pool is likely to contribute warmth to sea ice zones in the Kara and Laptev Sea as the summer melt season progresses.
So far, Kara sea ice retreat has remained within usual boundaries for recent years. However, it is worth considering the potential strength of this developing warm air pool and how it may impact adjacent Arctic zones as May progresses into June. This week’s forecast now shows above-freezing temperatures predicted to progress into the Kara and 50 degree F readings predicted to push into estuaries bordering the Kara over the next few days.
Warm water upwelling, north wind flush, storm suction for Baffin Bay. Finally we come to Baffin Bay, a place many may well consider the Arctic Ocean’s red-headed stepchild. Over recent years, warm water up-welling, possibly driven in part by sea-bed methane release, in Northern Baffin Bay has resulted in an almost constant weakness and erosion of sea ice. This condition creates a bizarre circumstance in which Baffin is often surrounded by warmer waters north and south by late spring. This year is no exception. In addition, a north wind now appears to be flushing Baffin Bay sea ice toward the North Atlantic. The result is an expanding zone of ice-free water along the West Coast of Greenland pushing toward a widening gap in the north of Baffin Bay near the Nares Strait.
To the south, a persistent storm has developed near an anomalous cool zone in the North Atlantic waters off of Newfoundland. This cold pool is likely a residual of the continued dipole, hot-west, cold-east temperature anomaly over North America which has increasingly been squashed toward Newfoundland with the emergence of summer. The cold North Atlantic pool is also likely fed by a rising outflow of fresh, cold water from Greenland glaciers as well as the Baffin Bay ice export already described. A growing Gulf Stream weakening is also well established for the region.
The persistent storm is fed by high temperature differentials in the dipole zone. It is one of the remnant storm systems of this winter’s epic assault on the coasts of Great Britain — a possible precursor to even more vicious storms this coming winter.
But, today, the storm is simply providing added suction to drain ice out of Baffin Bay.
(Like a drain in a massive bathtub: storm off Greenland and Newfoundland on May 12 reinforces northerly wind flow pulling sea ice out of Baffin Bay. Image source: LANCE-MODIS.)
A final word on Storms and Warm Winds
During late April, we talked a bit about the impact of early season melt ponds on end-season sea ice levels. For recent scientific studies have found that early season melt pond formation has a high correlation with new record lows in sea ice area and extent.
But given the current very thin and broken state of sea ice, it’s worth considering whether the rules for sea ice loss aren’t in the process of changing.
Ever since the 2012 melt season’s close, the Arctic Ocean has exhibited a very battered sea ice state. One featuring widely disassociated packs of broken and brittle ice riddled with a long and pervasive spidering of leeds. For large melt pond systems to develop, the ice pack needs to be relatively contiguous. But the recent ice pack shows very little continuity and could, instead, be said to basically lack integrity. Such a state may well prevent a degree of melt pond formation in areas in which the ice is more and more highly disassociated into floes. And it is this disassociated ice state that may be the current and future norm as sea ice continues to thin and weaken.
In addition, rising temperatures in and around the Arctic have resulted in increased atmospheric water vapor content, increased cloud formation, and increased storm presence during summer periods. This progression toward storminess is consistent with paleoclimate studies showing that ice-free or near-ice-free Arctic states were much stormier than the current one. In the event of an expected stormier Arctic, melt pond formation may well result less from direct solar insolation through clear Arctic skies and more from an increasing number of rainfall and warm fog events over sea ice.
Cyclonic pumping of warmer waters from below the ice pack into surface water zones and the mixing of waters by waves generated by storm winds is also likely to have a far greater impact on sea ice melt than seen in recent years. It is likely we saw a prelude to just such an event during the great, late-season Arctic Cyclone of 2012 which sent waves the size of houses roaring across the Beaufort Sea to batter and disassemble the already weakened sea ice.
In this dynamic and changing system, warm winds are also likely to play a much greater role. Jet Stream erosion, in such a case, unleashes warm southerly winds on the sea ice. The winds, being warmer, hold a higher water vapor content than was typical for the Arctic prior to the human warming insult. Encountering ice and cold water, the water vapor in the winds condenses to form fog. The latent heat in the water vapor is thus released to do work melting the sea ice and warming the sea surface. In such cases, a kind of snow and ice eating mist develops from the warm wind — a blow torch for the sea ice.
Links:
Dual Ridges Form Sea Ice Achilles Heel for Summer 2014
Share this:

Posted by robertscribbler on May 12, 2014
https://robertscribbler.wordpress.com/2014/05/12/warm-winds-gather-to-invade-the-arctic-summer-sea-ice-melt-and-the-storms-of-2014/
Please Help Support Our Ongoing Efforts

Climate of Pandemic — A COVID-19 Special Report

GROWTH SHOCK

Luthiel’s Song: Dreams of the Ringed Vale

Luthiel’s Song: The War of Mists

Climate Progress

The Secular Jurist

Exposing Misinformation Spread by Anthony Watts

Colorado Bob’s Climate Feed

Arctic Sea Ice Blog

Science Blogs

Climate State

