
A change in the persistent jet stream pattern that enhanced heatwave and fire intensity for the U.S. West is now providing relief. Meanwhile, a building ridge in the east has set the stage for potential record heat.
All posts tagged fires
Change in the Jet Stream Relieves West, Moves Heat East

Posted by robertscribbler on August 29, 2018
https://robertscribbler.wordpress.com/2018/08/29/change-in-the-jet-stream-relieves-west-moves-heat-east/
Three Hundred Foot Tall ‘Fire Tsunami’ Burns Through Colorado
A massive 100,000 acre blaze has hurled off 300 foot high walls of fire that local authorities are describing as a ‘fire tsunami.’
The Spring Creek Fire, now the third largest in the Colorado state record, has forced more than 2,000 people to evacuate, destroyed or damaged 200 homes, and drawn the emergency response of 1,000 firefighters.
(Explosive Spring Creek Fire reaches 300 feet in height — forcing hundreds to flee.)
According to public information officer Ben Brack, firefighters were dealing with:
“unprecedented fire behavior. Because the fire has been moving so fast we don’t know exactly how big it has become. It was a perfect firestorm. This is a national disaster at this time. You can imagine standing in front of a tsunami or tornado and trying to stop it from destroying homes. A human response is ineffective.”
Thankfully, and due in large part to heroic efforts by firefighters and emergency responders to evacuate those in the fire’s path, no reports of loss of life have yet been received. Overnight rainfall on the 5th to 6th of July has also given firefighters an opportunity to respond. And now this enormous blaze is 35 percent contained. However, the explosive, lumbering fire is still a serious threat to the region.

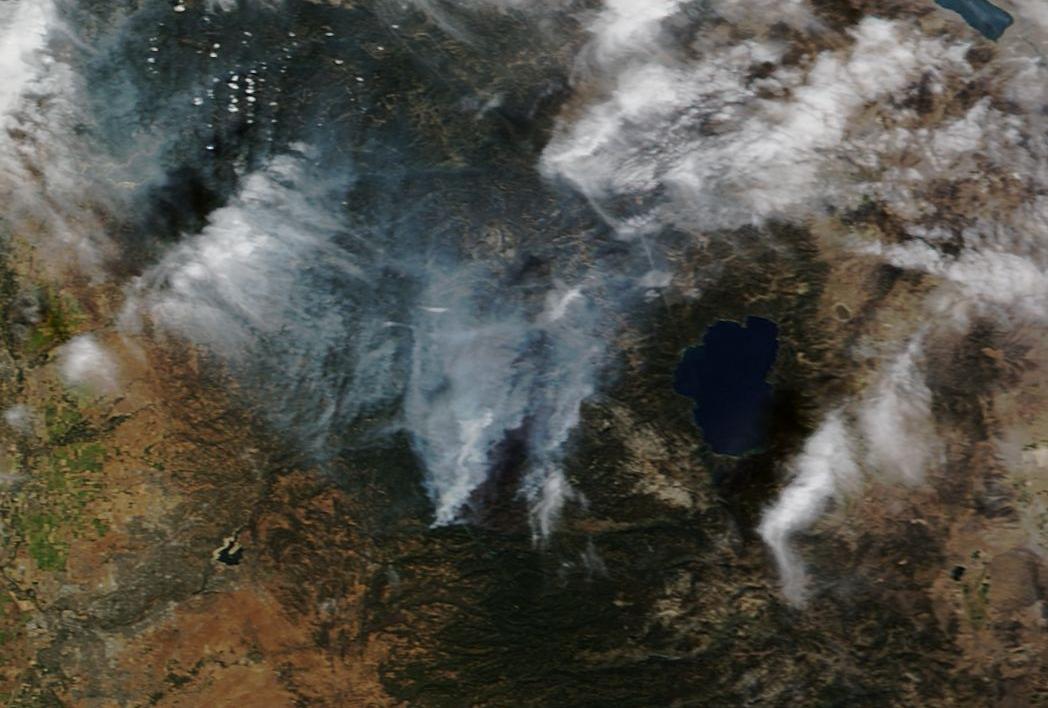
(NASA satellite image of the Spring Creek Fire burn scar.)
Across the west, fully 60 large fires are now burning across the U.S. from Alaska to the Southeast. But the most intense fires are occurring in the west. These fires are sparking as record heat and severe drought conditions strike the west. And, presently, over 2,900,000 acres have burned on U.S. soil.
Heat is a primary enabler of wildfires. And with temperatures rising due to human-caused climate change, the western wildfire season has grown from 5 months in the 1970s to more than 7 months today. In some locations, like Southern California, the fire season is now year-round. In addition, the size of fires out west is increasing. So long as human fossil fuel burning and related carbon emissions continue, the western fire situation will worsen. With burn areas projected to increase by as much as 650 percent for some regions.
UPDATED
Share this:

Posted by robertscribbler on July 6, 2018
https://robertscribbler.wordpress.com/2018/07/06/three-hundred-foot-tall-fire-tsunami-burns-through-colorado/
Freak Wildfire Outbreak Strikes Northern Spain During Winter
Over the weekend an unexplained wildfire outbreak erupted across the Asturias and Cantabria regions of Northern Spain. In total, more than 100 blazes flared as 60 mile-per-hour winds and freakishly warm temperatures in the upper 60s to lower 70s (Fahrenheit — 15 to 20 degrees Celsius) spread across Spain’s northern coastal provinces.
(More than 140 active wildfires swept across Northern Spain over the weekend. Video Source.)
More than 200 firefighters responded to the strange outbreak — one all-too-certainly linked to record warm global temperatures in the range of 1.06 C above 1880s averages. Fortunately, there are currently no reports of injuries or loss of property or life. Just an odd and somewhat terrifying mass wildfire eruption occurring in typically damp North Spain at a time near the Winter Solstice.
Another Abnormal Winter Wildfire Event
Though the cause of these fires has yet to be officially determined, temperatures in the range of 9-18 degrees Fahrenheit (5-10 C) above average and very strong winds — gusting up to 60 miles per hour — likely contributed to this anomalous winter wildfire outbreak. This warm air flow was pulled northward along the eastern edge of a powerful Atlantic weather pattern that, through most of Fall and Winter, has been hurling strong storms into Iceland, coastal France, the United Kingdom, and Scandinavia. These warm winds gained extreme intensity on Saturday and Sunday and likely sparked and fanned the wildfires (in much the same manner that Santa Anna winds risk wildfires in California).

(On Saturday and Sunday, powerful southerly winds and abnormally warm temperatures swept over Northern Spain — setting the stage for a freak mass wildfire outbreak during winter time. Image source: Earth Nullschool.)
It is not usual at all for wildfires to occur during Winter anywhere in Spain, especially not along the northern coastal regions where cool, wet weather tends to prevail as December transitions into January. But this year the typical rainfall pattern has been interspersed with warm, windy periods and comes at the end of a long, much hotter than normal year. A heat that has almost certainly contributed to a fire year that, for Spain, has resulted in the burning of more acres during 2015 than for all of the previous two years combined.
As with other recent large Winter wildfire outbreaks, the influence of a human-forced warming of the global climate system is writ large. Winter wildfire outbreaks, especially in the Northern Hemisphere, are becoming more frequent — with some major winter wildfire outbreaks even extending to regions near or above the Arctic Circle. Fires that are upshots to an overall extension of the fire season combined with a much greater frequency of wildfire outbreak. It’s trend that comes both from a larger warming of the Earth’s climate system. And not only does the added heat itself fuel a higher frequency of wildfire outbreak, it also increases drought intensity and the speed of drought onset — which generates a compounding factor for increasing wildfire frequency.
Major news media sources reporting on these incidents have yet to make this all-too-obvious link. And, given continued sparse analysis on human forced climate change as a whole, it’s questionable that they ever will.
Links:
Forest Fires Sweep Across Northern Spain Despite Winter Rain
Spanish Firefighters Battle Over a Hundred Fires in Asturias
Fire in Spain: More than 140 Active Fires
2015 Hottest Climate Year on Record
Hat Tip to Wharf Rat
Share this:

Posted by robertscribbler on December 21, 2015
https://robertscribbler.wordpress.com/2015/12/21/freak-wildfire-outbreak-strikes-northern-spain-during-winter/
An Army of Firefighters Battles 14 Blazes in Triple Digit Temps Across California — More than 1,000 People Displaced
It’s becoming all too clear that we’re rolling with some seriously loaded climate dice.
California, suffering through its second year of a desiccating 1,000 year drought, is now facing down a new set of related tragedies. Over the past few days temperatures rocketed into record triple digit heat. The Golden State, turning more and more into the withered Brown State, faced hot Santa Anna winds and a new eruption of dangerous fires.
(A rash of California wildfires has now displaced more than 1,000 people — adding to the long tally of forced displacement due to extreme weather conditions related to human caused climate change. Video Source ABC News.)
According to news reports, 14 major fires are now absorbing the efforts of an army of 7,000 firefighters and California National Guard members. In total, more than 1,000 people have been displaced by the fires raging throughout Northern and Central California. Ten structures, including homes, along with boats and vehicles, have been destroyed even as more than 300 are now threatened.
Of the most intense and dangerous fires, the largest fire covered 13 square miles in Lake County. That single blaze alone forced 650 residents to evacuate and destroyed two homes. As of late Thursday night, this dangerous fire was only 5 percent contained. Nearby, Brenna Island saw a brush fire tear through a mobile home park destroying six structures along with numerous boats and vehicles. In Nappa Valley, a 12 square mile inferno spread beyond containment lines to threaten 136 structures — forcing another 200 people to evacuate. Over on the shores of Bass Lake a fourth fire nearly doubled in side — surging from 3 square miles to five square miles in just one 24 hour period. As the Bass Lake fire encroached upon the Cascadel Woods community another 400 persons residing in approximately 200 homes were forced to flee. By early this morning, the rapidly expanding fire was only 30 percent contained.
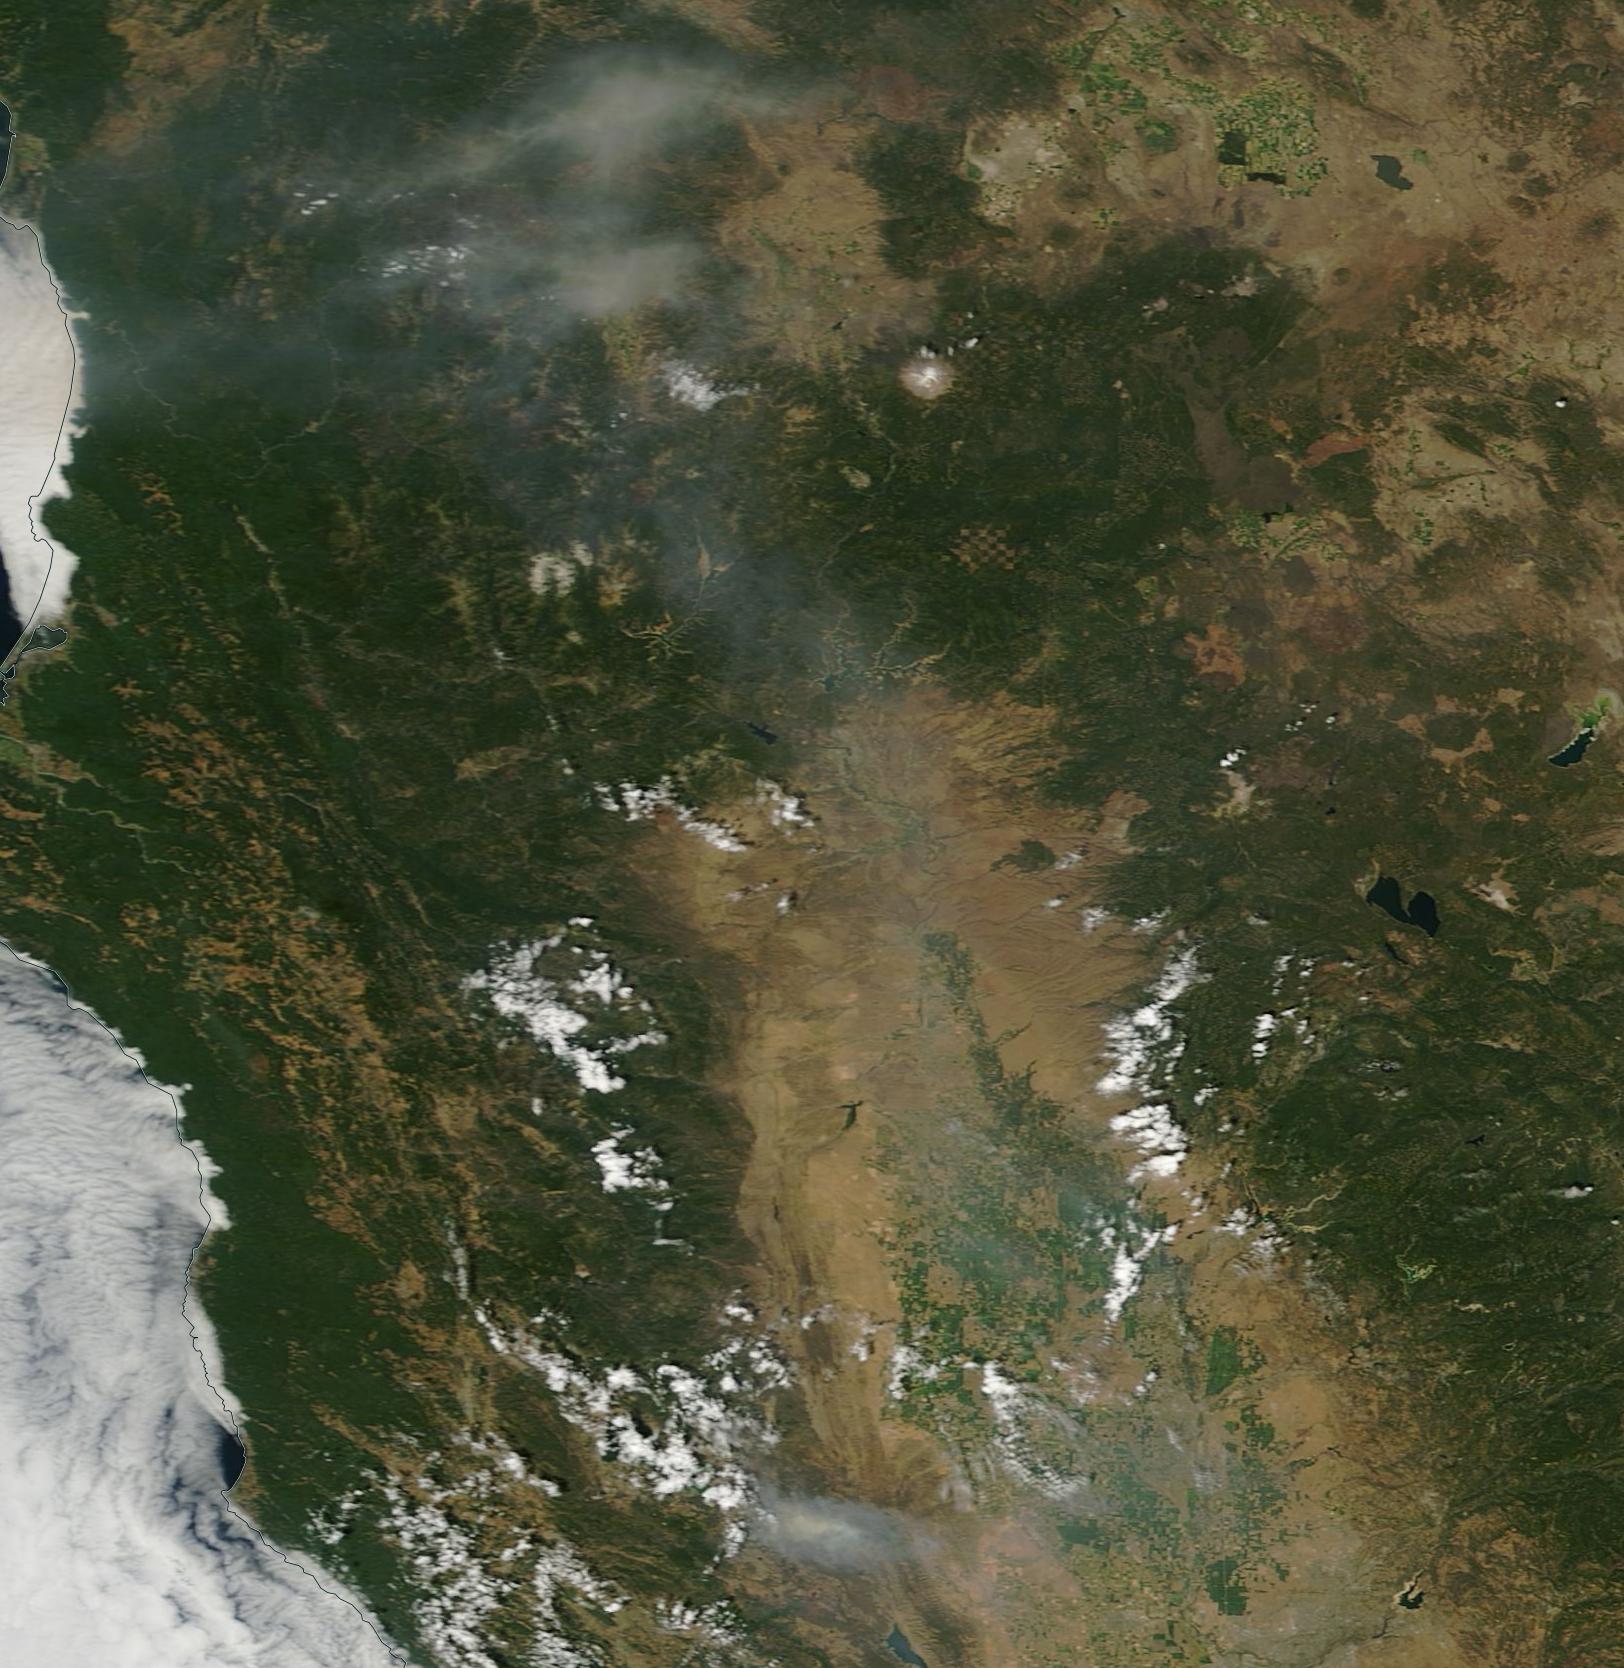
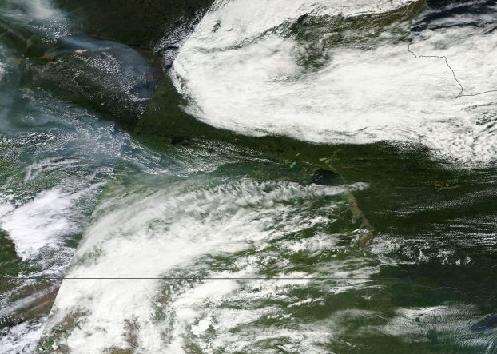
(A pallor of wildfire smoke lingers over Northern California as blazes erupt under sweltering heat and gusty winds. At right of frame also note that the mountain snow pack is basically nonexistent. Image source: LANCE-MODIS.)
By yesterday afternoon, smoke from these wildfires was beginning to show up in the NASA/MODIS satellite shot. A dark pallor and haze that is all-too-likely to expand over coming days as temperatures in the middle 90s to lower 100s (Fahrenheit — 35 to 41 Celsius in the metric conversion) are expected to remain in place through next week.
California Continues to Suffer Through a Climate-Change Linked Drought
Off-shore, a massive pool of hot water continues to worsen California’s misery. The hot pool, also called The Blob, has maintained sea surface temperatures in the range of 3-5 degrees Celsius above average for the better part of two years now. These record hot Northeastern Pacific Sea surface temperatures, in turn, aided in the development of a persistent high pressure ridge. To the north, a recession of sea ice in the Arctic Ocean has aided the ridge — allowing the Jet Stream to surge northward over Alaska, Canada and, at times, into the High Arctic itself. The result is a kind of hyper-ridge feature. An obnoxiously long-lasting and vast spike of hot, dry air driving deep into the polar zone itself (hear more about the ridge and other climate change related extreme weather features in a recent radio chat I had with Hal Ginsberg). For over two years, this ridge has warded off rainfall-granting storms all while baking California and the U.S. West Coast under month-after-month of record heat.
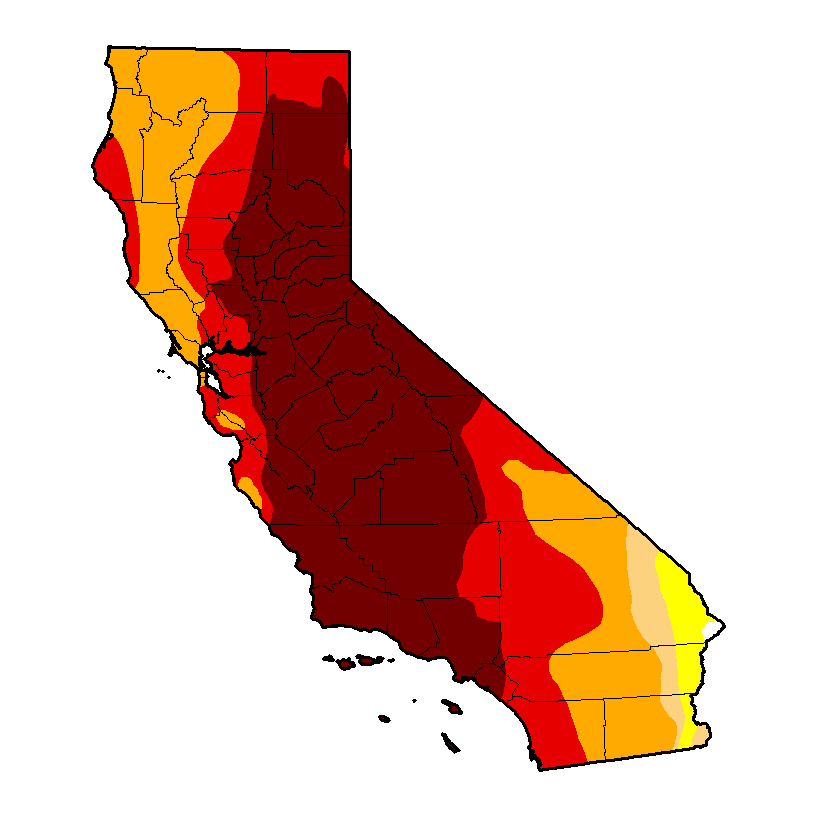
(US Drought Monitor shows exceptional drought maintaining its grip over nearly half of California. Meanwhile, 97.5 percent of the state suffers moderate to exceptional drought. To this point, California has experienced more than 90 percent of its land mass under drought for nearly two years now. Image source: The US Drought Monitor.)
The result is that fully 59 million people across the US West alone now suffer from drought. But the epicenter of this historic and unprecedented event is California. There, 97.5 percent of the state is still sweltering under drought conditions with a huge swath through the central portion continuing to experience the most extreme conditions we have a measure for.
Can a Powerful El Nino Beat Down the Ridiculously Resilient Ridge?
The California drought is now so intense that the state has lagged one year behind in rainfall. In other words, for the drought to end, nearly two feet of rain would need to fall over every inch of this parched and burning state. Earlier this month, an anomalous monsoonal pattern dumped an inch of rain over sections of San Diego. But this odd storm only effected the extreme south while the rest of California continued to dry out. And so the epic drought continues with no real hope for relief until Fall.
Then, an El Nino, which is likely to be one of the top 3 strongest ever seen, may begin to send a series of powerful storms marching toward the US West Coast. But for that to happen the warm water zone off the California coast must fade, its associated high pressure systems must fail, and the Jet Stream which has tended to dive north into the Arctic, must flatten. That’s what we pin our hopes on now for California rains — an El Nino strong enough to smash the Ridiculously Resilient Ridge and to, for a short time, alleviate some of the more brutal impacts of human forced climate change. A respite that may not come at all. Or, perhaps just as bad, when it does come — dump that 2 feet of rain all at once.
Links:
California Wildfires Destroy Homes, Force Evacuations
California Wildfires Displace Hundreds
Climate Chat With Hal Ginsberg
Possible Strongest El Nino on Record
Share this:

Posted by robertscribbler on July 31, 2015
https://robertscribbler.wordpress.com/2015/07/31/an-army-of-firefighters-battles-14-wildfires-in-triple-digit-heat-across-california-more-than-1000-people-displaced/
Glacier National Park is Burning
A bad wildfire year for the US and Canada just got that much worse. As of yesterday a fire had ignited in Montana’s majestic Glacier National Park. As of today, the fire had consumed nearly 3,000 acres and it’s still growing. In other words — Glacier National Park, a national monument, a natural wonder, a place known for its towering glacier-capped peaks and frozen valleys, is now on fire.

(A massive wildfire is now burning in Glacier National Park. Image source: Commons.)
Strong winds and low humidity combine to generate what fire management officials call — ‘explosive fire growth potential.’ These conditions allowed the fire to burn over 1,000 acres during just a few hours yesterday and to rapidly expand to cover nearly 3,000 acres today. The fire there has now spurred officials to order a complete evacuation of St. Mary’s Park and to suspend all activities until further notice. A 50 mile long road running through the park has also had 21 miles blocked off to traffic. Type 1 incident management teams are now en route to the blaze which is still growing.
The fire occurs as other blazes are now popping up throughout both Montana and Washington. East of Glacier National Park, the Cabin Gulf Fire also exploded to 1,000 acre size yesterday — drawing the firefighting efforts of 10 aircraft and dozens of hot shotters. In southeastern Washington, more than 600 firefighters battled a single blaze that had consumed more than six square miles including one residence. Across Washington other forest areas, including rain forests, were also experiencing a widespread fire outbreak.
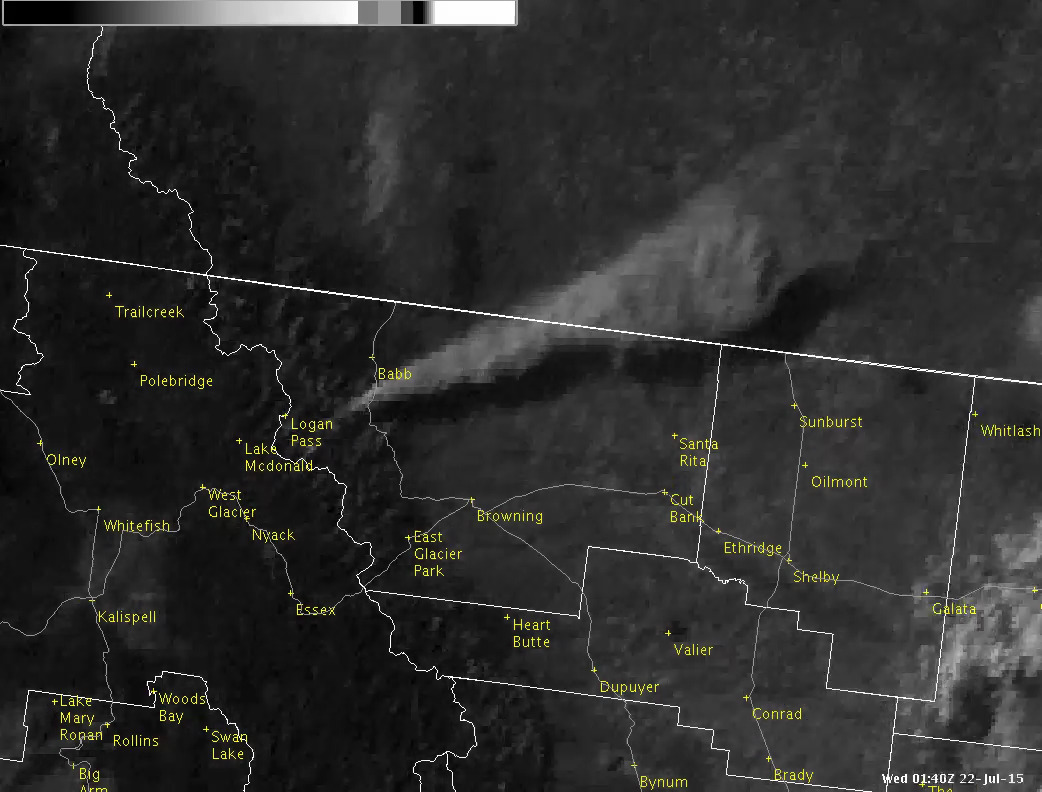
(Plume from Glacier National Park Fire spreads over hundreds of miles in yesterday’s satellite shot. Image source: National Weather Service Great Falls.)
The glaciers of Glacier National Park have greatly retreated during recent years. Many once snow-capped peaks now show only the gray-brown of naked granite. This multi-decadal melt, driven by a 1 C warming of the global climate since the 1880s, has also set the stage for more fire vulnerability. A vulnerability that, this year, hit a new high extreme as powerful heatwaves invaded Montana as well as much of the Canadian and American west. Many regions are now experiencing record wildfires for June and July. Now Glacier National Park can be added to that grim tally.
Links:
Glacier National Park Wildfire Tops 2,000 Acres
Fire at National Park Forces Evacuations
National Weather Service Great Falls
Share this:

Posted by robertscribbler on July 22, 2015
https://robertscribbler.wordpress.com/2015/07/22/glacier-national-park-is-burning/
Heat, Wind Ahead of Pacific Storm Spikes King Fire Hazard; Potential Blocking Pattern Shift Underway
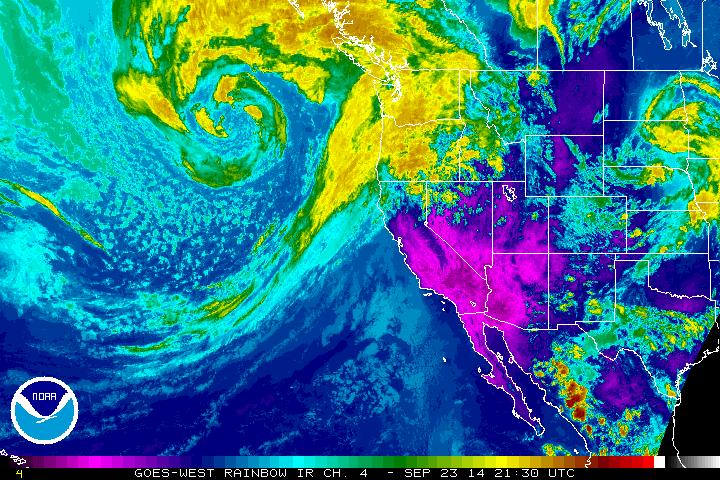
(King Fire Complex fanned by strong, hot southwesterly flow on September 23, 2014 — a rising fire danger through Thursday in advance of an approaching Pacific storm system. Image source: LANCE-MODIS.)
A powerful storm system off the US and Canadian Northwest Coasts may deliver much-needed rains to central and northern California by Thursday — but not before pulling warm, dry winds up from the south in advance of the storm’s approach. The heat and winds, expected to reach 15-25 mph later today, will heighten danger for the over 7,400 firefighters already battling the 90,000 acre King Fire.
As of earlier today, the fire was 35% contained after the army of firefighters, aided by a spate of mountain drizzle, tirelessly worked through the weekend to staunch the blaze. But the new in-rush of hot, dry winds today and tomorrow will fan the still energetic wildfire, increasing the threat to more than 21,000 structures ringing the fire’s edge.
Already, ten people have suffered injuries and 32 structures were destroyed even as 2,700 people are currently evacuated from areas most vulnerable to the still-raging fire. Given the influx of more dangerous conditions, fire fighting personnel will be hard pressed to prevent further damage from an already costly and harmful blaze.
(Strong storm approaches the Western US as the ridge and associated blocking high shift eastward. Change in year and half long blocking pattern? Image source: NOAA-GOES.)
Fire Amidst Record Drought
The King Fire erupted in Central and Eastern California during mid September as century scale drought conditions continued to scorch the state. As of today, more than 50% of the state remains under the most extreme drought level with 100 percent of California suffering from some degree of drought.
This past weekend’s light rains did little to help. However, a strengthening storm track in the Pacific is likely to deliver at least some moisture to Northern and Central California by Thursday. A blocking high pressure ridge that has persisted off the US West Coast for more than a year and a half has also shifted — moving inland toward the Central and Western US. This shift appears to be slowly opening the door to some moisture for California.
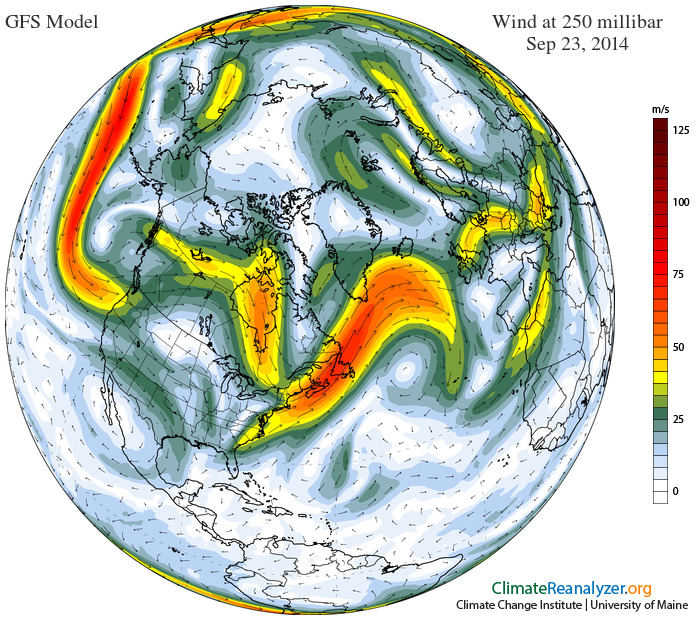
(University of Maine Jet Stream modeling shows an eastward shift in the year and a half long blocking pattern and associated ridge over Western North America and the Northeastern Pacific. In today’s graphic, the ridge has shifted into the Central US with associated Rossby-Wave type troughs over both the Eastern US and Eastern Pacific. Notably both troughs now host powerful storm systems in the range of 975 mb and lower. Image source: University of Maine.)
An atmospheric pattern more favorable for El Nino development may also be favoring increased precipitation for California. However, it is still too early to determine whether a pattern favoring drought reduction is firmly in place.
Conditions in Context
Under the current rapid and powerfully enhancing regime of human-caused heating of the Earth’s oceans, ice, and atmosphere, we can expect the US West and Southwest to continue to dry as the storm track shifts northward and as rising temperatures bake more and more of the moisture out of the soil. A significant increase in the occurrence of drought in the US Southwest since the 1970s is likely a part of this larger trend, one that will almost certainly worsen as human-caused climate change intensifies.
In addition, an increasing eccentricity in the Jet Stream associated with Northern Hemisphere polar heat amplification has resulted in far more persistent weather patterns. Dome scientific studies have found that these patterns, associated with powerful Rossby-type wave patterns in the Jet Stream, have appeared with increasing frequency since the mid 2000s. As a result, cooler stormier patterns tend to persist in one region while dry, hot conditions have tended to persist in other regions. This new climate regime appears to be enhancing an already amplified drought pattern for the US West even as it has pumped up storm patterns for regions east and north. It is also worth noting that a number of studies have also found a link between major sea ice losses in the Arctic since 2007 and the intensity of the current California drought.
Links:
King Fire Update: 2,000 Firefighters add Manpower to those Battling Massive Blaze
Share this:

Posted by robertscribbler on September 23, 2014
https://robertscribbler.wordpress.com/2014/09/23/heat-wind-ahead-of-pacific-storm-spikes-king-fire-hazard-potential-blocking-pattern-shift-underway/
Amazon Rainforest Wildfires Scorch Through Drought-Plagued Brazil During Southern Hemisphere Winter
It’s Winter. Sections of Brazil are experiencing their worst drought in 84 years. Sao Paulo, a city of 9 million, has 97 days of water supply left. And, again, the Great Rainforest is burning.
Over the past few decades a combination of insults including clear cutting, slash and burn agriculture, and rising instances of heatwaves and drought driven by human-caused climate change has resulted in increasingly severe impacts to forested regions around and within the Amazon. Major fires, which were once almost unheard of in the damp, wet regions of the great Amazon delta first cropped up in the late 1980s and early 1990s but have since become more widespread.
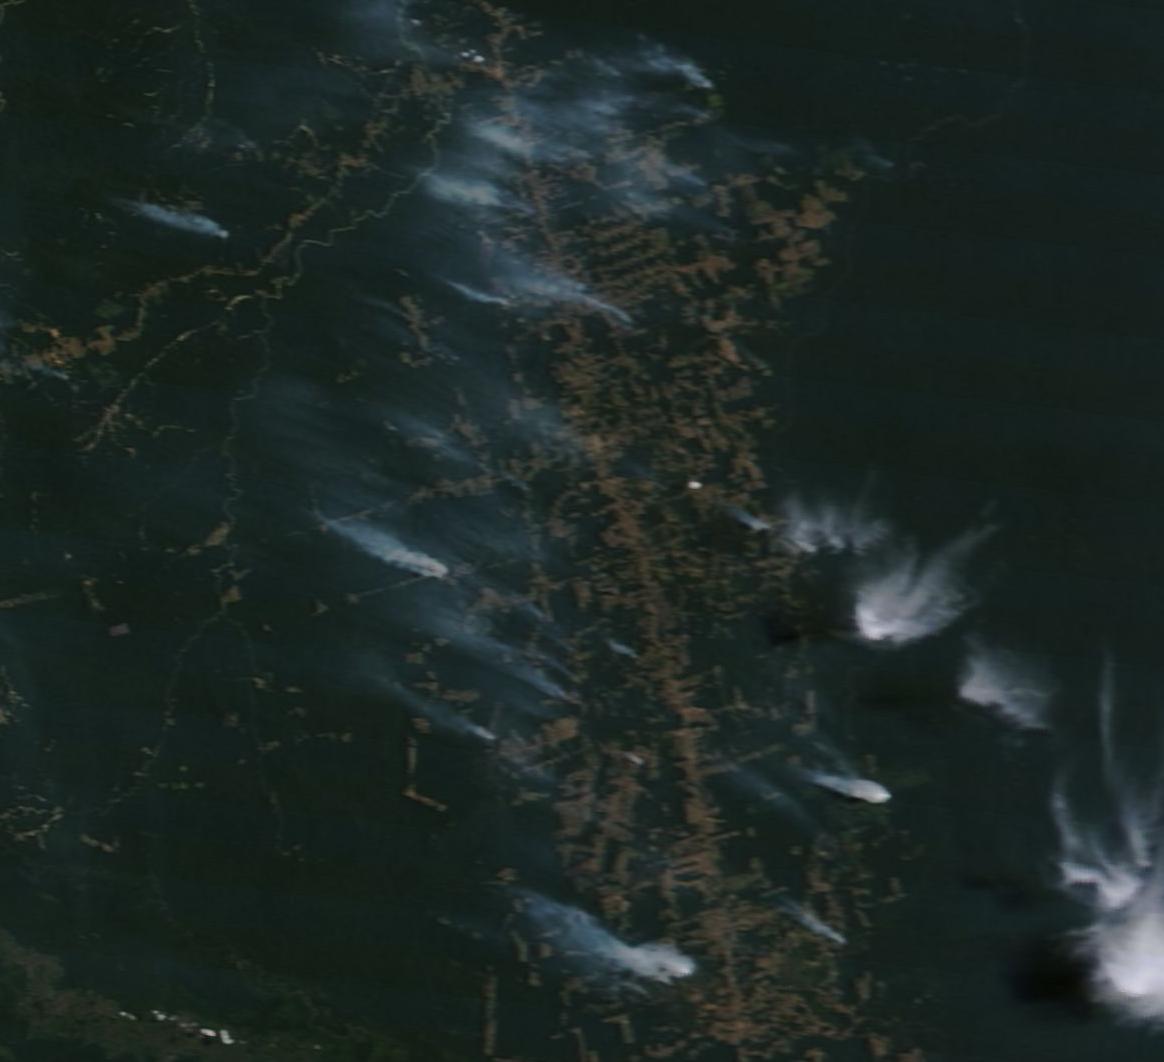
(Wildfire outbreak in the Amazon on August 13, 2014. For reference bottom edge of frame is 180 miles. Image source: LANCE MODIS.)
Now, a combination of basement burning of root systems in the Amazon, heat, and drought are resulting in a kind of existential crisis for a region that has been described by scientists as ‘the Earth’s lungs.’ It is a situation that brings with it the ever-increasing risk of major fire outbreaks. And as of 2012 and 2013, after a period of ever-increasing burning, dry equatorial winters have brought with them extraordinarily severe fires that have torn through forested zones and threatened infrastructure. In one such instance during 2013, a major region-wide blackout was set off by a fire originating in Brazil’s rainforest.
And now the burning has begun anew.
For as of August 13 of this year, large wildfires were erupting within the Amazon near regions of cleared forest and deep within the forest interior. Over the past week, these fires expanded and became more widespread. Now, much of Brazil is under a pall of smoke from wildfires that have expanded to range over a very broad rainforest region.
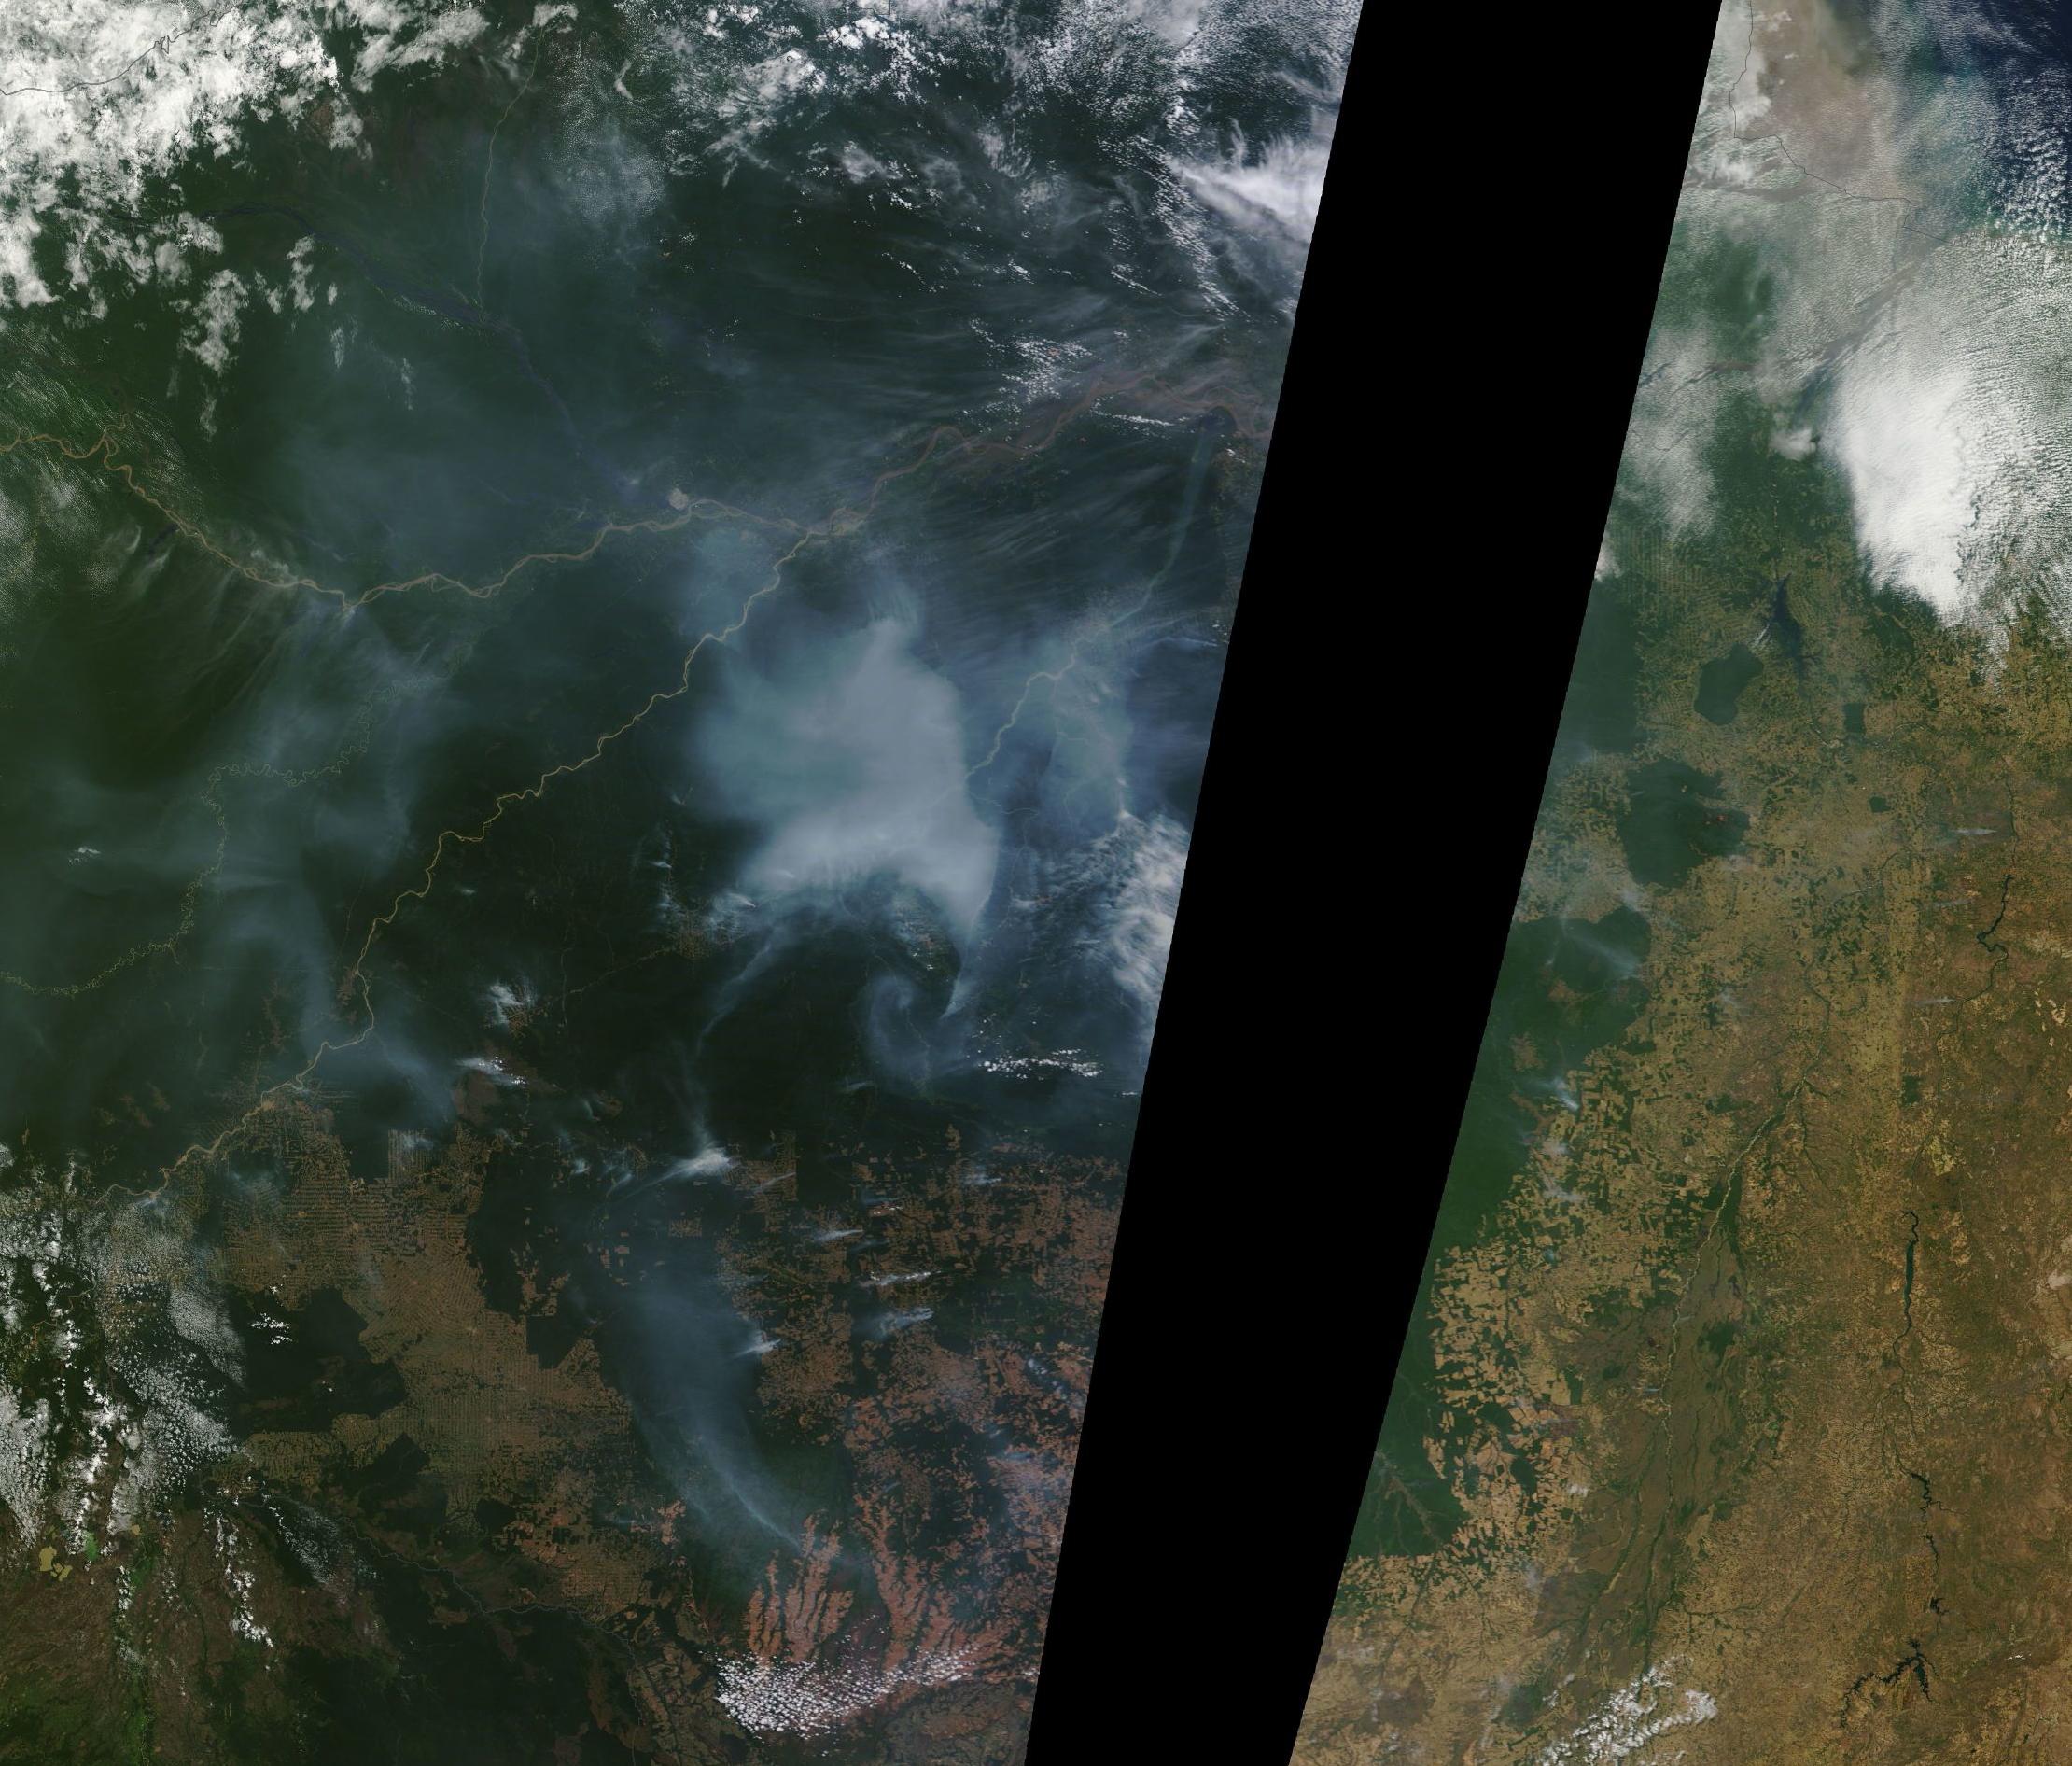
(Smoke from wildfires covering almost all of the Amazon on August 20, 2014. For reference, bottom edge of frame is 1,000 miles and the Amazon River flows from middle left until it terminates at upper right into the South Atlantic. Image source: LANCE MODIS.)
News media and public reporting of fire instances within Brazil are sketchy. But the satellite picture doesn’t lie. Observational estimates place these fires in the range of 500,000 to 1,500,000 acres initially. But given the fire intensity, they are likely to burn on for weeks to months.
Conditions in Context: 3 Percent of the Amazon Lost To Fire From 1999-2010
The new fires originated in a region now known to harbor ongoing understory fires. These fires burn beneath the interlaced root systems of the Amazon and have been discovered to continue to smolder year-round. During times of intense heat and drought, these fires can break through to the surface and more intensely burn through large swaths of forestland. After burning, they sink back into the understory, waiting for another heat/drought trigger.
Last year, NASA published a study which found that fully 3 percent of the Amazon had likely been lost to fires during the period of 1999-2010. A primary culprit for these losses was found to be understory fires, which NASA identified as a significant threat to the Amazon forest system.

(3 percent or 33,500 square miles of a 1.2 million square mile area under investigation burned from 1999-2010 according to a 2013 NASA study. Location of fires indicated in orange.)
Perhaps most significantly, the NASA study implicated climate change as the primary cause for these fires, finding that drought and heatwaves related to increases in human heat trapping gasses had depleted ground moisture levels, resulting in a greatly increased instance of fires.
Post 2010, the satellite record indicates that these fires have continued to grow in intensity. And so the risk to the Amazon expands.
Overall, the Amazon currently stores about 120 gigatons of carbon. It represents about 10% of the global uptake of carbon from the atmosphere through forest tree and plant respiration. But as the Amazon burns and becomes deforested, it shifts from being a carbon absorber to a carbon emitter. Currently, depleted and burning areas of the Amazon are estimated to emit 500 megatons of CO2 each year. And though this has not yet tipped the balance to make the Amazon a net carbon emitter, human climate change and deforestation is driving the world’s largest rainforest rapidly in that direction.
Under human driven climate change and deforestation, the heat and drought situation will only worsen for Brazil. Even without clear cutting, the fires will expand and, eventually, the rainforest will be consumed. Without substantial mitigation action by humans, it is bound to happen. The vast carbon store that is the rainforest will almost certainly begin adding to the already rapacious human heating effect. A process that will continue for decades and will only end once the rainforest is gone entirely.
Links:
Brazil Drought: Sao Paulo Could Run Dry in Less Than 100 Days
NASA Study Shows 3 Percent of Amazon Lost to Fires from 1999 through 2010
Effects of High Frequency Understory Fires on The Amazon Rainforest
Fire Spurs Blackout That Shuts off Power for 50 Million
Hat tip to Bernard
Share this:

Posted by robertscribbler on August 20, 2014
https://robertscribbler.wordpress.com/2014/08/20/amazon-rainforest-wildfires-scorch-through-drought-plagued-brazil/
Song of Flood and Fire Refrain: Epic Canadian Floods Wreck 5.5 Million Acres of Cropland
For the Northwest Territory of Canada, the story this summer has been one of record-setting wildfires. Fires casting away smoke plumes the size of thunderstorms, fires that burn regions of tundra the size of small states. Fires that just burn and burn and burn for weeks on end.
But to the south and east in Saskatchewan and Manitoba, the story is drastically different. For over the past month, unprecedented flooding in this region has wrecked untold damage to Canada’s farmlands.
(Powerful storms over Manitoba and Saskatchewan on July 23rd, 2014. Image source: LANCE-MODIS)
This situation is the result of an odd and wreckage-inducing tangle in the Jet Stream. For hot air has been funneling up over the Northwest Territory for the better part of two months now, pushing temperatures in this Arctic region into an unprecedented range topping the 70s, 80s, and even 90s on some days. This high amplitude ridge in the Jet Stream has been reinforced and locked in place, a result some scientists attribute to the loss of Arctic sea ice during recent years, setting up a hot weather pattern favorable to wildfires.
As the massive Arctic wildfires ignited and burned, they cast off giant streams of smoke, burdening the down-wind atmosphere with aerosol particles — an abundance of condensation nuclei for cloud formation. These smoke streams fell into a trough flowing down over Manitoba and Saskatchewan. The deep trough, often extending far into the Central US formed a kind of trap for storms and, like the fixed ridge over the Northwest Territory, it has remained in place for months on end.
Given this mangled positioning of atmospheric heat and moisture flows, it was only a matter of time before massive rainstorms erupted in the wake of the large-scale Canadian fires. And the result was an unprecedented flooding. The offspring of an unprecedentedly powerful and persistent atmospheric pattern set off by human warming.
Major Floods Wreck Canadian Crops
For some local farmers, the past couple of days have seen 48 hour rain totals in excess of 10 inches. A 100 year rain event at a scale few farmers in the region have ever seen. And the recent floods are just the latest in a series of heavy rainfalls that have been ongoing ever since early July. Flood follows flood follows flood. A progression that has left most farms swimming in inches to feet of water and mud.
In total, farmland encompassing 3 million acres in Saskatchewan and 2.5 million acres in Manitoba are now under water and are unlikely to produce any crops this year. As a result, wheat plantings are expected to decline by 9.8 percent from last year, canola is expected to decline by 5.8 percent from the June forecast, and oat is expected to decline by 6 percent, according to estimates from Bloomberg.
July flooding in these regions has so far resulted in over 1 billion dollars in damages to farmers. As much as half of these losses may not be covered as insurers are still reeling from severe moisture damages during 2011, just two years ago. As a result of the ongoing parade of storm casualties, insurers have also raised deductibles, leaving farmers more vulnerable to the odd and powerful new weather coming down the pipe.
The Part Played By Climate Change and a Mangled Jet Stream
We often hear of the expanding droughts of human-caused climate change wrecking croplands. But the upshot of expanding drought in one region is record downpours in another. And downpours, if they are intense enough, can have a negative impact on crops as well.
The cause of this is as simple as warming’s enhanced ability to evaporate water. For it is estimated by climate scientists that each degree C in temperature increase amplifies the global hydrological cycle by 7-8 percent. That means that current warming of about 0.8 C since the 1880s has resulted in about a 6% increase in both evaporation and precipitation. At the level of weather, this translates into more intense droughts under dry, hot weather, and more intense rainfall events under wetter, cooler weather.

(High amplitude Jet Stream wave pattern fueling wildfires in the Northwest Territory and record floods in Manitoba and Saskatchewan. Note the extreme northward projection of the Jet over the Northwest Territory and the strong, deep, trough back-flowing from Hudson Bay into Manitoba, Saskatchewan and the northern tier of the Central US. Image source: University of Maine.)
One mechanism that has tended to amplify drought and rain events during recent years has been a weakening and intensifying waviness of the Northern Hemisphere Jet Stream. This weakening has been attributed by some scientists to a large-scale recession of Arctic snow cover and sea ice. For since 2007, not one day has seen an average sea ice extent and the range has typically fallen into a zone between 20-50 percent below levels seen during the 1970s and 1980s. New major record low years in 2007 and 2012 have also fueled speculation that sea ice may completely melt away during one summer between now and 2030, 2025, or even 2020 — 50-100 years ahead of model predictions.
As the sea ice serves as a haven for cold air masses, its loss is bound to impact the resiliency of these systems and since a solid pool of cold air to the north is a major driver of Northern Hemisphere upper air currents, the weakening of this cold pool has had dramatic impacts on climates.

(Extreme dipole hot/cold pattern associated with Jet Stream mangled by climate change. Image is for July 14, a match to the above Jet Stream shot. Note the extreme heat in the ridge and the much cooler air in the trough. This is exactly the kind of pattern we would associate with sea ice retreat and Jet Stream weakening. Image source: University of Maine)
For this year, the ridge over Canada’s Northwest territory was a direct upshot in a northward retreat of the Jet Stream over Canada and, at times, into the Arctic Ocean. This set the stage for severe wildfires in the zone of warmth underneath this ridge pattern. To the east, a powerful downsloping trough pulled cooler air into Saskatchewan and Manitoba as well as over the Central and Eastern US. This set the pattern up for cooler than average conditions as well as for strong rainstorms.
The crop-shattering events of July were a direct result of this climate change induced ‘Song of Flood and Fire.’ A pattern we’ve seen repeat again and again over the past few years and one that may well intensify as both time and human-caused warming advance.
Links:
Canada’s Record Rains Cut Wheat Averages to Three Year Low
Is Global Warming Causing Extreme Weather via Jet Stream Waves?
Hat-tip to Colorado Bob
Share this:

Posted by robertscribbler on July 24, 2014
https://robertscribbler.wordpress.com/2014/07/24/song-of-flood-and-fire-refrain-epic-canadian-floods-wreck-5-5-million-acres-of-canadian-cropland/
Mangled Jet Stream Delivers Record-Shattering Heat, Extreme Wildfires to California

(GFS Model 40 hour forecast for May 15 shows 90 and 100 degree temperatures spreading across most of California. Image source: University of Maine. Data source: Global Forecast System Model/NOAA.)
It’s just mid-May, but a wave of record July-like heat and wildfires is building for California and the US West.
A high amplitude Jet Stream wave that has been in place over the US West for more than a year now has resulted in hot, dry conditions throughout this very long period. It is an ongoing insult that contributed to the worst California drought in more than 100 years. A set of weather anomalies that continues to leave California and the US Southwest very vulnerable to heatwaves, fires and amplifying droughts as summer continues to emerge.
The pattern is essentially stuck — featuring a hot, pole-reaching, wave of the Jet Stream continuously rising over the US West, Western Canada and Alaska, and diving deep into the Arctic. It is a condition climate researchers such as Dr. Jennifer Francis attribute to an ongoing erosion and degradation of Northern Hemisphere sea ice. And the predictions of Dr. Francis appear to have born out in both recent observations and cutting edge scientific research showing how sea ice loss has shoved the storm track away from California and the US Southwest (see how Climate Change Made the California Drought Worse).
In any case, it is highly unusual for such an intense Jet Stream pattern to remain fixed for so darn long.
Emerging El Nino Contributes to 100 Degree (F) Heat
In recent months, the strength of the heat flowing up through the Jet Stream wave has been intensified by a growing pool of anomalously warm water to the south in the Eastern Pacific. This gathering pool of intensifying heat is a signal for the coming of El Nino. Come winter, a strong El Nino might bring a radical and violent switch of California weather to much more rainy conditions. But, for now, it lends further energy to a gathering and extraordinary May heatwave for the US West Coast.
It is a flood of heat that is expected to bring 90 to 100 degree plus temperatures for a broad zone from southeast California to the coast and on northward through the Central Valley. And, already, the effect is being felt for some regions. Yesterday, Van Nuys Airport in Los Angeles shattered its previous record high temperature of 91 for the date as temperatures rocketed to 93 F. Today, the forecast is for 98. Tomorrow, 100. Friday 96.
This forecast is for a string of four consecutive all-time record highs during a period in which temperatures hit an extreme range of 18-25 F above the typical daily peaks of 75 for this time of year. Sacramento, meanwhile, is expected to tie the all-time high today at 100 F after reaching the same reading yesterday. Tomorrow’s forecast is for a scorching 101 F. Typical average highs for this time of year in Sacramento are around 80 F.

(Fire approaches El Camino Drive, threatens homes in Carlsbad. Image source: Resident’s Contribution to ABC 10’s Twitter Feed)
Santa Anna Winds, Heat, Drought Spur Large Fires
Rising Santa Anna winds in the range of 40 to 60 mph with maximum gusts as high as 87 mph in the San Diego Mountains combine with relative humidity values below 10% and extreme heat to create a high potential for wildfire outbreaks. As a result, red flag fire hazard warnings have been issued for a zone along California’s southwest coast and into the south-central valleys.
By Tuesday, two large fires — one in Bernardo, San Diego and a second in Miguelito, Santa Barbara — had already erupted and consumed hundreds of acres. The Bernardo fire, by early today, had rapidly expanded to cover more than 1,550 acres forcing the evacuation of over 20,000 people and 1,200 buildings. Three schools and one military base were also evacuated as fires raced through valleys to threaten expensive homes in developments on local ridges. As of late morning, the fire was only 25% contained.
The Bernardo fire, as of this writing, posed a severe threat to many highly populated areas forcing numerous evacuations and even the closing of El Camino Drive. Given conditions on the ground this is a very dangerous situation in which the fire may undergo rapid expansion. Up-to-the minute photos by local residents show rapidly deteriorating and dangerous conditions (see ABC 10’s live feed). People in the area should exercise extreme caution and pay close attention to local fire/weather bulletins.
The Miguelito fire, on the other hand, had grown to 600 acres in just one day as it threatened local ranches. Firefighters had, by late morning, managed to contain 50% percent of that blaze.
Conditions in Context
The most recent record heat spike is likely to only exacerbate current dire drought and fire issues for the state. Local reservoirs remain very low and various water rationing and restriction regimes have already been imposed in numerous districts. Atmospheric moisture levels are also very low resulting in little in the way of evaporative cooling once heating intensifies. The result is a high risk for continued record heat, drought, and fire as spring proceeds into summer.

(Mangled Jet Stream pattern on May 14, 2014 features numerous high amplitude Rossby Waves and hot-cool/east-west dipole patterns. High speed Jet Stream flow is more indicative of a winter pattern, possibly due to the retreat and temporary re-establishment of the polar vortex. But the huge propagation of east-west/hot-cool dipoles and the continued upper level air invasion of the northern polar zone point toward a highly disrupted Jet Stream. Image source: University of Maine.)
Though highly anomalous and extreme for early May, the most recent California heat spike is likely to abate by Friday and Saturday as an onshore wind flow and slight weakening of the ridge is expected to bring cooler conditions. Ongoing high amplitude Jet Stream waves, however, are expected to continue to propagate over the US West Coast with the ridge predicted to again re-strengthen later next week. The added heating of the atmosphere as spring progresses into summer is likely to further exaggerate this already extreme set of conditions. So the atmosphere is rigged for further record heat spikes and the potential for long periods of record or near-record conditions going forward.
UPDATE: By noon, Pacific time, the Bernardo Fire had expanded to 1680 acres and spawned two smaller fires in the San Diego region sending residents in Carlsbad and Poinsettia scrambling. It is difficult to express how dangerous this situation has become. Risk for severe intensification of these fires is very high due to extreme temperatures, humidity in the range of 6% in San Diego, and very strong Santa Anna winds.
UPDATE: Passenger photo by cGilbertRun of three fires plaguing San Diego from inbound airline Wednesday afternoon at 1 PM Pacific Time:

By early afternoon, the multiple blazes continued to expand spurring numerous additional evacuations, cutting off power to homes and businesses, and causing traffic snarls. Emergency authorities urged residents to remain at home or work unless ordered to evacuate to prevent congestion and to speed egress from affected areas.
UPDATE: By 1:30 PM PST, the Carlsbad Fire had spurred another 15,000 evacuations in San Diego. As of this time, the effect of the third fire is unknown.
UPDATE: Blaze near Poinsettia has resulted in an additional 11,000 evacuations. Sporadic reports coming in of three more fires now underway.
UPDATE: 30 homes reported burned in Carlsbad as of 2:00 PST. Unconfirmed reports of 103 F temperature readings in central San Diego.
UPDATE: MODIS shot of fires burning in southwest California and northwest Mexico during satellite pass this afternoon:

UPDATE: Local elementary school apparently damaged in Carlsbad Fire.
UPDATE: Five of the six fires burning in San Diego include: The Carlsbad Fire, The Oceanside Fire, The Highway Fire in Fallbrook, The Camp Pendleton Fire, and the Bernardo Fire.
UPDATE: Seven fires now burning is San Diego. Six are shown on the map below which does not include the Bernardo Fire:

UPDATE: New fire reported in San Marcos, bring the total number of San Diego fires to 8.
UPDATE: Unconfirmed new fire near Black Mountain (5 PM PST). If confirmed, this brings the total to 9.
UPDATE: The San Marcos Fire has prompted yet one more major evacuation. Thousands of residents fled the fire only to get bogged down in gridlock near the blaze. Firefighters are now on the ground to protect San Marcos residences but air support appears delayed, possibly due to multiple fires resulting in a thinning of resources.
UPDATE: Large office building now ablaze due to engulfment by the Carlsbad Fire. Unconfirmed reports of windswept embers falling over portions of San Diego.
UPDATE: DC 10 firefighting aircraft deployed to assist in fighting 8 + fires. Officials state that Carlsbad fire is now 10% contained, forward progress of Lakeside fire halted. Anti-looting guards set up to protect evacuated Carlsbad residences. Carlsbad officials: “It’s unbelievable, this is something we should see in October, not May. I haven’t seen it this hot, this dry in May before… this is an extraordinary weather event.”
All too apt tweet from King Pine Homes: “8 fires in North County SD right now. Climate Change sucks!”
UPDATE: National Weather Service shows 4+ all-time record highs for the day broken in the San Diego region with readings topping out between 93 and 99 degrees.
Warmest thoughts and wishes go out to both the brave firefighters and to all the families in the affected regions. Please stay safe!

(View from San Marcos as night falls over San Diego by GradyGray.)
UPDATE: San Diego County will hold a news conference at their County Emergency Operations Center (EOC) at 8:30 local time.
UPDATE: Governor Brown has just declared a state of emergency for all of San Diego County, noting: “I find conditions of extreme peril to the safety of persons and property.”
UPDATE: According to reports from the California Fire Service, the Tomahawk Fire has now burned over 6,000 acres and is now encroaching on Camp Pendleton.
UPDATE: 9,196 acres confirmed burned in San Diego County today.
UPDATE: The San Marcos Fire has spread to cover 500 acres is just a few hours.
UPDATE: Must-see footage of the Carlsbad Fire filmed by a passing driver earlier today:
FINAL UPDATE: Firefighters gained ground last night against the 9 fires that sent tens of thousands of San Diego residents scrambling yesterday. The Carlsbad Fire, the most destructive of the outbreak, was 60% contained as of early this morning. Another destructive blaze, the San Marcos Fire, had expanded to 700 acres by morning as firefighters focused resources to contain it. In total, more than 10,000 acres in and around San Diego have burned and more than 25 buildings have been destroyed. Thankfully, there is no report of loss of life.
Such a severe outbreak of early season fires is unprecedented so soon in the year. Seasoned fire officials, such as San Diego Fire Chief Michael Davis, have been aghast at the early extreme intensity of this fire season. Davis noted:
This is May, this is unbelievable. This is something we should see in October. I haven’t seen it this hot, this dry, this long in May.
Human-caused climate change, again, appears to have shown its awful hand in California this spring.
As firefighters and residents alike return to some rough allegory of normalcy this morning, dangers remain high. Record and unprecedented heat and dryness is, once more, settling over the region today, bringing with it the danger for more fires.
Links:
Global Forecast System Model/NOAA
Weather Underground Forecast for Sacramento
Weather Underground Forecast for Van Nuys Airport
National Weather Service Public Information for San Diego CA
California Wildfires: Hot, Dry Windy Conditions Expected Again Wednesday
Climate Change Made the California Drought Worse
ABC 10’s live feed of Bernardo Fire
Hat Tip to Andy (in San Diego very close to these fires and whom we wish to remain safe)
Hat Tip to Kevin Jones, and Mark from New England
Share this:

Posted by robertscribbler on May 14, 2014
https://robertscribbler.wordpress.com/2014/05/14/mangled-jet-stream-delivers-record-shattering-heat-wildfires-to-california/
When April is the New July: Siberia’s Epic Wildfires Come Far Too Early

(NASA LANCE MODIS Rapid Fire hotspot analysis of extreme fire outbreak in the Amur region of Russia on April 28, 2014. In this shot, the Amur runs west to east through the frame. To the right is the Pacific Ocean [off frame] to the left is a corner of Russia’s massive Lake Baikal. The red spots indicate currently active fires. Image source: LANCE-MODIS)
What we are currently witnessing is something that should never happen — an outbreak of fires with summer intensity during late April at a time when Siberia should still be frigid and frozen.
* * * * *
Last year, during late July and early August, a series of epic wildfires raged to the north and west of Russia’s far eastern Amur region. About a week later, the skies opened up in a ten-day-long deluge that pushed the Amur River bordering Russia and China to levels not seen in the entire 150 year span of record-keeping for the region. Whole cities were submerged as the Amur leapt its banks to form a kind of massive inland sea.
The floods promoted strong growth in the region, penetrating permafrost zones to enhance melt, providing major fuel sources for fires should they re-emerge. Come winter, a persistent warm ridge pattern in the Jet Stream transported hotter than usual air over this region. The winter was far, far warmer than it should have been. And when spring came, it came like the onset of summer.
Last week, temperatures soared into the 70s and ever since the beginning of April, freakishly large fires for so early in the burn season erupted. By April 23rd, the Russian fire ministry had logged nearly 3,000 fires. The outbreak was so intense that, just a few days ago, more than 5,000 pieces of heavy equipment and an army of firefighters were engaged throughout a large stretch of Russia from the still frozen shores of Lake Baikal to the far eastern Amur region.
But last night’s LANCE-MODIS satellite pass brought with it unexpected new horrors:

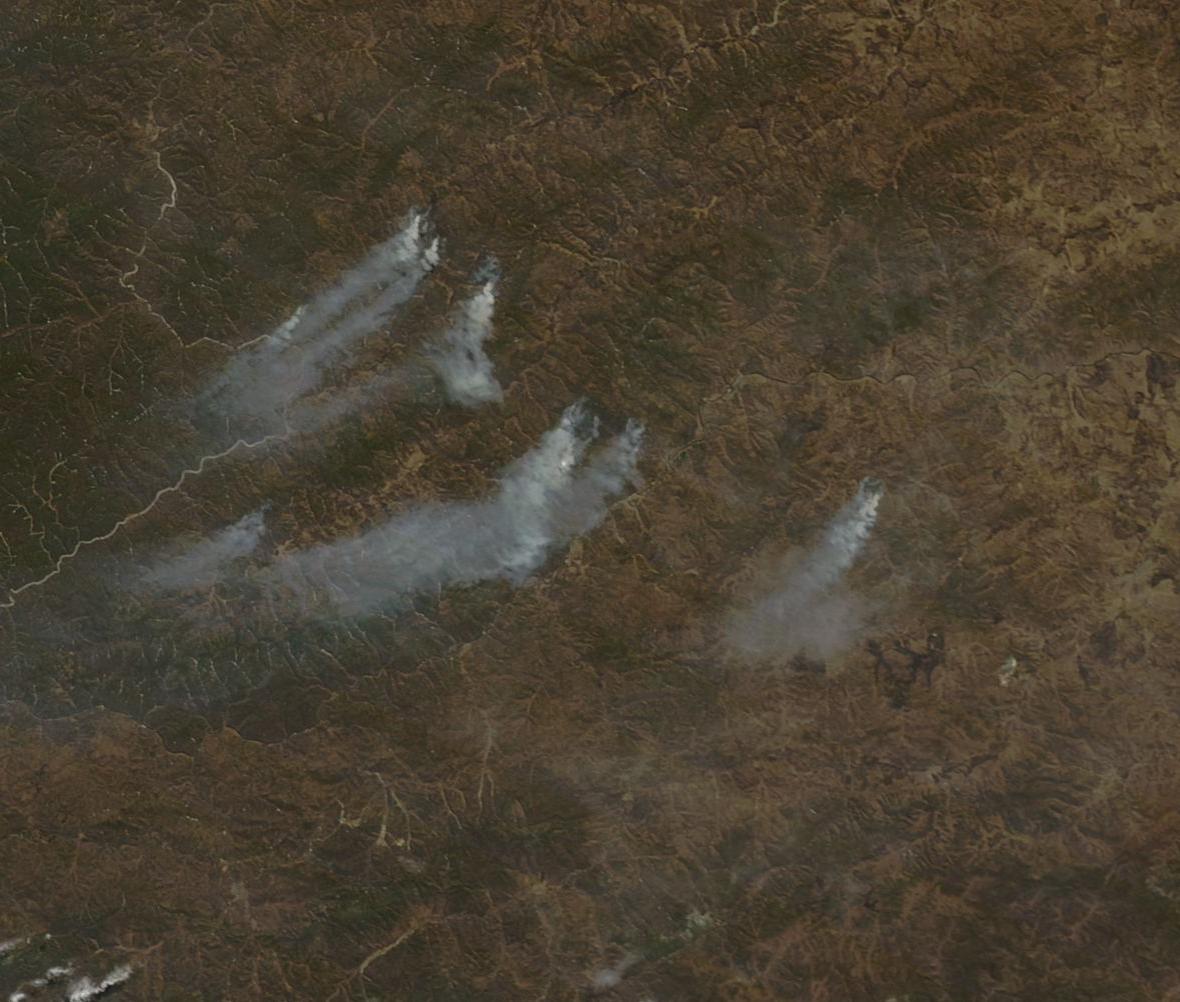
(Two massive wildfires in excess of 200 square miles burning in the Amur region of Russia on April 28, 2014. Image source: LANCE-MODIS.)
Two massive burn scars devouring huge sections of land in the Amur region of Russia.
For scale, the ribbon of blue traveling north to south beneath the first massive fire is a mile-wide tributary to the Amur river called the Zeya. Using the scale provided by LANCE MODIS, we see that the fire at upper left is currently about 15 x 18 miles (270 square miles) in area and that the fire at lower right is about 23 x 20 miles (460 square miles) in area.
Even during Russia’s recent global warming-spurred epic fire seasons of 2010 to 2013 fires of this scope and obvious visible intensity didn’t come up in the satellite imagery until the most intense periods of summer heating during late June through early August. Today, we have monster fires comparable to those which burned during Russia’s worst ever recorded fire seasons, at their height, burning next to snow covered regions in late April.
As a last reference, look at the ice covered river in the far lower right corner of the above image. That swatch of crystalline white — yes, it’s a large estuary apparently being dwarfed by the massive fire burning just above it. Beneath wide body of still frozen water is what appears to be a ‘small’ plume of smoke. It’s worth noting that this smoke plume issues from a recently burned region covering fully 15 square miles. By comparison, the fires above each cover areas comparable to Guam, half of Rhode Island, or the massive ice island recently broken off from the now doomed Pine Island Glacier (PIG) — B31.
Unfortunately, these massive fires aren’t the only blazes covering extraordinary swaths of Russian land during late April. Moving west to the shores of the still partly frozen Lake Baikal, we find numerous fires burning beneath a sea of smoke in the lowlands between two, still snow-capped highlands.

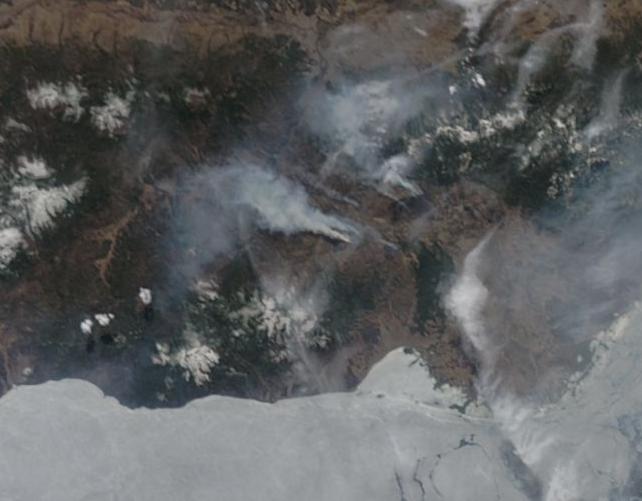
(Sea of Smoke and Fire north and west of Lake Baikal on April 28, 2014. Image source: LANCE-MODIS.)
The entire roughly 200 x 200 mile (40,000 square mile) region is covered by the steely gray smoke of previous and ongoing blazes. Peering down through the dense shroud, we see numerous thick smoke plumes issuing from still out of control fires. The freakish prematurity of these blazes is readily apparent in the visible ice still covering much of Lake Baikal and also in the snow still doggedly clinging to the nearby mountainous highlands.
A vicious combination of thawing permafrost, a rapid increase in average temperatures throughout Siberia and driven by human warming, and the vulnerability of the active soil layer and related vegetation to rapid drying appears to be turning this region into an ever more explosive fire trap. Risk of wildfire is dependent on both heat and fuel. But with the permafrost containing an almost inexhaustible layer of either drying peat or venting methane and with temperatures now rising at twice the already rapid global rate, the potential for burning in or near the violatile permafrost thaw zone may well be practically unlimited.
These extraordinary and anomalous conditions, combined with a very intense early season warming, what appears to be a persistent and developing heat dome over Eastern Russia and adjacent Arctic Siberia, a very rapidly receding snow line, and, potentially, an amplifying effect from an emerging El Nino in the Pacific, results in a very high continued risk for both extreme and record fires throughout the spring and summer of 2014.
Links:
Russia Experiences Great Burning
A Dangerous Dance of Frost and Flame
100 Fires Burn 12,000 Hectares in Russia
Doomed Pine Island Glacier Guam-Sized Iceberg into Southern Ocean
Hat tip to Colorado Bob
Share this:

Posted by robertscribbler on April 28, 2014
https://robertscribbler.wordpress.com/2014/04/28/when-april-is-the-new-july-siberias-epic-wildfires-come-far-too-early/
A Dangerous Dance of Frost and Flame: More Than 100 Wildfires Now Raging Along Siberian Melt-Freeze Line
Anomalous, global-warming-enhanced, fires continued to erupt across Eastern Russia this week, chasing a rapidly receding freeze line north and into zones still frozen, but starting to shake off ice cover far too soon for comfort.
According to reports from Radio Free Europe, more than 5,000 pieces of heavy equipment and many more firefighters are now battling blazes throughout Siberia this week. As of April 20th, more than 100 blazes were reported in numerous regions including: the Orenburg area around Lake Baikal, the Amur region, the Birobidzhan Autonomous Oblast, the Primorsky Krai, and the Far Eastern region of Russia.
(Multiple wildfires raging in the Amur region of Russia on April 23, 2014. Image source: LANCE-MODIS.)
The fires come as temperatures ranging from 5-18 C above average continued throughout a region that has experienced hotter than normal temperatures all winter and on into spring of 2014.
For example, the average April high temperature for the region of Lake Baikal is typically a frigid 28 F, while this week is expected to see highs in the lower to middle 40s. Further east, the temperature extremes are more radical. In Amur Blagoveshchensk, the average low is about 27 degrees F for this time of year, the average high, about 50. But today the low was 52 and the high is forecast to be 78 — 25 and 28 degrees above average respectively.
All across Eastern Russia, the story is the same: above average warmth, early thaw, summer-like temperatures in spring time. It has been this way day after day, month after month. Since 2010, the story has mostly been the same: early thaw, record or near record heat, amazing fire hazard. Even more concerning, the situation is steadily growing worse.
How Global Warming is Turning the Siberian Tundra into a Firetrap
Winters during cold regions are typically comparatively dry events. Though snows may pile up, the water content of the snows amount to much less moisture than it would seem. During spring, a gradual thaw ensures this moisture keeps the thin, top layer of soil above the permafrost (called the active layer) from drying out too rapidly. Typically only inches to a few feet in depth, this layer is far more susceptible to drying than a deeper layer with access to greater moisture sources at depth. But only frozen or melting permafrost currently rest below the active layer, creating a moisture barrier or worse — adding a potential fuel source for wildfires.

(Eastern Russia in a hot zone. Hot atmospheric ridge and coincident extreme temperature anomalies stretching from Southeast Asia, up through China and Eastern Russia and on up through the polar region. Information Source: NOAA Global Forecast Systems Model. Image source: University of Maine.)
In years of warmer than usual temperatures, as has happened more and more often under the current regime of human-caused warming, the thaw occurs rapidly and the active layer quickly dries out. This loss of moisture amplifies into a kind of tundra drought that can block atmospheric moisture flows and prevent rainfall, compounding the drying problem until the more energetic storms of summer arrive.
In addition, expanding zones of thawing permafrost provide two added fuel sources for wildfires. Tundra melt in high water content areas forms into wet thermokarsts, mires or melt ponds that vent methane gas in high enough concentration to burn. Tundra melt that rapidly dries after thaw forms into a peat-like basement layer that can burn and smolder for long periods once ignited.
On average, temperatures have been rising by about .4 C per decade throughout Siberia. So almost every spring now falls into what would typically be called a hot year. In addition, amplification of Jet Stream wave patterns deliver proportionately more heat to regions in the up-slope of these high amplitude atmospheric pulses, forming hot, high pressure ridges. And this year, the heat ridge has consistently formed over China, Mongolia and Eastern Siberia — the region of the current large fire outbreaks.
(Siberian wildfires burning on the shores of still-frozen Lake Baikal in southern Siberia on April 23, 2014. Image source: LANCE-MODIS.)
As a result, what we are seeing is an extraordinary outbreak of intense wildfires directly adjacent to still melting snow and frozen lakes. A surreal event that reminds one of the ever-at-war frost and fire giants of ancient Viking legend. But these giants, the fire giants at least, are a direct result of an ongoing and ever increasing human-caused heating of our world.
Links:
NOAA Global Forecast Systems Model
Melting Permafrost Switches to Nasty, High-Gear Methane Release
Share this:

Posted by robertscribbler on April 23, 2014
https://robertscribbler.wordpress.com/2014/04/23/a-dangerous-dance-of-frost-and-flame-more-than-100-wildfires-now-raging-along-siberian-melt-freeze-line/
A Siberian Heat Wave is Breaking Kara Sea Ice In March, So is it Time to Start Thinking about Hot Arctic Rivers?
There’s a heatwave in Dickson, Russia today. But if you were standing on the shores of this port city on the Kara Sea in the far north, you might not realize it. The forecast high? 29 degrees Fahrenheit.
Dickson is located about 500 miles north of the Arctic Circle and 1,000 miles south of the North Pole. To its west is Novaya Zemlya, a sparely inhabited and typically frozen island between the Kara and Barents Seas. To its east is Siberian Khatanga and Severnaya Zemlya an island system that, until 2005, sat in a pack of Arctic sea ice so dense and resilient, it was once possible to ski from Severnaya all the way to the North Pole even at the height of Northern Hemisphere summer. No more. The sea ice is now but a thin and wrecked shadow of its former glory.
Ask any resident of this, typically frigid, coastal town and they’ll tell you that today it’s abnormally warm, even hot for this far-north locale. For the average high for this day in Dickson is about 1 degrees Fahrenheit. Typical daily highs of 29 degrees (F) don’t normally appear in Dickson until mid-to-late June.
So, in essence, summertime has arrived in Dickson in March and there we see temperatures that are a shocking 28 degrees Fahrenheit above average. Human caused climate change at its most brazen. But we haven’t seen a thing yet…
As we can see in the map below, Dickson is but one location sitting beneath a vast and spreading Siberian and Arctic heatwave:

(Global temperature anomaly map for March 20, 2014 shows world temps +.65 C above the, already hotter than normal, 1979-2000 baseline and Arctic temps at +3.12 C. Note the large heat pool over Siberia. Image source: University of Maine.)
A heatwave extending from the Pacific Ocean in the east to the borders of Mongolia and China in the south. From Surgut in the west and on deep into the Arctic Ocean’s Laptev and Kara Seas in the far north. And it is vast, covering an area roughly 2,000 by 2,000 miles at its widest points. But the heatwave is not disassociated from other high temperature anomalies. It flings a wide outrider over the Beaufort Sea and the Bering Strait. And it sits in a broad flood of warmer than average air riding over Europe, the Middle East and Asia.
This Jet Stream entrained warm air feeds the heatwave even as pulses of much warmer than normal air rise up from the deserts of Western China over Mongolia and up into Russia to give it an added kick. The connecting pattern is a high amplitude Jet Stream wave surging past the Arctic Circle and deep into the Arctic Ocean. It is the kind of high amplitude pattern that, over recent years, has been implicated in so many extreme Arctic heat invasions and related severe weather events.
Temperatures in the far north of this hot zone range from 10 to over 36 degrees Fahrenheit above average for this time of year. For Siberia and the Arctic Ocean it is a heatwave of just below freezing and slightly above freezing temperatures. In other words — what, until recently, used to be summer-like conditions.
Heat Wave Breaking up Ice in the Kara Sea
Such anomalous warmth is enough to put a heavy strain on sea ice. The ice freezes and melts at around 28 degrees F. So extended periods near or above this temperature can have an impact on ice integrity. The ice gets hit by warmer air even as it floats over warmer waters. It’s a kind of one-two punch that can be pretty devastating to sea ice integrity.
And we see just this kind of situation over the past two weeks in the region of the Kara Sea near Port Dickson.
Normally, this frigid ocean zone is covered in a stable sheet of ice called land fast ice. The ice is anchored to the land at various points and tends to remain solid due to reduced movement caused by grounding on the surrounding land features. When the land fast ice starts to go, it usually presages melt.


(Break-up of Kara sea ice and land fast ice. Top frame shows the Kara on March 7, bottom frame shows break-up visible on March 17. Note that cloud covers a portion of both images and that the March 20 image — the most recent — is too obscured by cloud for detailed analysis. Image source: Lance-Modis)
With the recent influx of much warmer than normal air from the south, this is exactly what we see. A widespread breaking up of Kara sea ice and of even the more resilient features fixed to surrounding lands and islands. And as you can see in the lower frame image, the break-up is quite extensive and dramatic.
The current warm pulse is expected to last for the next few days before shifting back to Svalbard by early to mid next week. Meanwhile, overall Arctic temperatures are expected to remain between 2.5 and 5 C above the, already warmer than normal, 1979 to 2000 average all while a trend establishes that continues to feed warm air pulses up over Asia and into the Arctic Ocean zones of the Kara, Laptev and East Siberian Seas.
Abnormal warmth gathering over the continents in this way can cause both early melt and large flushes of warm meltwater into the Arctic Ocean. An issue that is specially relevant due to recent NASA studies of another section of the Arctic Ocean — the region north of Canada and the Mackenzie River Delta called the Beaufort Sea.
Warm Rivers Heat the Arctic Ocean, Melt Sea Ice
The NASA study found that large pulses of warm water from continental rivers are a strong mechanism for transporting heat into the Arctic and, over recent years, are one of many factors resulting in the sea ice’s rapid recession.

(Heat flux from Canadian Mackenzie River into the Beaufort Sea during recent melt years. The first image shows sea surface temperatures on June 12 of 2012 before the Mackenzie River discharged and on July 5, 2012 after. Note the ocean surface water temps rising by as much as 10 C between frames. Image source: NASA.)
The NASA study found that large heatwaves warmed the continents and that this caused continental rivers to disgorge warm water into an already warming Arctic Ocean. The findings showed significant contributions from warm rivers to rising sea surface temperatures and sea ice melt during recent Arctic summers including the record melt year of 2012.
As the Arctic experiences increasing pulses of summertime temperatures during late winter and into spring, it is likely that warm water discharge and overall warmth will play a role at the transition between sea ice freeze and melt season. And this thought brings us back to Russia which appears to be stuck in the abnormally warm pattern covered above. A pattern that, should it continue to flicker and swell, may well bring a surge of warmer than usual water into the Kara, Laptev and East Siberian Seas come later this spring and on into summer. A blow to sea ice that may well emerge but that we can ill afford.
Links:
NASA: Warm Rivers Play a Role in Arctic Melt
Share this:

Posted by robertscribbler on March 20, 2014
https://robertscribbler.wordpress.com/2014/03/20/a-siberian-heat-wave-is-breaking-kara-sea-ice-in-march-so-is-it-time-to-start-thinking-about-warm-arctic-rivers/
For Arizona and New Mexico, Climate Change and a Mangled Jet Stream Means Fire Season Now Starts in February

(500 acre wildfire burns near Isleta in New Mexico on February 19th. Image source: KOAT)
It’s late winter in Arizona and New Mexico. Or at least that’s what the calendar says. During this time of year, snow packs should grace the mountain peaks and cool breezes should blow down into the valleys. A train of west coast moisture should be riding over the mountains of California, bringing with it the occasional snow or rainstorm.
Not so this winter. The blocking pattern over the west coast has mostly held strong — pumping warm, dry air up from the southwest. This warm flood has resulted in continued severe drought conditions ranging from Texas through New Mexico, Arizona and Nevada. Most of California still reels under the worst drought seen in at least a century. While according to reports from the US Drought Monitor, New Mexico experienced its driest January on record. And though the 10 month long blocking pattern barring the Pacific moisture flow briefly fluttered in early February, it has since reasserted itself.

(Drought Monitor showing 60% of the Western US suffering from some level of drought. Image source: United States Drought Monitor.)
The result, for Arizona and New Mexico, is unprecedented. For all across these states, weather conditions are pointing toward the beginning of an entirely different season. Humidity levels are excessively low. Temperatures are warm or abnormally warm. And abundant dessicated vegetation covers the hills and valleys. It is a set of conditions that usually don’t begin to ramp up until May. The season of burning and of combustive heat — fire season. In February.
0.1 Inches of Rainfall, Brush Fires Encroaching on Cities
One needn’t look too far to find causes for an early emerging fire hazard. The region of Tuscon, for example, only received a tenth of an inch of rainfall throughout the entire month of January. Throughout February, moisture levels have remained exceptionally low with relative humidity often ranging into the single digits. The result is that vegetation which briefly exploded during a period of abnormally intense rainfall this summer has become withered and dessicated, providing ample and highly combustible fuel should any ignition source emerge.
These are the conditions we should expect as a result of human caused climate change — very intense precipitation followed by very intense dryness along with Jet Stream patterns that tend to become stuck as Arctic sea ice loss and polar amplification in the Arctic accelerates.
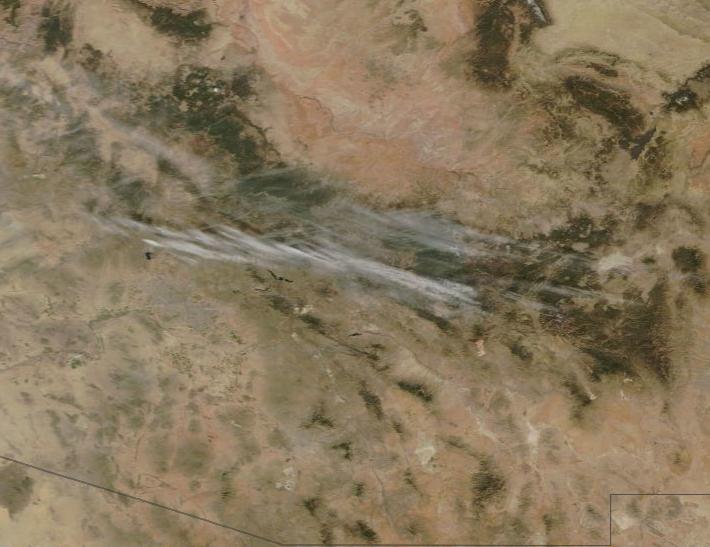
(Smoke from sporadic brush fires visible over regions of central and southern Arizona and New Mexico that are now virtually devoid of any snow pack, even in February. Image source: Lance-Modis/NASA.)
Even worse, the snow packs for the region, which for years have been steadily receding under a regime of increasing temperatures, are now practically non-existent. Snow pack usually aids in the suppression of ridge and mountain fires until late spring by locking in soil moisture, adding moisture to dry air, and creating runoff that is a natural barrier to fires. Not so for 2014 as there is simply no snow pack to speak of.
In addition to the 500 acre Isleta New Mexico fire, such dry conditions have already led to a spate of brush fires that have encroached on major cities in the region, prompting officials to warn of the, above mentioned, very early start to fire season. According to reports from the Arizona Daily Star:
The recent warm weather, dry conditions and a spate of brush fires on the outskirts of major cities of Arizona and New Mexico are prompting warnings that the 2014 wildfire season is already underway.
The result is that fire warnings have been raised as tinder-box conditions of low humidity, temperatures ranging into the upper 70s, strong winds, and amply abundant fuel persist and intensify. And given that the fire risk began in February, we can expect a very, very long fire season ahead.
Winter Fires Ranged from California to the Arctic in 2014
Unfortunately, Arizona and New Mexico were not the only regions suffering from winter fire seasons during early 2014. California, suffering its worst period of drought in at least 100 years, saw a set of powerful fires rage through Colby near Los Angeles in January. Meanwhile, freakish fires burned near the Arctic Circle in Norway just a week later. Now Arizona and New Mexico add an initiation of fire season in February to the unprecedented tally.
Links:
Fire Season Already Underway in Arizona
2000 Acre Colby Fire Rages Near Los Angeles in Winter
Hat tip to Collapse of Industrial Civilization
Share this:

Posted by robertscribbler on February 20, 2014
https://robertscribbler.wordpress.com/2014/02/20/for-arizona-and-new-mexico-climate-change-and-a-mangled-jet-stream-means-fire-season-now-starts-in-february/
Arctic Wildfires In Winter: Norway Experiences Freakish Historic Wildfires In January

(Flatanger Fire during the long winter night in Norway. Image source: NRK)
Major wildfires in California in winter are bad enough… Unfortunately, now we must include the Arctic to the anomalous tally. For since December, three major wildfires have erupted in Arctic Norway, with two of these extraordinary fires blazing through coastal Nordic settlements just this week.
* * * * *
On Monday, a major wildfire erupted along the western coast of Norway near the city of Flatanger. The fire, fanned by winds ranging from 30-50 miles per hour and by a drought in which almost no precipitation has fallen since Christmas spread rapidly, rushing over the mountainous terrain to put both life and livelihood at risk.
As of Wednesday, the fire had exploded to the largest wildfire recorded in Norway since World War II. It had also consumed 139 homes as it raced down the rocky mountain sides of western Norway.
By late Wednesday, as firefighers struggled to bring the Flatanger fire under control, a second massive fire erupted on the island of Froya about 80 miles to the south and west. The fire exploded with such ferocity that 430 residents were forced to evacuate as flames and smoke rushed down along the hillsides. As of Thursday, the Froya fire still burned out of control, threatening to spur evacuations from other settlements in the path of the blaze.

(Aerial Photo of the Froya Wildfire. Image source: News in English)
The Flatanger and Froya fires mirrored another large blaze that erupted in Norway during early December, consuming 40 homes near the town of Laerdal. The Laerdal fire coincided with a period of excessive warmth and drought, with December marking one of Norway’s warmest winter months ever and Oslo experiencing its hottest Christmas since record keeping began in 1937.
Needless to say, it is not at all normal for Norway to experience wildfires of record intensity during winter time. A clear sign that climate change together with a mangled jet stream and extreme polar amplification are well in play to create dangerous and freakish conditions.
“Just a month ago, no one would have said there was a threat of brushfires in Trøndelag at this time of year,” noted Dagfinn Kalheim, director of the Norwegian fire prevention association. Now, they’ve experienced three of their worst fires on record during winter. Unfortunately, in the context of a warming globe and related human-caused changes to the atmosphere, land and sea, locations around the world and especially around the Arctic Circle are under the gun to experience ever-worsening fires.
Drought, Fuel, Wind, Ignition
Western Norway has been in the midst of an ongoing drought since late fall. The drought, spurred by a ridge in the polar Jet Stream has steered storms away from the usually wet Norway and slammed them over and over into the British Isles, France and Spain. The drought left mountain scrub and thawing tundra in the region very dry and vulnerable to fire. This anomalous period also included one of the hottest Decembers in Norway’s reckoning.
In recent years we have seen increased fire vulnerability in far northern regions due to thawing tundra, increasing periods of heat and drought, and, possibly, maritime emissions of flammable gasses. The tundra is full of organic material and, in certain regions, emits methane in high enough concentrations to burn. The Arctic seas have also been emitting high volumes of methane and related flammable gasses, but it has not been determined that these emissions come in high enough concentration to add a potential secondary ignition source. Though a cause has not yet been determined for the historical Flatanger fire, it is likely that a combination of drought, related dry scrub and the yearly advance of thawing tundra in the region contributed to the intensity of the blaze.
Strong winds over the drought-stricken coastal region enabled the fire, which would generally be suppressed by temperatures near freezing, to rapidly spread through the tinder-dry underbrush and sporadic regions of thawed tundra. Fire fighters have been unable to locate an ignition source at this time.
You can watch a video of this anomalous blaze racing down the Flatanger mountainsides here:
(Video source: Se Flammen Fra Luften)
Climate Change Context
Climate change drives both increasing heat, extended periods of drought in previously damp regions, and changes to the environment, especially in the Arctic, that provides more fuel for wildfires. In addition, more numerous Arctic thunderstorms provide an expanding ignition source for these blazes while the Arctic Ocean and adjacent tundra now emit prodigious volumes of methane.
It is also worth noting that both the World Meteorological Organization and UN Climate Chief Christiana Figueres have both established an ‘absolute’ link between human caused warming and increasing numbers of wildfires. And the fact that we are seeing the eruptions of major wildfires throughout the Northern Hemisphere during winter, a time when wildfires hardly ever occur, is yet more evidence that the situation is growing ever more extreme.
Unfortunately, the weather forecast for Norway shows continued dry conditions for at least the next two weeks. In addition, a period of warming is expected to bring temperatures 7 degrees (Celsius) or more above seasonal averages over the coming days. With higher temperatures and dry, southerly winds continuing to blow, Norway remains under the gun for extreme winter wildfires.
Links:
Most Extensive Wildfire Since World War II
Fire Sweeps Across Peninsula in Northern Norway
Climate Change is Absolutely Linked to Wildfires
Northern Europe Experiencing one of its Mildest Decembers on Record
Mangled Jet Stream Sparks Drought, Winter Wildfires in Southern California
Share this:

Posted by robertscribbler on January 30, 2014
https://robertscribbler.wordpress.com/2014/01/30/arctic-wildfires-in-winter-norway-experiences-freakish-historic-wildfire-in-january/
Mangled Jet Stream Sparks Drought, Winter Wildfires in Southern California — Colby Fire Explodes to Nearly 2000 Acres in One Day

(The Colby Fire as seen from satellite. Image source: NASA)
Major wildfires in winter? It may sound odd, but that’s what’s happening in a California suffering under a climate-change spurred drought that is currently its 9th worst on record.
Yesterday, beneath a dry dome of high pressure and spurred by Santa Ana winds, the Colby fire sparked in a populated suburb of Los Angeles amid a deepening California drought. Today, the fires exploded into a nearly 2,000 acre monstrosity. The blaze, fueled by 30 to 50 mph winds was proving difficult to contain as over 500 firefighters rushed to the scene in an effort to keep it from leaping down into nearby population centers. Mandatory evacuations were in place for hundreds of residents as the fire aggressively advanced toward homes and places of work.

(Colby Fire threatens local businesses. Image credit: Julie Palagyi)
Red flag warnings are now in place for many LA counties, which are expected to experience continued strong winds, above average temperatures, and single-digit humidity over the next 24 hours. Such conditions are conducive for the further spread of the Colby fire as well as for the sparking of additional blazes throughout the LA region.
Abnormally Warm, Abnormally Dry
Wildfires are rare in California this time of year. During winter, the region typically experiences wetter, rainier and cooler conditions as storms flow in off the Pacific Ocean. But this year, a powerful blocking pattern has forced warmer, drier air over the region. It is the other side of the same blocking pattern that is flooding the Arctic with above average temperatures while disrupting the polar vortex and resulting in episodes of extreme weather over the eastern and central US.

(Jet Stream Pattern for Thursday and Friday. Image source: University of Washington.)
Note the very high amplitude ridge pushing up from California all the way into central Alaska and the corresponding trough digging down into the eastern US and pushing all the way to the Gulf of Mexico. This image is just a snap shot of the same blocking pattern that has persisted since late March of last year, resulting in wet, stormy conditions for the Eastern US and dry, hot, drought and fire conditions for the western US.
Blocking patterns of this kind have occurred in the past. But it is extraordinarily rare for such events to persist for ten months running. It is also the kind of event that climate experts such as Dr. Jennifer Francis warn is currently caused by a massive loss of sea ice cover in the Arctic and will become more common as sea ice continues its warming-induced retreat resulting in further Jet Stream weakening, meandering and retrenchment.
Weather Pattern Part of Trend Produced by Human-Caused Climate Change
This fixed weather pattern led to very severe conditions in California for December that, according to Dr. Jeff Masters at Weather Underground, resulted in a -4.67 reading on the Palmer drought severity index. This makes December of 2013 the 9th worst drought month on record for California (although anecdotal evidence coming in through January indicate that current conditions may be even worse). It is also worth noting that of the top ten worst drought months to occur since 1880 in California, five have now occurred since 1991 — a climate record that shows an increasing number of dry and record dry periods. Such increasingly extreme drying was predicted by numerous climate models for the US southwest as human warming continued to intensify and advance into the 21rst century.
Though such changes were anticipated by scientists, if not by politicians, business leaders, or the media, it was not clear that a strong fire hazard would emerge in even winter months. But this year has seen numerous intense west coast fires during winter time. Such new conditions are quite anomalous. And should the blocking pattern continue to persist, expect extreme heat, drought and fires to ramp up through spring and summer.
Links:
Plumes of Smoke Waft Through Colby Skies as Wildfire Rages
Historic Drought Intensifies in California
Share this:

Posted by robertscribbler on January 16, 2014
https://robertscribbler.wordpress.com/2014/01/16/mangled-jet-stream-sparks-drought-winter-wildfires-in-southern-california-colby-fire-explodes-to-nearly-2000-acres-in-one-day/
Drought, Burning Rings of Fire out West, Severe Flooding in the East: How Climate Change and a Mangled Jet Stream Wrecked US Weather
Earlier this summer, I had a weather conversation with my mother. She was excited about a new business venture my sister had undertaken (Adventure Kayaks) and for an upcoming trip to Yosemite in August to celebrate her and my father’s 45th wedding anniversary. She wondered about the weather, hoping it would be a good summer for both the new business and the trip. Without thinking too much, I said:
‘Rain, cooler weather, and storms in the east, drought, heat and fires in the west.’
Immediately after saying this, I felt reticent. Perhaps I shouldn’t have spoken? Maybe I would scare my mom. What good would it do to ruin her enjoyment or her looking forward to both the trip and to my sister’s potential success?
It’s worth noting that, thankfully, the storms and cooler weather that did emerge with fury and flood in the east did not ruin my sister’s kayaking venture (although it did result in numerous interruptions both during spring and throughout summer). Should a tropical storm or hurricane make landfall on the US east coast this August, September or October, however, the devastation could be vast, perhaps exceeding a 1 billion dollar disaster event (more on this below).
But as my mother boarded her plane to California and a potential date with Yosemite yesterday morning, these were the satellite images I was looking at:

Yosemite Fire NASA Earth Observatory
Image source: Earth Observatory
The vast Rim fire that had grown to consume over 192,000 acres as of today was steadily devouring the western border of Yosemite. You can see it on the above infrared satellite picture provided by NASA as a ring of bright white steadily inching into the indicated yellow border of Yosemite.
Jennifer Francis, Stu Ostro and How I Knew
Earlier this summer, my mother chided me on my ‘attempts to predict the weather.’ In a phone conversation last night, she asked ‘how did you know?’
It’s fair to say that in the overall prediction of more storms and rains in the US east, with more risk of flooding, and more heat and dryness out west, with more risks of fire, that I wasn’t entirely certain. However, I’d recently read the work of climatologist Jennifer Francis and had been listening to and following the statements of Stu Ostro. During early spring and summer, I observed a Jet Stream pattern setting up over the US that appeared to be settling into a ‘stuck position’ that would result in the high likelihood of the conditions I communicated with my mother. It’s worth noting that in looking at these Jet Stream patterns it’s not difficult to make such predictions because the patterns change slowly, they lumber and tend to remain stuck for long periods. Once a pattern settles into place, it’s a good bet that it will stick around for at least a few months these days, a fact that the models nail but which meteorologists, in general, have failed to communicate. In short, this is a climate change driven change in the weather.
In fact, some meteorologists and climatologists seem entirely reticent to accept this new weather pattern, despite the fact that it is a powerful tool for weather prediction and will tend to result in less surprises. The big troughs equal record floods sticking around for a long time and the big ridges equal record heat, drought, and probably fires sticking around for long periods of time.
In an example of this reticence, a recent paper by a University of Colorado researcher concluded that Jennifer Francis did not have enough evidence to support her claims of an observed slowing in the Jet Stream. Unfortunately, the paper included, as a part of its findings, a cross section of the atmosphere in which the Jet Stream does not typically reside even while the paper included a sample during which changes were already occurring, which would have likely biased its results. Despite these biases and errors, where the paper actually did measure Jet Stream flows, it corroborated Francis, showing Jet Stream slowing during the periods measured. This is odd considering the fact that the concluding statement contradicts the papers own findings, a point which Dr. Francis, herself, provides.
It’s easy to understand why reticence still lives in the science. As I noted above, it’s understandable to feel reticent when being the bearer of bad news. No one wants to be the messenger that gets metaphorically ‘killed.’ But without making use of the clear understanding provided by Francis and Ostro, we will continue to be surprised by extreme floods, storms, fires, heatwaves and droughts that can be easily predicted by simply looking at how the Jet Stream sets up and where it gets stuck. Instead, ‘surprise’ after ‘surprise’ just keeps coming our way.
When Rossby Waves Get Stuck: Changing to a More Radical Jet Stream
Dr. Jennifer Francis has observed that loss of sea ice and snow cover in the Northern Hemisphere has resulted in a slowing of the Jet Stream in recent years. Sea ice volume, the measure of total ice in the Arctic Ocean, since 1979 had declined by as much as 80% when measured at its low during 2012 (this measure may rally back to around 75 to 78 percent lower than 1979 this year, but the overall trend remains a death spiral). Greenland melt is unprecedented at 500 gigatons per year and with Arctic heatwaves blasting the tundra both permafrost and snow cover are at record and near record lows. 80 to 90 degree temperatures now often advance to the shores of the Arctic Ocean, with the coldest air pushed back above the 80 degree north latitude line, confining it to a shrinking region that, increasingly, huddles closer to the remaining large ice sheets in Greenland. Overall rates of warming for much of the Arctic are about .5 degrees C temperature increase each decade, more than twice the global average.
A more quickly warming Arctic results in changes to the atmosphere’s heat balance. According to Francis, the height of the atmosphere over the Arctic is rising relative to atmospheric heights in the lower lattitudes, this loss of slope results in lower gradients from north to south and since temperature, atmospheric height and pressure gradient drive Jet Stream speed, the Jet Stream slows down. And as the Jet Stream slows, it tends to seek out the highest gradients it can find. The result is more northward invasions of the polar region of the Jet Stream ridges and more southward invasion of the Jet Stream troughs. This amplification creates a rather large and elongated sine wave called a Rossby wave pattern.

Jet Stream Pattern Change. Image source: NOAA.
In the sequence above, we see the progression of a flat Jet Stream to a Rossby wave ridge/trough configuration to, eventually, cut off lows and highs. In the past, such waves tended to set up for briefer periods, extending for days or weeks before returning to the usual, more flattened motion of the Jet. In more recent years, large Rossby type waves have been the typical pattern, one that transitions to cut off lows before it returns to a configuration more similar to (b) in the diagram, before setting up as a Rossby-type wave again.
Perhaps more importantly, this b, c, d progression has tended to occur again and again and again over the same geographical region for months and months on end. And, looking back at Jet Stream maps over the past months, this is exactly what we find.
Below is a progression of images I’m providing from this blog’s archive. It includes either direct temperature measures that indicate Jet Stream patterns or a mapping of air flow speed indicating the Jet Stream’s path.

Clover leaf Jet Stream Pattern April, 2013.
(Image source: ECMWF)
In ‘For Central US, Climate Change and a Mangled Jet Stream Means Drought Follows Flood Follows Drought’ I described how the Jet Stream pattern had consistently switched from large trough to large ridge configurations over the past few years bringing either heatwaves and droughts or storms and floods. But the left hand portion of the image provides a good record of the Jet Stream configuration as of mid April this year. Following the temperatures, on the west coast we see a large, hot ridge and in the central and eastern US we see a deep, cool and stormy trough.

Wednesday July 3, Rossby wave still in effect over US.
(Image source: ECMWF)
Throughout May and into June, this ridge over west, trough over east, pattern continued. By late June, a massive, record-shattering heatwave had set up over the US southwest. I described this highly anomalous event in ‘Mangled Jet Stream and Global Warming to Shatter Earth’s Highest Recorded Temperature This Week?’
Looking at the ECMWF image above we again see the highly exaggerated ridge/trough dichotomy setting up over the US with very hot, dry conditions out west and cooler, wet and stormy conditions in the east.
At this point, I want to tap Stu Ostro’s own observations to add to the Jennifer Francis mix. What Stu has found is that large, powerful high pressure systems have tended to develop more and more often. These extraordinarily dense systems seem to be exploding to new heights in a thickening atmosphere. Primarily, these monsters are driven by heat and so they tend to live in the massive ridges provided by our new, exaggerated and slowed, Jet Stream pattern. That said, these beasts can spring up almost anywhere there is a massive abundance of heat to tap, as one did over a super-heated region of ocean near Shanghai this summer sparking its own monstrous heat wave.
These large heat domes have major and far reaching effects. To understand them, we must first step back to think about the broader effects of human caused warming before looking at how heat domes manifest in the atmosphere. Based on models of the Earth’s atmosphere, we know that for each 1 degree Celsius of Earth temperature increase we get a corresponding 8% amplification of the hydrological cycle. What this means is that evaporation happens 8% faster and condensation happens 8% faster — OVERALL.
Since 1998, we have observed temperatures that are, on average, .8 degrees Celsius above those seen during the 1880s. What this means is that the hydrological cycle has amplified by 6% over this same time period. Because of this dynamic, droughts are more intense, but rainfall events are also more intense. Yet since the atmosphere is uneven we can expect this 6% amplification to manifest in somewhat more extreme fashion at the locations where more extreme Jet Stream patterns set up.

Mangled Jet Stream Dumps Deluge on US Midwest
(Image source: California Regional Weather Server)
What goes up must come down. And that massive heat dome over the western US and Canada had been baking moisture out of the soil at unprecedented rates over an extended period from April to August. The moisture injected into the heat dome rose and rose, The high pressure system suppressed cloud formation so the moisture had no where to go but up and out. Eventually, this moisture found the edge of the massive high and spilled over into the storms riding along the Jet Stream trough rushing down from the Arctic Ocean and into eastern Canada and the US (hat tip to Colorado Bob).
The result was multiple flood events starting with the Midwest floods of April, then the massive Canadian floods (Calgary) of June, then the Toronto floods, then the Midwest floods of early August, and lastly the east coast floods of mid to late August. The Calgary floods were the worst ever recorded in Canada, the Toronto floods were the worst recorded for that region, and in the Midwest floods of early August, four months worth of rain fell in just one week.

Monthly rainfall estimates August 2013.
(Image source: The Weather Channel)
On 8 August, the time of the second barrage of major Midwest floods this year, we find the Jet Stream in the same elongated configuration with a large northward ridge extending all the way from the southwestern US to the Arctic Ocean and with a deep trough diving back down into the central and eastern United States. As noted above, the mangled Jet Stream delivered its overburden of moisture directly to the US Midwest, dumping four months worth of rain in just one week.
A second pulse of moisture rode far south along this Jet Stream flow to dump massive amounts of rain over the southeastern US about a week after pummeling Missouri. This flow combined with a compromised tropical system to saturate the southeast, with some regions receiving as much as 300 percent their annual rainfall totals by late August.
One of the hardest hit areas is Lake Okeechobee. Water levels there as of mid August hit 16 feet at the Hoover Dike, a level that requires weekly monitoring for cracks or ruptures. The dike stretches over 140 miles along the perimeter of lake Okeechobee and was intended to keep the lake in check during major storms and hurricanes after large outburst events in the early 20th Century resulted in thousands of lives lost. The dike is 25 to 30 feet high and is as wide as a football field. The US Army Corps of Engineers has been working feverishly to shore up the dike in a project that will take years to complete.
At 16.5 feet water level, the dike will require daily monitoring. For each inch of increase above that level, the pressure put on the dike would greatly increase risks of catastrophic failure. The causes of such high water, this year, were neither tropical storms nor hurricanes. Florida has been, thus far, spared the wrath of these strong storms. Deep Jet Stream troughs and a constant Atlantic moisture flow have, instead, resulted in day after day rain events for much of southern Florida, pushing August totals near Lake Okeechobee above 16 inches, filling the massive lake and putting the dikes at risk. Should a hurricane or tropical storm strike Florida during late August, September, or October, the dike could overtop or rupture, unleashing the massive lake on communities sitting beneath it. (Hat tip to Colorado Bob).
As the threat of massive floods continued to increase in the east, the west was erupting with wildfires. Fire containment efforts went into high gear both exhausting the Forest Service Fire budget and briefly pushing the national fire alert level to 5. The Rim Fire, so close to my parents’ vacation site, expanded to 192,723 acres today making it the 6th worst in California history.

s Rim Fire on August 28th, 2013
(Image source: Lance-Modis)
You can see this massive fire, now 23% contained, burning to the west of Yosemite in the Modis shot below. A more detailed report of this major wildfire is provided by WeatherUnderground here and here.
Mangled Jet Stream Temporarily Edges Eastward
My parents wanted to see Yosemite’s amazing waterfalls. A major source of my reticence in telling them the likely pattern for this summer was that the heat and drought out west would probably dry out many of those magnificent falls. And, sadly, this has happened. So even if they brave the smoke and fires to reach Yosemite, the one attraction my mom had been most excited to see will likely be somewhat less magnificent.
But a cloud has suddenly appeared in this wrinkle. For the Jet Stream had edged slightly east.
As of the middle of last week, reports of heatwave conditions had emerged throughout the US Midwest with North Dakota, South Dakota, Nebraska, Illinois, Wisconsin, Iowa, Minnesota and Missouri experiencing temperatures in the range of 20 degrees (Fahrenheit) above average. With heat index values hitting as high as 110 degrees, communities sweltered and school systems declared closings. In California, where temperatures had remained in the upper 90s to lower 100s for much of summer, the trough advanced, pushing temperatures back down to the 70s. An upper level low flirting with the west coast may even toss a few fog clouds and rain showers toward California. Such an event would be a welcome change for both my parents and for beleaguered fire fighters in the region.
In any case, the shift is expected to be short lived with ECMWF models showing the Jet Stream again backing up and reforming a hot and dry ridge pattern over the US west. So the Midwest can expect cooling and a return to more stormy, rainy conditions while the US west, after only a brief respite, continues to bake:

(Image source: ECMWF)
The September 7 ECMWF forecast again shows a large and powerful Rossby-type wave pattern with a very large and hot ridge setting up over the US and Canadian West with a deep trough digging down toward the US East Coast. It is the same pattern we’ve seen since at least April, a pattern that has delivered numerous rounds of heat and drought to the US west and an equally vicious and persistent pattern of storms and flooding from the central US to the east coast. The Jet Stream has, essentially, been stuck these past 5 months and there is no end in sight. For even if this configuration of the Jet were to move, it would likely simply re-distribute the locations of heatwaves and droughts and storms and floods.
If anything, this past summer has been yet one more validation in evidence of the work of Dr. Francis. And it is because of her work that I, a relatively untrained observer, can make the accurate prediction that a large region from the Mississippi west to California will continue to stay hot and dry and will continue to see risk for large fires, while the region to the east will remain cooler and stormier so long as the current Jet Stream configuration continues to persist. The western region will risk periods of record heat, continued drying of lands, rivers and aquifers, and fires of record size. The eastern region will continue to risk record floods and storm events. As summer proceeds to fall, shifts in these weather patterns have the potential to grow violent with the possibility of powerful nor-easters or hybrid storms developing near the US East Coast. Both the southeast and Florida remain very vulnerable to continued large rain events or tropical storms and hurricanes as time moves forward and in the event of pattern persistence. Meanwhile, long range model forecasts show this general pattern continuing to persist until at least early to mid September.
At this point, the current US Jet Stream pattern will have been in place for at least 6 months.
Share this:

Posted by robertscribbler on August 29, 2013
https://robertscribbler.wordpress.com/2013/08/29/drought-burning-rings-of-fire-out-west-severe-flooding-in-the-east-how-climate-change-and-a-mangled-jet-stream-wrecked-us-weather/
Triggers to Release the Methane Monster: Sea Ice Retreat, Ocean Warming and Anoxia, Fires, Sea Level Rise and The Fresh Water Wedge
Perhaps the most hotly debated topic among climate scientists, when they are not facing off with the ignorance of underhanded climate change deniers, is the potential rate of Earth Systems response to human caused climate change. In general, the low hanging fruit of climate research is a more easy to puzzle out pace of likely warming due to the direct forcing of human greenhouse gas and CO2 emissions and the more rapid climate feedback coming from increasing water vapor due to increased evaporation. But higher up the tree hang the critical fruits of pace of albedo change and pace of carbon response as the Earth System warms. Understanding these two will provide a much greater clarity to the question of a long term rate of warming given a doubling of atmospheric CO2.
Paleoclimate, Paleoclimate, and Paleoclimate
Perhaps the best way to test the accuracy of our long-term Earth Systems global warming and climate models is to use temperature proxy data from past ages in Earth’s history. And, based on these proxy measures, we find that the long term warming from each doubling of CO2 is at least 6 degrees Celsius. Though the proxies are not perfect, they are in general agreement on a range of potentials averaging near this figure. And these measurements can provide some confidence that the total long-term warming from a doubling of CO2 is at least twice that caused by a CO2 increase and the related water vapor rise alone.
More accurate measures closer to the current day are even less reassuring. Looking at the ice-age and interglacial transitions over the last 500,000 years, we find that a very small forcing provided by orbital changes, resulting in a global increase in solar insolation of about .5 Watts per meter squared combined with changes in the angle at which sunlight hits the Earth (Milankovitch Cycles), is enough to, over the long term, increase CO2 levels by 100 ppm (from 180 to about 280), increase methane levels by about 300 parts per billion (ppb) and (here’s the stunning kicker) raise world temperatures by a whopping 5 degrees Celsius globally and 13 degrees Celsius at the poles.

Changes in Temperature and Methane Concentration
(Image source: NASA)
A Human Forcing Six Times Greater Than That Which Ended the Last Ice Age
It should be a serious concern to climate scientists that the initial forcing of just .5 Watts per meter squared resulted in a relatively moderate 100 ppm CO2 and 300 ppb methane response which then combined to force temperatures radically higher. By comparison, the current human emission of 120 ppm CO2 and 1100 ppb CH4 (methane) and rising, combine with other human greenhouse gasses such as Nitrous Oxide, Tropospheric Ozone (human emission), Clorofluorocarbons and Halons to provide an initial forcing of fully 3 Watts per meter squared or about 6 times the total forcing that resulted in the last ice age’s end and ultimately set in place feedbacks that pushed global temperatures 5 degrees hotter (Data source: Recent Greenhouse Gas Concentrations).
Earth’s Own Carbon Stocks are Vast
So why was so small an initial solar forcing enough to end an ice age and, ultimately warm the poles by 13 degrees (C) and the globe by 5 degrees C and what does this mean when the human forcing is now at least six times greater?
In short, the Earth holds vast stores of carbon in the form of CO2 in its oceans, organic carbon in its tundra and frozen beneath land ice, and in very large stores of methane hydrates on the sea bed. Any forcing that is large or occurs over a very long period of time will act continuously on these sources, pushing more and more of the carbon out until all of the stores newly exposed to that forcing are emitted, the feedback warming kicks in, Earth albedo changes as ice sheets respond (also a source of additional heat), and Earth gradually reaches a new energy equilibrium state.
In the current day, melting tundra (both land and ocean) in the Northern Hemisphere holds about 1,500 gigatons of carbon (NSIDC), the oceans contain between 2,000 and 14,000 gigatons of methane hydrate (USGS), and these same oceans hold about 1,000 gigatons of carbon (CO2) in solution near the surface and 38,000 gigatons of carbon near the sea floor (University of New Hampshire: Global Carbon Pools/Fluxes).

USGS Methane Hydrate
Melting tundra releases its carbon stores as CO2 in an aerobic/oxygen environment and as methane in an anaerobic and anoxic environment. Thawing methane hydrates release methane into the oceans of which some enters the atmosphere. And warming oceans eventually are unable to uptake a rising level of atmospheric CO2 and, in extreme cases, begin emitting CO2 back into the atmosphere.
When compared to the gentle, though long term, nudge to the Earth’s carbon stocks generated by orbital changes and a slight increase in solar insolation that ended the last ice age, the human forcing equates to a very great and rude shove. And if that much more gentle nudge was enough to liberate 100 ppm and 300 ppb of methane from the Earth system into the Earth’s atmosphere, then how much will the now much faster and harsher human forcing put at risk of liberation?
Methane Release Sources in the Arctic
That human greenhouse gas emissions are rapidly warming the Earth at a rate of about .2 degrees Celsius per decade and that carbon emissions from the Earth environment are likely to increasingly result from this rapid and rising rate of warming is a given. At issue is how fast and powerful an Earth systems response will be. And one critical issue in understanding the speed of this potential response is rate of methane release (CO2 release is another issue that will be explored in another blog).
Methane is a very powerful greenhouse gas. Over twenty years time, it estimated to produce about 105 times the forcing of a similar volume of CO2 (this value is estimated to be about 25 times a similar volume of CO2 over 100 years time). So large pulses of this gas could result in a doubling or more of the total greenhouse gas forcing already acting on the Earth system. Such catastrophic releases are hypothesized to have acted during other periods of rapid warming such as during the PETM and Permian hyperthermals.
The above, admittedly lengthy preamble, is needed to give context to this specific issue: potentially large methane releases as a result of Arctic warming and a number of related release mechanisms that may increasingly come into play. However, before we drill down to mechanisms, let’s look at the disposition of potential Arctic methane sources to give us a basis for our degree of concern.
Thawing Arctic Permafrost, as mentioned above, provides a source of 1,500 gigatons of carbon, some of which will be released as methane as it melts to liberate its carbon stores to surface, subterranean, and subsea environments. Some of this permafrost is land-based, some of it is submerged, as on the East Siberian Arctic shelf. As the permafrost thaws, decay and release of this carbon into the atmosphere is likely to gradually build, providing a growing pool of both methane and carbon emissions. That said, a climate change establishes a number of environmental mechanisms created that are likely to result in greater and greater volumes of this store being released over time. These mechanisms may push methane in a slow and gradual way. But, as we proceed down the dangerous path of rapid human-caused warming, there is increasing danger of large, sudden releases.
In addition, the same expanding set of environmental changes could result in a higher percentage of this vast store being emitted as methane.
Stable Sea Bed Clathrates represent an unknown portion that is likely a majority of the estimated 500-2,000 gigatons of methane hydrates in the Arctic environment. These clathrates compose methane locked in ice lattice structures that occur around 200 meters below the sea bed. Release of these clathrates requires a heat forcing to not only penetrate into the ocean waters, but for it to also reach the clathrates below hundreds of feet of rock and mud. Once the clathrates are disassociated, they must travel through cracks in the rocks and mud, and then through the water column to reach the ocean surface and the atmosphere. On the way, some of the liberated methane dissolves in sea water and another portion is taken in by methane eating organisms. If the pulse is strong enough, the ocean water saturated enough, and the methane eating organisms sparse enough, a greater portion of this released methane will reach the surface.
Ice Age Relics are clathrates that have formed as shallow as 20 meters beneath the sea floor. They are thought to have formed under the glacial cold that encased the Arctic over the last 2 million years and that occurred with particular intensity over the last 800,000 years. These ice age depositions are particularly vulnerable to more rapid release and their expansion during the last glacial period results in a set of carbon stocks that are very vulnerable to rapid emission. In this case, we find yet one more reason why a rapid rise out of a period of glaciation is a rather dangerous climate circumstance. The deposition of carbon stores are placed in regions more vulnerable to thaw and release once warming is underway.
In sum, these three represent a majority of potential methane release sources.
Rumors of Fire: The East Siberian Arctic Shelf Emission
(Please ignore the cheesy intro music and proceed on to the interview)
During the 1990s, researchers noticed a methane overburden in atmospheric regions around the Arctic Circle. This overburden was seen as an indication that large local methane emissions were occurring in the Arctic. Subsequent research found methane emissions from thawing Arctic tundra, from melt lakes and from peat bogs. In addition a large emission source was identified in the Arctic Ocean.
As of 2010, reports were coming in from the Arctic that the East Siberian Arctic Shelf was emitting more methane than the entire Earth ocean system combined. By 2011, an expedition to the Arctic found methane emission sources more than 1 kilometer across over the same region of submerged permafrost. By 2012, expeditions could no longer be conducted on the ice surface in the region of the East Siberian Arctic Shelf due to the fact that the sea ice there had become too thin and unstable to support research equipment.
Dr. Natalia Shakhova and Dr. Igor Similetov found that the permafrost cap over the shallow East Siberian Arctic Shelf seabed had become perforated. The cap locks a very large volume of methane, estimated to be about 500 gigatons, under constant cold and pressure. As the cap perforates, the cold and pressure release and increasing volumes of methane shoot up from the sea bed saturating the water with methane with some of the methane releasing to the surface.
Shakhova and Similetov warn that 1 percent or more of this methane could release over the course of decades as the sea ice continues to erode in the region of the East Siberian Arctic Shelf and the undersea permafrost continues to perforate. Just a 1 percent release would be enough to double the amount of methane in the Earth’s atmosphere, resulting in a .5 watt per meter squared forcing from an ESAS release alone. The researchers also identify the potential for a much larger, 50 gigaton release, which would more than double the current human GHG forcing over the course of just a few decades.
Such a large potential release was the subject of a much-debated Nature article by Peter Wadhams (read more here). And it was this article that raised the question of potential mechanisms that could result in such large releases of methane from the Arctic in the coming years.
The Arctic Under Heat: Ever More Powerful Mechanisms For Release
In examining potential release methane release mechanisms we will start with those currently acting on the East Siberian Arctic Shelf and work our way outward to the greater Arctic environment. It is worth noting that a paper by Carolyn Ruppel recently refuted Shakhova and Similetov’s findings, but that the Ruppel paper did not study the region of the East Siberian Arctic Shelf in question, only a related area of the Beaufort Sea which has not been found to currently show large, powerful, or widespread methane hydrate release.

East Siberian Sea
(Image source: Commons)
Taking the Ice Lid off of a Shallow Sea. In the case of the East Siberian Arctic Shelf, rapidly warming air and ocean combine with rapidly retreating sea ice to create what seems to be a powerful and concerning release mechanism. The East Siberian Arctic Shelf is a 2 million square kilometer region that composes some of the Arctic’s densest carbon stores. It represents about 1/5 the Arctic Ocean area and is thought to contain about 500 gigatons of shallow sea bed methane hydrates. Over the past few decades, this region has warmed very rapidly, at the rate of about .5 degrees Celsius every ten years. This warming, at about 2.5 times the global rate, has resulted in a very rapid weakening and retreat of sea ice from the surface waters of a shallow sea that is, on average, about 50 meters deep. In recent years, summer sea ice has almost completely retreated from the ESAS, leaving a dark ocean surface to absorb sunlight and to rapidly warm. Measurements from the region show that water temperatures have increased by as much as 7 degrees Celsius above average once the sea ice pulls away. With the ice now gone, surface winds provide great mobility and mixing of the water column, this results in much of the surface water heating being transported down to the seabed. It also draws methane rich waters up from below where they can contact the air and release some of the water-stored methane.
Shakhova and Simeletov have observed perforations of the subsea permafrost releasing large volumes of methane from the East Siberian Arctic Shelf since 2008 and, as noted above, many of the hydrates stored beneath this permafrost cap are far shallower than is typical for a normal ocean seabed due to the fact that they are ice age relics. This combination of mechanisms provides the greatest current risk for rapid methane release. However, a number of other mechanisms are increasingly coming into play that may add to the, already concerning set of risks for rapid ESAS methane release.
Melting Tundra, Hot Lakes and Arctic Wildfires. NSIDC has identified about 1,500 gigatons of organic carbon locked in tundra systems throughout the Arctic. As the Arctic is forced to rapidly warm, larger and larger portions of this vast carbon store begin to thaw. Once the tundra melts, this carbon is subject to breakdown and action by microbes. This process of decay releases CO2 in dry environments and methane in wet, anoxic environments. Much of the tundra melt is subterranean. As such, this tundra melt is locked away in moist pockets that have little access to airflow. These pockets are at risk of being broken down into methane by anaerobic microbes. In some sections, tundra collapses and fills with water to form melt lakes. These lakes contact the anaerobic melt regions and create their own anaerobic bottom systems for carbon breakdown and release. Many of these lakes are so hot with methane that they provide emissions with high enough concentration to burn.
As the Arctic experiences more and more heatwaves, a far greater expanse of this extreme northern region is subject to wildfires. These fires are increasingly found to have burned deep into the soil. Reports from the Arctic find that fires have incinerated as many as 50% of the stumps of trees in a wildfire zone and consumed the carbon rich soil to a layer as deep as 3 feet below the surface. The action of wildfires further breaks open the soil and tundra cap providing passages to release any methane stored in anaerobic pockets beneath.
With these tundra regions composing so large a volume of carbon and with these areas being subject to increasingly rapid melting and increasingly energetic wildfires, larger and larger methane releases are entirely likely.
Ocean Warming, Anoxia, and the Fresh Water Wedge. As the years and decades progress and Arctic sea ice becomes more scarce, there is an increasing risk of large freshwater melt pulses from Greenland to combine with a warming Arctic Ocean to further amplify methane release. With the increasing removal of sea ice, Arctic Ocean temperatures surge, spreading a wider and wider area of heat forcing deeper and deeper into the water column and, eventually, into the seabed itself.
Some of this warming is visible in climate models projecting temperature and precipitation change throughout the Arctic over coming decades:

Projected temperature and precipitation change above the Arctic Circle.
(Image source: Climate State)
A warmer Arctic Ocean is a less oxygen rich environment. The heat reduces the oxygen in solution, creating more anaerobic environments for organic carbon to break down as methane. Warmth also creates a greater sea-bed forcing for spontaneous and long-term release of methane hydrates.
As the seas surrounding Greenland warm and the Greenland environment takes in more of this latent heat, Greenland melt rates will continue to increase. The large fresh water pulses from Greenland will push the Gulf Stream further and further south, reducing the mixing of seawater in and near the Arctic, further reducing oxygen levels. These pulses will also act as a wedge, forcing warmer, saltier waters to dive down toward the ocean bottom as a fresh water cap expands from the Arctic Ocean southward (see Does Fresh Water Runoff Change Ocean Circulation to Unlock Deepwater Hydrates?). This mechanism will create a cool surface, hot depths ocean environment for the Arctic Ocean and northern latitude regions surrounding it. Additional fresh water is likely to come from the continents as rates of precipitation increase, further adding to the fresh water cap and the creation of a growing region of stratified ocean with cooler, fresh water at the surface and a growing pool of warmer water below.
Unfortunately, large freshwater additions from melting snowcover and increasingly severe rainfall events, like the massive Yakutia floods have already resulted in changes to Arctic Ocean circulation, creating a large freshwater cap near the Beaufort and resulting in the risk of fresh water pulses entering the Pacific Ocean. A NASA animation shows how these changes are already ongoing:
And we have also noticed a great increase in ocean bottom heat content concentrated near the polar regions.
Thus we have three factors acting in concert to increase methane release. First, sea ice retreats to warm the Arctic Ocean. Second, increasing freshwater inflows divert the warmer waters toward the ocean bottom. Third, the warmer waters are less oxygen rich, creating more anoxic environments for anaerobic bacteria to break down organic carbon from thawing permafrost into methane. These anaerobes will receive plenty of nutrients from the waters washing off of glaciers and continents and will likely create great blooms over large areas as seas continue to warm. These combined forcing mechanisms will likely destabilize the weakest methane hydrate reserves first even as the anaerobes go to work on the newly liberated organic carbon.
Sea Level Rise Floods Large Regions of Tundra. A final mechanism for methane release is the rise of a less oxygenated Arctic Ocean to flood large sections of coastal tundra in Siberia, putting it under water and in an oxygen poor environment in which anaerobic bacteria can act to convert organic carbon into methane. A wide swath of coastal Siberia is low lying and, in some cases, is vulnerable to sea level rise for tens or even hundreds of kilometers inland. Over the years, larger sections of this region will be claimed by the sea, adding their carbon stores to an oxygen poor ocean bottom region.
Together, a rapidly destabilizing ESAS, a rapidly retreating ice sheet, increasing Arctic Ocean anoxia, increasing fresh water runoff into the Arctic Ocean, numerous anoxic environments within tundra thaw regions, increasingly energetic wildfires, expanding regions of stratified waters with hot ocean bottoms and cooler ocean surfaces, and seas rising to flood areas of thawing tundra provide sufficient and numerous mechanisms to be seriously concerned about Arctic methane release as an amplifier and potential multiplier to human caused warming.
Links:
NASA: Changes in Methane Concentration
CDAIC: Recent Greenhouse Gas Concentrations
NSIDC: It’s All About Frozen Ground
University of New Hampshire: Global Carbon Pools/Fluxes
Nature: The Vast Costs of Arctic Change
Does Fresh Water Runoff Change Ocean Circulation to Unlock Deepwater Hydrates?
A Looming Climate Shift: Will Ocean Heat Come Back to Haunt US?
Share this:

Posted by robertscribbler on August 16, 2013
https://robertscribbler.wordpress.com/2013/08/16/triggers-to-release-the-methane-monster-sea-ice-retreat-ocean-warming-and-anoxia-fires-sea-level-rise-and-the-fresh-water-wedge/
Mangled Jet Stream Swings to Hot Over UK: New Weather Emergency Brings Killer Heatwave, Wildfires
This winter the UK weather news was snow, storms and cold. This spring the news was cold, rain and flooding. Now, the news is deadly record heatwave.
Over the past week, the UK has baked under record high temperatures ranging from the high 80’s and into the low 90’s (Fahrenheit). These record temperatures, the highest since 2006 (which was the hottest in 350 years), are implicated in the deaths of nearly 800 persons, have buckled roads and tennis courts alike, set off dozens of wildfires that have taken hundreds of firefighters to contain, and threatened thousands of square miles of UK croplands.
The heat is expected to continue for portions of England, Scotland and Ireland this week with some forecasters calling for the potential of 100 degree (F) temperatures across the region. Forecasts also show the potential for severe thunderstorms with an increased threat of lightning and localized flash floods emerging.
Though other regions of the world often experience temperatures hotter than those seen over the UK throughout the past week, the UK has very few buildings equipped with air conditioning, as daytime temperatures only rarely rise into the 80s. So the young, the elderly and this sick are more vulnerable when high temperatures do arrive as they are both not acclimated to heat and lack access to indoor cooling systems that, in cases like these, can be life-savers.
Mangled Jet Stream Delivers Extremes Yet Again

(Image source: California Regional Weather Service)
A deep Rossy-Wave type dip in the Jet Stream that had extended from Greenland, across the North Atlantic and into the UK and Western Europe this winter and spring, bringing cold weather, record snow and rainfall, and extraordinarily stormy conditions, slowly collapsed over late June and early July. Then, last week, a large bulge and related heat dome high pressure system began to form. As the bulge extended far north toward Greenland, Iceland and Svalbard, temperatures over the UK built until a record heatwave began to scorch the region.
So, in this area, the cold and wet winter extremes that caused the UK Met Office to call an emergency meeting on climate change has been replaced by deadly heat, dryness and wildfires.
The underlying causes of these extremes is likely a great weakening of the Jet Stream’s flow over the Northern Hemisphere. According to researchers, the Jet Stream has slowed down by at least 14% since the 1990s. This slowing down has caused the Jet Stream to act like a lazily flowing river creating great north-to -outh and south-to-north loops and meanders. These large meanders bring cold, wet and stormy conditions when they flow from north to south, as happened over Europe for much of this winter and spring. The south-to-north flows, conversely, bring hot, dry conditions that increase the risk of droughts, wildfires and heatwaves.
Driving these new extremes, according to the research of climatologists like Dr. Jennifer Francis at Rutgers, is a massive, global warming driven erosion of snow cover and sea ice in the Arctic. Since 1979 sea ice volume has dropped 80% while sea ice extent has fallen 50%. Over past years, summer snow cover has also hit new record lows. The loss of ice creates Arctic weather conditions that are many degrees warmer than average. This response, is a result of the elimination of cold, reflective snow and ice cover that turns back the sun’s heating rays. Areas devoid of ice and snow cover instead absorb more of the sun’s light and heat. The result is that the difference in temperature between high lattitudes and lower lattitudes is much lower.
Since large differences between hot and cold temperatures are the primary driver for Earth’s Jet Stream, the speed of air flow is now slowing down as the north pole warms faster than the temperate and tropical regions. And these changes help to drive increasing instances of extreme weather. In the UK, it resulted in an extreme winter and spring (cold rain and snow) followed by an extreme July (heatwaves, hot temperatures, dryness, fires).
Dr. Jennifer Francis provides an excellent explanation of these conditions in the following video:
Sadly, the UK is not the only location to have experienced deadly and extreme weather this year. Weather Underground provides a long and growing list of damaging weather events for 2013. And this list includes many events such as floods, extreme winter conditions, and heat waves that can all be tied to new extreme patterns of the Northern Hemisphere Jet Stream.
Here is the long and growing list provided by Weather Underground:
1) Flooding, Central Europe, 5/30 – 6/6, $22 billion
2) Drought, Brazil, 1/1 – 5/31, $8.3 billion
3) Tornado, Moore, OK, and associated U.S. severe weather, 5/18 – 5/22, $4.5 billion
4) Drought, Central and Eastern China, 1/1 – 4/30, $4.2 billion
5) Flooding, Calgary, Alberta Canada, 6/19 – 6/24, $3.8 billion
6) Flooding, Indonesia, 1/20 – 1/27, $3.31 billion
7) Flooding, Australia, 1/21 – 1/30, $2.5 billion
8) Tornadoes and severe weather, U.S., 5/26 – 6/2, $2 billion
9) Severe weather, Midwest U.S., 3/18 – 3/20, $2 billion
10) Winter weather, Europe, 3/12 – 3/31, $1.8 billion
11) Drought, New Zealand, 1/1 – 5/10, $1.6 billion
12) Flooding, Sichuan Province, China, 7/7 – 7/11, $1.6 billion
13) Flooding, China, 6/29 – 7/3, $1.4 billion
14) Flooding, Argentina, 4/2 – 4/4, $1.3 billion
15) Flooding, India and Nepal, 6/14 – 6/18, $1.1 billion
16) Winter weather, Plains, Midwest, Northeast U.S., 2/24 – 2/27, $1.0 billion
And now we can tentatively add:
17) Heatwave, drought UK 7/13-?, $xxxx?
The UK swing from extreme cold, snow, rain and flooding to extreme heat and dryness over the course of about 7 months is a perfect example of the new types of weather extremes human caused climate change is driving. We are just at the beginning of these changes so, unfortunately, conditions should continue to worsen, especially if we fail to provide proper mitigation rapidly cutting human greenhouse gas emissions.
Links:
Heatwave Continues as Storms Threaten
Met Office Issues Flood Warning as Heat Wave Death Toll Continues to Rise
100 Degree F Temperatures Possible Next Week For UK
California Regional Weather Service
Share this:

Posted by robertscribbler on July 21, 2013
https://robertscribbler.wordpress.com/2013/07/21/mangled-jet-stream-swings-to-hot-over-uk-new-weather-emergency-brings-killer-heatwave-wildfires/
String of Deadly Wildfires Ignited By Record Heat Wave, Extreme Jet Stream over US Southwest.
This Sunday, Death Valley hit a new all-time June record high temperature of 129 degrees Fahrenheit. It was the most recent high mark in a record-shattering heat-wave that baked the western US over the weekend, pushed power grids to the limits, resulted in numerous heat injuries and one death, and sparked multiple dangerous and deadly wildfires.
Though the forecast is for high temperatures to slightly abate over the coming days, the long-range outlook is for heat to return with a vengeance by about July 11th. Overall, temperatures are expected to drop from the 110s and 120s into the still excessive, 100s and 110s, then jump back toward record-setting levels.
A large, high amplitude blocking pattern and associated heat dome high pressure system is expected to persist. So conditions remain for temperature spikes as July progresses. With no long-range changes in this Jet Stream configuration expected, the Southwest will stay under the gun for record heat and dryness probably at least until the end of summer. So this initial volley of record heat can best be described as the first in a very vicious pattern of heat pulses which are likely to continue through the hot months of July, August and September.
This extreme Jet Stream induced hot pattern is plainly visible in the latest ECMWF model runs.

(Image source: ECMWF)
Here we see the record heat predicted for tomorrow with a broad area of 95 degree average 5,000 foot temperatures expected. Average temperatures of 95 degrees at the 5,000 foot level can often result in 110 or greater daytime high temperatures at the surface. As noted above, these very hot temperatures are expected to fade somewhat over the coming week before rising again toward record highs by around July 11th.
More than 20 Large and Dangerous Fires Ignite in US Southwest
This heat wave is just the crowning blow in a long string of warm, dry weather that has settled over the US Southwest since early 2012. The extraordinarily long duration heat and drought is the direct result of a near-permanent blocking pattern. A high amplitude wave in the Jet Stream and associated blocking high pressure have kept heat and drought conditions continuously in place. Such a stationary pattern is not normal and is brought about by a loss of sea ice and snow cover over the Arctic which is a direct result of human-caused climate change. These changes have both slowed down the Jet Stream and made weather patterns more persistent. Beneath the up-slope of these large blocking patterns heat waves, droughts and fires become a near-constant hazard. In the troughs, cooler and much stormier conditions predominate.
In the west, fears were that, eventually, massive and damaging wildfires would result from the epic heat and drought. At first, it appeared that Colorado would be ground zero for this year’s fire season. There, multiple blazes devoured tens of thousands of acres and hundreds of homes. A single devastating fire, the Black Forest Fire, destroyed about 500 homes. Now, the current heatwave has set off numerous large blazes. Over the weekend and into Monday more than 20 massive fires sprang up throughout this drought and heat stricken region.
As the worst of these fires bore down on Yarnell, Arizona, a team of 19 firefighters lost their lives while attempting to defend the town from the rapidly spreading blaze. A quick shift in the wind forced the firefighters to resort to the use of emergency shelters as the flames turned toward them. Sadly, only one of the team survived. The blaze quickly engulfed the town, destroying at least half of the 700 buildings there.
Dangerous fires also raged in California, Nevada, New Mexico, Utah and Colorado. Unfortunately this might be the beginning of a very long, dangerous, and costly fire season. Jason Sibold, an ecologist at Colorado State University reported to Business Journal:
“That area is experiencing extreme drought, low snowpack, late onset of winter, early snowmelt and warmer springs and summers. A lot of those places, in the old climate scenario, would still be under snow. There’s no way they would be burning.”
So the long period of heat, drought and ever-expanding wildfires for the US Southwest, predicted by climate scientists and brought about by human caused global warming, appears to have started. Unfortunately, it only gets worse from here. Even with very aggressive reductions in greenhouse gas emissions, conditions will continue to worsen over the next few decades. Without a rapid reduction in greenhouse gas emissions, the drought which is now devastating the US Southwest will steadily expand north and eastwards until almost half of the United States is impacted. In Europe, the Sahara Desert eventually jumps into Spain, Italy, Greece and southern France and Germany.
An expanding band of heat-bleached and eventually uninhabitable lands eventually engulf the equatorial regions and grow polewards. If we wish to slow and then stop the growth of these damaged zones, then we must stop emitting carbon into the atmosphere as soon as possible.
Sadly, the most recent droughts, heatwaves, and wildfires in the US Southwest are just some of the milder first assaults of global warming. Things get worse from here. Far worse if we don’t drastically reduce carbon emissions.
Links:
Share this:

Posted by robertscribbler on July 2, 2013
https://robertscribbler.wordpress.com/2013/07/02/string-of-deadly-wildfires-ignited-by-record-heat-wave-extreme-jet-stream-over-us-southwest/
Massive Wildfires Follow Record-Shattering Heat-Wave in Alaska

(Large fires in Alaska. Image source: Lance-Modis)
A week after a record heatwave set off highest ever temperatures in Alaska, massive forest fires are blanketing vast areas of wilderness.
More than 80 fires are now raging across the state. The largest include the Lime Hills Fire at 154,000 acres and the Moore Creek Fire at 126,00o acres. In total, nearly 400,000 acres have burned so far this summer. For reference, an average full fire season in the US results in around 3 million acres burned. So the 400,000 acres for Alaska alone represents an abnormally large area burned, especially so early in the fire season and for a region at or above the Arctic Circle.
Like Colorado, where blazes resulted in record damage during June, the largest of the Alaskan fires, Lime Hills, currently threatens a local community. As of Tuesday, the fire had moved to within a half mile of the town which is located on the upper Stoney River just west of Fairbanks. About 70 firefighters are working to ensure no structures are taken by the blaze.
Though not as hot as last week, temperatures still remain in the range of record heat for interior Alaska with some regions Tuesday showing temperatures near 80 degrees (Fahrenheit). Daily record highs for this area range in the high 70s for this time of year. So record-breaking temperatures have become a day-to-day event for this Arctic region.
Fires in Alaska are a direct result of the extreme record high temperatures there. And these temperatures are also linked to a long-period warming trend caused by human-spurred global warming. Increasing heat, dryness and wildfires in vulnerable regions are just one result of the climate change caused by an excessive and continuous burning of fossil fuels. May of 2013 was the 3rd hottest on record, according to NOAA’s National Climate Data Center. Overall, temperatures are about .8 degrees Celsius above temperatures when climate records started in the 1880s. This difference is equivalent to that caused by the Little Ice Age, but on the side of hot.
Also in May, global atmospheric CO2 levels hit a record 400 parts per million. This level of Greenhouse gas is enough to raise Earth’s temperatures another 2-3 degrees Celsius long-term or about half the difference between now and the last Ice Age, but also on the side of hot. Long term results of 400 ppm CO2 also include a 75 foot rise in sea level. Unfortunately, due to a failure by the world’s leaders to enact appropriate CO2 reduction policies, CO2 levels are set to rise to around 550 parts per million by mid-century, enough to bake in a total temperature increase of around 7 degrees Celsius long-term. A virtual fire age.
Between now and then, and without proper policy measures aimed at reducing the damage, we can expect gradual but continually increasing global temperatures with increasing instances of extreme weather events.
The current Arctic heatwave is just one example of the strange climate we are creating. Let us hope that policy makers have gotten the message. We need to get to work before we set off even more dangerous events.
Links:
Crews Battle Wildfires Across Alaska
Heat Wave Sends Temperatures in Alaska to 94 Degrees
Unprecedented West Fork Fires Explode to 60,000 Acres
What Does a World at 400 PPM CO2 Look Like?
Share this:

Posted by robertscribbler on June 26, 2013
https://robertscribbler.wordpress.com/2013/06/26/massive-wildfires-follow-record-shattering-heat-wave-in-alaska/
Please Help Support Our Ongoing Efforts

Climate of Pandemic — A COVID-19 Special Report

GROWTH SHOCK

Luthiel’s Song: Dreams of the Ringed Vale

Luthiel’s Song: The War of Mists

Climate Progress

The Secular Jurist

Exposing Misinformation Spread by Anthony Watts

Colorado Bob’s Climate Feed

Arctic Sea Ice Blog

Science Blogs

Climate State

