From the Arctic to Africa to the Amazon, More Troubling Signs of Earth Carbon Store Instability

The time for debate is over. The time for rapid response is now. The Earth System just can’t take our fossil-fueled insults to her any longer.

*****

Arctic Wildfires

(These Arctic and Siberian wildfires just keep getting worse and worse, but what’s really concerning is they’re burning a big hole through one of the Earth’s largest carbon sinks, and as they do it, they’re belching out huge plumes of greenhouse gasses. Image source: LANCE MODIS.)

Carbon Spikes over the Arctic, Africa, and the Amazon

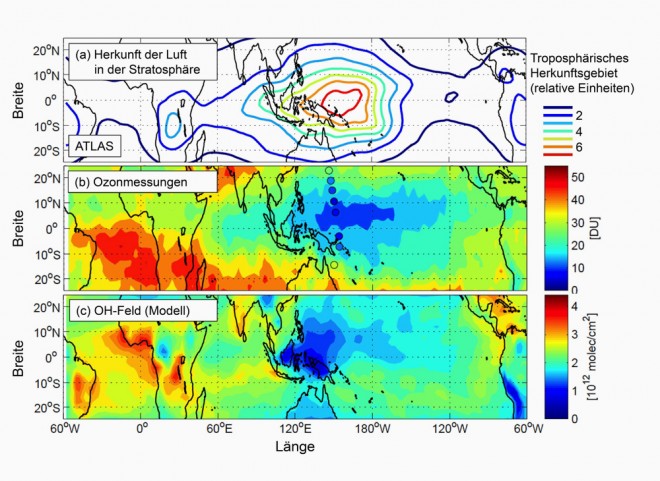
Today, climate change-enhanced wildfires in Siberia and Africa are belching out two hellaciously huge smoke clouds (see images below). They’re also spewing large plumes of methane and carbon dioxide, plainly visible in the global atmospheric monitors. Surface methane readings in these zones exceed 2,000 parts per billion, well above the global atmospheric average.

Even as the fires rage, bubbles of methane and carbon dioxide are reportedly seeping up from beneath the tundra — generating big blisters of these heat-trapping gasses that are causing sections of the Arctic soil to jiggle like jelly. Greenhouse gas content in the blisters is, according to this Siberian Times report, 7,500 parts per million CO2 and 375 parts per million methane. That’s about 19 times current atmospheric CO2 levels and 200 times current atmospheric methane levels. Overall, these carbon jiggle mats add to reports of methane bubbling up from Arctic lakes, methane blowholes, and methane bubbling up from the Arctic Ocean in a context of very rapid Arctic warming.

Surface Methane

(Methane spikes over Siberia, Africa and the Amazon correlate with wildfires and extreme drought conditions associated with human-forced climate change. Add in carbon dioxide spikes over the same regions of Africa and the Amazon and it begins to look like a visible amplifying feedback signal. Image source: The Copernicus Observatory.)

Meanwhile, a global warming-enhanced drying of the Amazon rainforest appears to be squeezing a substantial amount of these hothouse gasses into the Earth’s atmosphere. Copernicus Observatory surface monitors indicate pools of 600 to 800 parts per million CO2 concentrations near and around the Amazon rainforest. These 100- to 200-mile-wide spikes in CO2 concentration are 1.5 to 2 times current atmospheric concentrations. These very high CO2 levels occur even as methane readings over the Amazon are also abnormally high, a possible precursor signal that the NASA-predicted Amazon rainforest wildfires this summer may be starting to ignite.

Any one of these instances might be cause for some concern. Taking all these various observations together looks like a clear signal that the Earth is starting to produce an increasingly strong carbon feedback response to human-forced warming. If true, that’s some pretty terrible news.

Human-Forced Warming Warps the Carbon Cycle

Each summer, the boreal forests of the Northern Hemisphere take a big breath. In the warmer airs, leaves unfurl, grasses grow, and all kinds of CO2-respiring organisms take hold. Together, they produce a frenzy of activity, a riot of life gathering great stores of energy for the next plunge into winter. Over time, this natural capture of CO2 stores this atmospheric carbon in plant matter that ultimately becomes soil, permafrost, or is buried in the Earth in the form of various hydrocarbon stores.

It’s this annual great growth and greening that, in large part, drives the seasonal up-and-down swings of the global carbon cycle — a cycle that, under stable conditions, would generate an annual wave in atmospheric CO2 concentrations running over a long-term flat line.

Surface carbon dioxide

(Surface CO2 readings show boreal forest uptake of CO2 over Siberia, Scandinavia, and parts of North America. Note the CO2 surface hot-spots over the fire zones in Central Africa and over the drought-stricken Amazon rainforest. Image source: Copernicus Observatory.)

Ever since the advent of the Industrial Revolution, human fossil-fuel burning has been adding carbon to the atmosphere. The result is that these seasonal swings, driven by plant respiration, have overlaid a significant upward trend in atmospheric carbon, one that this year pushed peak atmospheric CO2 values to near 408 parts per million. This is a level not seen in about 15 million years.

That increase in its turn has dramatically warmed the Earth — a result that has its own larger impact on plants, on the cycles that influence their ability to take in carbon, and even on the older carbon that was long ago stored in plants but is now sequestered in the soil, permafrost and oceans.

Amazon Drought Africa and Siberia Burning

(LANCE MODIS satellite shot shows extensive wildfires spewing large plumes of smoke over Siberia and Africa. Meanwhile, very dry conditions in the Amazon appear to be generating understory fires even as carbon is baked out of the Equatorial soil. Click image to zoom in.)

Warm the world up, as humans have, and you generate what, in scientific parlance, is a carbon feedback. Overall, the ocean can take in less atmospheric carbon and increasingly bubbles with thawing methane, the soils can store less carbon even as more is baked out in the heat, the plants and peats on balance burn more than grow, permafrost thaws and releases its own carbon. It is this carbon-cycle response to warming that is expected to add more carbon dioxide and methane into the atmosphere on top of that already being released through the harmful processes of fossil-fuel extraction and burning.

Warming Forces More Carbon Out of Lands and Seas, Keeps More in the Atmosphere — But How Much is Still Pretty Uncertain

How much heat-trapping carbon the Earth System will ultimately add to human fossil-fuel emissions is kind of a big scientific question, which is answered in large part by how much fossil fuels humans ultimately burn and how much heat is ultimately added to the Earth’s oceans, glaciers, and atmosphere.

Climate Change Impact on CO2 Simulations

(A sampling of climate model-projected Earth System CO2 feedbacks to human-forced climate change. Note the high level of variation in the model projections. It’s also worth noting that these model projections did not include difficult-to-assess permafrost and hydrate responses to warming over the period through 2100. Image source: IPCC AR 4 — Coupled Climate-Carbon Cycle Projections.)

Back in 2007, the IPCC estimated that around 87 parts per million of additional CO2 would be added to the world’s airs by 2100 (under an apparent assumed final human-driven CO2 accumulation of 700 ppm) as a result of this kind of carbon feedback to human warming. This implied about a 20-percent positive CO2 feedback to warming. However, the model projections were wide-ranging (from 4 to 44 percent) and the overall assessment drew criticism due to a lack of inclusion of permafrost and hydrate feedback estimates.

In 2012, the IPCC produced a more uncertain, complex, and unclear set of projections that notably didn’t include permafrost carbon feedback or methane hydrate feedback model projections, the scientific understanding of which is apparently still developing. But despite a good deal of specific-issue uncertainty, the consensus appeared to state that over the medium- (21st century) and long-terms (multi-century), we’d have a significant amount of extra carbon coming from the Earth System as a result of responses to a human-warmed atmosphere and ocean.

Smoke From African Wildfires

(African wildfires, whose smoke plumes are visible here, are just one of many sources of carbon spikes around the globe triggered by human-forced climate change. Amazon rainforest next? NASA seems to think so. Image source: LANCE MODIS.)

Overall, there’s a decent amount of support for the notion that the Earth System is pretty sensitive to warming, that it tends to respond to even a relatively small amount of initial incoming heat in ways that produce a good deal of extra carbon in the atmosphere. After all, only a small change in the way sunlight hits the Earth is enough to end an ice age and pump an additional 100 parts per million of CO2 out of the Earth’s carbon stores as a result. The added heat forcing provided by the current human fossil-fuel emission is far, far greater than the one that ended the last ice age.

It is in this understanding and context that we should consider what appears to be an increasing number of Earth System responses to a human-forced warming that has currently exceeded 1 degree Celsius above 1880s averages. It’s easy to envision that these responses would grow in number and intensity as the Earth continues to warm toward 2 C above 19th-century averages.

Links/Attribution/Statements

LANCE MODIS

Coupled Carbon Climate Cycle Projections

Carbon and Other Biogeochemical Cycles

Arctic Methane Bubbles are Leaking 200 Times Above Normal

The Copernicus Observatory

The Keeling Curve

Hat tip to TodaysGuestis

Hat tip to Colorado Bob

Hat tip to DT Lange

Hat tip to Andy in San Diego

Is Human Warming Prodding A Sleeping Methane Monster off Oregon’s Coast?

We’ve talked quite a bit about the Arctic Methane Monster — the potential that a rapidly warming Arctic will force the release of disproportionately large volumes of methane from organic material locked in permafrost and in frozen sea bed hydrates composing volumes of this powerful greenhouse gas large enough to significantly increase the pace of human-forced global warming. But if we consider the globe as a whole, the Arctic isn’t the only place where large methane stores lurk — laying in wait for the heat we’ve already added to the world’s oceans and atmosphere to trigger their release. And a new study out of the University of Washington provides yet another indication that the continental shelf off Oregon and Washington may be one of many emerging methane release hot spots.

For all around the world, and beneath the broad, blue expanse of the world’s seas, rest billions and billions of tons of frozen methane hydrate.

A kind of methane and ice combination, frozen hydrate is one of the world’s most effective natural methods of trapping and sequestering carbon. Over long ages, organic material at the bottom of the oceans decompose into hydrocarbons, often breaking down into methane gas. At high pressure and low temperature, this methane gas can be locked away in a frozen water-ice hydrate lattice, which is then often buried beneath the sea bed where it can safely remain for thousands or even millions of years.

Plume2_nolabels_cropped

(Plume of methane bubbles rising from the sea floor off the Oregon Coast. This image shows methane bubbles originating from the sea bed about 515 meters below the surface before dissolving into the water column at about 180 meters depth. Image source: American Geophysical Union.)

Most of these deposits lay well beneath the sea bed or at extreme ocean depths of one mile or greater. And so far, human forced warming hasn’t been great enough to risk the destabilization of most of these deep ocean carbon stores. But some hydrate deposits rest in the shallower waters of continental slope systems and at depths where current warming may now be causing them to destabilize.

Scientists Think Methane Hydrates May be Destabilizing off Oregon

Enter a new study by University of Washington scientists which found “an unusually high number of bubble plumes at the depth where methane hydrate would decompose if seawater has warmed.” The scientists concluded that these bubble plumes were likely evidence of methane hydrate destabilization due to a human forced warming of the water column in the range of about 500 meters of depth.

The warm waters, ironically, come from a region off Siberia where the deep waters have, over recent decades, been heated to unprecedented temperatures. These waters have, in turn, through ocean current exchange, circulated to the off-shore region of Washington and Oregon where they appear to have gone to work destabilizing methane hydrate in the continental slope zone. A paper published during 2014 hypothesized that these warm waters would have an impact on hydrates. And the new paper is the first potential confirmation of these earlier predictions.

In total about 168 methane plumes are now observed to be bubbling out of the sea bed off the Washington and Oregon coasts. Of these, 14 are located in the 500 meter depth range where ocean warming has pushed temperatures to levels at which hydrate could begin to destabilize. University of Washington researchers noted that the number of plumes at this depth range was disproportionately high, which also served as an indirect indicator that human heating may be causing this methane to release.

PlumesMap

(Locations of methane plumes in the continental slope zone off Washington and Oregon. The location of a disproportionate number of these plumes in a zone now featuring a warming water column is an indication that the human-forced heating of ocean currents is starting to drive some methane hydrate structures to destabilize. Image source: AGU.)

Lead author H. Paul Johnson, a University of Washington professor of oceanography noted in AGU:

“So it is not likely to be just emitted from the sediments; this appears to be coming from the decomposition of methane that has been frozen for thousands of years… What we’re seeing is possible confirmation of what we predicted from the water temperatures: Methane hydrate appears to be decomposing and releasing a lot of gas. If you look systematically, the location on the margin where you’re getting the largest number of methane plumes per square meter, it is right at that critical depth of 500 meters.””

Implications For Ocean Health, Carbon Cycle

Most methane released at this depth never reaches the atmosphere. Instead, it either oxidizes to CO2 in the water column or is converted by ocean bacteria. That said, expanding zones of methane release can rob the surrounding ocean of vital oxygen even as it can saturate the water column with carbon — increasing ocean acidification and reducing the local ocean’s ability to draw carbon out of the atmosphere. Such a response can indirectly increase the volume of heat trapping gasses in the atmosphere by reducing the overall rate of ocean carbon uptake. In more extreme cases, methane bubbles reach the surface where they then vent directly into the atmosphere, proportionately adding to the human-produced greenhouse gasses that have already put the world into a regime of rapid warming.

It has been hypothesized that large methane releases from ocean hydrate stores contributed to past hothouse warming events and related mass extinctions like the Permian and the PETM (See A Deadly Climb From Glaciation to Hothouse). But the more immediate consequences of smaller scale releases are related to declining ocean health.

According to AGU and Dr. Johnson, the study author:

Marine microbes convert the methane into carbon dioxide, producing lower-oxygen, more-acidic conditions in the deeper offshore water, which eventually wells up along the coast and surges into coastal waterways. “Current environmental changes in Washington and Oregon are already impacting local biology and fisheries, and these changes would be amplified by the further release of methane,” Johnson said.

Instances of mass sea life die-off have already occurred at a very high frequency off the Washington and Oregon Coasts. And many of these instances have been associated with a combination of low oxygen content in the near and off shore waters, increasing ocean acidification, increasing dangerous algae blooms, and an overall warming ocean system. It’s important to note that ocean acidification, though often cited in the media, is just one of many threats to ocean life and health. In many cases, low oxygen dead zones and large microbial blooms can be even more deadly. And in the most extreme low oxygen regions, the water column can start to fill up with deadly hydrogen sulfide gas — a toxic substance that, at high enough concentrations, kills off pretty much all oxygen-based life (See Hydrogen Sulfide in the World’s Warming Oceans).

During recent years, mass sea life deaths have been linked to a ‘hot blob’ forming in nearby waters (See Mass Whale Death in Northeast Pacific — Hot Blob’s Record Algae Bloom to Blame?). However, indicators of low oxygen in the waters near Washington and Oregon have been growing in frequency since the early 2000s. Though the paper does not state this explicitly — increasing rates of methane release in the off-shore waters due to hydrate destabilization may already be contributing to declining ocean health in the region.

Slope Collapse, Conditions in Context

A final risk associated with methane hydrate destabilization in the continental slope zone is an increased prevalence of potential slope collapse. As methane hydrate releases, it can deform the sea bed structures within slope systems. Such systems become less stable, increasing the potential for large underwater landslides. Not only could these large landslides displace significant volumes of water or even set off tsunamis, slope collapse events also risk uncovering and exposing more hydrate systems to the warming ocean in a kind of amplifying feedback.

In context, the total volume of methane being released into the off-shore environment is currently estimated to be about 0.1 million metric tons each year. That’s about the same rate of hydrocarbon release seen from the Deepwater Horizon blowout. A locally large release but still rather small in size compared to the whopping 10+ billion tons of carbon being dumped into the atmosphere each year through human fossil fuel burning. However, this release is widespread, uncontrolled, un-cappable and, if scientists are correct in their indications of a human warming influence, likely to continue to increase as the oceans warm further.

Links:

Bubble Plumes off Washington and Oregon Suggest Warmer Ocean May be Releasing Frozen Methane

Geochemistry, Geophysics, Geosystems

Warming Oceans May be Spewing Methane off US West Coast

Concern Over Catastrophic Methane Release

Hydrogen Sulfide in the World’s Warming Oceans

Mass Whale Death in Northeast Pacific — Hot Blob’s Record Algae Bloom to Blame?

A Deadly Climb From Glaciation to Hothouse

Hat tip to Humortra

Methane Monster’s Grumbling Goes Global: 570 Methane Plumes Discovered on Atlantic Ocean Sea Floor

Greenhouse gas concentrations spike — heating the atmosphere and the deep ocean after a period of glaciation during which vast stores of carbon accumulated. Massive volumes of this carbon lay dormant — trapped in frozen ground and in clathrates on the sea bed. As the ocean and airs warm, these carbon stores release causing a massive spike of additional greenhouse gasses to hit the atmosphere and setting off ever-more-rampant heating. The cycle continues until much of these carbon stores out-gas, pushing the Earth into a hothouse state.

Sound chillingly familiar?

What I’ve just described is the process that most scientists believe occurred during the worst mass extinction event in the geological past — the Permian Extinction. A hothouse event that killed 95% of life in the oceans and 70% of life on land. And what humans are now doing to the Earth’s airs and waters through CO2 and related greenhouse gas emissions may well be shockingly similar.

Large methane release over East Siberian Sea August 2014

(Substantial methane release from the East Siberian Sea surface during early August likely in the range of 0.5 to 1 megatons points toward both atmospheric methane overburden and likely carbon store instability and large scale out-gassing in the Arctic. Image credit: Sam Carana and NOAA.)

From the Arctic tundra to the Arctic Ocean sea bed to the Atlantic Ocean, we have growing evidence of methane and CO2 releases from carbon stores that may well be at the start of just such a large scale feedback. Time and time again, we see evidence of significant (but not yet catastrophic) emissions from Arctic methane stores (see image above). With each passing year, the methane overburden in the Arctic air grows. And we have had increasing evidence of a growing volume of releases from the East Siberian Arctic Shelf sea bed, to the methane emitting melt lakes proliferating over the thawing permafrost, to the chilling and terrifying methane blow holes discovered this year in Siberia.

As of 2011, many Arctic scientists believed that human-caused heating could set off methane and CO2 emissions from that region equivalent to between 10 and 35 percent or more of current human fossil fuel burning by the end of this century. The lower boundary of this range is with rapid reductions in human greenhouse gas emissions, the upper boundary is under business as usual. Such a 35 percent equivalent emission, happening year on year for centuries, would be more than enough to push Earth into a runaway hothouse scenario without any further human greenhouse gas releases. And it is this scenario, or the even more chilling worse case of very rapidly ramping Arctic methane outbursts, that we should be very concerned about.

Atlantic Methane Hydrate Destabilization off US East Coast

Unfortunately, the vast carbon store in the Arctic is not the only potential source of heating feedback carbon release. For around the world, upon and beneath the ocean sea bed, billions of tons of methane lay stored in clathrate structures. These stores are separate from the large carbon deposits in the Arctic. But they are no less dangerous.

In 2012, Nature issued a study that found a store of clathrates composing billions of tons of methane was now destabilizing off the US East Coast. The study predicted large-scale releases in the multi-gigaton range from the southern region of the East Coast methane clathrate store due both to changes in the Gulf Stream circulation and to warming bottom waters — both impacts set off by human-caused climate change. The study was uncertain how fast such a release could occur, but noted that the eventual release was likely due to wide-scale clathrate degradation associated with ocean bottom warming.

Methane Seep off US East Coast

(Methane Seep off US East Coast. Image source: Nature.)

This year, research vessels returned to the region and found 570 plumes of methane venting from destabilized clathrate stores there. This result was surprising due to the fact that only three methane seep sources had previously been identified. The plumes were discovered in 50 to 1,500 meters of water, with most of the seeps occurring at between 250 and 600 meters depth, along a zone stretching from Cape Hatteras to Georges Bank. The seeps ranged in age from recent to 100 or even 1000 or more years old. Overall, the prevalence of seeps was more widespread than expected.

“This is the first time anyone has systematically mapped an entire margin,” Christian Berndt, a marine geophysicist at GEOMAR in Kiel, Germany, who was not involved in the study, said in an interview to Science Magazine. “They found that there was much more methane coming out than was suspected beforehand.”

Currently, only a small amount of the methane being released from the sea bed off the US East Coast is likely hitting the atmosphere and is probably not contributing anywhere near the volume of known emission sources from the East Siberian Arctic Shelf. Most of the gas is just absorbed by the water column, increasing acidification in the region and contributing to anoxia. But the known clathrate store off the US East Coast is very significant and large scale releases could result in much more widespread anoxia, acidification, and provide a substantial atmospheric heating feedback to human-caused warming. Very large and catastrophic outbursts could also result in slope collapse and generate tsunamis along the US East Coast. A concern that researchers may also need to further investigate.

Overall, as much as 300 to 400 gigatons of methane could be at risk and even a fraction of this store hitting the atmosphere would cause serious and lasting harm.

Overall, it is estimated that at least 30,000 methane seeps like the ones recently discovered off the US East Coast may now be active with potentially 10,000 in the East Coast region now under investigation. The current study provides a good base line for further exploration of what may well be a rather significant problem going forward.

“It highlights a really key area where we can test some of the more radical hypotheses about climate change,” said John Kessler, a professor at the University of Rochester, in an interview with the New York Times. “How will those release rates accelerate as bottom temperature warms?”

The acceleration would indeed have to be substantial to add to the already significant and troubling Arctic methane and CO2 release. But the sea bed stores are vast and the rate of human warming is very rapid. So the global ocean clathrate store is something to keep under close watch and the discovery of yet one more source that is already emitting at faster than expected rates is not at all comforting.

Links:

Widespread Methane Leakage From Sea Floor on Northern US Atlantic Margin

From Glaciation to Hothouse — Why the Permian Extinction is Pertinent to Human Warming

Recent Changes to the Gulf Stream Causing Widespread Hydrate Gas Destabilization

New Study Shows East Coast Hydrates Destabilizing

High Risk of Permafrost Thaw

Sam Carana

NOAA

Scientists Discover Hundreds of Methane Leaks Bubbling Up From the Atlantic Sea Floor

Sea Level Rise Found to Cause Slope Collapse, Tsunamis, Methane Release

Global CO2 to Reach Extremely Dangerous Peak Near 402 PPM for 2014, Methane Levels Ramp Ominously Higher

During 2014, human CO2 forcing continued its long march toward ever-more dangerous and climate-damaging levels. By the peak month of May, global CO2 had ranged well above the 400 parts per million threshold, catapulting Earth at raging velocity toward climate and atmospheric states not seen in at least 3 million years.

According to May readings from the Mauna Loa Observatory, the more volatile hourly measures jumped as high as 404 parts per million while daily and weekly averages tended to settle between 401.4 and 402.3 parts per million. Given these trends, overall CO2 levels for May of 2014 are likely to peak at near or just below the astronomical 402 ppm threshold.

Atmospheric CO2 Late May 2014

(Atmospheric CO2 levels measured by the Mauna Loa Observatory over the past two years. Peak values for 2012 hit near 397 ppm, peak for 2013 hit near 400 ppm, and peak for 2014 is likely to hit near 402 ppm. Image source: The Keeling Curve.)

CO2 levels near 400 parts per million are enough, according to our developed understanding of paleoclimates, to increase global temperatures by between 2 and 3 degrees Celsius, to melt Greenland, West Antarctica and a portion of East Antarctica, and to raise sea levels by 75 feet if sustained over a long term. According to recent glacial research, these very high levels, when combined with additional greenhouse gas forcing and concurrent ocean and atmospheric warming have already been enough to destabilize or push large portions of these major ice systems into irreversible collapse.

(A history of atmospheric carbon dioxide through early this year provided by CIRES and compared to the entire ice core record of the past 800,000 years. Video source: CIRES.)

36 Billion Tons of CO2 Emission per Year and Counting

Measured from peak to peak, the rate of atmospheric increase is likely near 2.5 to 3.0 parts per million per year over the two year period. Averages over the whole range of the past two years show increases on the order of 2.4 parts per million per year — a challenge to recent rates of increase near 2.2 parts per million a year since 2000.

Steadily ramping rates of atmospheric CO2 accumulation are driven by extreme global industrial, agricultural, and land-use emissions. According to the Global Carbon Project, 2013 saw total global CO2 emissions in the range of 36 billion metric tons. This emission was 2.1 percent higher than the 2012 level and about 60 percent higher than the 1990 level at around 22 billion metric tons of CO2. Such an extraordinary pace of emissions puts severe strain on both atmospheric carbon levels and on carbon sinks around the globe. The resulting risk of such a strong continued emission is that global sinks and stores may soon become sources (see methane monster below). An issue of amplifying feedbacks that grows ever more perilous with each passing year.

Rapidly Increasing CO2 Acting in Concert With Ramping Methane, other Greenhouse Gasses

Unfortunately, CO2 is not the only human emission forcing global temperatures rapidly higher. In addition, methane, nitrous oxide, and numerous other greenhouse gasses also make their way into the atmosphere each year through industrial sources. If we combine all these other greenhouse gasses, the total CO2 equivalent carbon emission is now at around 50 billion metric tons each year. A veritable mountain of greenhouse gasses dumped at a pace more than 150 times that of volcanic emissions each and every year.

Overall, the total greenhouse gas forcing from all these sources is now likely in the range of 481 parts per million of CO2 equivalent. This immense heat forcing, were it to remain in the atmosphere long-term, is enough to raise global temperatures by 3-4 C and to melt enough ice to raise sea levels by at least 120 feet. It is also enough, with only two more years of current emissions, to likely lock in an inevitable, irreversible and extraordinarily disruptive increase of 2 C in global temperatures for this century alone.

First Glimpses of the Methane Monster

The most potent and troubling of these additional greenhouse gasses is methane. Over the course of 20 years, methane is about 80 times as powerful a heat trapping gas as CO2 by volume. And though atmospheric methane levels are far less than comparable CO2 levels (at around 1.8 parts per million, or 1/3 the total atmospheric heat forcing of CO2), there is cause for serious concern.

For not only is the industrial emission of methane increasing, primarily through the use of very damaging hydraulic fracturing technologies (fracking), the global emission of methane from the Earth System also appears to be ramping higher. Over recent years, rapidly thawing permafrost and warming oceans both around the world and, particularly, in the Arctic show signs of venting an increasing volume of methane into the atmosphere from terrestrial sources. Though annual official tracking of total Arctic methane emissions at this point is practically non-existent, recent research allows for rational estimation.

Taking into account known emissions from permafrost and the East Siberian Arctic Shelf, and adding in expected emissions from the rest of the thawing Arctic, methane emissions for the entire region are likely around 40 teragrams per year, or about 7% of the global total. This emission is equivalent to that of a major industrial nation and initial indications are that it is growing.

Mauna Loa Methane 2007 to 2014

(Atmospheric methane increase since 2007 as measured at the Mauna Loa Observatory. Note the more rapid pace of increase from 2013 through the first quarter of 2014. Image source: NOAA/ESRL.)

The result of combined increases in the human methane emission and in the Earth System emission has been enough to continue to push global levels higher with Mauna Loa readings breaching the 1840 part per billion average by early 2014. What is even more troubling is that the Earth System methane store, composed of both permafrost methane and methane hydrate at the bottom of the world ocean system, is immense.

In total, more than 3,000 gigatons of carbon in the form of methane may be at risk to eventually hit the atmosphere as the Earth continues to warm under the current human forcing. A very large store that could easily multiply the current rate of Earth System methane release many times over. One that represents a clear and present danger for a potentially very powerful amplifying heat feedback to an equally extraordinary initial human forcing.

Links:

The Keeling Curve

NOAA/ESRL

What Does a World at 400 PPM CO2 Look Like Long-term?

Grim News From NASA: West Antarctica’s Entire Flank is Collapsing Toward the Southern Ocean

Global Carbon Budget 2013

A Faustian Bargain on the Short Road to Hell: Living in a World at 480 CO2e

Far Worse Than Being Beaten With a Hockey Stick: Michael Mann and Our Terrifying Greenhouse Gas Overburden

Beneath the Cracking, Melting Ice, Arctic Methane Monster Continues its Ominous Rumblings

CIRES


Methane Monster Finding Cracks in Earth’s Defenses: Is the Global Methane Sink Starting to Fade?

Annually, humans emit about 13.5 gigatons of carbon, or about 50 gigatons of CO2 equivalent gasses into the atmosphere. The measures are essentially the same — one just counts carbon weight, the other counts out all the additional hydrogen, oxygen, nitrogen or other atoms together with the carbon.

Of this massive volume, a volume at least six times the emission seen at any time in the geological past, even during the worst greenhouse gas extinction — the Permian — only a fraction remains in the atmosphere for any substantial period of time. This fraction continues to trap the heat and cause the effects we now see on a daily basis — extreme weather, record droughts, fires, floods, crop damage, sea ice loss, storms and an incessant rise in global temperatures.

The rest goes into what we call carbon sinks or stores.

Through the course of human-caused warming, scientists have been concerned that carbon sinks and stores will eventually fill up or, even worse, become emissions sources themselves. The result would be that a greater fraction of the human greenhouse gas emission would remain in the atmosphere longer and do even more damage through its now increased warming potential as natural sources began to emerge and multiply.

Atmospheric elevator

(Atmospheric elevator. Very large storms in the Pacific transport pollutants into the stratosphere. What impact is this having on one of the world’s major methane sinks — the hydroxyl shield? Image source: Alfred Wegener Institute.)

It is this kind of amplifying feedback that we’ve been sounding warnings on since 2012. And, according to new scientific research, there is serious reason for concern that another amplifying feedback in the form of erosion of the methane sink is now starting to develop coincidentally with rising rates of natural methane store emissions.

Methane — A Potent Heat Trapping Gas

And it is here in our chilling and cautionary tale that we come to the story of how methane acts to warm the atmosphere…

As a molecule, methane is an extraordinarily potent heat trapping gas. If CO2 were the tortoise — persisting for hundreds or thousands of years and gradually and inexorably building up a potent heating force, methane is the hare — providing a very intense burst of heating potential for a short period before being sucked out of the atmosphere by either the hydroxyl sink in the tropopause or through interaction with the soil.

The hydroxyl sink lives as a thin layer of a detergent-like molecule consisting of one oxygen atom and one hydrogen atom (HO). The layer exists along a boundary between the troposphere and the stratosphere called the tropopause. It forms when Nitrous Oxide (NO2) encounters Ozone (O3) and water vapor (H2O) at a height of about 8-10 miles where solar radiation is of a wavelength shorter than 315 nanometers. The radiation energy sets off a reaction between these three molecules producing a layer of hydroxyl, a reactive compound that breaks down all sorts of nasty chemicals floating around in our atmosphere. It also breaks down methane. A service that is quite valuable, especially when you consider that methane’s heat forcing, without the rapid oxidization powers of the hydroxyl layer, would be far, far greater.

The heat potential of a single methane molecule is 80 times that of a single CO2 molecule (in the presence of aerosols, it jumps to 105 times that of CO2, somewhat reducing the aerosol cooling effect). And so it’s probably a good thing that the lifespan of a methane molecule in the current atmosphere is only about 8 years. In contrast, CO2 lives about 500 years before weathering or the deep ocean finally knock it out.

As a fraction of total greenhouse gas forcing, scientists conservatively calculate that the total methane overburden represents about 60 parts per million of additional CO2 equivalent heat forcing or a little more than half the total additional heat forcing from CO2. But this calculation takes into account the notion that methane is short lived and will tend to drop out, resulting in relatively less methane heat forcing over time.

Earth’s Hydroxyl Shield Now Has a Gaping Hole

And so it is that today we encounter a bit of a problem. For it appears that a large hole has now been blown in the methane/hydroxyl sink over the Pacific Ocean.

Hydroxyl Hole

(A very large hole in the Earth’s protective Hydroxyl Layer discovered over the Western Pacific northeast of New Guinea during spring of 2014. Image source: Markus Rex, Alfred-Wegener-Institute.)

Though the cause of the current hole is unknown, what is known is that powerful thunderstorms in the region provide atmospheric lift and could have mixed in ozone destroying chemicals such as bromine and chlorine that significantly reduced one of the key constituents of hydroxyl formation.

The hole is quite large and while the initial paper by Markus Rex primarily noted concerns about additional volatile chemicals reaching the stratosphere through the hole, these major hydroxyl reductions over such a large area are also likely to lengthen the atmospheric lifespan of methane.

This feedback may well be a result of other human pollutants and have a possible negative effect on global warming by acting to significantly degrade a major carbon sink. If such an instance is confirmed, it may well be the first such case of its kind where two separate subsets of pollution create a kind of harmonic, but indirect, warming potential effect.

In any case, not a good outcome.

10 to 165% More Methane to be Released From Wetlands

A second very large methane sink/store is encompassed by the world’s vast swaths of wetlands. There, organic materials in the wetlands soil bind electrons needed by methane producing bacteria during regular wet-dry cycles, preventing a portion of the organic material from being broken down as methane. In essence, it’s a kind of indirect methane sink in that it prevents carbon-based materials from being converted to methane by already active methane producing bacteria.

But new research conducted by a team of Swiss and German researchers has found that as climate warms, wetlands are increasingly submerged, and large regions of tundra wetlands thaw, the electron binding process tends to run in reverse even as more wetlands become available for methane emission. In essence, warming both submerges more wetlands even as it generates more wetlands due to tundra thaw. It’s a kind of one, two punch that these researchers are saying could push global methane production radically higher.

As a result, the very large organic carbon store contained in wetlands would increasingly be emitted as methane and the wetlands would act less and less as a methane sink and more and more as a venting methane store. The new addition of wetlands from melting tundra only compounds the process. Researchers found that wetlands are likely to emit between 10 and 165% more methane due to these combined impacts.

It’s worth noting that global methane emissions from wetlands are currently about 165 teragrams (megatons metric) each year. So the new research estimates that annual emissions from these sources will increase by between 17 and 260 megatons annually. By comparison, the total annual methane emission from all sources (including the human addition) is about 600 megatons each year.

Pace of global atmospheric methane increases is tracked by NOAA’s Earth Systems Research Laboratory. Mauna Loa annual measures and trends can be seen here:

Global methane levels

(Global methane levels since 1983 as measured at the Mauna Loa Observatory. Image source: NOAA.)

Fading Sinks, Releases From Stores

These new discoveries — the formation of a hydroxyl shield hole and the recent study finding that global warming will lead to a greater annual release of methane from the world’s wetlands — are likely to combine with ongoing human methane emissions that are now radically increased due to hydrolic fracturing for new gas deposits and with potentially increasing methane emissions from subsea sources such as worldwide stores of methane hydrates and the very vulnerable methane stores in the East Siberian Arctic Shelf. The result is a much greater risk that current methane levels will rise and/or remain high for longer than expected. In total, it’s a significant risk of additional major warming on top of an already very powerful heat forcing coming from a rising human CO2 emission.

Links:

Markus Rex, Alfred-Wegener-Institute

Methane Climate Change Risk Suggested By Proof of Redox Cycling of Humic Substances

Sea Ice Melt, Methane Release Shows Amplifying Feedbacks to Human-Caused Climate Change

NOAA

Global Methane Emissions From Oil and Gas

Methane Emissions From Wetlands

Hole Found in Natural Protective Layer

Tropospheric Chemistry

A Faustian Bargain on the Short Road to Hell

Hat Tip to Colorado Bob!


Arctic Methane Monster Shortens Tail: Shakova, Semiletov Study Shows ESAS Emitting Methane at Twice Expected Rate

ESAS emissions map

(ESAS Bathymetric and Methane Emissions Map. Image source: Nature)

Arctic Methane emissions have been a touchy subject ever since sporadic reports began trickling in during the mid-2000s that volumes of the gas coming from local sources were on the rise. Two of the scientists producing these reports, Igor Semiletov and Natalia Shakova have been observing a key region of the Arctic called the East Siberian Arctic Shelf (ESAS) since the mid 1990s. At that time, Semiletov and Shakova found no major emissions sources coming from this vast sea whose bottom is composed primarily of carbon-rich submerged tundra.

That all changed in 2010 when an expedition led by Semiletov and Shakova discovered bubbling structures tens of meters across on the shallow and vulnerable ESAS sea bed. Returning in 2011, the pair were surprised and terrified by methane bubbling up from structures as large as 1 kilometer across. During this time Semiletov noted:

“Earlier we found torch-like structures like this but they were only tens of metres in diameter. This is the first time that we’ve found continuous, powerful and impressive seeping structures, more than 1,000 metres in diameter. It’s amazing. I was most impressed by the sheer scale and high density of the plumes. Over a relatively small area we found more than 100, but over a wider area there should be thousands of them.”

In the period of 2010 to 2013, other regions of the Arctic were also found to be emitting high volumes of both methane and CO2. These regions included but were not limited to Yedoma in Russia, other portions of the Siberian continental shelf, regions off of Svalbard, regions off of Greenland, and regions over Arctic Alaska and Canada (see NASA’s CARVE mission). Though the reports were sporadic and isolated, a picture began to emerge that the vast stores of Arctic carbon — totaling around 5,000 gigatons or a little less than ten times that already emitted via human fossil fuel burning — were beginning to contribute to the world’s atmospheric greenhouse gas stores.

Concern, especially over methane which creates between 25-75 times more warming than an equal volume of CO2, was on the rise. ESAS again fell into focus because about 1,500 gigatons of carbon in the form of methane is thought to be sealed under a now perforated and rapidly melting layer of permafrost. And by winter of 2013, satellite measures were showing an increasing overburden of methane in the atmosphere above the Arctic.

(You can view the 2009 to 2013 time series for January 21-31 below. Note the rapid increase in relative methane concentration. Click on image for higher resolution.)

methane-jan21-31

(Image source: AQUA Satellite, NASA. Image produced by Dr. Leonid Yurganov)

These increasing methane levels were a sign of higher Arctic emissions. And, though concerning, they hadn’t yet risen to the level to indicate the catastrophic release that some scientists feared was possible.

By summer of 2013, Peter Wadhams, a polar researcher with more than 30 years experience studying Arctic sea ice from the vantage of British navy submarines, chimed in with an article published in the prestigious journal Nature entitled Climate science: Vast costs of Arctic change. In the article, Wadhams and his co-authors projected the economic costs of a catastrophic 50 gigaton methane emission from the East Siberian Arctic Shelf over the coming decades. Though the article itself didn’t provide an estimate of how likely such a dangerous emission would be, Wadhams, in his later press interviews indicated that he believed it was certainly possible due to new mechanisms set in motion by melting sea ice.

Misplaced Mechanisms

The Nature article received numerous criticisms from prominent climate modelers. Chief among these were David Archer and Gavin Schmidt. Archer and Schmidt both adhere to the notion that it will take centuries or perhaps thousands of years for a significant volume of methane to be emitted from the Arctic. They conjecture that emissions from Arctic sources will increase, but at a very slow rate, and to a level that is not markedly significant when compared to overall human CO2 emissions. This relatively slow and low Arctic contribution view is based on a model assessment of the physical sciences that has yet to quantify a strong enough physical mechanism to break methane out of its traps and produce the kind of emissions Wadhams and others fear.

In the conjecture over the potential dangers of Arctic methane release, Schmidt and Archer provide support for a long tail of emissions rather than a more sudden and powerful release.

To these criticisms, Wadhams responded in Cambridge University Press:

“What is happening is that the summer sea ice now retreats so far, and for so long each summer, that there is a substantial ice-free season over the Siberian shelf, sufficient for solar irradiance to warm the surface water by a significant amount – up to 7C according to satellite data. That warming extends the 50 m or so to the seabed because we are dealing with only a polar surface water layer here (over the shelves the Arctic Ocean structure is one-layer rather than three layers)  and the surface warming is mixed down by wave-induced mixing because the extensive open water permits large fetches.  So long as some ice persisted on the shelf, the water mass was held to about 0C in summer because any further heat content in the water column was used for melting the ice underside. But once the ice disappears, as it has done, the temperature of the water can rise significantly, and the heat content reaching the seabed can melt the frozen sediments at a rate that was never before possible.

The 2008 US Climate Change Science Program report  needs to be seen in this context. Equally, David Archer’s 2010 comment that “so far no one has seen or proposed a mechanism to make that (a catastrophic methane release) happen” was not informed by the Semiletov/Shakhova field experiments and the mechanism described above. Carolyn Rupple’s review of 2011 equally does not reflect awareness of this new mechanism.”

It is worth noting that Dr. Wadhams has been very pessimistic about the state of the Arctic of late, predicting that a near complete loss of summer sea ice is likely by 2015 or 2016 — among the most rapid of such predictions. And the severe pessimism of one of the world’s premier sea ice researchers is not at all cause for comfort. This doesn’t mean that conditions are quite so bad as Wadhams suggests. But they could be. And this potential, along with the related potential for a more rapid ESAS release, is very unsettling, Archer’s and Schimdt’s reassurances aside.

Arctic no Longer in the Holocene

By October and November of 2013, the controversy over Wadhams Nature article had mostly faded. But with little in the way of new information, the details of the issue remained inconclusive as ever. Loss of Arctic sea ice had, at least, taken a pause. Sea ice area and extent had retrenched, under the continued assault of human warming, to levels last seen in 2009, but still remained near record low levels in all measures. This pause in the rate of loss was cause for some relief, if little comfort.

On the flip side, a new report had been issued showing that large regions of Arctic Canada were experiencing temperatures that were warmer than at any time in at least 44,000 years and probably 120,000 years. This report added to a long list of growing evidence that the Arctic was rapidly moving out of any reasonable context comparable to the Holocene and was probably well on its way toward something more closely resembling the Pliocene of about 3 million years ago (the last time CO2 levels hit 400 ppm) or worse.

And out of context, anomalous Arctic heat, meant out of context, anomalous stress on the ESAS’s frozen sea bed.

Arctic Methane Spikes as Shakhova Finds ESAS Emissions At Least Double Previous Estimates

Bad news was also coming from Arctic methane readings when, during September, October and November large spikes pushed local readings in some areas as high as 2500 parts per billion, more than a 600 parts per billion above the global average with large regions around the Arctic frequently showing readings above 1950 parts per billion.

By late November, another report had been issued by Shakhova and Semiletov. Published to the journal of Nature Geoscience, the report found that methane emissions from the East Siberian Arctic Shelf, one of the regions of greatest concern, was conservatively estimated to be about 17 megatons per year. This amount is twice that previously estimated by scientists, through the use of physical models and less refined observations, to be coming from this region. It also represents a total emission about twice that of the rest of the entire global ocean system.

The recent Shakhova paper also found the permafrost cap over the methane stored beneath the ESAS to be highly perforated and very close to thawing. Measurements taken from the permafrost showed the top layer had mostly already thawed while the still frozen layers lower down ranged in temperature between 30 and 32 degrees (Fahrenheit) — at the brink of melt. Furthermore, the composed data for the 1999 to 2013 period showed the seabed warming by .9 degrees Fahrenheit even as air temperatures warmed by 1.8 degrees (F) during the summer.

Increasing transport of warmer waters to ESAS bottom zones was facilitated by larger river outflows in the region, likely also a result of human-caused changes to Arctic weather patterns.

Dynamics of bottom water by the coastal zone

(ESAS bottom water temperature measurements from 1999 to 2012. Red = summer. Blue = winter. Green squares = historical data. Source: Nature)

Climate modelers had previously estimated it would take many hundreds of years, perhaps 5,000 to 7,000 years for ESAS permafrost to thaw under human warming. But Shakhova noted the models weren’t even accounting for the higher than estimated current rate of release:

“What we’re observing right now is much faster than what we anticipated and much faster than what was modeled,” Shakhova said. “We decided to be as conservative as possible. We’re actually talking the top of the iceberg.”

The methane beneath the ESAS was also found to be very responsive to environmental changes and conditions, no matter how transient or temporary. Storms, warming waters, and warmer ocean currents were observed to enhance release of methane from the ESAS. Yet one more sign of an increasingly fragile methane cap.

Models Wrong Again?

Anyone following the rapid pace of sea ice melt will recall how, up until very recently, sea ice melt models got the melt time frame dreadfully wrong. As recently as 2007, modellers were stating that near ice free conditions would not happen until the end of this century. Now, after two devastating record melt years in 2007 and 2012, bringing Arctic sea ice within a paltry 2.1 million square kilometers of zero, even the most conservative scientists project the potential for near ice free conditions by around 2035 to 2040, with the more aggressive among these putting the Arctic at a near ice-free end summer state by 2016 to 2020. Meanwhile, global climate model projections of sea ice loss continue to lag well behind observed trends. A mean of IPCC model runs still project a total or near total sea loss by 2100 in a mean of the models surveyed and those models that appear to be within the standard deviation of current observed ice loss trends predict, in their mean, an ice-free or near ice-free state by 2050. So what we have is a noted split between expert analysis of what is happening and what is likely happening to sea ice, and a continued set of highly conservative and apparently inaccurate (at least under current trends) projections by GCMs.

This observed conservatism in GCMs also calls into question their accuracy in predicting the response of global methane traps, especially the critical ESAS methane store. For the ESAS cap to even partly fail, as it now hints at doing, at any time this century would be another massive under-estimation by the climate models. It would also put at risk, as Wadhams warns, the release of gigatons of methane from its ever more permeable ESAS traps together with a number of very severe climate consequences.

Emission Rate Bad, But Not Catastrophic At This Time

Currently, however, it appears that such a very large release is not yet underway. A 17 megaton emission, though double previous estimates and outside the range projected by GCMs, represents about 2.8% of the global total methane emission from all sources (or 10% the total US emission). This puts ESAS on the map of very large single sources, but it does not yet provide enough methane to overwhelm the current methane balance. To do that, yearly rates would have to rise by an order of magnitude, reaching about 150 megatons a year or more.

Ironically, about a 150 megaton per year emission, averaged over thousands of years, is what climate models currently project (although the models show larger emissions happening much later). So it is worth noting that even getting on this track would be a bad consequence while exceeding it by any serious margin this century would be a very, very bad consequence indeed.

To put the size of the ESAS methane store into context it is worth considering that should the ESAS emit 1 gigaton of methane each year, it could continue that emission for more than a thousand years. Such a rate of emission would about effectively double the current forcing from human CO2 emissions and extend the time-frame of that forcing for up to 15 centuries.

Thankfully, we haven’t yet approached such a catastrophe. Instead, the current emission combines with other sources to continue to slowly push world methane levels higher, adding incrementally more heat forcing to an already stressed global system and adding to a yearly growth rate of about 10-20 ppb each year.

A Marker for Future Comparison

Shakhova’s research does, however, put a marker on the ESAS emissions map. Should we return in a few years to find emissions dramatically increased, we will have more evidence that ESAS is indeed rapidly destabilizing. Shakhova and Semiletov’s earlier observations provide some evidence for this already. However, with a quantifiable figure now available, it will be easier to gauge to what degree ESAS is increasing its already substantial, but not currently catastrophic, methane release.

Links:

Ebullition and Storm Induced Methane Release From the East Siberian Arctic Shelf

Arctic Ocean Leaking Methane At Alarming Rate

Arctic and Methane in Context (David Archer attempts to provide some comfort)

More Arctic Methane Bubbles Into the Atmosphere

Arctic warmer than at any time in at least 44,000 years and probably 120,000 years

Climate science: Vast costs of Arctic change

Wadhams Explains Mechanisms in Cambridge University Press

And the Wind Cries Methane

(Updated December 18)