
It didn’t take long for Arctic sea ice to start to respond to a fossil-fuel based accumulation of hothouse gasses in the Earth’s atmosphere. For since the 1920s, that region of ocean ice along the northern polar zone has been in a steady, and increasingly rapid, retreat. Rachel Carson wrote about the start of the Northern Hemisphere ocean ice decline in her ground-breaking 1955 book — The Edge of the Sea.
But it wasn’t until the late 1970s that consistent satellite observations began to provide an unbroken record telling the tale of Arctic sea ice decline. The National Snow and Ice Data Center, The Polar Science Center (PIOMAS), Japan’s JAXA, The Danish Meteorological Institute, and others have since that time provided a loyal recording of the stark impact human-forced warming has had on this sensitive and critical region.
(Severe sea ice volume losses since 1979 illustrated in the above video by Andy Lee Robinson.)
Perhaps the most poignant and direct telling of this tale has been provided in the form of Andy Lee Robinson’s tragic and resonant re-rendering of sea ice volume declines as measured by PIOMAS. Others, like Neven over at the Arctic Sea Ice Blog, have heroically and often thanklessly provided the essential week-to-week analysis of this tragic decline. Rising to the task of a necessary telling of a key chapter in the human tale that our mainstream media sources have all-too-often neglected. Before we go on to today’s update on an Arctic Ocean ice cap that is now in a critically weak condition, I want to add one last mention — these scientists, analysts, experts, and creative and artistically inclined laymen have done the right thing. They were the modern-day prophets providing the critical warning that has been oft-ignored.
A Tale of Devastating Losses
It’s a warning that has been written in the record of the ice itself. A decline that since 1979 has followed a steepening descent curve. An overall downward trend punctuated by the abrupt and severe loss years of 2007 and 2012. A trend that has, nonetheless, featured a few weak challenges in the form of pseudo-recovery years like 2008, 2013, and 2014. A precipitous loss that, all too soon, will likely terminate with abrupt finality in temporally-expanding blue ocean events. Periods when little or no sea ice is observed on the surface of oceans and seas within the Arctic.

(After the warmest Winter and early Spring period on record, Arctic sea ice extent, area and volume are now at or near new record lows. With abnormal heat persisting and with the ice showing an extraordinary lack of resiliency, there appears to be a heightened risk that Arctic sea ice will hit new record all-time lows by September and October of 2016. Image source: JAXA.)
Why should we talk about blue ocean events now? Well, we have only to look at the sea ice record to find that substantial losses have occurred during single years. Years when Arctic heat hit new peaks — lining up with severe adverse weather conditions to take a terrible toll on the ice. Years like 2007 when nearly 2 million square kilometers of ice was lost over the previous year and 2012 which featured about 800,000 square kilometers of extent lost below the 2007 low mark. And if a blue ocean event does happen, it will be during one of these severe loss years.
Extremely Frail Sea Ice During the Spring of 2016
2016 and 2017 could be years when such precipitous declines occur. Heat from an extraordinarily powerful El Nino already skipped over the weakening atmospheric wall of the Jet Stream to invade the High Arctic during Winter of this year. As a result, Winter and Springtime Arctic temperatures are currently at their warmest levels ever recorded.
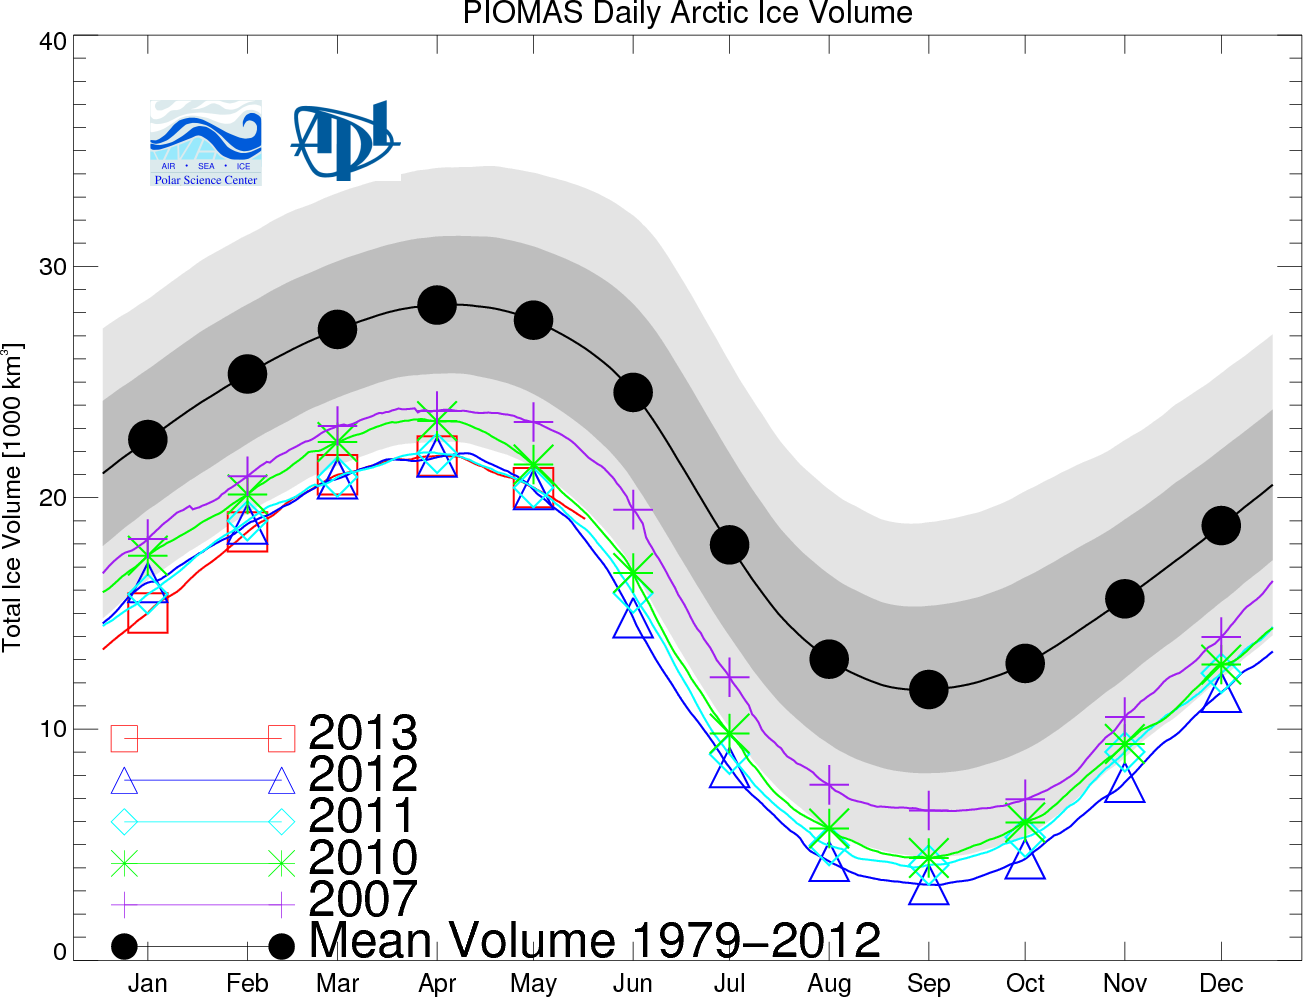
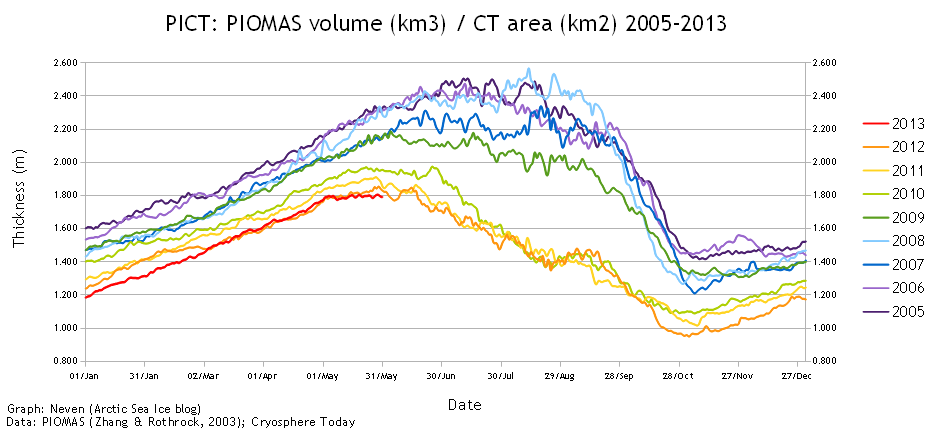
All this extra heat is doing a number on the ice. Sea ice extent, volume and area, which had experienced a false recovery during the years of 2013 and 2014, have again retreated to seasonally record low levels. In particular, the new near record low seasonal volume measure is disturbing. For while area and extent measure the expanse of surface ice as visible from above, volume measures the ice in three dimensions — giving a better idea of overall resiliency or lack thereof. It’s worth noting that the PIOMAS volume measure is based on a model of assimilated observational data. And, as with any model, there are a few assumptions built in. But overall, PIOMAS has tended to provide data that has matched with other observational findings.

(Extreme fracturing of Beaufort sea ice over recent days has come after a record warm Arctic Spring and Winter and during a period when a powerful high pressure system has been breaking and compacting the ice. Image source: LANCE-MODIS.)
Sea ice frailty seen in the measures is also verified by current satellite observations of the ice surface. This frailty is particularly visible in the region of the Beaufort Sea north of Alaska and Canada. There, extensive fracturing of the ice is clearly visible in yesterday’s MODIS satellite shot. Here we find huge regions of thin ice and open water as the torquing influence of a powerful high pressure system has turned the greatly weakened Beaufort ice into a sea of ice cubes.
During recent years in the post 2012 timeframe, Beaufort ice has shown a considerable lack of resiliency to fracturing. This is particularly disturbing as, historically, the Beaufort Sea has tended to house the thickest, toughest ice in the Arctic. If such a great former bastion for the ice can now be torn to ribbons by the slightest fluxes of wind and weather, then the sea ice is, indeed, in a rather wretched state. And last year, just this kind of early fracturing and warm up in the Beaufort greatly contributed to an overall return to the trend of an Arctic sea ice death spiral in 2015.
Neven notes in a recent blog at his Arctic sea ice portal:
Last year’s April cracking event caused a lot of fragmented multi-year ice to be transported all the way up to the Chukchi Sea (see here), leaving a vulnerable looking barrier on the Pacific side of the Arctic. When this was followed by an early heat wave in May (see here), the ice in the Beaufort and Chukchi Seas received a beating it never really recovered from during the rest of the melting season. This was also because continental snow had melted out really quickly, making it possible for warm winds to blow in from the land.
Heating From Both Water and Land
Compared to last year, this year looks quite a bit worse. A wide-ranging Beaufort break-up is happening on the back of last year’s losses and is concurrent with new record and near record low sea ice extent, area and volume values and is happening during a period in which Arctic heat has hit new all-time highs. The result is a risk of compounding melt factors hitting the greatly weakened ice all at the same time.
Locally, the kind of widespread fracturing we now observe can result in a loss of protective reflectivity for the sea ice. As the Springtime sun rises and more of its direct rays fall upon the ice, darker thin ice patches and areas of open water will absorb more of the solar heat. That extra heat will then go to melting the islands of thicker ice that remain.
This situation can generate a compounding effect of ice losses if weather conditions and atmospheric temperatures line up. In addition, loss of the thicker sea ice cap during break-up can result in the ventilating of heat from the warmer waters beneath the ice. In fact, it is the heating of waters beneath the sea ice by means of current transport of warming ocean waters from around the world and into the Arctic that is one of the chief drivers of Arctic Ocean ice losses as the globe has been forced to warm by human fossil fuel emissions. So not only does an ice crack up in the Beaufort reduce the ice’s resiliency to the sun, it also tears the lid off the deeper ocean warming rising up from below.

(Lower albedo due to ice fracturing results in more of the sun’s rays being absorbed into the ocean surface. A warmer Arctic Ocean surface then radiates more heat into the surrounding environment. Such conditions can result in periods when temperatures over the, previously colder and solidly frozen, Arctic Ocean are far warmer than even over land masses on the verge of tipping into a springtime thaw. Image source: Earth Nullschool.)
During Arctic Spring, when land surfaces are now retaining snow cover even as the sea ice breaks up, the effect of lower albedo and ocean heat ventilation can be found in the form of warmer temperatures over thin ice, broken ice, and in open water regions when compared to nearby land masses. Such a condition of newly added heat over ocean zones can have substantial impacts come Summer if melt-favorable weather patterns continue to hold sway. The result is a kind of melt synergy developing between the land, the waters, and the sun. Early on, during Spring, the warmer ocean zone weakens ice and provides warm air pools that aid in the initiation of snow melt over adjacent land. Then, as land warming ramps up, the warm winds coming from regions of early snow withdrawal provide further pressure to the already greatly weakened ice.
A Big Burly High as the Final Ingredient
Weather patterns that favor melt during Spring and Summer include powerful high pressure systems dominating large regions of the Arctic. And for much of the past week, an extremely intense high in the range of 1040 to 1045 mb has stooped over the Beaufort, torqued the ice, and developed the kind of strong clockwise wind flow that has tended to result in fracturing, ice compaction, and the opening of darker ice and open water areas (please read Neven’s fantastic recent blog on this observation here).
This kind of weather system is the last ingredient necessary to trigger an early, rapid melt for the side of the Arctic where the last of the thick, old ice now remains. And it appears that, for at least two weeks, such conditions will hold strong sway over the Beaufort.
So overall, more and more conditions are lining up to deliver a ramping up of melt pressure on the Arctic sea ice. Record atmospheric heat, early break-up, record low or near record low area, extent, and volume, and a powerful high pressure system over the Beaufort do not at all bode well. In fact, this looks like a near perfect early season set-up for a record melt in 2016 should this clearly ominous trend continue.
Links:
The National Snow and Ice Data Center
The Polar Science Center (PIOMAS)
The Danish Meteorological Institute


