Arctic Sea Ice Volume Continues to Crater

“Facts are stubborn things; and whatever may be our wishes, our inclinations, or the dictates of our passions, they cannot alter the state of facts and evidence.”John Adams

*****


(March sea ice volume hit a new record low in the PIOMAS measure during 2017. Image source: Oren and the Arctic Sea Ice Blog.)

This week, measurements from PIOMAS indicate that Arctic sea ice volume for the month of March hit new, all-time record lows during 2017. March 2017 volume, according to the Polar Science Center, dropped about 1,800 cubic kilometers from the previous record low set during the same month in 2011. In total, more than a third of March sea ice volume has been lost since 1979.

The Polar Science Center notes:

Arctic sea ice volume through March 2017 continued substantially below prior years. March 2017 sea ice  volume was 19,600 km3 ,  1800 km3 below the previous record from March in 2011. This record is in part the result of anomalously high temperatures throughout the Arctic for November through January discussed here and here [and here]. February volume was 39% below the maximum March ice volume in 1979,  27% below the 1979-2016 mean, and more than 1.7 standard deviations below the long term trend line.

This increasingly thin ice cover should continue to grow a little more to reach a seasonal peak during the first or second week of April. And as you can see when looking at the graph below, the trend line following that peak does not paint a very optimistic picture for sea ice resiliency during the 2017 melt season.

(The rate of sea ice refreeze this year has been very slow. As a result, the trend line points toward the potential for a melt season that exceeds even the record low year of 2012. Image source: PIOMAS.)

Merely transposing the present gap between March 2017 and the last record low to the end of melt season in September would about split the difference between 2012’s record melt and a completely ice-free Arctic Ocean — leaving about 1,700 km3 sea ice remaining by September of 2017.

A more detailed meta-analysis of this rather ominous-looking trend line finds that after hitting a peak of around 20745 km3 of sea ice sometime this month, an average of 18270 km3 of this ice will tend to melt out during the spring and summer so long as the past 10 melt seasons are a reliable predictor of future results. If this happens, sea ice volume will hit a new record low of around 2,530 km3 by September — which would be about 1/3 smaller than the amount of ice remaining in the Arctic Ocean following the tremendous 2012 melt season. And a very strong melt season — similar to conditions seen in 2010 — could reduce the ice to less than 1,000 km3 which is well into the range of a near-ice-free state.

(The Arctic has never been so warm in winter as the number of freezing degree days hit a new record low during 2016-2017. For context, the less freezing degree days the Arctic Ocean sees, the closer it is to melting. Image source: Cryosphere Computing.)

Of course, April through June could see cooler conditions — which would tend to preserve more ice and tamp down the ultimate rate of loss. But the present record low sea ice volume and near record low extent sets up a situation where darker seas will absorb more sunlight and stack the odds in favor of warmer than typical conditions and higher overall rates of melt. Meanwhile, presently strong sea ice export through the Nares and Fram Straits appears to be continuing a trend of relative sea ice volume loss through early April.

(UPDATED)

Links:

PIOMAS

The Arctic Sea Ice Blog

Cryosphere Computing

Pair of Arctic Storms Sparked Severe Polar Warming, Sea Ice Melt For November of 2016

Hat tip to Ryan in New England

Hat tip to Cate

Hat tip to Yvan

January Arctic Sea Ice Volume is Lowest On Record by a Considerable Margin

Almost continuous warm, moist air invasions of the Arctic during fall and winter of 2016 and 2017 have resulted in the lowest sea ice refreeze rates on record. As a result, the amount of ice covering sections of the Northern Hemisphere ocean is now remarkably lower than during past comparable periods. In other words, we’ve never seen a winter in which Northern Hemisphere sea ice was so weak and reduced.

One key measure, sea ice volume, has shown particular losses when compared to past years. And even taking into account a long term trend of ice losses for the northern polar region that has been ongoing since the 20th Century, the 2016-2017 losses stand out like a flashing red indicator light. A trend directly related to the human-forced warming of our world through fossil fuel burning and related greenhouse gas emissions.

piomas-sea-ice-volume

(Significant sea ice losses during the winter of 2016-2017 show up clearly in the above PIOMAS graph. PIOMAS is a model measure of sea ice volume. And as you can well see when looking at the red line at the left hand side of the graph, the departure from past years is currently quite large. Image source: PIOMAS.)

In the above PIOMAS graph we find that January sea ice volume averaged around 14,000 cubic kilometers. This reading is roughly comparable to the early July average for the period of 1979 through 2016 — a time when the Arctic saw continuous declines in sea ice. The present reading is also about 1,500 cubic kilometers below the previous record low for the month of January set in 2013. And anyone looking at the above graph can well see that the departure is significantly below the trend line (about 8,000 cubic kilometers below the falling 38 year average for this time of year).

It’s worth reiterating that these are the lowest sea ice volumes ever seen for this time of year in the Arctic. A new record that comes after consistent new record lows occurring throughout the past 38 year period.

Presently, approximate 5 C above average temperatures are dominating the region above the 66 North Latitude. Over the coming days, a pair of warm air invasions of the North Pole region near 90 N are expected to push temperatures to more than 30 degrees Celsius above average and to near the melting point on two separate occasions. This pair of, not at all normal, events will likely produce additional sea ice losses in a polar region that is already seeing very unusual low sea ice concentrations, volumes and extents.

image

(Warm storm invasions of the northern polar region that inject high heat content, ice-melting moisture and far above average temperatures into the High Arctic have been a frequent occurrence over recent months. By February 10, GFS models predict that another such storm will push temperatures to more than 30 degrees Celsius above average for the North Pole and surrounding regions. This will produce yet one more powerful blow to sea ice attempting to rebuild in the region. Image source: Earth Nullschool.)

After these events roar through, the Jet Stream is predicted to flatten somewhat — allowing cooler air to re-establish over the Central Arctic as warmer air invades the mid-latitudes. As a result, air temperature anomalies in the 66 N and above region are expected to fall back to a range of 1 to 2 C above average in the 7 to 14 day timeframe. Such a return to closer to normal conditions may allow for more short-term bounce-back toward previous record low ranges in the volume measure. But a much longer period of closer to average conditions would be required for a full recovery.

Overall, refreeze season tends to last until April. So some time does remain for a bit of recovery. And we have seen extent measures trend closer to past record lows over recent days. However, considering the massive losses experienced during fall-winter of 2016-2017, two months is unlikely enough time to produce a significant recovery even if cooling to more reasonable above average temperatures were to occur and remain in place for an extended period.

Links:

PIOMAS

Earth Nullschool

Climate Reanalyzer

Warm Winds Gather to Invade the Arctic: Summer Sea Ice Melt and The Storms of 2014

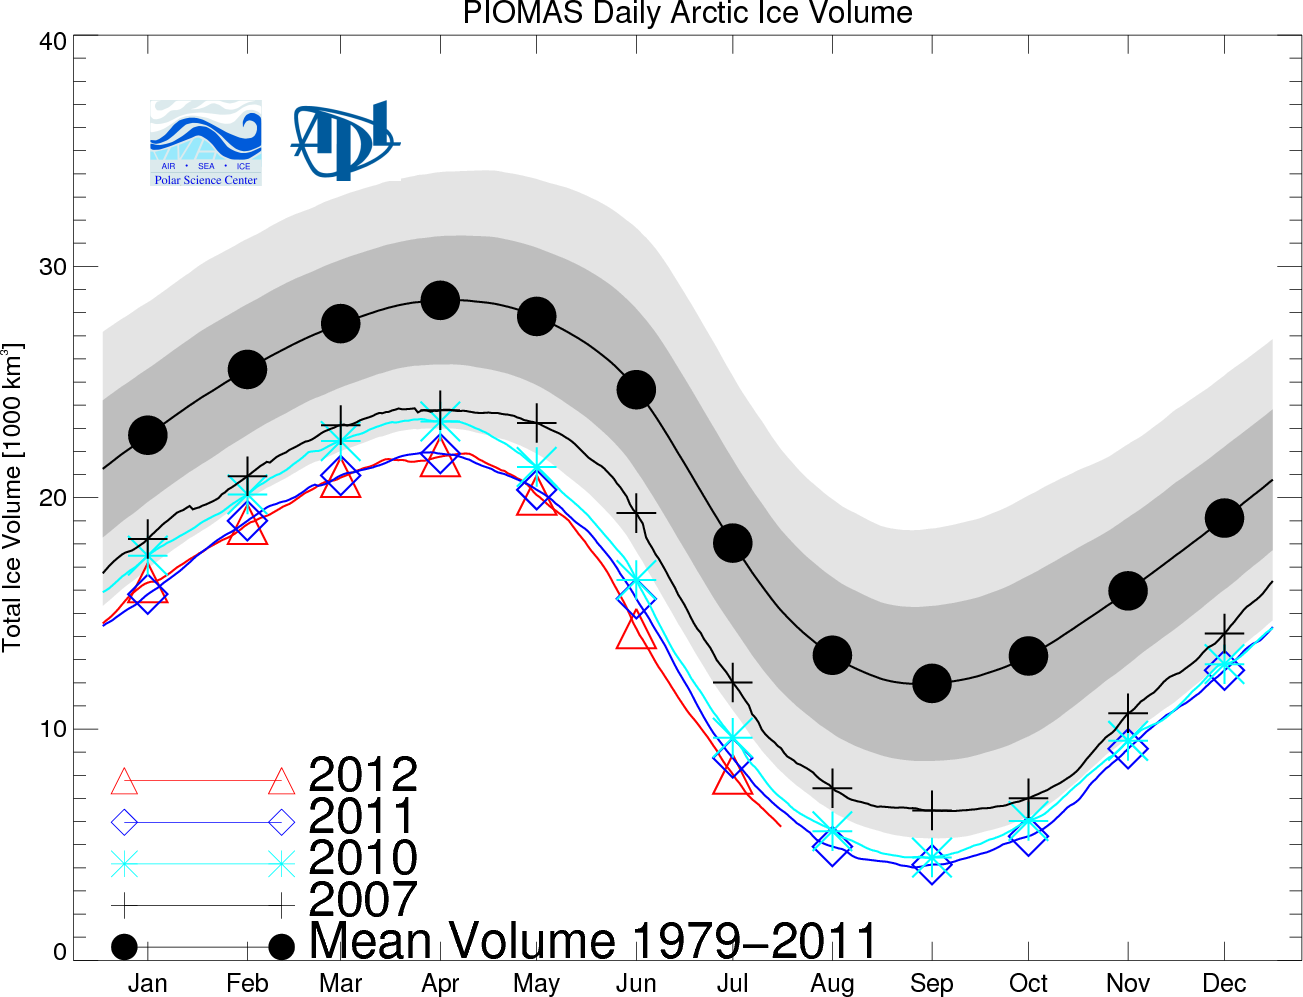
If there’s an aspect of global warming science that remains unsettled, it’s the general state of prediction and analysis over the fate of Northern Hemisphere sea ice. As is well known by now, model predictions greatly underestimated the pace of sea ice loss as a response to human-caused warming. Big melt years like 2007 and 2012 brought sea ice extent and area, by end 2012, to less than 50% of 1979 values. Sea ice volume for the same period was nearly 80% lower than 1979 measures. Such lows were generally not predicted to appear until the 2060s at the earliest.

Ice response to rapid human warming and polar amplification, in these cases, was, for lack of a better description, outrageously stunning. And the weather impacts of such amazing losses were increasingly dangerous and far-reaching. Climate systems inertia, in the case of sea ice, seemed to be no match at all for the strong and likely unprecedented warming forces we’d already unleashed.

Sifting through the sea ice tea leaves

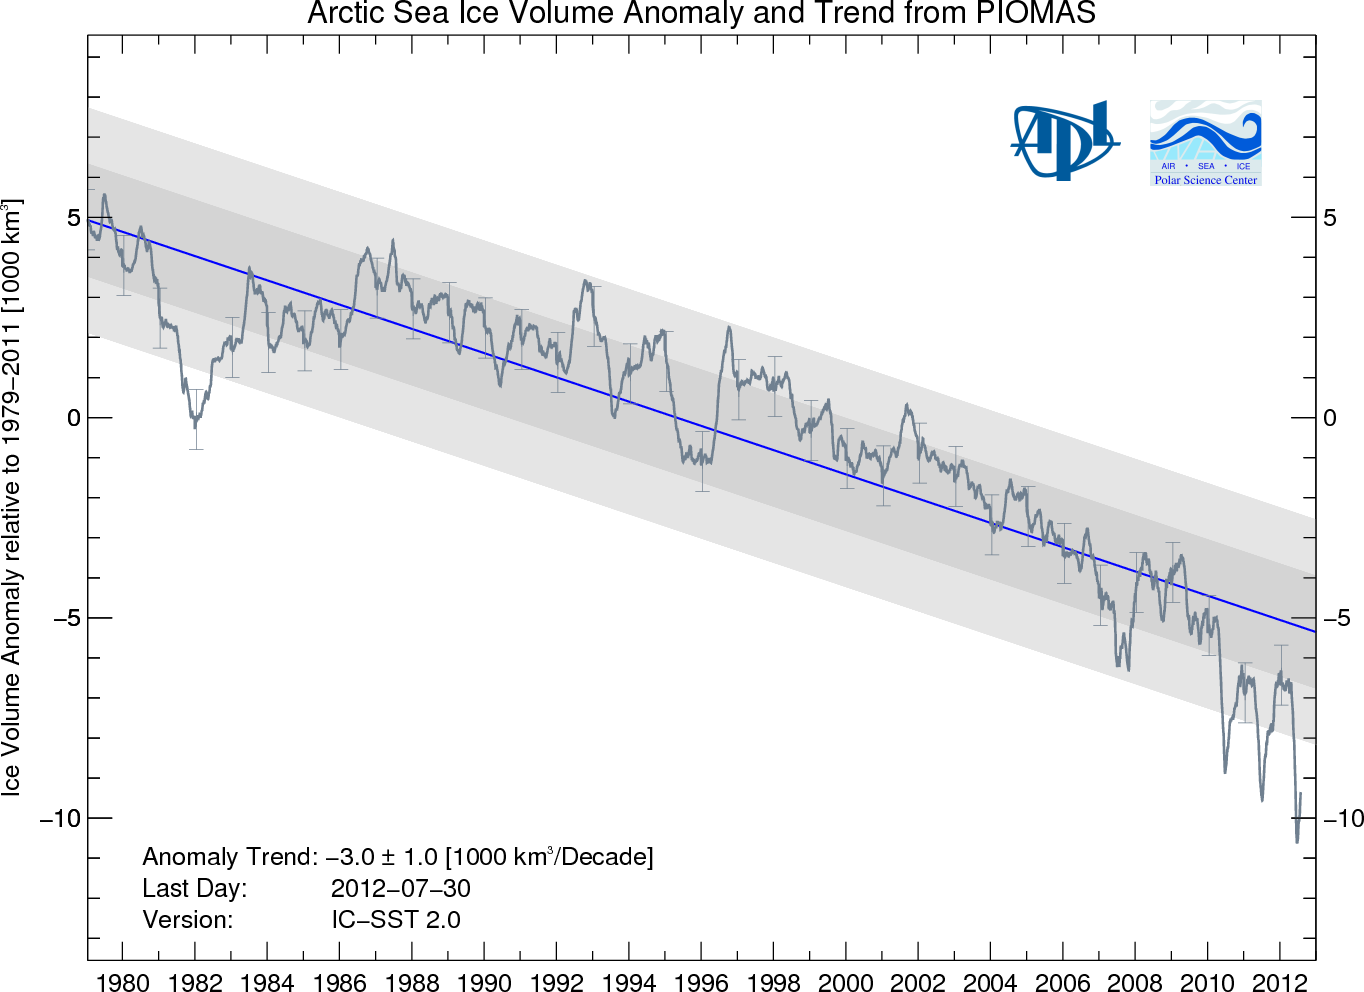
Though much of what happened was and continues to be unexpected, a few overall patterns emerge in the data. Dynamic melt trends for area and extent were composed of massive melt years (2007 and 2012) followed by pseudo recovery years (2008, 2013) where the ice seemed to bounce back a little before inching again toward previous record lows (2009, 2010) or setting minor new melt records (2011 area) before the next big hit.

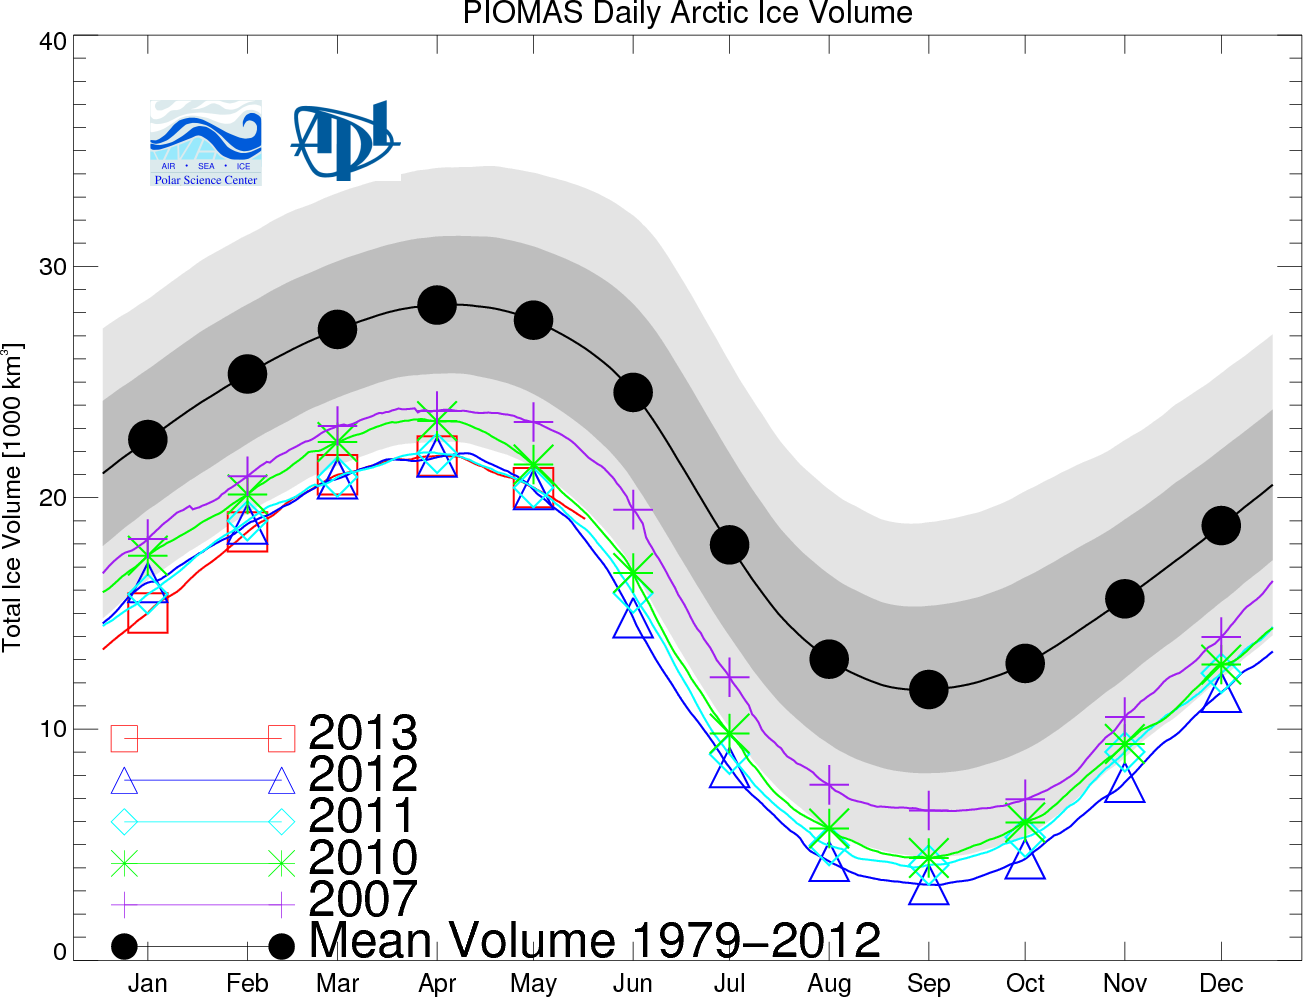
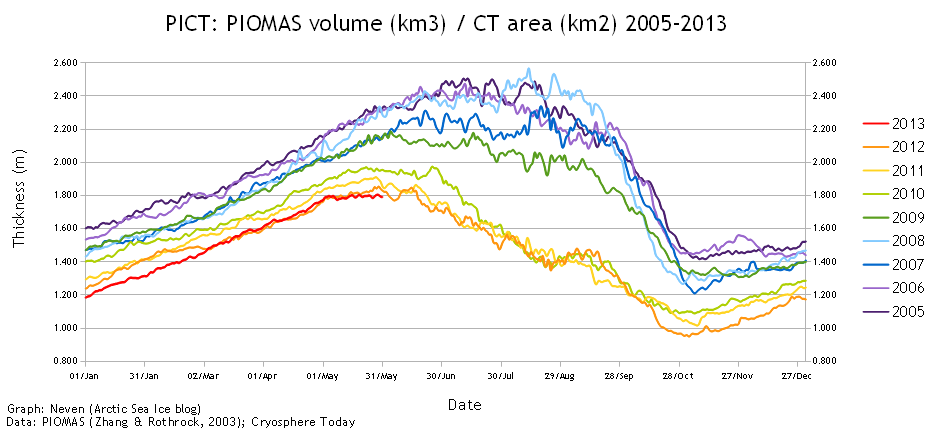
Sea ice volume measures were somewhat less messy with massive melt years (2007, 2010), more minor melt years (2011, 2012), one minor pseudo-recovery year (2008) and one major pseudo-recovery year (2013). In this set, one year (2009) stands out as neither showing a new record low volume nor showing pseudo-recovery as end season volume fell off slightly from the previous year. The fact that 2009 followed a pseudo-recovery year (2008) may or may not be instructive for the current melt season.

It is worth noting that in the volume progression, four out of seven years during the 2007 to 2013 period all showed new record lows.

Piomas Minimum Arctic Ice Volume

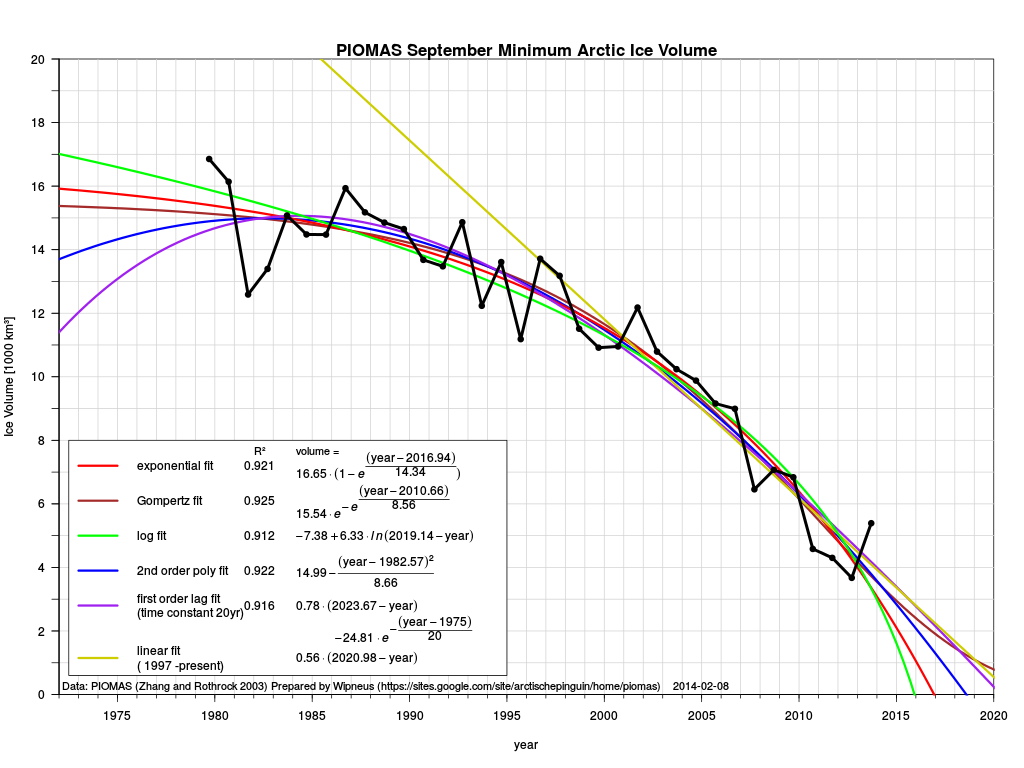
(Graph of minimum Arctic sea ice volume as measured by PIOMAS since 1979 with various trend line projections. Data source: PIOMAS Image source: Wipneus.)

What one can read from these data points is that strong pseudo-recovery years (like 2013 and 2008) have typically been followed in recent years by a return to the decline trend but not to new record lows. So, statistically, this is what we would expect for 2014.

That said, keep in mind that though it remains extraordinarily difficult to predict end sea ice states for any single year, the overall trend of major and unprecedented melt is most likely to continue and the window for a total sea ice loss by end season before 2020 remains wide open. Further, statistical analysis will, in every case, bow to emerging conditions on and beneath the ice.

Evolution of the early 2014 melt season

For the 2014 melt season, the fickle Arctic does not at all disappoint. By late April and early May of 2014, an extraordinarily warm winter period had wiped out most of the 2013 recovery in sea ice volume measures. By mid April, PIOMAS was showing volume in the range of second or third lowest year on record for the date.

By today, May 12, sea ice area and extent measures were in the range of 4th to 5th lowest on record with both measures approximately mirroring 2007 values for the date.

Given the potential for very rapid melt during June and July, as displayed in recent melt years, these values are within striking distance of new record lows should the weather conditions for rapid melt emerge.

Observed conditions for early to mid May 2014

It is worth noting that May does not generally tend to be a predictive month for sea ice loss. In most cases, it is more a bottleneck period where values tend to crunch together as the sea ice softens up but generally shows few breaks toward the more rapid melt trends typically seen in June or toward a slower melt due to weather that is less favorable for ice degradation.

That said, a few currently ongoing conditions may provide some strong indicators for how the 2014 melt season could progress.

High amplitude Jet Stream waves through Eastern Siberia, the Bering Sea and Alaska. A doggedly persistent weakness in the polar Jet Stream along an arc from East Siberia to Western Canada has resulted in much warmer than usual conditions for the Bering Sea, the Chukchi Sea and regions of the Beaufort adjacent to the Alaskan and Canadian coasts. Warm air originating over a pool of much hotter than normal water in the Northern Pacific just south of Alaska has continued to flow up through the Bering Sea, into the Chukchi, and over Alaska and Western Canada and on into the Beaufort.

Tracking this warm air flow resulted in a bit of incredulity as day after day observation showed the air continuing on through the Beaufort, past the North Pole zone, down over Svalbard and the Fram Strait, into the North Atlantic and finally being swept east in the strong cross-ocean wind pattern toward England and Ireland. In this way, air from 40 North Latitude in the Pacific jumped the pole to end up in the Atlantic near England.

A persistence of this weather pattern would have numerous and potential critical impacts for the Arctic during the summer of 2014. First, it would result in a constant pressure of warmer than usual conditions for sea ice along an arc from the Mackenzie Delta and Adjacent Canadian Arctic Archipelago to the East Siberian Sea. Warm winds would assault the ice from launching pads over warmer land masses in this zone, resulting in increased and early ice erosions.

Already, we can see such conditions emerging in the following MODIS satellite shots provided by NASA:

Mackenzie Delta May 11, 2014

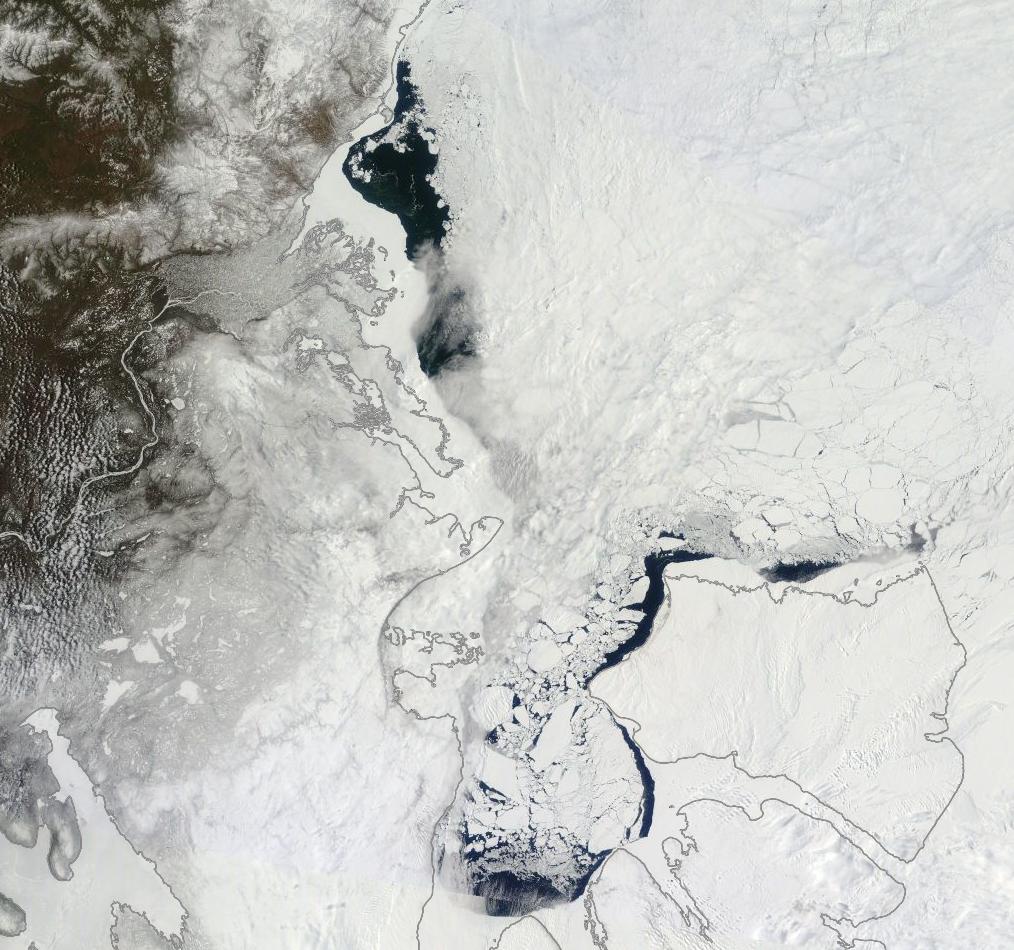
(The Mackenzie Delta [upper left] and adjacent Canadian Archipelago waters. Image source: LANCE-MODIS.)

The above image shows the Mackenzie Delta and the Canadian Arctic Archipelago on May 11 of 2014. In these images, we can seen the result of continued warm winds from the south and near-or-above freezing temperatures. For the Mackenzie Delta, temperatures since early May have ranged between 23 and 42 F, or between 5 and 25 F above average for this time of year. The high temperatures have brought the snow melt line all the way to the coast very early and have resulted in both ice melt and retarded refreeze in the broken ice and large polynyas offshore in the nearby Beaufort. Note that an additional heat influx to these coastal waters will occur once the shallow Mackenzie River fully melts, likely resulting in the early break-up of land-fast ice near the delta.

Chukchi Beaufort Melt May 11, 2014

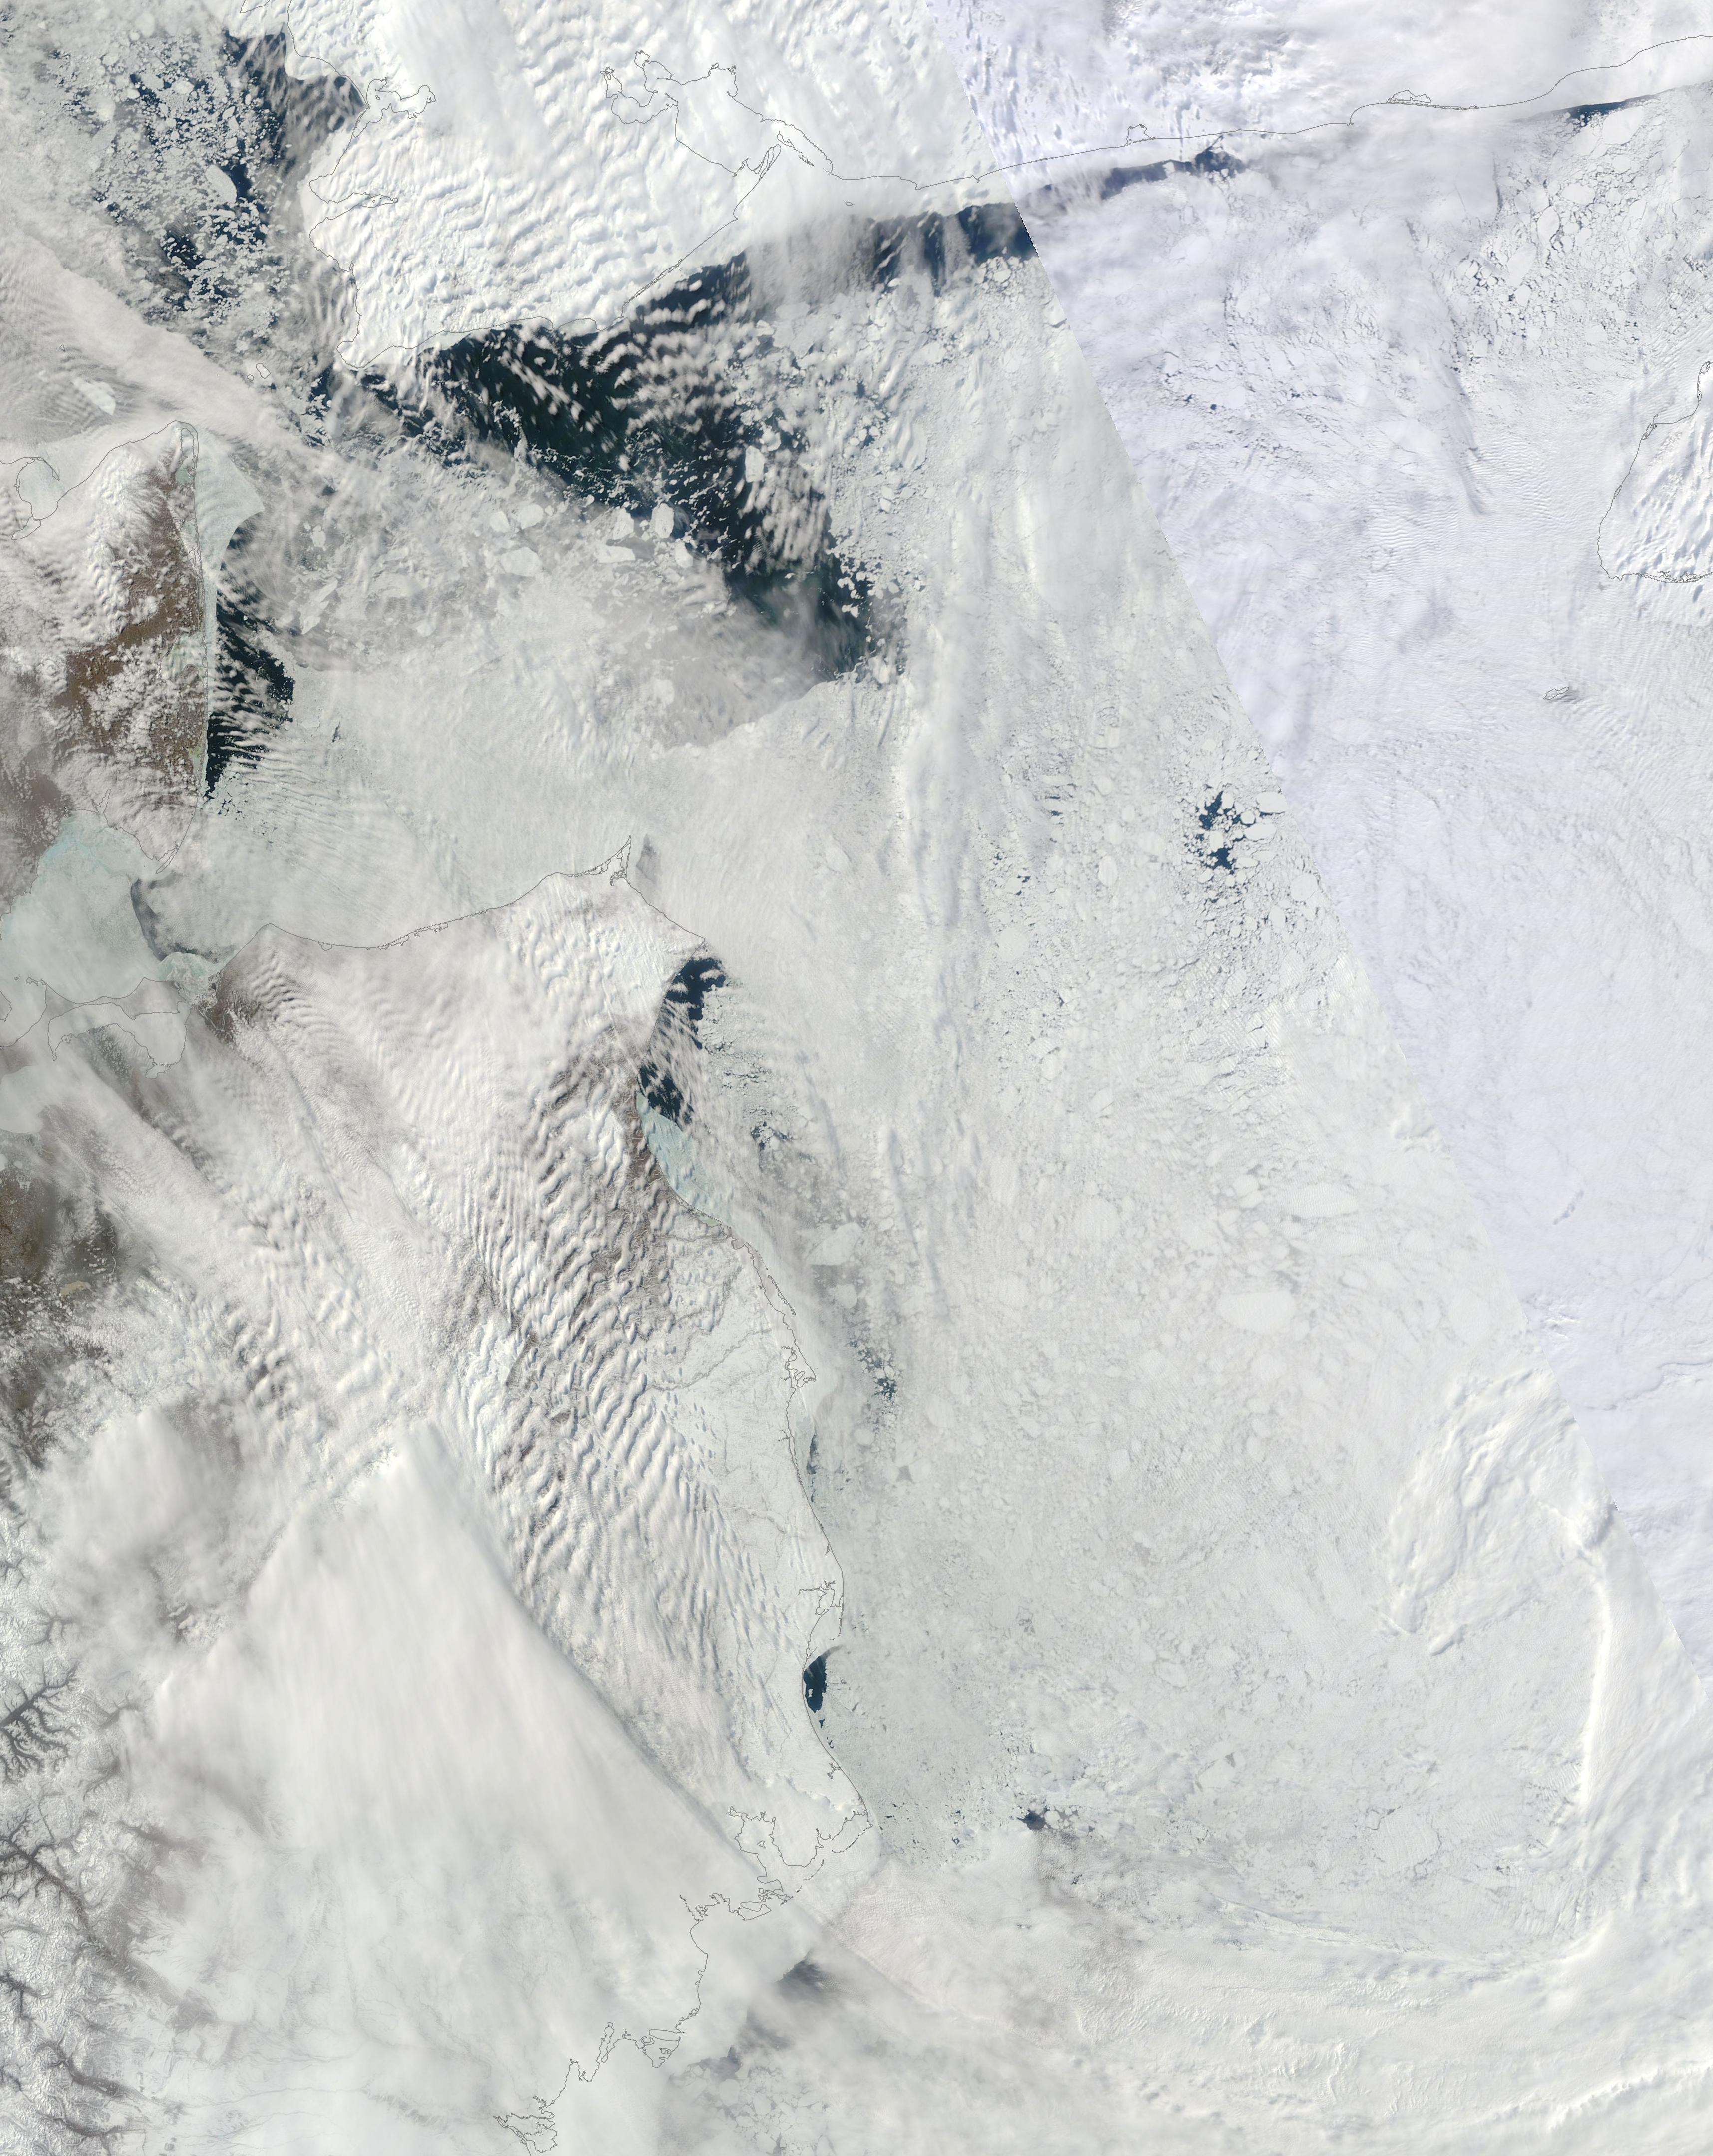
(The Chukchi and Beaufort Seas on May 11, 2014 from the Bering Strait [upper left] to past Barrow, Alaska [lower center]. Image source: LANCE-MODIS.)

Further along the Canadian and Alaskan coasts, we find a continuation of sea ice weakness and break up in the off-shore regions north of Barrow Alaska and on into the Chukchi Sea. Large polynyas remain open throughout the region and exhibit no refreeze in the open water sections. Past the Bering Strait zone, Chukchi melt is very well advanced for early-to-mid May due to a combination of near constant warm southerly wind influx and an advancing warm water wedge through the Bering Strait.

This warm wind pattern through Eastern Siberia, Alaska and Canada and into the Arctic Ocean is reinforced by a combination of ongoing factors including a weakened polar Jet Stream which has tended to generate high amplitude ridges in this zone, a very warm pool of water in the Northern Pacific south of Alaska, and an emerging El Nino which historically has tended to push a high amplitude split in the Jet Stream up toward Alaska. These self-reinforcing factors make it likely that the overall pattern of warm southerly winds over the region will continue to persist and have an impact well into summer.

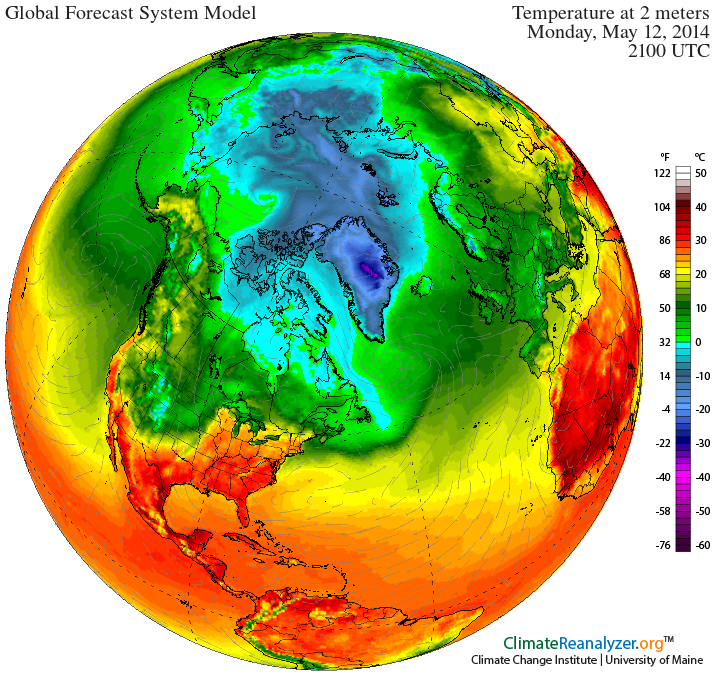
Finally, it is worth noting that the current and ongoing warm air influx through this region provides a constant source of energy for Arctic storm genesis, a factor that may well become more significant as melt season progresses. Forecasts for the next 24 hours show a storm pulling warm, above-freezing temperatures deep into the Beaufort as it begins a transition toward the northern polar zone. It is the second system to exhibit such anomalous warm air inflow and progression into the Central Arctic during the month of May.

GFS Warm Storm

(GFS model summary showing warm storm with associated above-freezing temperatures invading deep into the Beaufort Sea during late Monday and early Tuesday of this week. Image source: University of Maine.)

A third warm air invasion, this time from Eastern Siberia, and potential related storm development is also projected for late this week or early next week.

The Arctic dipole: storms over the Arctic Basin, high pressure over Greenland. Today, we track three Arctic low pressure systems — one emerging from the warm air influx over the Beaufort, one over the Laptev and one north and east of Svalbard. Greenland, meanwhile, shows a high pressure system centered almost directly over its large ice sheet. The net effect of these lows and highs is to funnel the warm wind streaming up from the Beaufort over the Northern polar zone near the Canadian Arctic Archipelago and out over the Fram Strait and Svalbard.

It is a dipole of high pressure over Greenland and low pressure over the Arctic Basin on the Central and Eastern Siberian side that has lasted for about two months through Northern Hemisphere Spring. This set-up creates a strong and consistent wind pressure providing transport of sea ice out of the Fram Strait. It is worth noting that Fram Strait export was one of the primary factors involved in the record low sea ice total seen during 2007, so a consistent dipole pattern of storms over the Arctic basin and highs over Greenland promoting ice export could well weigh heavily as melt season progresses.

Warming over Western Russia and Eastern Europe. A second zone showing consistent ridge development, polar Jet Stream weakness and coincident anomalous warming has emerged over western Russia and Eastern Europe. Such warming was seen during the weak El Nino of 2010 and resulted in severe heatwaves and wildfires for the region. A similar pattern has emerged in tandem with the rising and potentially far stronger 2014-2015 El Nino currently developing in the Eastern Pacific. Though it is too early to tell if this emerging hot zone will reach the extremes seen in 2010, this heat pool is likely to contribute warmth to sea ice zones in the Kara and Laptev Sea as the summer melt season progresses.

So far, Kara sea ice retreat has remained within usual boundaries for recent years. However, it is worth considering the potential strength of this developing warm air pool and how it may impact adjacent Arctic zones as May progresses into June. This week’s forecast now shows above-freezing temperatures predicted to progress into the Kara and 50 degree F readings predicted to push into estuaries bordering the Kara over the next few days.

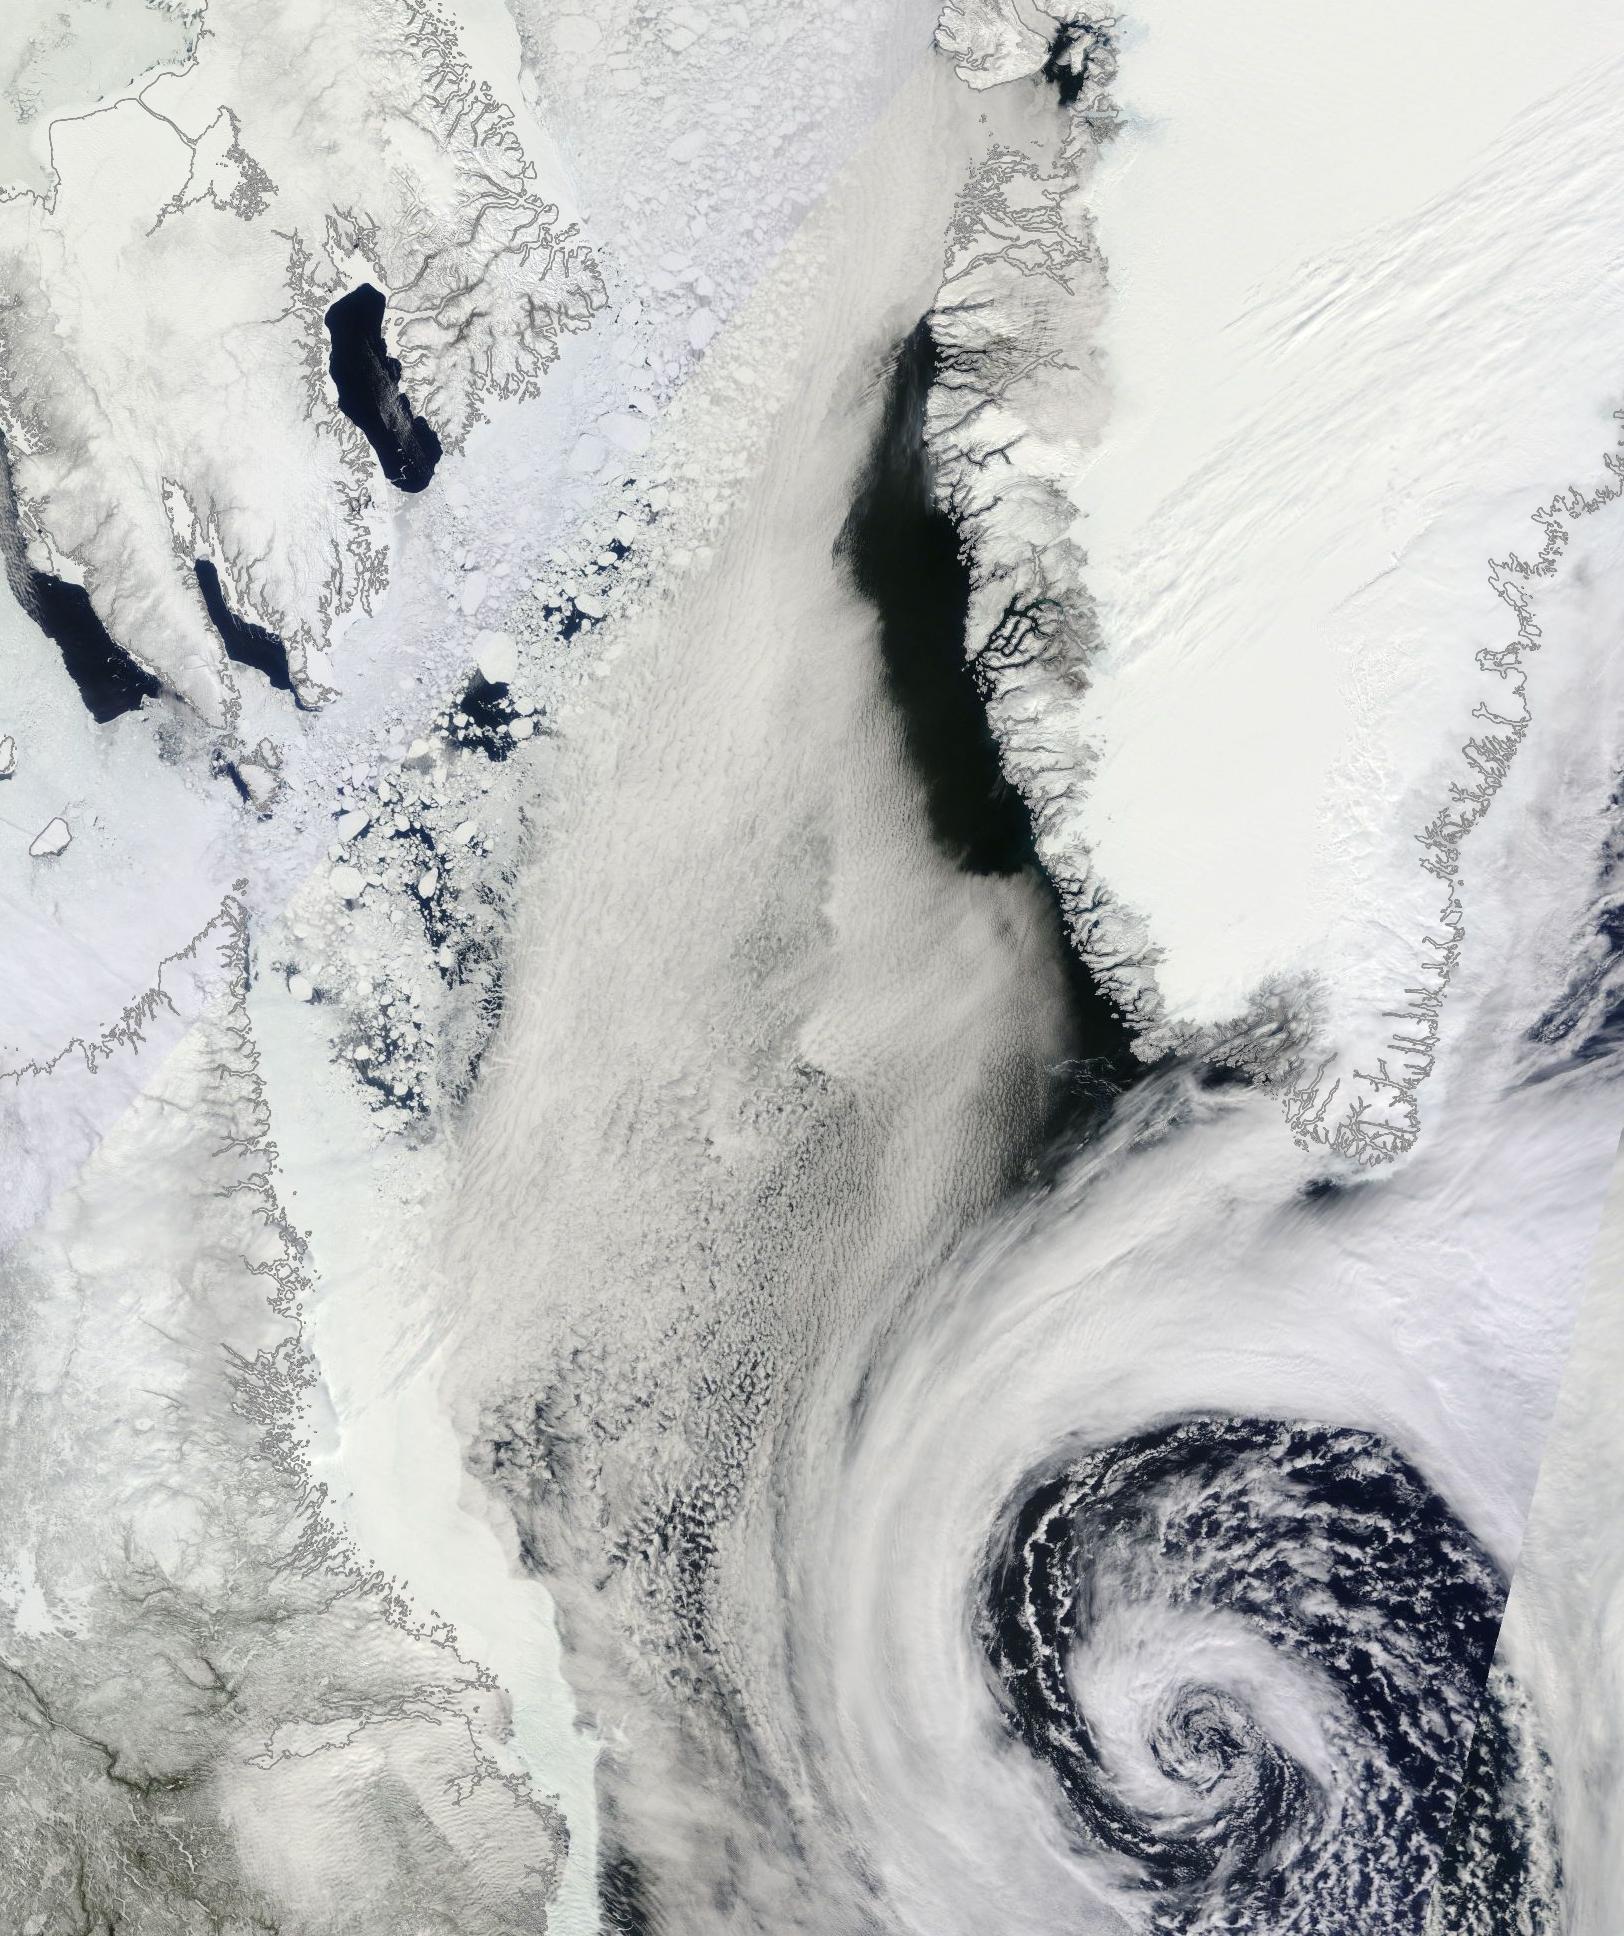
Warm water upwelling, north wind flush, storm suction for Baffin Bay. Finally we come to Baffin Bay, a place many may well consider the Arctic Ocean’s red-headed stepchild. Over recent years, warm water up-welling, possibly driven in part by sea-bed methane release, in Northern Baffin Bay has resulted in an almost constant weakness and erosion of sea ice. This condition creates a bizarre circumstance in which Baffin is often surrounded by warmer waters north and south by late spring. This year is no exception. In addition, a north wind now appears to be flushing Baffin Bay sea ice toward the North Atlantic. The result is an expanding zone of ice-free water along the West Coast of Greenland pushing toward a widening gap in the north of Baffin Bay near the Nares Strait.

To the south, a persistent storm has developed near an anomalous cool zone in the North Atlantic waters off of Newfoundland. This cold pool is likely a residual of the continued dipole, hot-west, cold-east temperature anomaly over North America which has increasingly been squashed toward Newfoundland with the emergence of summer. The cold North Atlantic pool is also likely fed by a rising outflow of fresh, cold water from Greenland glaciers as well as the Baffin Bay ice export already described. A growing Gulf Stream weakening is also well established for the region.

The persistent storm is fed by high temperature differentials in the dipole zone. It is one of the remnant storm systems of this winter’s epic assault on the coasts of Great Britain — a possible precursor to even more vicious storms this coming winter.

But, today, the storm is simply providing added suction to drain ice out of Baffin Bay.

Storm off Greenland and Newfoundland

(Like a drain in a massive bathtub: storm off Greenland and Newfoundland on May 12 reinforces northerly wind flow pulling sea ice out of Baffin Bay. Image source: LANCE-MODIS.)

A final word on Storms and Warm Winds

During late April, we talked a bit about the impact of early season melt ponds on end-season sea ice levels. For recent scientific studies have found that early season melt pond formation has a high correlation with new record lows in sea ice area and extent.

But given the current very thin and broken state of sea ice, it’s worth considering whether the rules for sea ice loss aren’t in the process of changing.

Ever since the 2012 melt season’s close, the Arctic Ocean has exhibited a very battered sea ice state. One featuring widely disassociated packs of broken and brittle ice riddled with a long and pervasive spidering of leeds. For large melt pond systems to develop, the ice pack needs to be relatively contiguous. But the recent ice pack shows very little continuity and could, instead, be said to basically lack integrity. Such a state may well prevent a degree of melt pond formation in areas in which the ice is more and more highly disassociated into floes. And it is this disassociated ice state that may be the current and future norm as sea ice continues to thin and weaken.

In addition, rising temperatures in and around the Arctic have resulted in increased atmospheric water vapor content, increased cloud formation, and increased storm presence during summer periods. This progression toward storminess is consistent with paleoclimate studies showing that ice-free or near-ice-free Arctic states were much stormier than the current one. In the event of an expected stormier Arctic, melt pond formation may well result less from direct solar insolation through clear Arctic skies and more from an increasing number of rainfall and warm fog events over sea ice.

Cyclonic pumping of warmer waters from below the ice pack into surface water zones and the mixing of waters by waves generated by storm winds is also likely to have a far greater impact on sea ice melt than seen in recent years. It is likely we saw a prelude to just such an event during the great, late-season Arctic Cyclone of 2012 which sent waves the size of houses roaring across the Beaufort Sea to batter and disassemble the already weakened sea ice.

In this dynamic and changing system, warm winds are also likely to play a much greater role. Jet Stream erosion, in such a case, unleashes warm southerly winds on the sea ice. The winds, being warmer, hold a higher water vapor content than was typical for the Arctic prior to the human warming insult. Encountering ice and cold water, the water vapor in the winds condenses to form fog. The latent heat in the water vapor is thus released to do work melting the sea ice and warming the sea surface. In such cases, a kind of snow and ice eating mist develops from the warm wind — a blow torch for the sea ice.

Links:

LANCE-MODIS

Dual Ridges Form Sea Ice Achilles Heel for Summer 2014

University of Maine

PIOMAS

Wipneus

Cryosphere Today

NSIDC

Arctic Sea Ice Graphs

The Arctic Sea Ice Blog

The Storms of Arctic Warming

PIOMAS Volume Melt Slowed in May, Too Soon to Implicate Negative Feedbacks.

A slowing in sea ice area and extent melt during May has born out in the PIOMAS volume numbers. According to the most recent PIOMAS update, pace of Arctic sea ice volume melt remained about level during mid-to-late May. In past record melt years, 2011 and 2012 volume melt picked up by the end of May.

2013’s end May melt, however, was more gradual:

PIOMASmay2013

(Image source: PIOMAS)

As a result, sea ice volume has edged away from record low territory and is currently the third lowest in the measure.  It’s a number still quite close to record lows, sitting about 900 cubic kilometers above 2012 values. But closer yet is 2010, the 4th lowest year, which was about 200 cubic kilometers above 2013 by end of May.

Overall, Arctic sea ice volume is a bit more substantial, but still low enough to be worthy of concern. The reason is that, as noted before, the disposition of Arctic sea ice this year is, overall, thin and spread out. PIOMAS shows overall ice thickness just slightly above record low values. While Arctic Ice Blog Neven’s crude ice thickness calculator that simply divides PIOMAS volume by Cryosphere Today area shows ice currently at its thinnest on record:

Neven Ice thickness

(Image source: Neven)

It is also worth pointing out that Greenland and the Central Arctic above the 80th parallel has been somewhat cooler than average this May, despite large regions of substantial warming present in other areas. Whether this trend persists and whether it has an impact on melt for 2013, will be more readily apparent as June progresses.

Emergence of negative feedbacks?

A prolonged slow-down in sea ice volume melt would also begin to beg the question: have negative feedbacks started to emerge in the Arctic? Large influxes of fresh water from Greenland have been flushing into the Arctic since the early 2000s. So one wonders if such high volumes of cold, fresh water could be involved in rejuvenating the Cold Arctic Halocline (CAH) layer while at the same time pumping colder water into the North Atlantic.

This layer of cold water is a key protector of the Arctic ice pack. Over the past few decades, the CAH has been undergoing dramatic retreat. Its retreat is a primary reason why the sea ice is so vulnerable to impacts from a warming ocean beneath. (A number of scientific papers have been written on this subject. The Response to Climate Change of the Cold Arctic Halocline, Shielding Sea Ice from the Warm Deep Water Below is just one example.)

In the Antarctic, scientific research has shown that glacial melt on the Antarctic continent has provided a cold layer of protective water which, in turn, has made the sea ice more resilient there. So if 2013 melt does slow and we get a trend of slower sea ice melt years to follow, it will be worth investigating if such a negative feedback is currently active in the Arctic.

Evidence of Negative Feedbacks in Paloeclimate

An increasing pace of northern hemisphere ice sheet melt has also been implicated in past climate swings. The Younger Dryas period occurring about 12,000 years ago was initiated by the breaking of an ice damn in the Laurentide ice sheet which covered a large portion of North America. This ice damn collapse flooded cold water into the North Atlantic which initiated major swings in climate — setting off a period of colder temperatures that lasted for about 1,000 years.

Geological observations of such a large infusion of cold, fresh water provides an example of how large volumes of melt water can act as a negative feedback and cool the climate. Present day Greenland melt is substantial, averaging about 500 cubic kilometers per year, though certainly not as substantial as what occurred during the Younger Dryas. Nonetheless, Greenland and Canadian Arctic Archipelago glacial melt is likely to have an impact on both sea ice and climate as melt rates increase.

This will be something worth looking at if volume melt continues to slow and cooler conditions begin to persistently crop up in the Arctic. At some point, human greenhouse gas forcing is likely to achieve such an event. When this happens, Arctic temperatures are expected to cool even as warming increases in the lower latitudes. The weather consequences for such an event are quite dramatic (a subject worth exploring in another blog).

All that said, the above is purely speculative and we would have to see a more consistent slow-down in volume melt as well as a regime of cooler Arctic temperatures to validate such an occurrence.

Not out of the Woods Yet

So it is worth emphasizing that we are not out of the woods yet. One month of slower than blindingly fast volume melt in the context of some of the thinnest ice on record does not a trend make.

More ice volume remains in areas outside the Central Arctic Basin and so will be more vulnerable to mid-to-late-season melt. In contrast, Central Arctic ice is much thinner than usual, also making it vulnerable. So volume numbers will be more telling once we start getting substantial melt in Hudson Bay, Baffin Bay, and the Kara Seas. Speculation for a major June melt, for various reasons, is running particularly high (An interesting and well-thought-out take is that of Chris Reynolds over at Dosbat.).

This fragile state makes end of June PIOMAS numbers an important indicator. If temperatures are cool, the edge ice stays more resilient, the central ice is able to hold together under the pounding of our Persistent Arctic Cyclone (PAC) of 2013, and the pace of overall melt remains slower as volume numbers remain somewhat higher by end of June, then it becomes a bit less likely we will see another record year in 2013. Were such an event to occur, we’d have to revise our end-of-year melt risk estimate downward.

We are still in record low territory. June is a volatile month. And we have the PAC of 2013 as well as the potential emergence of warmer waters from the depths to contend with. So June is likely to be a very, very interesting month.

The Big Thin Begins: Week-Long Cyclone Chews Away Fragile Arctic Sea Ice

cyclone-arcticictn_nowcast_anim30d

(Image Source: CICE)

A moderate-strength cyclone that emerged about six days ago and is expected to last at least until Monday is slowly chewing away a large area of Arctic sea ice near the North Pole. Cyclonic action generated by the storm is now resulting in an unprecedented thinning of central Arctic sea ice. It is important to note that should this ice thinning continue, it could have major impacts on end summer sea ice this year.

The low that is causing the trouble moved out of the region of the Beaufort Sea, skirted East Siberia and had transitioned into the central Arctic Ocean by about May 24th. Since then, it has persisted, remaining nearly stationary with a slow drift back toward the Beaufort. Forecast maps show the low remaining in this region until at least Monday before it weakens and moves toward the Mackenzie Delta. Strangely, long-rage forecasts show it re-strengthening even as it returns to the central Arctic.

Arctic cyclone

(Image source: DMI)

Minimum central pressure continues to hover around 990 millibars. This moderate strength compares to the much stronger Great Arctic Cyclone of 2012 which bottomed out around 960 millibars. However, the storm is quite strong for this time of year, when Arctic cyclones tend to be rare and weak, containing enough energy to generate winds that erode sea ice.

This erosion takes place via a pumping process by which the ice is pushed against the ocean surface by the cyclonic wind field. This motion, in turn, stirs up the underlying waters creating a warm, upwelling current. Since the forces occur over broad regions, powerful surface forces allow the upwelling to dredge deep, causing mixing between surface and lower layers. Tendrils and micro-currents of warmer water thus rise to contact the ice. This action can melt the sea ice from below, breaking it into smaller chunks, opening polynas, and riddling the ice with leads. If the storm grows strong enough, large wave action can devour whole sections of ice. But, in this case, the storm does not appear to be powerful enough to generate this kind of wave action.

Since 2012, we have already seen two major upwelling events. One, already mentioned, was the Great Arctic Cyclone of 2012. The second, involved strong off-shore winds during February and March which pushed ice away from shore and, in the region of Barrow Alaska, resulted in near-shore upwelling that temporarily melted ice even as it was pushed out to sea. The combined result was open water during winter.

We can see the storm’s current and projected impacts on the CICE model run posted at the top. CICE is projecting the development of a large area of thin and fractured ice near the North Pole in the storm’s wake even as a region of thick ice north of the Canadian Arctic Archipelago erodes. These projections show average thickness in a wide region falling from about two meters to less than one meter.

That’s very thin ice for North Pole regional waters.

Already, some impacts from the storm are visible in Lance-Modis shots of the region.

Arctic_r04c04.2013150.terra.1km

(Image source: Lance-Modis)

In the above shot, we can see the center of our moderate-strength cyclone near the middle-left portion of the image. To the right of the storm center, we can see down through the clouds to areas where the ice has fractured, revealing the dark blue waters beneath. Below the storm center and near the lower left-hand corner of the image is the North Pole. So what we are seeing is a broad area of leads and fractured ice with gaps measuring up to about 5 km wide within 200 miles of the North Pole. This kind of development is not at all usual for late May, much less late August.

CICE model runs show ice in this region continuing to thin, fracture and weaken as the storm passes.

As the storm moves away, it is expected to pull warm air in behind it, which could further weaken the ice. ECMWF weather forecasts show this warm air influx occurring by about June 4:

WarmairRecmnh1202

(Image source: ECMWF)

In the above image, we see 5 degree C temperatures plunging directly into the heart of the Arctic. A powerful late spring event should it emerge.

In the past, storms of this kind have had very little impact on sea ice. However, this year the ice is very thin and spread out. Most ice in the Arctic is showing a thickness of two meters or less. Records of past melt seasons show that two meter or thinner ice is unlikely to survive the melt season.

Furthermore, packs of much warmer air are drawn closer to the Arctic center by a wavy pattern in the jet stream. The result is that large north-south swoops draw warmer air up from the south even as they push Arctic air into more southerly regions. Europe, in particular, suffered due to this mangling of the jet stream. Ironically, a growing body of scientific evidence shows that these very changes in the jet stream are a result of loss of sea ice. So it appears that loss of sea ice is resulting in a snow-balling of forces that contribute to its ultimate demise.

The ultimate result is an Arctic-wide ice thinning impacting even the most central and protected areas. Even in this region of the central Arctic, where ice is usually much thicker, large regions of 2 meter or thinner ice dominate. You have to venture closer to Greenland and the Canadian Arctic Archipelago to find areas of ice thicker than 2 meters. However, as the recent evacuation of a Russian Arctic Expedition in that region shows, even the thickest ice is far more fragile than before.

The result of all this thin and broken ice is that it is much more vulnerable to surface conditions. A storm moving over thin and broken ice is much more likely to churn it up, breaking it and mixing it with the warmer waters underneath. Last year, we saw this process in action during the powerful Great Arctic Cyclone which emerged in August, churning up a large area of the Beaufort Sea, then drawing warm air in behind it, resulting in major sea ice losses.

At times when ice was thicker, moderate or powerful storms would not pose a threat for enhanced melt. But since 1979, the Arctic has suffered an 80% loss of sea ice volume.

This year, sea ice volume is currently at record low levels. Yet the ice pack is very spread out, boasting an area near 2002 values. This combination of wide coverage and low volume leaves the ice very, very thin and fragile. So now, even moderate cyclones like the one hovering near the North Pole can chew away at the ice.

If the CICE projections bear out, we’ll see the central ice pack greatly weakened in the wake of this storm just as solar radiance and warm air build into mid-June. At this point, such injuries to the ice make it more likely that rapid and catastrophic decline in coverage will begin to dramatically ramp up over the next few weeks.

As Neven over at the Arctic Ice Blog notes:

I feel the Arctic sea ice pack could soon go POP under the right conditions.

Let’s see:

  1. Thin, spread-out ice pack.
  2. Persistent storm chewing away the central ice.
  3. Large cracks and areas of open water riddling most of the ice pack.
  4. Large polynas forming behind the ice edge.
  5. Upwelling events eroding the bottom ice.
  6. Loss of Arctic expeditions in the region of the ‘thickest’ ice.
  7. June heat and constant, direct sunlight approaches.

Looks to me like a lot of the ‘right’ conditions are present.

In short, don’t let the high extent and area numbers fool you. The thin, spread out state of the ice leaves it more vulnerable, not less so. The sea ice is weaker and less resilient than it ever was. Only a cold summer and conditions favorable for ice retention are likely to prevent a record melt in either area, volume or extent. On the other hand, very bad conditions could result in near-total melt (under 1 million square kilometers end season area).

UPDATE:

Long-range weather models show the cyclone sweeping down toward the Mackenzie Delta, drifting back toward the Canadian Arctic Archipelago and finally returning to the Central Arctic by mid-June. Such a prolonged storm event would likely have a continuous weakening affect on the ice. Lower temperatures in the storm’s region would be more than countered by active wave energy and tapping of warmer, deeper waters which will have a tendency to erode the ice from beneath. Furthermore, warmer air is shown to follow in the wake of this storm, which may enhance melt through regions of already weakened ice.

In any case, this is a situation that bears close watching. A month-long, or more, storm harrying the Arctic could have quite an impact.

ECMWF weather model forecast for June 9th:

Cyclone june 9

(Image source: ECMWF)

Links:

CICE

DMI

Lance-Modis

The Arctic Ice Blog

PIOMAS November Update Shows Sea Ice Thinner Than Ever: Volume More Than 1000 Cubic Kilometers Below 2011

The November update of the Polar Science Center’s PIOMAS sea ice volume tracker shows Arctic sea ice volume remaining in record low territory for the month of October. By month’s end, sea ice volume was still about 1096 cubic kilometers below the previous record low set in 2011.

Volume recovery during the seasonal re-freeze was lower than in 2011. During that year, sea ice volume in fall and winter rebounded to levels near those of the previous year. This year, however, the gap between 2011 and 2012 is much greater.

A number of factors kept Arctic re-freeze lower than in previous years. Sea ice has been pushed so far back that it simply takes longer and longer to recover. Warm water ocean currents are traveling further north, transporting more warm water into the Arctic environment later and later in the year. Atmospheric circulation has also changed. Large blocking patterns dredge warm air up from the south and deposit it in the Arctic. These same blocking patterns dump cold air, which once tended to concentrate in the Arctic, into temperate regions. The result of all this ocean and atmospheric mixing is that the Arctic is much warmer than usual and sea ice recovery mostly lags.

In his Arctic Sea Ice Blog, sea ice blogger Neven has also pointed out that it is likely sea ice is also thinner now than ever before. His rough graph combines PIOMAS volume and NSIDC sea ice area data to provide an estimate for average thickness. This month’s graph shows average ice thickness of less than 1 meter over the entire Arctic lasting through November 5th.

Neven’s previous rough estimates had shown average sea ice thickness did not pass below the one meter threshold at any time since records have been established. This year, average sea ice thickness dropped below 1 meter on October 21rst and has remained at that record low level through to November 5th.

Increasing scientific evidence and consensus points toward massively reduced sea ice area and volume resulting in chaotic and damaging weather patterns. Meteorologists and researchers from climate and weather disciplines have attributed Superstorm Sandy’s size, intensity, and path, to influences that have been made worse and worse by human caused climate change. Furthermore, powerful blocking patterns that result from the deterioration of sea ice have been implicated in wide ranging weather extremes including the current historic drought, powerful heat waves in Europe, Russia, and the US, and extreme rain and storm events across the globe.

In addition, receding sea ice kicks off a number of powerful global warming feedbacks that are likely to amplify human-caused climate change, heating the Earth at a faster rate. Loss of insulating sea ice also puts Greenland and West Antarctica at increasingly severe risk of increased melt. The result, in these cases, is much more rapid sea level rise on top of increasingly powerful storms. We are experiencing only the first outliers of these impacts now. So rapid reduction in greenhouse gas emissions can help to prevent the worst of a large pack of climate troubles now forming.

Links:

http://psc.apl.washington.edu/wordpress/research/projects/arctic-sea-ice-volume-anomaly/

http://neven1.typepad.com/


Putting Tremendous Sea Ice Volume Losses into Context: A Truly Devastating Trend

Across the sea ice blogosphere today a great amount of discussion has been dedicated to the subject of sea ice volume. You can take a look at some of this discussion over at Neven’s Arctic Ice Blog.

The general gist is that, for the past few years, the Arctic sea ice community has been cautious about accepting data from PIOMAS. The researchers there model sea ice volume by plugging Arctic Ocean observations into a computer simulation. However, over that time, the trends established by the PIOMAS data have born out in larger Arctic melt trends.

This summer, a group of British scientists validated the PIOMAS findings by using satellite data from Cryosat2. Interestingly, these British scientists came to the same conclusion that many studies of PIOMAS data have pointed to — the Arctic Ocean could be ice-free at summer’s end within the next ten years.

Almost as soon as the British published their Cryosat2 data, the Arctic began to experience another record decline in sea ice area and extent. The visible losses in extent and area have been, for many, enough evidence to take seriously the notion of a nearly ice-free Arctic in a much shorter span than was previously predicted.

Given the increasing acceptance of sea ice volume data and of the conclusions that can be drawn by sea ice data trends, it is important to provide a brief summary of what the volume trends from PIOMAS have been. In short, what PIOMAS and Cryosat2 have revealed is a stunning loss of sea ice and a potential for the total loss of Arctic Ocean ice over a much shorter period than previously thought.

In 1979, the total volume of sea ice according to PIOMAS was about 16,000 cubic kilometers. Today, PIOMAS shows sea ice volume at 3,600 cubic kilometers. This is a total loss of 12,400 cubic kilometers or about 78% of all ice in the Arctic Ocean at the end of summer since 1979. As noted before, at the current rate of melt, volume measurements indicate the Arctic could be ice-free within ten years.

For a visual of the current trends, take a good look at this graph of PIOMAS data produced by Neven:

This is a curve fitting process. So any conclusions drawn from it should be taken in understanding of the limitations of curve fitting.
The last data points are from 2011. Plugging in the values for August of 2012 would show a new volume low of 3,600 cubic kilometers — about 1,100 cubic kilometers below the 2011 measure of around 4,700 cubic kilometers. Final numbers for September 2012 aren’t yet in.

Stepping back, however, you can see a pretty severe melt trend. End of summer sea ice volume reaches about zero by 2017 following the curve. Even more disturbing, the Arctic becomes almost entirely ice-free year-round by 2032 if the trend lines for current decline rates hold.

The only science team yet to validate the potential for an ice-free Arctic during summer within ten years has been those investigating the Cryosat2 results. No-one has yet to validate the potential for an ice-free Arctic year-round by the mid 2030s. Yet this is the potential current melt trends reveal.

It is astonishing to me that such information has received almost zero attention from mainstream news sources. A recent article in the Opinion section of the Washington Post noted the potential for ice-free summers in the Arctic within the next 30 to 40 years. If the volume trends hold out, this article will be a vast underestimation. Perhaps even more disheartening is the article’s conclusion which seems to celebrate the ice free Arctic Ocean while turning a blind eye to the huge masses of ice of Greenland and West Antarctica which are bound to be the next to melt. The writer seems to also be completely unaware of the massive volumes of greenhouse gasses stored in the permafrost and methane hydrates in the region. The same gasses which are bound to amplify human-caused global warming even further.

I’m reminded of the irrational exuberance of economists and investors prior to the financial collapse of 2008. Even the bad indicators were considered ‘good.’ Let’s hope the derivatives of sea ice melt don’t come crashing down with even more terrible consequences. Lacking sound world-wide climate policy, a flimsy shred of hope seems to be all we have.

Sea Ice Extent at 3.71 Million Square Kilometers; Sea Ice Area at 2.49 Million Square Kilometers

Over the weekend, sea ice declined to new record lows hitting 3.71 million square kilometers for extent and 2.49 million square kilometers for area. In addition, PIOMAS showed sea ice volume has also reached new lows.

Trends for sea ice extent decline has been especially pronounced this year with values now 524,000 square kilometers below the record set in 2007.  The rate of extent decline is still very steep for this time of year. Usually, melt rates tend to taper off by late August. But we haven’t seen a gradual slowing of melt yet.

September 15 is the average end date for sea ice melt. But with rates of decline still remaining high, melt may extent beyond the normal end date for summer melt. You can view this precipitous rate of decline in the JAXA graph below:

Looking at the sea ice from the satellite picture, we can see a large area of thick ice in the Laptev Sea surrounded by open ocean and thinning ice. It appears that, if melt continues in this region. This large chunk of ice may break off from the rest of the sheet. If this happens, it will be the second such detachment to occur this summer. Detached ice tends to melt quicker than ice connected to the larger mass. So this region may provide a final significant melt for 2012.

In a previous post here, it was estimated that sea ice area could end in a range of 2.1-2.7 million square kilometers and that extent could end in a range of 3.5-3.9 million square kilometers. Current melt is now in the middle range of both of these measures and still falling. So it would appear that end melt will likely be somewhere near the lower range of estimates. If this happens extent and area measures will have been broken by about 700,000 square kilometers by end of season.

Links:

http://www.ijis.iarc.uaf.edu/cgi-bin/seaice-monitor.cgi?lang=e

http://arctic.atmos.uiuc.edu/cryosphere/

http://nsidc.org/arcticseaicenews/

http://psc.apl.washington.edu/wordpress/research/projects/arctic-sea-ice-volume-anomaly/

Arctic Sea Ice Still Fading Fast, Extent Record to Fall Within Week if Melt Rates Continue

Image

This is what 32 years of human-caused climate change does to a polar ice cap. The first frame shows polar sea ice from August 20th of 1980, the second frame shows polar sea ice from August 20th of this year. The precipitous fall in size is horrific. Many in the climate community are calling it a ‘Death Spiral.’ And I think that’s a very apt name for what is happening to our ice cap.

Today, sea ice area records reached a new all-time low of 2,742,000 square kilometers. This is 163,000 square kilometers below the previous all-time low. At the current rate of melt, we are on track to fall somewhere between 2.1 million and 2.6 million square kilometers of sea ice area by the end of this season. Since this season has shown such a rapid rate of melt, all bets may well be off for the final number.

Image

Sea ice extent also continued its rapid plunge with the Japanese Space Agency (JAXA) showing a loss of 80,000 square kilometers from its extent totals just yesterday. The current total for sea ice extent, according to JAXA, is 4,405,000 square kilometers, this is about 230,000 square kilometers above the all-time low. Given the current rate of melt, JAXA will likely see a new record set within the next five days.

Image

NSIDC is also showing a rapid fall to a new record low for sea ice extent with values coming in very close corollary to those provided by JAXA. So given the current rate of decline, we will also expect to see new records within five days from NSIDC, should melt rates hold.

It is worth noting that the pace of sea ice decline for these observations is still very high. If the season follows typical trends, we should begin to see numbers slowing their rate of decline within the next couple of weeks. However, since weather conditions in the Arctic continue to favor melt and consolidation of the sea ice, it may be possible that we maintain steep melt rates longer than for a typical year.

A few final points for today’s update…

We typically follow only the major sea ice tracking organizations: Cryosphere Today, The National Snow and Ice Data Center, and The Japanese Space Agency. For sea ice volume, the only tracking organization is PIOMAS. However, there are, in total, nine agencies that use different metrics to track sea ice. According to Neven over at the Arctic Ice Blog, four of these metrics are now showing new all-time record lows for this melt season. Neven noted: “I expect the record on most of these graphs to be broken in weeks to come.”

Current rates of melt would appear to validate Neven’s projection and, if they hold, not most, but all records are likely to fall.

Last of all… Many of you may be wondering why mainstream media hasn’t picked up on the record melt currently underway for Arctic sea ice. Part of the reason may be that there are a diversity of monitoring sources. Generally, primary media sources have used the NSIDC measurement as their baseline. So, as Joe Romm notes in his most recent ‘Arctic Death Spiral‘ article, mainstream media will likely pick up the story of this year’s record melt once the NSIDC record is broken.

Links:

http://www.ijis.iarc.uaf.edu/en/home/seaice_extent.htm

http://nsidc.org/

http://arctic.atmos.uiuc.edu/cryosphere/

Polar Science Center Shows Sea Ice Volume Decline Continues

Image

While much attention has been given to yearly measurements of sea ice area and extent, the Polar Science Center has been keeping track of another key figure: volume. And while extent and area has tended to fluctuate along an overall downward trend, sea ice volume has been in decline year after year for many years running.

Area and extent are both measures of ice visible from above. Volume, on the other hand, adds in thickness. And what we’ve seen over the past decade is that the ice in the Arctic is growing very thin indeed.

This year is no exception. Data from the polar science center has shown that summer volume measures have continued to decline from the record lows set last year. And, unless the rate of decline begins to abate soon, sea ice volume may approach zero during summer before the end of this decade.

As you can see from the graph below, volume losses are even greater than what would have been expected from trends established before 2005 and current lows are well outside the range of statistical deviation.

Image

Anyone keeping track of sea ice as a measure of climate change impacts would be wise to keep an eye to volume measurements as well. And the Polar Science Center currently provides the best data available.

Please help support our continuing efforts.

Please help support our continuing efforts.

Links:

http://psc.apl.washington.edu/wordpress/research/projects/arctic-sea-ice-volume-anomaly/