
A Friday for future focus on record atmospheric and ocean temperatures.
All posts tagged Record Global Heat
Friday For Future Focus Record Global Heat, Severe Weather For 2022

Posted by robertscribbler on January 13, 2023
https://robertscribbler.wordpress.com/2023/01/13/friday-for-future-focus-record-global-heat-severe-weather-for-2022/
Record Global Heat — Huge Springtime Arctic Warm-up to Crush Sea Ice, Drive Extreme Jet Stream Dip into Europe
We know now, as soon as the middle of April, that 2016 will be the hottest year on record. That not only will it be the hottest year, but that it will crush any other previous record hot year by a wide margin.
NASA GISS head — Gavin Schmidt — in a recent tweet estimated that 2016 would fall into a range near 1.32 C above the 1880-1899 average that NASA uses for its preindustrial baseline. By comparison, 2015 — which was the most recent hottest year on record after 2014 (three in a row!) — hit 1.07 C above the 1880-1899 average.

(According to NASA, the first three months of 2016 were 1.25 C above the NASA 20th Century baseline and a ridiculous 1.47 C above the 1880 through 1899 preindustrial average. Image source: NASA GISS.)
As a result, 2016 will likely have jumped by about a quarter of a degree Celsius in a single year. If every year from 2016 on warmed up so fast the world would surpass the dreaded 2 C mark by 2019 and rocket to about +22 C above 19th Century averages by 2100. That’s not going to happen. Why? Because natural variability assisted greenhouse gas warming from fossil fuels to kick 2016 higher in the form of a serious heavyweight El Nino. But it’s a decent exercise to show how ridiculously fast the world is expected to warm from 2015 to 2016. And in the 2014-2016 string of three record warm years in a row we are basically expecting a 0.40 C jump above the then record warm year of 2010. Given that the world has warmed, on average by about 0.15 C to 0.20 C per decade since the late 1970s, what we’re expecting to see is about two decades worth of warming all cram-jammed into the past three years.
More Severe Arctic Heat is on the Way
But the Earth, as of this Earth Day, hasn’t warmed evenly. A far, far greater portion of that excess heat has stooped over the Arctic. During the first three months of 2016, the Arctic region above 66 degrees North Latitude has been fully 4.5 C hotter than the NASA 20th Century baseline. That’s a departure more than three times that of the rest of the Earth. And that’s bad news for anyone concerned about sea ice, or polar bears, or Arctic carbon feedbacks, or predictable seasons, or extreme droughts and floods, or the Jet Stream, or Greenland melt, or sea level rise, or … well, you get the picture.
One region, at the boundary between the Arctic Ocean and the Greenland Sea near Svalbard, has been particularly warm. So warm, in fact, that sea surfaces now devour slabs of Arctic Ocean ice blown into it by winds running out of the Arctic in a matter of days. It takes a lot of ocean warmth to have this kind of effect on sea ice. A particularly ferocious amount of heat for the ocean to exhibit so early on in the melt season.
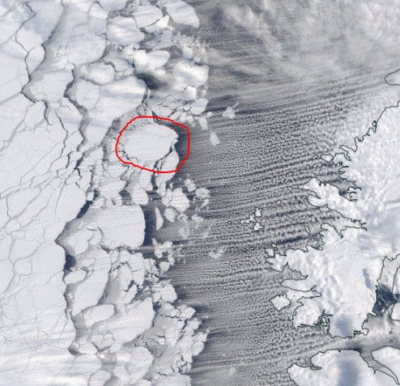
(Neven posted this excellent blog tracking a ferocious amount of heat in the region of the Greenland and Barents Sea. Arctic Sea Ice Forum commenter Andreas T provided this graphical representation of sea ice disintegration as it was blown into waters just to the north of Svalbard earlier this week.)
Perhaps the easiest way to illustrate how relatively hot the Arctic is now is the fact that sea ice in the region is melting fast. So fast that current extent measures by JAXA are at their lowest levels on record. It’s a precipitous rate of melt that’s about one week ahead of any of the previous fastest melt season. Or you could just look at the number of Arctic freezing degree days recorded at CIRES and find one more measure added to NASA or record low sea ice pointing toward the obvious fact that this year, for the Arctic, has been one of just absolutely ludicrous warmth.
As Winter progresses into Spring, temperatures typically moderate — closing in on baseline averages. And this year has been no exception. However, readings for the entire Arctic have tended to range between 1.5 and 2.5 C above average over the past two weeks. These are some seriously hot departures for Spring. Enough to keep Arctic heat in record ranges for 2016.
Three Powerful Warm Wind Events to Strike the Arctic in Concert
But over the coming five days, a series of south-to-north warm wind events is expected to push even these seasonally excessive readings higher.

(GFS model forecasts predict Arctic temperatures to rise into a range between 3 and 5 C above normal for this time of year over the coming week. Such departures are in record ranges and will likely result in rapid snow and sea ice melt even as it drives a wedge of cold air out of the Arctic and over Europe — setting up a high risk of very severe weather events. Image source: Climate Reanalyzer.)
The first event is predicted to originate over the Yamal Peninsula of Russia during Saturday and Sunday — lasting on into Monday and Tuesday. There, temperatures are expected to rise into the (scorching for the Arctic at this time of year) mid 30s (F) as strong, warm winds blow over about 1,000 miles of western Russia and on up into the Kara and Laptev seas which are predicted to, likewise, experience near or above freezing temperatures. Over the entire region, temperatures are expected to range between 18 and 36 degrees F (10-20 C) above typical daily averages for this time of year. Snow and sea ice melt melt rates in this already rapidly thawing region will almost certainly pick up pace in the face of these obnoxiously unseasonable readings.
A second warm wind event is predicted to heat up Greenland, Baffin Bay, the mouth of Hudson Bay and a chunk of the Canadian Archipelago on Monday and Tuesday. A 1,500 mile synoptic southeast to northwest air flow is expected to originate in the Central North Atlantic. Running along the back of a high pressure system rooted between Iceland and Southeastern Greenland, these winds will ram a broad front of above-freezing airs over a rapidly melting Baffin Bay, dramatically warm the southern 2/3 of Greenland, and flush a comparable warm air pulse into the outlets of Hudson Bay. Temperatures in this broad zone are also expected to hit 18-36 F (10-20 C) above average readings. And its effects will likely be strong enough to initiate another strong early season melt spike for Greenland in addition to aiding in driving a quickening pace of melt for Baffin and Hudson bays.

(Shattered sea ice over the Beaufort and Chukchi looks as if it’s been fractured from a blow from Thor’s mythical hammer Mjolnir. Open water and very thin ice openings stretch as wide as 60 miles in some sections. A warm wind event later this week is expected to provide still more melt pressure to this already greatly weakened sea ice. Image source: LANCE MODIS.)
A final warm wind event will be fed by a big warm up across Alaska predicted to settle in on Wednesday and Thursday. There, temperatures in Central Alaska are expected to rise into the lower 60s as two stalled out lows to the south pull warmer airs up from the Pacific Ocean. This heat is expected to invade the Chukchi and Beaufort seas driving temperatures to near or above freezing over Arctic Ocean surfaces that have already witnessed a great shattering of ice and an opening of dark, heat-venting open water holes. There the anomaly spike will be slightly milder — in the range of 15-32 F (8-18 C) above average. Such heat will provide melt stress to the fractured Beaufort, likely making more permanent the wide array of open water and thin ice spaces as the push toward Summer advances.
Mangled Jet Stream to Bring Storms to Europe
As all this heat bullies its way into the Arctic, a flood of cold air is expected to flee out of the region and on down a big dip in the Jet Stream — making a late-season invasion across the North Atlantic and into Europe. There, as we’ve seen previously during recent warm wind invasions of the Arctic during Fall, Winter and Spring, warm air from the south tends to cause cold to break out and then to dive down the trough lines. And there’s a huge trough predicted to dig in over Europe.
We should expect some rather severe weather to accompany this Springtime onrush of colder air — including potentially extreme thunderstorms, flooding, and even instances of late April snowfall over parts of Norway, Sweden, Scotland, the Alps, and sections of Germany.

(A very deep Arctic trough is expected to dig into Europe and the Mediterranean this coming week bringing with it the likelihood of some very severe weather. Image source: ECMWF/Severe Weather EU.)
Likely increased rates of sea ice melt, a severe blow to record low snow packs around the Arctic and a likely freakish cold air and severe weather invasion of Europe are all a result of this extreme Arctic heat playing havoc with typical weather and seasonality. By the middle of next week, temperature anomalies for the entire Arctic may rise to as high as 5 C above the already much warmer than normal 1981 to 2010 average. In such a case, we could hardly expect weather or climate conditions to be normal and there appears to be a big helping of weirdness and extreme effects coming down the pipe over the next seven days.
Links:
We Already Know 2016 Will be the Hottest Year on Record
Gavin Schmidt’s Estimate for End 2016 Temperatures Crushes Previous Hottest Years
Hat Tip to DT Lange
Hat Tip to Andreas T
Share this:

Posted by robertscribbler on April 22, 2016
https://robertscribbler.wordpress.com/2016/04/22/record-global-heat-huge-springtime-arctic-warm-up-to-crush-sea-ice-drive-extreme-jet-stream-dip-into-europe/
Too Close to Dangerous Climate Thresholds — Japan Meteorological Agency Shows First Three Months of 2016 Were About 1.5 C Above the IPCC Preindustrial Baseline
We should take a moment to appreciate how hot it’s actually been so far in 2016. To think about what it means to be in a world that’s already so damn hot. To think about how far behind the 8 ball we are on responses to human forced climate change. And to consider how urgent it is to swiftly stop burning coal, oil and gas. To stop adding more fuel to an already raging global fire.
******
Global policy makers, scientists, and many environmentalists have identified an annual average of 1.5 degrees Celsius above preindustrial marks as a level of heat we should try to avoid. The Paris Climate Summit made a verbal pledge to at least attempt to steer clear of such extreme high temperature ranges. But even the strongest emissions reduction commitments from the nations of the world now do not line up with that pledge. And it’s questionable that they ever could given the massive amount of greenhouse gas overburden that has already accumulated and is already rapidly heating the world’s airs, waters, ice, and carbon stores.
Current emission reduction pledges, though significant when taking into context the size and potential for growth of all of carbon-spewing industry, don’t even come close to the stated 1.5 C goal. Under our presently accepted understanding of climate sensitivity, and barring any response from the global carbon stores unforeseen by mainstream science, pledged reductions in fossil fuel use by the nations of the world under Paris would limit warming to around 3 C by the end of this Century. Rates of carbon emission reduction would necessarily have to significantly speed up beyond the pledged Paris NDC goals in order to hit below 3 C by 2100 — much less avoid 2 C.
As for 1.5 C above preindustrial averages — it already appears that this year, 2016, will see temperatures uncomfortably close to a level that mainstream scientists have identified as dangerous.

(Japan’s Meteorological Agency shows that March of 2016 remained at global temperature levels above 1.5 C higher than the preindustrial baseline.)
The most recent warning came as the Japan Meteorological Agency today posted its March temperature values. In the measure, we again see a major jump in readings with the new March measure hitting a record of 1.07 C above the 20th Century average or about 1.55 C above temperatures last seen during the early 1890s. These temperatures compare to approximate 1.52 C above 1890s temperatures recorded by the same agency during February and a 1.35 C positive departure above 1890s levels during January. Averaging all these rough anomaly figures together, we find that the first three months of 2016 were about 1.47 C above the 1890s, or near 1.52 C above the IPCC 1850 to 1900 preindustrial baseline.
So for three months now, we’ve entered a harsh new world. One brought about by an atrocious captivity to fossil fuel burning. One that many scientists said it was imperative to avoid.
Due to the way the global climate system cycles, it is unlikely that the rest of 2016 will see such high global temperature marks and that the annual average will bend back from a near to, or slightly higher than, 1.5 C peak during early 2016. A La Nina appears to be on the way. And as the major driver of the cooler side of natural variability, La Nina taking hold should draw some of the sting out of these new record atmospheric temperature readings.
That said, overall ocean heat still looks quite extreme. Pacific Decadal Oscillation values hit their second highest ever monthly values during March of 2016. And a strongly positive PDO can tend to bleed a great amount of heat into the world’s airs even absent the influence of El Nino. In addition, Arctic warming this year has hit new record levels. Arctic sea ice is now at or near seasonal record low levels in most measures. Albedo is very low with many dark ice and open water regions forming throughout the Arctic Ocean. Snow cover levels are also low to record low — depending on the measure. Very early Greenland melt is already hampering the reflectivity of that great ice mass.
As summer advances, these factors may tend to continue to generate excess heat in Arctic or near Arctic regions as new dark surfaces absorb far more solar radiation than during a typical year. New evidence of increasing Arctic permafrost carbon store response may add to this potential additional heat contribution.
There is danger then, that an La Nina driven and natural variability related cooling later in the year may tend to lag — pulled back by a positive PDO and amplifying feedbacks in the Arctic. Atmospheric carbon dioxide levels peaking between 407 and 409 parts per million during the months of March and April — the primary and increasingly dangerous driver of all this excess heat we are now experiencing — risk bending the upper end of that temperature threshold still higher and in ways that we probably haven’t yet completely pinned down. But the fact that March appears to have lingered near February’s record high anomaly values is cause for a bit of heightened concern. In other words, 2016 is setting up to be hot in ways that are surprising, freakish, and troubling.
Links:
Met Office — Measure From Which IPCC Preindustrial Baseline is Derived
NSIDC’s Interactive Sea Ice Extent Graph
The Greenland Summer Melt Season Just Started in April
Share this:

Posted by robertscribbler on April 14, 2016
https://robertscribbler.wordpress.com/2016/04/14/too-close-to-dangerous-climate-thresholds-japan-meteorological-agency-shows-first-three-months-of-2015-were-about-1-5-c-above-the-ipcc-preindustrial-baseline/
Polar Amplification, El Nino or Both? NASA Shows October of 2015 Was Hotter Than All of the Previous 1617 Months
If it seems we are doing a never-ending marathon of hottest posts, it’s simply because the world right now is ridiculously hot. Hotter than at any time ever seen before and being driven inexorably hotter by a combination of human greenhouse gas emissions and what appears to be a global warming weirdified El Nino that doesn’t look anything like a normal El Nino, but instead shows up as an intense blob of extreme heat sitting in a massive hot blob that makes up pretty much all of the Pacific Ocean from the Equator on north.
Busting the Top of the Global Temperature Graph
It’s in this rather crazy weather context that we find, according to NASA, October of 2015 set the bar for new hottest month in the global climate record for all of the past 135 years. That’s right, out of 1618 months in NASA’s global climate record, when comparing current readings to rolling baseline temperature averages, October of 2015 was the hottest one ever seen. A confirmation of the Japan Meteorological Agency’s findings from earlier this week. But one that, in true NASA fashion, also provides a boatload of additional data worth peeping at.

(With one month remaining in the December-through-November climate year, global temperature averages for the first 11 months of 2015 are now +0.819 C above the 1950-1981 NASA baseline. With November also likely to come in between +0.90 and +1.1 C hotter than normal, the 2015 yearly average is likely to come in well above the top of the chart. Image source: NASA GISS.)
Taking a glimpse at NASA’s Land-Ocean Temperature Index (LOTI), we find that October of 2015 came in at an extraordinary +1.04 C hotter than the 1950 to 1981 average or about 1.26 C hotter than 1880s averages. That’s an extreme temperature departure hitting within 0.74 C of the so-called safe limit of 2 C warming set by the UN. To put into perspective how weird and scary it is to hit such a high temperature departure, the last time temperatures were so high globally for any period of note, sea levels were between 10 and 30 feet higher than they are today. It’s another unfortunate passing of another bad climate marker on the way toward worse and worse to come if we can’t manage to stop emitting so much carbon into the atmosphere.
Overall, October of 2015 beat out the previous record hot month of January of 2007 (0.97 C above the NASA baseline) by 0.07 C. It is also the first month in the NASA monitor to exceed 1 C above the mid-to-late 20th Century range. In total, all of the top five hottest months in the global climate record have now occurred since 2007 with October 2015 (+1.04 C) coming in as hottest, January of 2007 (+0.97 C) coming in as second hottest, March of 2010 (+0.93 C) third hottest, March of 2015 (+0.90 C) fourth hottest, and September of 2014 (+0.89 C) as fifth hottest. But with the monster El Niño blowing up in the Pacific and with atmospheric greenhouse gasses pushing above 400 ppm CO2, it’s likely that many of these top five months could be replaced by new records into early next year. Moreover, the three month period of September, October, and November of 2015 now looks like it will be the first quarter year to exceed +0.9 C above the 1950-1981 baseline in the NASA record.
Warm Equator, Heating Poles
Moving on to NASA’s geospatial temperature anomalies map for the month of October, we see that much of the abnormal heat remains centered at the Poles. This despite a Godzilla El Nino belching hot air into the Equatorial region and pushing a strongly positive Arctic Oscillation. High polar temperature anomalies are an odd result during powerful El Nino periods due to the fact that warming at the Equator tends to strengthen the Polar wind field, locking cold into the upper and lower Latitudes. But over the past two months, Polar temperatures have remained extremely high despite what looks like the most powerful El Nino ever recorded tearing its way through the Pacific.
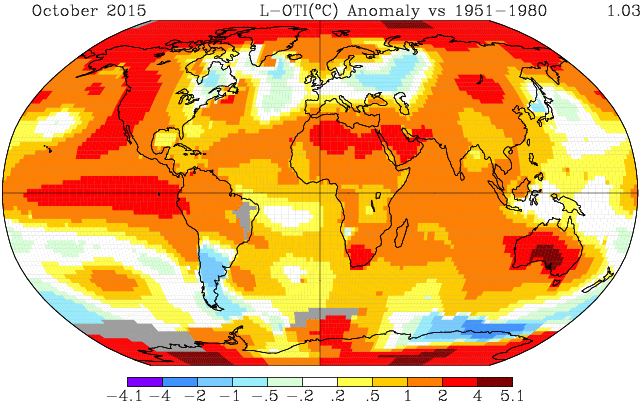
(This is what a record hot world looks like in NASA’s global temperature anomalies map. Note both the heat at the Poles and Equator along with the melt and ocean heat uptake related cool pools in the North Atlantic and Southern Ocean. Image source: NASA GISS.)
With such high polar temperatures giving what amounts to an atmospheric back-hand to the strongest El Nino on record, it’s a sign that a raging greenhouse gas driven polar amplification is becoming ever more heavily entrenched. The poles, in short, are more sensitive to global temperature swings and tend to amplify any overall warming or cooling trend. Such an additional sensitivity is due to a number of unique feedbacks that come into play in the upper Latitudes as greenhouse gas levels and global temperatures rise or fall. A circumstance that was predicted in even the earliest global climate model runs forecasting the impacts of a human forced heating of the Earth System. And it appears that this feedback-generated added warming is starting to take hold with a vengeance.
Overall, we find the highest temperature deltas in the Arctic Ocean just north of the Kara Sea, over various regions of the far South Antarctic, and over Central and Western Australia. These regions ranged into an extreme +4 to +5.1 C positive anomaly for the month. Broader warm regions featuring +2 to +4 C above average temperatures surrounded these hot zones. Strong warm temperature departures in this range also held sway over the Eastern Equatorial Pacific El Nino hot spot, over a band from North Africa through the Middle East, over the Lake Baikal region of Russia, and over South Africa.
Equator-to-Pole heat transport — another feature we really don’t like seeing — also remained plainly visible in the October NASA anomalies graphic. Two slots of warm air transport into the northern polar zone show up clear as day in the above graphic — one maintaining over Western North America and another holding sway over Northeastern Asia.
Somewhat cool regions include the heat sink zone in the Southern Ocean, the tip of South America, Eastern Europe, and the ominous Greenland melt related cool pool in the North Atlantic (something we also really don’t want to see). Overall, most of the world showed above average readings with cooler regions increasingly isolated on the NASA map.

(Zonal anomalies map shows a strong polar amplification despite El Nino. Image source: NASA GISS)
At last coming to the zonal anomalies graphic, we again observe a very strong polar amplification for the month of October. Here we note that the highest global temperature anomalies occur at both the South and North Poles. These extreme temperature spikes in the range of +3.3 to +3.5 C above average for the month are plainly visible in the upward tilting ‘devils horns’ (another unfortunate climate change indicator) at both the left and right border of the graph. As we move toward lower Latitudes, temperature departures rapidly fall off into the global cool and stormy zones between 50 and 60 North and South Latitudes. Anomalies then steadily climb to an El Nino-warmed Equatorial region (+1.2 to +1.4 C).
November of 2015 Also Likely to Test New Records
Looking toward November, early indications are that both the record or near-record global surface temperatures and the tendency for polar amplification continue. Land and ocean temperatures appear to have extended their October jump into new record ranges. El Nino, which under the regime of human-forced warming has often nudged global temperatures toward ever-hotter extremes, likely pushed sea surface temperatures to new all-time highs in the Equatorial Pacific for the month. Such a huge amount of heat bleeding off this broad ocean zone will likely to continue to spike global surface temperatures. Given such a context, it appears that we’ll be under the gun for new global surface temperature records for a period of at least the next 4 months. So what we saw during October was almost certainly just the start of the current global temperature spike.
Links:
NASA GISS Surface Temperature Analysis
NASA Land Ocean Temperature Index
October of 2015 Shaping up to be Hottest Month Ever Recorded
Share this:

Posted by robertscribbler on November 18, 2015
https://robertscribbler.wordpress.com/2015/11/18/polar-amplification-el-nino-or-both-nasa-shows-october-of-2015-was-hotter-than-all-the-1617-previous-months/
Please Help Support Our Ongoing Efforts

Climate of Pandemic — A COVID-19 Special Report

GROWTH SHOCK

Luthiel’s Song: Dreams of the Ringed Vale

Luthiel’s Song: The War of Mists

Climate Progress

The Secular Jurist

Exposing Misinformation Spread by Anthony Watts

Colorado Bob’s Climate Feed

Arctic Sea Ice Blog

Science Blogs

Climate State

