Accelerating Global Warming? NASA Shows February of 2015 was Second Hottest on Record

The Earth started out 2015 very hot. A record hot range that some researchers are now saying may be the beginning of a period of accelerated global warming.

***

For the global temperature measure, February of 2015 was another extraordinarily warm month. One more hot month in an unbroken chain stretching all the way back to the mid 1980s. The second hottest February in the whole of the NASA record ever since temperature monitoring began in 1880.

In total, NASA GISS shows February of 2015 topping out as the warmest February of the new millennium at 0.79 degrees Celsius above the 20th Century average. A reading 1.06 C above temperatures measured during 1880. Only February of 1998 was hotter (Of all of the super El Nino year of 1998, only February and June still hold records as hottest months in the NASA measure).

But perhaps most importantly, the average of 2015’s first two months is 0.77 C above the 20th Century. This is just behind 2007 (by just 0.02 C) as the hottest two-month start of any year during the past 135, and likely hotter than at any time during the Holocene and possibly in the past 120,000 years altogether.

Temperature Map February NASA

(Global temperature anomaly map. Image source: NASA.)

Global temperature anomaly analysis by NASA shows extraordinary warmth for much of the Northern Hemisphere. In particular, most of the land mass of Asia experienced far above average readings. Temperatures in this zone measured as high as 8.4 degrees Celsius above average for the entire month — yet one more extraordinary period of departure for a rapidly warming region.

The North American West Coast through to Alaska also showed much warmer than normal readings. A pattern coincident with both a vast pool of warm water in the Northeastern Pacific and a ridiculously resilient ridge of high pressure (and coincident high amplitude wave in the Jet Stream) that has formed for seasonal periods over the region since the winter of 2012-2013.

Abnormal warmth was also pervasive through the tropics, the Arctic, Africa, Australia, sections of East and West Antarctica, and over most Oceanic zones. The only region experiencing colder than normal readings was the Eastern Half of North America. An area in the downward sloping trough of the prevalent Rossby Wave and associated hot-cold dipole pattern that has been so common for North America during recent winters.

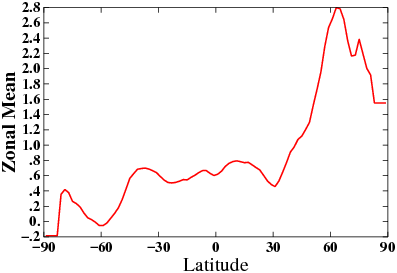
Zonal Anomalies Feb 2015

(Temperature anomaly by Latitudinal Zone for February of 2015. Image source: NASA.)

NASA’s zonal anomalies measure shows very strong polar heat amplification, which is a tell-tale of the human greenhouse gas heat forcing, at the Arctic Circle line (66 North Latitude) and continuing on northward. Zonal anomalies peaked at around the 66 degrees North Latitude line in the range of 2.8 C above average for the entire month. Anomalies declined poleward but still maintained 1.5 to 2.5 C above average ratings.

Though somewhat cooler than the Northern Polar Region, the rest of the global also showed above average temperatures in almost all zones. 30-60 North showed readings ranging from 0.5 to 2.5 C above average, the tropics maintained about a +0.6 C above average range, 30-60 South ranged between 0 and 0.6 C above average with a dip in the heat sink and high wind region of the Southern Ocean. The Southern Polar Region showed the only zonal below average reading with -0.2 C between 85 and 90 South, but the entire region of 60-90 South ranged about 0.15 C hotter than average.

Conditions in Context

The main features of the current globally hot February are a weak El Nino in the Central Pacific (declared by NOAA in early March), a strong positive PDO pattern of very warm sea surface temperatures throughout the Pacific and an extreme polar amplification in the region of 60-90 North Latitude.

According to IPCC forecasts and Pacific Ocean warming impact studies, both the El Nino, which has tended to shift more toward the Central Pacific, and the amazing polar amplification are indications of what was expected in a world seeing a rapid accumulation of greenhouse gasses through the mechanism of human fossil fuel emission. The North American Rossby Wave pattern combined with extremely warm temperatures in the West and cold, stormy and snowy conditions in the East, was also predicted as a potential upshot of warmer than normal readings at the pole reducing temperature differentials from North to South and encouraging weakness and waviness in the Jet Stream (Francis). PDO intensification, contributing to a warm water pool off the North American West Coast and coincident mid Pacific El Nino may also have a teleconnection-type (Where large weather patterns reinforce and enhance the formation of other large weather patterns that may be hundreds or thousands of miles removed from the first. Some have poetically referred to teleconnection as an atmospheric dance.) influence with the ridging pattern in the west and the related troughing pattern in the east.

In global climate models, cool pools of water near Greenland and West Antarctica are also implicated in potential trough/Rossby Wave type patterns (severe frontal storms) which may also be influencing the extreme weather seen in the Northeastern US during February. These pools are associated with glacial melt and coincident fresh water outflow. In the North Atlantic, this has implications for global thermohaline circulation. A strong thermohaline circulation is essential for ocean mixing and related ocean health.

Overall, the global temperature disposition, extreme temperature anomaly, and related strange weather patterns are anything but a normal. They are instead indicative of the kinds of extraordinary climates and extreme weather both computer models and researchers have predicted as a direct result of human-caused warming.

Entering a Rapidly Warming World

entering a rapidly warming world

(Even with a rapid draw down in human emissions to RCP 4.5 levels, computer model essays show 40 year average rates of warming will likely accelerate over the next few decades. Image source: Near-Term Acceleration in the Rate of Temperature Change.)

To this point, it appears that some climate models are in agreement that the period of the next few decades are likely to see an accelerated warming trend. Decadal rates of warming, during this time, are expected to accelerate to between 0.2 and 0.25 C per ten years, even if human greenhouse gas emissions are rapidly drawn down. The result would be about 1.4 to 1.6 C worth of warming above 1880s levels by or before 2040. Without a rapid draw-down, and a continuation on the current catastrophic path of fossil fuel burning, recent model essays from Dr. Michael Mann indicate that humans could exceed the 2 C warming threshold by the mid 2030s.

Links:

Near-Term Acceleration in the Rate of Temperature Change

GISS Surface Temperature Analysis

Paleoclimate Implications For Human-Made Climate Change

Warming Arctic May be Causing Heatwaves Elsewhere in the World

The California Weather Blog

Increasing Intensity of El Nino in the Central Equatorial Pacific

Evidence Linking Arctic Amplification to Extreme Weather in the Mid-Latitudes

Greenland Melt — Exponential?

Far Worse than Being Beaten With a Hockey Stick

Earth Entering a New Period of Rapid Temperature Change

Hat tip to Bassman

Song of Flood and Fire Refrain: Epic Canadian Floods Wreck 5.5 Million Acres of Cropland

For the Northwest Territory of Canada, the story this summer has been one of record-setting wildfires. Fires casting away smoke plumes the size of thunderstorms, fires that burn regions of tundra the size of small states. Fires that just burn and burn and burn for weeks on end.

But to the south and east in Saskatchewan and Manitoba, the story is drastically different. For over the past month, unprecedented flooding in this region has wrecked untold damage to Canada’s farmlands.

Canada floods

(Powerful storms over Manitoba and Saskatchewan on July 23rd, 2014. Image source: LANCE-MODIS)

This situation is the result of an odd and wreckage-inducing tangle in the Jet Stream. For hot air has been funneling up over the Northwest Territory for the better part of two months now, pushing temperatures in this Arctic region into an unprecedented range topping the 70s, 80s, and even 90s on some days. This high amplitude ridge in the Jet Stream has been reinforced and locked in place, a result some scientists attribute to the loss of Arctic sea ice during recent years, setting up a hot weather pattern favorable to wildfires.

As the massive Arctic wildfires ignited and burned, they cast off giant streams of smoke, burdening the down-wind atmosphere with aerosol particles — an abundance of condensation nuclei for cloud formation. These smoke streams fell into a trough flowing down over Manitoba and Saskatchewan. The deep trough, often extending far into the Central US formed a kind of trap for storms and, like the fixed ridge over the Northwest Territory, it has remained in place for months on end.

Given this mangled positioning of atmospheric heat and moisture flows, it was only a matter of time before massive rainstorms erupted in the wake of the large-scale Canadian fires. And the result was an unprecedented flooding. The offspring of an unprecedentedly powerful and persistent atmospheric pattern set off by human warming.

Major Floods Wreck Canadian Crops

For some local farmers, the past couple of days have seen 48 hour rain totals in excess of 10 inches. A 100 year rain event at a scale few farmers in the region have ever seen. And the recent floods are just the latest in a series of heavy rainfalls that have been ongoing ever since early July. Flood follows flood follows flood. A progression that has left most farms swimming in inches to feet of water and mud.

In total, farmland encompassing 3 million acres in Saskatchewan and 2.5 million acres in Manitoba are now under water and are unlikely to produce any crops this year. As a result, wheat plantings are expected to decline by 9.8 percent from last year, canola is expected to decline by 5.8 percent from the June forecast, and oat is expected to decline by 6 percent, according to estimates from Bloomberg.

July flooding in these regions has so far resulted in over 1 billion dollars in damages to farmers. As much as half of these losses may not be covered as insurers are still reeling from severe moisture damages during 2011, just two years ago. As a result of the ongoing parade of storm casualties, insurers have also raised deductibles, leaving farmers more vulnerable to the odd and powerful new weather coming down the pipe.

The Part Played By Climate Change and a Mangled Jet Stream

We often hear of the expanding droughts of human-caused climate change wrecking croplands. But the upshot of expanding drought in one region is record downpours in another. And downpours, if they are intense enough, can have a negative impact on crops as well.

The cause of this is as simple as warming’s enhanced ability to evaporate water. For it is estimated by climate scientists that each degree C in temperature increase amplifies the global hydrological cycle by 7-8 percent. That means that current warming of about 0.8 C since the 1880s has resulted in about a 6% increase in both evaporation and precipitation. At the level of weather, this translates into more intense droughts under dry, hot weather, and more intense rainfall events under wetter, cooler weather.

High Amplitude Rossy Wave Over North America July 2014

(High amplitude Jet Stream wave pattern fueling wildfires in the Northwest Territory and record floods in Manitoba and Saskatchewan. Note the extreme northward projection of the Jet over the Northwest Territory and the strong, deep, trough back-flowing from Hudson Bay into Manitoba, Saskatchewan and the northern tier of the Central US. Image source: University of Maine.)

One mechanism that has tended to amplify drought and rain events during recent years has been a weakening and intensifying waviness of the Northern Hemisphere Jet Stream. This weakening has been attributed by some scientists to a large-scale recession of Arctic snow cover and sea ice. For since 2007, not one day has seen an average sea ice extent and the range has typically fallen into a zone between 20-50 percent below levels seen during the 1970s and 1980s. New major record low years in 2007 and 2012 have also fueled speculation that sea ice may completely melt away during one summer between now and 2030, 2025, or even 2020 — 50-100 years ahead of model predictions.

As the sea ice serves as a haven for cold air masses, its loss is bound to impact the resiliency of these systems and since a solid pool of cold air to the north is a major driver of Northern Hemisphere upper air currents, the weakening of this cold pool has had dramatic impacts on climates.

Dipole hot-cold pattern associated with mangled jet stream

(Extreme dipole hot/cold pattern associated with Jet Stream mangled by climate change. Image is for July 14, a match to the above Jet Stream shot. Note the extreme heat in the ridge and the much cooler air in the trough. This is exactly the kind of pattern we would associate with sea ice retreat and Jet Stream weakening. Image source: University of Maine)

For this year, the ridge over Canada’s Northwest territory was a direct upshot in a northward retreat of the Jet Stream over Canada and, at times, into the Arctic Ocean. This set the stage for severe wildfires in the zone of warmth underneath this ridge pattern. To the east, a powerful downsloping trough pulled cooler air into Saskatchewan and Manitoba as well as over the Central and Eastern US. This set the pattern up for cooler than average conditions as well as for strong rainstorms.

The crop-shattering events of July were a direct result of this climate change induced ‘Song of Flood and Fire.’ A pattern we’ve seen repeat again and again over the past few years and one that may well intensify as both time and human-caused warming advance.

Links:

Canada’s Record Rains Cut Wheat Averages to Three Year Low

Is Global Warming Causing Extreme Weather via Jet Stream Waves?

Top Climate Scientists Explain How Global Warming Amps Up the Hydrological Cycle, Wrecks the Jet Stream to Cause Dangerous Weather

LANCE-MODIS

University of Maine

A Song of Flood and Fire

Hat-tip to Colorado Bob


Polar Vortex Ripped in Half by Anomalous Jet Stream, High Arctic Experiencing 32 Degree F Above Average Temperatures Over Broad Region

A dangerous and weather-wrecking polar heat amplification in the Arctic set off by human-caused global warming keeps kicking into higher and higher gear…

What models predicted earlier this week and what we reported on Thursday has finally happened. A major influx of record-breaking winter warmth has flooded into the high Arctic, disrupting the polar vortex to the point that it is currently ripped in twain.

Average temperatures over a broad area of the north polar region are now in excess of 20 degrees Celsius (32 degrees Fahrenheit) above daily norms for this time of year. Areas from Alaska to Norway to Greenland to the North Pole are experiencing record or near record highs. Meanwhile, the circumpolar Jet Stream has been malformed into an extraordinarily exaggerated north-south Rossby Wave pattern. An extreme amplification of a blocking pattern that has been in place for more than 10 months, pumping a continual flow of heat into the Arctic, and which, this winter, has resulted in numerous North American cold snaps comparable to those that used to happen in the 1980s and 1990s.

Polar temperature anomaly Jan 26

(Global temperature anomaly vs the 1985 to 1996 mean. Note the large regions of the High Arctic experiencing temperatures that are 20 degrees C above average or higher. Image source: NOAA)

The result is a kind of north-south flip-flop in temperatures following a polar vortex that has been ripped in half by a surge of anomalous warmth and a periodic pulsing of the Arctic’s remnant cold southward over the continents.

Yesterday, the high temperature in Svalbard, for example, less than 600 miles from the North Pole peaked at 32 degrees Fahrenheit, near all-time record warmth for this frigid region. In contrast, the high for Bethesda Maryland, thousands of miles to the south, was nine degrees lower at 23 Fahrenheit.

Hottest or near hottest ever temperatures in the Arctic are, in this case, comparable to moderately colder than average weather over Siberia and the Eastern US (As seen in the NOAA temperature anomaly map above. It is also worth noting that the 1985-1996 base-line temperature for the above map is already about .5 C above the 1880 average. So this map doesn’t take into account the full extent and impact of human-caused warming.).

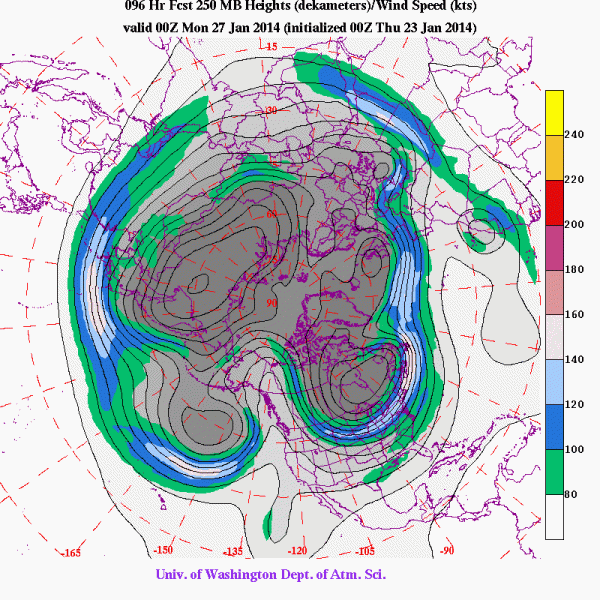
The Jet Stream anomaly that linked a very large and powerful flood of warm air from the Pacific with another less powerful warm air invasion riding up over Western Europe setting off such major polar temperature extremes is now plainly visible in the University of Washington upper air flow graphic below:

Polar Vortex Ripped in Half Jan 26

(Polar vortex ripped in half. Image source: University of Washington.)

On the Pacific side, we see a powerful ridge in the Jet Stream invading deep into the Chukchi and Beaufort Seas before again turning south. Some of the warmer air carried up by this extreme northward thrust of the Jet, however, bleeds further north, spilling up and over the North Pole. There it links with the second warm air thrust coming up from Europe. To the south, the polar vortex is now misaligned and severed. The two resulting, lesser, cold vortexes are now centered hundreds of miles to the south of their typical zones — with one over Hudson Bay and the other over the Yedoma region of Siberia.

Over the next week, model forecasts predict this severing of the polar vortex to continue with the current, anomalous, pattern remaining in play at least until February 2nd.

What we are observing is the start of the tumultuous and stormy throws of an imperiled winter in the Northern Hemisphere. A crisis that is bound to continue and worsen for at least some time. One that, if we don’t stop our greenhouse gas emissions soon, will certainly progress to a period in our not too distant future when winter no longer exists, perhaps a century or two from now. But make no mistake, these episodes of extreme polar warmth during wintertime that flush the cold air out and southward are no less than the palpitating heart of winter thrumming with the terrible arrhythmia of its eventual demise.

Links:

NOAA

University of Washington

Svalbard Weather Forecast, Weather Underground

Arctic Ice Graphs

Arctic Heat Wave to Rip Polar Vortex in Half

Arctic ‘Heat Wave’ to Rip Polar Vortex in Half, Shatter Alaska’s All-Time Record High for January?

62 Degrees Fahrenheit. That’s the all time record high for anywhere in the state of Alaska for the month of January. 57 Degrees Fahrenheit. That’s the temperature measured earlier this week in southern Alaska.

And forecasts call for warmer weather from Friday through Monday…

Across Alaska, temperatures are as much a 30 degrees above average for this time of year. This record winter warmth has pushed Alaska’s average temperature, according to reports from Anchorage, to 24 degrees Fahrenheit. By comparison, the lower 48, hundreds of miles to the south, is experiencing average temperatures of 22 degrees Fahrenheit. Though 24 degrees is not typically seen as a heat wave, readings in the upper 50s and lower 60s for Alaska in January may as well be. If these same temperature extremes were occurring during summer, some parts of Alaska would be experiencing a 90+ degree scorcher.

Mangled Jet Stream, Anomalous 10 Month Blocking Pattern to Blame

What we are witnessing is what amounts to a ten month long warm air invasion of the Arctic, with Alaska at ground zero. Human-caused global warming has resulted in an amplification of polar temperatures well above the typical average. Now the region is experiencing readings that range of 15-30 degrees warmer than normal.

This massive temperature increase (also associated with a reduction of land and sea ice) is causing a weakening in the polar Jet Stream which is allowing more warm air to invade the Arctic from the south. Early last spring, a weakness in the Jet resulted in a powerful and extraordinarily persistent blocking pattern forming over Alaska. Warm air flooded continuously up and over Alaska, occasionally penetrating deep into the Arctic Ocean region. Heat wave after heat wave impacted Alaska, which set numerous all-time record high temperatures during the summer of 2013.

This anomalous heat flooded in and spilled out around the Arctic Circle, disgorging so much hot air that the term ‘Arctic Heat Wave’ became common parlance. Now, this historic and extraordinary pattern has continued for 1o months running. A kind of persistence that may well give new meaning to the term blocking pattern.

south to north weather pattern Alaska

(Image source: NASA)

The wave pattern stretches so high into the upper latitudes that what we are seeing is weather systems more often rise up from the south and travel northward over Alaska and into the Arctic, than proceed in their typical east-west progression.
The west-east weather train is broken. And a strange south-north train from equator to Arctic is instead set in place.

In the above image sequence, provided by NASA, the heat and associated moisture flow all the way from the equatorial region near Hawaii, up over thousands of miles of Pacific Ocean waters before flooding on through Alaska and into the high Arctic. The extraordinarily powerful and persistent blocking pattern has linked the deep tropics to the high Arctic in unprecedented and anomalous fashion. Especially when one considers that the current pattern has lasted for almost an entire year.

This it the kind of extreme weather pattern that Dr. Jennifer Francis warned about. The kind of pattern Dr. Jeff Masters continues to point out in his cutting edge blog — Weather Underground. In my view, we ignore Dr. Francis and Dr. Masters at our risk. Their observations hold true to what is happening now and they are very useful tools for predicting the weather of a world in which human global warming has now become the primary driver of the world’s climate. Without the actual and ongoing context that is human warming, the few meteorologists still associated with climate change deniers scramble to find the increasingly rare analogs in past climate that match today’s extreme weather. But there is no analog to warmest ever temperatures in Alaska and polar temperatures that are now hotter than they were at any time over at least the past 44,000 years. And there is certainly no analog to CO2 levels higher than they’ve been at any time during the past 4.5 million years.

For this is the disrupted Jet Stream pattern not only directly responsible for the anomalous Arctic heat Alaska is now experiencing. It is also the cause of colder air being driven out of the Arctic and southward over the US, causing multiple cold snaps and extreme winter weather events in the lower 48. For the warm air influx, both at the surface and at the upper levels of the atmosphere, result in multiple polar vortex collapse events.

Polar Vortex to be Ripped in Half

And we are in the midst of just such a polar vortex collapse now. Over the past week, warmer air has flooded the high Arctic, weakening the polar vortex as the center of cold air began to split and streamed down over the continents. By Monday, these warm wedges of air, driving up over both Svalbard in the east and Alaska in the west, will have completely separated the polar vortex into two disassociated cold centers.

In essence, the polar vortex will have been ripped in half by a pincer style warm air invasion from the south. Who knew that atmospheric warming would come to mimic the battlefield tactics of Germans rumbling over the fields of France during World War II? But here we are:

Polar Vortex Ripped in Half

(Image source: University of Washington)

In the above image, we can plainly see the much warmer than normal air wedge driving up from the south and over Alaska in association with the now, ten month old, blocking pattern and related Rossby wave feature over the Pacific and North America. A second, albeit weaker, wedge drives in over Europe and across Svalbard. The net result is a ‘pincer’ of warm air invading the Arctic and cutting the polar vortex in half.

Note that one cold air vortex is predicted to be centered over Eastern Canada near Hudson Bay (Monday). The other is shown to be driven south to Russian Kamchatka near the Sea of Okhotsk. Perhaps coincidentally, this cold air core is very close to the Amur region of Russia and China that experienced a 150 year flood event just this summer. A flood event also associated with anomalous Jet Stream patterns linking polar, temperate, ocean and monsoonal storm patterns (see Song of Flood and Fire and Requiem for Flooded Cities).

Under this pattern the Arctic and especially Alaska will continue to experience record or near-record warmth, while the lower 48 continues to suffer the repeated blows of extreme winter weather as the conditions that are supposed to be affecting the Polar region are instead mercilessly driven southward by a human caused warming and polar vortex collapse event.

Links:

Jet Stream Flip Flop: Alaska is Warmer than Lower 48 Again

Sea Ice Loss Locks Jet Stream into Severe Winter Storm Pattern for Much of US

The Arctic Heatwave: Greenland, Siberia, Alaska Heat Domes and a Mangled Jet Stream

From Archangel to Alaska, Heat Waves Now Flank the Central Arctic

NASA

Dr. Jennifer Francis, Top Climatologists, Explain how Global Warming Wrecks the Jet Stream and Amps up the Hydrological Cycle to Produce Extreme Weather

Weather Underground

Arctic Temperatures Now Hottest Seen in at Least 44,000 Years

Cold Snap for the US? It’s the Collapsing Polar Vortex, Stupid.

University of Washington

A Song of Flood and Fire

A Requiem for Flooded Cities

Hat tip to Colorado Bob

Unprecedented Jet Stream Wave Sparks 120+ Degree Temps in the US Southwest and Tundra Fires in Extreme Northern Canada.

Canadian Tundra Fires June 29

(Tundra Fires Near Hudson Bay in Northern Canada on June 29, 2013. Image source: Lance-Modis)

Today, as temperatures rocketed to above 120 in the US Desert Southwest, temperatures hit 87 degrees on the shore of the frozen waters of the Canadian Archipelago. These were the south to north markers of a heatwave that spanned 3,000 miles from Death Valley, California to Cambridge Bay in extreme northern Canada.

Beneath the southern section of this vast and sprawling heat dome, US communities coped by setting up cooling centers and issuing heat warnings. But despite this agile preparedness, hospitals in the hardest hit areas were flooded with cases of heat injury.

In one instance, an outdoor concert in Las Vegas saw more than 200 persons treated for heat injuries while more than 36 were hospitalized. Sadly, an elderly man also passed away at one local hospital after suffering from heat stroke. Temperatures reached an extraordinarily hot 115 (Fahrenheit) in Sin City.

Elsewhere, across the region, Palm Springs hit 122, Death Valley hit 125, and Phoenix hit a scorching 119. Tomorrow is expected to bring another day of extreme record heat, so area cities and residents are still under the gun.

Further north, near 90 degree temperatures stretched all the way to the frozen shores of Cambridge Bay in extreme northern Canada. There, some locations on the ice choked waterway experienced 87 degree temperatures, which is nearly 40 degrees (Fahrenheit) above average for this time of year.

The extreme heat sparked numerous tundra fires across Northern Canada, some of which you can see in the NASA satellite image above. Note the smoke tails rising from two clusters of fires in the upper center portion of the image. That ice speckled area of blue to the right is the, usually frigid, Hudson Bay.

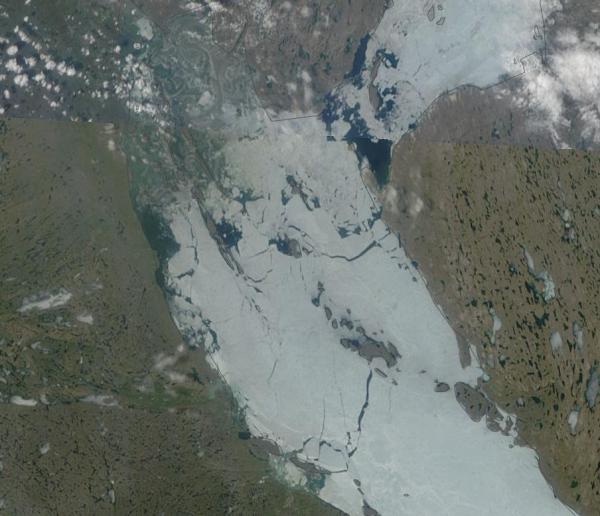
The heat also set off melt and fracturing of sea ice in Cambridge Bay, which you can see in the NASA shot below:

Ice melt Cambridge Bay June 29

(June 29 Ice Melt and Fracturing, Cambridge Bay. Image source: Lance-Modis)

Warming air temperatures typical for this region (high 40s to low 50s) usually result in a more gradual melt. But hot air temperatures at up to 55 degrees (Fahrenheit) above freezing tend to have a far more rapid effect. It is also worth noting the nearly complete lack of visible snow cover in this extreme northern region.

I’ve Never Seen A Rossby Wave Like This

The cause of this 3000 mile swath of heat is an extremely high amplitude wave in the Jet Stream that stretches from the Western US all the way up to the Arctic Ocean. This large bulge has allowed a powerful ‘heat dome’ high pressure system to build up beneath it, concentrating heat over the vast area affected.

Epic Rossby Wave June 30

(Image source: California Regional Weather Office)

Note the up-flow of Jet Stream winds rising up the coast of California, Oregon, Washington and British Columbia then lifting all the way up to the Arctic Ocean before diving back down through central Hudson Bay and into the US Midwest, before making another hairpin turn north again over the Appalachians.

Large Jet Stream waves of this kind are termed ‘Rossby Waves’ after the climate scientist who first identified them. They show extreme north-south and south-north elongation. In the time I’ve been tracking the extreme changes to the Northern Hemisphere Jet Stream brought about by human-caused warming, I’ve never seen a Rossby Wave quite so large as this. Nor have I seen one that is the result of so many large back and forth meanders. In fact, the entire Northern Hemisphere Jet is a mess of meanders, cut off upper level lows and blocking highs.

One of these upper level lows is expected to bring abnormally heavy rain with up to 3-5 inches for some parts of the US East Coast over the next couple of days. So as heat bakes a swath from Death Valley to the Arctic Ocean, the Eastern US braces for potential flooding. Similar Jet Stream loops and swirls spawned the European floods this June, a series of deadly floods that killed hundreds in India and Tibet, and multiple anomalous Arctic heatwaves occurring throughout the past month.

Extreme Jet Streams, like the one displayed above (for late Saturday, June 29), are far more likely to spawn extreme weather events than the usual, gently wavy Jet Stream that human civilization has been used to for much of the 20th Century and, probably, for most of the 10,000 year period since the last ice age. But a combination of eroding sea ice and record or near record low Northern Hemisphere snow cover contribute to both a slowing of the Jet Stream and in greater north-south and south-north flows. The result is large wave patterns in the Jet that tend to get stuck in the same configuration for long periods. Beneath the swells in the Jet, we get hotter temperatures, dryer conditions, and the risk of everything from extreme heatwaves to droughts and fires. In the dips, we get cooler temperatures and much, much stormier conditions resulting in a range of weather from extreme winters (Europe during winter/spring 2013), to floods (Europe summer 2013, India late June 2013), to record rainfall and powerful thunderstorms (US May-June 2013).

These are vivid examples of how human-caused climate change can result in extreme weather.

Heat Wave to Last For at Least a Week

The current record heat wave affecting both the US West and a large section of Canada is expected to last at least until the end of this week. Slow moderation, though, is expected for some regions after Sunday. However, the blocking pattern that spawned this particular heat wave shows little sign of changing position. So hotter, dryer conditions are expected to remain in place for the foreseeable future for much of the US South-West.

Meanwhile, Canada and regions along the Arctic coastline are still likely to see much warmer than usual conditions as periodic warm air invasions from the south are likely to continue.

Links:

Lance-Modis

California Regional Weather Office

Punishing Heat Hits Western US