Worsening Prairie Fires: Exceptional Central Heat and Drought Spurs More Oklahoma Blazes

Today, as with many recent days, Oklahoma is experiencing hot, dry, critical fire hazard conditions. And over the past month, historically exceptional drought and hotter than normal weather have spurred a spate of very severe and seemingly unrelenting wildfires across the state.

(The Rhea Fire burned nearly 300,000 acres in Oklahoma during mid-April. This large fire is now 100 percent contained. But blazes continue to break out. Image source: Climate.gov.)

During mid-to-late April, the Rhea Fire scorched 286,000 acres destroying more than 50 homes and killing hundreds of cattle. At about the same time, the 34 Complex fire burned through 62,000 acres and forced many Oklahoma residents to evacuate. For reference, the massive Thomas Fire which burned hundreds of structures in California this past December was 240,000 acres in size.

Unfortunately, severe fire conditions continued through today with 500 acres going up in flames near Pawnee Oklahoma in just the past 24 hours. In total, about 350,000 acres have burned so far this year (an area half the size of Rhode Island), numerous structures have been destroyed and an estimated 2,000 cattle have likely been killed. With severe drought, heat, and extreme fire conditions expected to continue throughout at least the next month, there is little relief in sight.


(The U.S. Drought Monitor shows severe dry conditions expanding across the Central U.S. during early 2018. Long range forecasts show drought continuing or worsening over Central and Southwestern States over the coming months. Image source: Drought Monitor and NOAA.)

The causes of the present fire hazard are quite clear. Throughout fall, winter, and spring, the Central U.S. has experienced both hotter and drier than normal conditions. During recent weeks, drought in this region has become exceptional — the highest drought category provided by the National Drought Monitor. In addition, strong, warm south-to-north winds have tended to prevail over the region. These winds have rapidly fanned many recent Oklahoma fires to massive size.

Over the coming month, this drought is expected to dig in as temperatures warm. And, as a result, fire danger is expected to be quite high for a broad region of the U.S. South stretching from just west of the Mississippi all the way to California.

(Above normal wildfire potential is expected to remain in place for Oklahoma even as risks rise for neighboring states. Image source: NOAA.)

Though spring wildfires do occur across Oklahoma and parts of the plains states, the trend has been for an increasing large fire incidence. This trend, in turn, has been driven by human-caused climate change. For as the U.S. has warmed, the rate of evaporation from soils, vegetation and lakes has increased. This higher rate of moisture loss both intensifies drought and spikes fire risk.

Warming and worsening drought has been a particularly acute set of affairs for Central and Western states. The number of weeks when large fires are a risk has increased from 50 to 600 percent for most of these regions. In other words, if it seems like there are more large fires, it’s because there are. And what we see now are spring prairie fires that are far more intense than they were in the past.

So Far, 2017 is in the Running to be the 4th Consecutive Hottest Year on Record

We haven’t quite gotten to the global ‘year without a winter’ yet. But it sure looks like we’re heading in that direction –fast.

Due to the highest volume of heat-trapping gasses hitting the Earth’s atmosphere in all of the past 4-15 million years combining with a warming of Pacific Ocean surface waters, the period of 2014 through 2016 saw an unprecedented three consecutive record hot years. With Pacific Ocean waters cooling during late 2016, it appeared that 2017 would become ‘just’ the 2nd to 5th hottest year ever recorded. But that was before the waters off South America’s west coast began to blaze with unexpected heat during early 2017 even as temperatures at the poles climbed to surprisingly warm levels.

(Due to the combined effects of extremely high levels of heat trapping gasses in the Earth’s atmosphere and a switch to the warmer phase of natural variability, the global rate of temperature increase has rocketed over the past three years. 2017 was not expected to continue this trend. But it might. Image source: Karsten Haustein. Data Source: NASA GISS.)

These two sources of unexpected added heat have left their mark. And though it’s still early in the global warming game for 2017, there appears to be an odd, but not entirely outlandish, chance that this year could beat out 2016 as the hottest year ever recorded.

The month of January 2017 came in at 1.14 C hotter than 1880s averages. Meanwhile February measured 1.32 C hotter than this 19th Century benchmark. In total, the first two months of 2017 averaged about 1.23 C hotter than 1880s — which is a hair hotter than 2016’s never-before-seen by modern humans annual average temperature.

(Extreme warmth over parts of Siberia and the Arctic appear to have helped push March of 2017 into the range of second hottest on record. The first three months of 2017 currently appear to be running in a range that’s ahead of 2016 annual record hot average.)

Looking ahead, early indications are that March was also around 1.3 C hotter than 1880s. If a first or second hottest March on record pans out as indicated by early NCEP and GFS model reanalysis, then the first three months of 2017 will come in nearly 0.1 C hotter than all of last year.

During the present human-forced warming trend, it has tended to take about ten years for a global temperature increase of 0.15 degrees Celsius to occur. And that rate of warming is about 30 times faster than the warming that occurred at the end of the last ice age. Since 2013, the world has warmed 0.25 C — which could jump to 0.3 to 0.35 C in the period of 2013 to 2017 if the present trend for this year continues.

There are many months still to go in 2017. So this potential isn’t at all certain at this time. However, with the Pacific Ocean heating up again, it appears that 2017 is going to give 2016 a real run for its ‘hottest ever’ title.

Links:

NASA GISS

Karsten Haustein

NCAR Reanalysis by Moyhu

Hat tip to Colorado Bob

NOAA– Atmospheric CO2 Increased by 2.77 Parts Per Million During 2016

According to NOAA, carbon dioxide — a key heat trapping gas — increased its atmospheric concentration by 2.77 parts per million during 2016. This was the third fastest rate of increase in the NOAA record following 2015 at a 3.03 ppm annual increase and 1998 at a 2.93 annual increase.

Earlier trends had indicated that 2016 might be on track to beat 2015 as a new record year (and a month by month comparison for the first 11 months of 2016 pointed toward a record rate of rise). These concerns, thankfully, did not materialize as atmospheric rates of accumulation slowed down during December of 2016 — which helped to push the overall year to year comparison lower (NOAA’s year-on-year rate of growth is based on a December to January comparison). Nonetheless, the high rate of atmospheric increase for 2016 remains a matter of concern.

co2-annual-rate-of-increase

(2015 saw a record annual rate of atmospheric CO2 increase at 3.03 parts per million. 2016’s increase at 2.77 parts per million was the 3rd fastest on record. Overall, the decade of 2011-2016 is presently showing about a 20 percent faster rate of accumulation than the decade of 2000 to 2010. This should moderate somewhat post El Nino. However, Earth System feedbacks threaten to hamper the environment’s ability to take down excess carbon as the world begins to approach 1.5 C warmer than 1880s averages. Image source: NOAA.)

Overall, the average annual rate of increase for the first six years of the decade beginning in 2011 was 2.42 parts per million. This rate is approximately 20 percent faster than during the decade of 2001 to 2010 (analysis based on this NOAA data) at around a 2.05 parts per million annual increase. Prior to the most recent decade, the 2000 to 2010 period showed the fastest rate of atmospheric carbon dioxide accumulation on record.

El Nino, through ocean warming and related land impacts such as increased droughts and wildfires, can reduce the rate of CO2 uptake by the Earth System — thus forcing a higher rate of increase due to the human emission. And the 2015 to 2016 period featured a strong El Nino. All things being equal, we should expect atmospheric rates of increase to moderate somewhat during 2017. Possibly dropping to slightly below 2 ppm in the best case.

atmospheric-co2-increase-the-keeling-curve

(Extremely rapid rates of atmospheric CO2 increase since the mid 20th Century have been driven by ramping rates of fossil fuel burning. Now we are at a point where the Earth System will have more and more difficulty taking in the carbon spewed out by smokestacks and tail pipes. Image source: The Keeling Curve.)

However, global carbon emissions from fossil fuels at near record levels will continue to push a very high rate of atmospheric accumulation of this climate change driving heat-trapping gas. And the added insult due to global warming now ranging above 1 C hotter than 1880s for most years will tend to put a cap on how effective the Earth is at taking in the very large excess human emission.

By comparison, rates of CO2 increase during the last hothouse extinction event — the PETM — were about 10 to 20 times slower than they are today. And it took hundreds of years for atmospheric concentrations of CO2 to equal the same 125 parts per million increase we’ve now experienced in the 136 years since 1880. So the insult to the Earth System produced by fossil fuel burning is currently extraordinarily high and the rate of heat trapping gas accumulation is probably unprecedented for at least the last 66 million years.

(CO2 is the primary gas driving global warming. But it is not the only one. Add in methane, nitrous oxide and other greenhouse gasses and you end up with a total forcing that’s equivalent to 490 parts per million CO2. Video source: Climate One.)

NOAA is now showing that global atmospheric CO2 averages are hitting near 402.5 parts per million. This level will likely increase to around 404 to 405 parts per million by the end of 2017. The forcing from this CO2 alone (not including methane and other greenhouse gasses which has pushed CO2 equivalent forcing to around 490 parts per million) is enough to push global temperatures to nearly 2 C warmer than 1880s averages this Century (prediction based on ECS model analysis). Longer term, if atmospheric CO2 concentrations remain so high, overall warming could hit 3 C to as much as 4 C hotter than 1880s values when adding in the long-term impacts of other greenhouse gas emissions (prediction based on a meta-analysis of paleoclimate temperature and atmospheric carbon proxies).

With global temperatures already driven to about 1.2 C hotter than 1880s during 2016, it’s not an understatement to say that a period of more dangerous and harmful climate change — forced upon us by the world’s extremely high rate of carbon emissions — is already upon us. And we can see that in the various severe weather and geophysical events that are currently ranging the globe. The urgency for cutting carbon emissions, therefore, could not be greater.

Links:

NOAA’s Earth Systems Research Laboratory

Ten Times Faster Than the PETM

The Keeling Curve

Climate One

Hat tip to Shawn Redmond

Hat tip to Suzanne

(UPDATED)

Why the Global Coral Bleaching Event That Began in 2014 May Just Keep Going and Going

From October of 2014 through June of 2016, the world was in the grips of a powerful El Nino. And throughout this event, the oceans spewed back some of the massive volume of heat they’ve been accumulating in their depths due to global warming. As a result, atmospheric and ocean surface temperatures hit new record highs. And during 2016, global surface temperatures will likely average 1.2 C hotter than 1880s levels. This amount of warming is as considerable as it is harmful.

current-coral-bleaching-status

(A global coral bleaching event that began in 2014 continues. It is the longest coral bleaching event on record. But unless oceans somehow cool off, it won’t really end. With only a weak La Nina emerging following a strong El Nino and a record spike in global temperatures, there is some risk that this ongoing event will ebb and flare on a nearly indefinite basis. Continued fossil fuel burning, meanwhile, will continue to add heat to the global climate system — presenting worsening medium and long term bleaching pressure for corals. Image source: Coral Reef Watch.)

The Worst Global Coral Bleaching Event Ever Recorded… 

This new record spike in global surface temperatures set off the worst coral bleaching event ever recorded. Around the world, reef systems came under severe stress as sea surface and near surface temperatures exceeded 28-30 degrees Celsius.

Among the hardest hit regions were the reefs of Kiribati. There, sea surface temperatures hit up to 31.4 C on an extended basis. Such hot waters are now expected to have wiped out all but 1 to 5 percent of Kiribati’s living corals. So, for all practical purposes, the reefs of that island republic have been wiped out.

Overall, the event was very wide ranging — impacting corals throughout the Pacific, Atlantic, and Indian Oceans as well as in the Persian Gulf, Mediterranean, and Red Sea. As an example, 95 percent of corals in US territories from Florida to the Gulf of Mexico, Caribbean, and Pacific experienced some level of bleaching.

sea-surface-temperature-anomalies

(A weak La Nina has probably already cooled ocean surfaces as much as they will be cooled during 2016 and 2017. But despite this cooling, ocean near-surface waters are still too hot for corals in many places. Relative, if mild, ocean surface warming should occur as ENSO is predicted to shift into neutral status. If coral bleaching is ongoing through La Nina, then it is unlikely to cease as the global ocean starts to warm again. Global sea surface temperature anomaly image source: Earth Nullschool.)

In Australia, the Great Barrier Reef (GBR) also saw its worst bleaching event on record. There, 93 percent of corals are reported to have experienced bleaching. Meanwhile, about 50 percent of corals have died in the northern section of the GBR. In the media, a controversy has raged over whether or not this event is the start of the great reef’s swansong. To be clear, the GBR was not killed off by the most recent large bleaching event. But it was dealt a very severe blow. With the world continuing to warm as fossil fuel burning remains ongoing, a similar blow could occur as soon as the next El Nino or the one after. And the story for many of the world’s remaining reefs could well be the same.

…Is Still Ongoing…

For after about two years now, and as the world has settled into the periodic natural cooling of ocean surfaces called La Nina, the global coral bleaching event that has so damaged the vital species that build the world’s reefs is still ongoing. Though diminished, and as ocean surface heat backed off during late 2016, NOAA has still identified numerous regions that are high risk for coral bleaching through at least February.

coral-bleaching-risk-through-february

The austral summer is expected to bring bleaching over far-flung regions encircling the southern part of the globe. Thankfully, most of the GBR is only under a bleaching watch for now. But bleaching warnings and alerts abound and, unfortunately, many reefs are likely to see continued die-offs even after El Nino has long since faded.

… And May Just, For all Practical Purposes, Continue

As the current La Nina is rather weak, and as it is predicted to shallow into an ENSO neutral state by spring, it appears that sea surface temperatures may be in the process of bottoming out. Global fossil fuel emissions, meanwhile, continue to add heat to the ocean system. As a result, the coral bleaching pressure that we are seeing during the period of November 2016 through February of 2017, unless we see a resurgence to a stronger La Nina event over the next year or two, could be the minimum we will see over the coming years. And if that is the case, then the coral bleaching event that hasn’t ended for the past two years may not really end at all.

Links:

NOAA Coral Reef Watch

NOAA El Nino

Earth Nullschool

Dr Gavin Schmidt of NASA GISS

The Merciless Rains of Climate Change Hammer Houston, Southeast Texas — 12-18 Inches Accumulation, More Than 1,200 Water Rescues Reported

“I can hear your whisper and distant mutter. I can smell your damp on the breeze and in the sky I see the halo of your violence. Storm I know you are coming.”

*****

The atmospheric ingredients right now are ripe for some serious trouble. Globally, the world is just starting to back away from the hottest temperatures ever recorded. This never-before-seen heat plume, driven on by a fossil-fuel abetted warming not seen in at least 115,000 years and an extreme El Nino combined, has loaded an unprecedented amount of moisture into the Earth’s atmosphere. As El Nino shifts toward La Nina and the Earth marginally cools, a portion of this massive excess of water vapor is bound to fall out as rain — manifesting as terrible extreme precipitation episodes that can result in serious trouble. A seemingly endless procession of freak events that challenge the record books time and time again.

Across the world, we’re starting to see such episodes now. Over the past week, Iran, Yemen, Qatar Saudi Arabia and Afghanistan have experienced flash floods resulting in loss of life. Severe floods spurred a major emergency response effort in Central and Northern Russia this weekend. And in Santiago Chile, streets turned into rivers as a sudden and extraordinary deluge both polluted the water supplies of 1 million people and transformed the world’s largest copper mine into a lake.

(Severe flooding around the world this week includes the Houston area — sections of which have essentially been crippled by 12-18 inches of rainfall over the past 24 hours. In total, more than 1,200 water rescues have been reported throughout the region. Many residents, like the gentleman above, appear to have been shocked and surprised by the flooding’s severity. Video source: Houston ABC News.)

Sudden, Extreme Flooding in Houston Area

In the US, the City of Houston and the region of southeastern Texas experienced its own extreme deluge. There, a stubborn and unyielding high pressure system over the US East Coast, an omega block in the Jet Stream, a cut off upper level low, and a nearly unprecedented amount of moisture streaming in from the Gulf of Mexico and regions to the Equatorial South all conspired to aim a train of powerful storms in the form of an eye-popping mesoscale convective system (MCS) at the Houston region. Since early this morning, between 12-18 inches of rainfall fell over the city’s western suburbs with 6-8 inches inundating the city center. In some places, rates of rainfall accumulation hit a crippling rate of nearly 4 inches per hour.

According to Bob Henson at Weather Underground:

… the Houston area was socked on Monday morning by a huge mesoscale convective system (MCS) that drifted southeast across the area, dumping eye-popping amounts of rain: 6” – 8” over central Houston, with 12” – 18” common over the far western suburbs… While individual thunderstorms often weaken after dark, the large mass of thunderstorms that makes up an MCS will often persist overnight and into the next morning, as the MCS cloud tops radiate heat to space and instability is enhanced.

The record single day rainfall total for Houston before today was 11.25 inches. It appears likely that 11.75 inches recorded at Houston International Airport today will mark a new daily high mark for a city that grew up out of fossil fuel burning but now appears to be drowning in the heat-intensified effluent. More to the point, most of Houston’s western suburbs experienced what amounts to an entire typical season’s worth of rainfall in just one 24 hour period.

Drainage systems, not designed to handle anywhere near so much water over so short a period, were rapidly overwhelmed. By midday, more than 70 subdivisions in the Houston region were reported flooded, more than 1,200 vehicle water rescue operations had been conducted along the inundated region’s streets and highways, and more than 1,000 homes were inundated. Seven hospitals were shut down, airport operations were crippled, and more than 100,000 people were reported to be without power. The Weather Channel’s Jim Cantore, not known for understatement, may have hit a bit below the mark when he noted that “this is a mind boggling situation” earlier this afternoon. CNN, in its summation report of this, most recent, disaster declared that the entire city had been basically shut down.

Extreme Storms Houston Texas

(River of moisture flows up from the Equator and Gulf of Mexico and into the Houston region on Monday — spurring extreme rains that cripple the city. A pair of doggedly persistent weather systems — a blocking high to the east and an upper level low to the north contributed to the extreme weather over Houston. Climate change related features like record atmospheric moisture loading, and persistent ridge and trough generation due to Jet Stream changes likely linked to record low Arctic sea ice levels also likely influenced today’s severe storms. Image source: LANCE MODIS.)

As of early this evening, a series of somewhat less intense storms still trailed through the Houston region as heavier rains marched off toward the east over Louisiana and Arkansas. A strong moisture flow is expected to persist over Eastern Texas and the southern Mississippi River Valley region through to at least Thursday as both the upper level low and blocking high complicit in Monday’s extreme flooding in Houston appear reluctant to budge from their current positions. As a result, NOAA is predicting another 4-5 inches of rainfall for areas near and just to the North and East of Houston over the next seven days. To this point, it’s worth noting that NOAA’s precipitation models had ‘only’ predicted about 4 inches of rainfall for the past 24 hour period in the near Houston area — a period that produced about five times that total for some locations. So it appears that weather models may be having a little bit of trouble managing the new and extremely dynamic atmospheric conditions now coming into play.

But One Extreme Event of Many in the Past Five Months

Houston’s likely record rainfall for this time of year comes on the back of hailstorms generating up to a billion dollars worth of damage over Northeastern Texas last week and follows a record March inundation of the Mississippi River region just to the North and East. An event that also followed a freak December flooding of Missouri and Illinois which likewise re-organized the record books. Overall, this represents an extreme spate of severe weather for one localized region.

Consistent trough generation in the Jet Stream over the area (likely influenced by record low Arctic sea ice coverage), consistent above average sea surface temperatures in the Gulf of Mexico, a strong moisture flow from a record El Nino, and record global temperatures contributing to high atmospheric moisture loadings all influenced severe storm formation over this area during recent months. Sadly, it’s a spate of severe weather that is likely to continue at least until the end of Spring.

Links:

Widespread Flooding, More than 1,000 Water Rescues in Houston Area

Houston Largely Shut Down Amidst Severe Rainfall, Flooding

Massive Flood in Houston

Houston Texas Average Rainfall

Flash Floods Claim 18 Lives Across Saudia Arabia

Deadly Rains Pound the Middle East

Flash Floods in North Afghanistan Claim 38 Lives Overnight

World’s Largest Copper Mine Shut Down in Santiago Flood

As A Titanic El Nino Begins to Fade, What Fresh Trouble Will Record Warm World Bring?

NOAA Quantitative Predictive Forecasts

Punishing Four Season Storm Grips US

Mangled Jet Stream, River of Moisture Set to Deliver Severe Flooding to Mississippi River Valley

Houston ABC News

Hat Tip to Colorado Bob

Hat Tip to Greg

Hat Tip to DT Lange

Hat Tip to Daniel Hatem

The Roof is On Fire — Looks like February of 2016 Was 1.5 to 1.7 C Above 1880s Averages

Before we go on to explore this most recent and most extreme instance in a long string of record-shattering global temperatures, we should take a moment to credit our climate change denier ‘friends’ for what’s happening in the Earth System.

For decades now, a coalition of fossil fuel special interests, big money investors, related think tanks, and the vast majority of the republican party have fought stridently to prevent effective action to mitigate the worst effects of climate change. In their mad quest, they have attacked science, demonized leaders, gridlocked Congress, hobbled government, propped up failing fossil fuels, prevented or dismantled helpful regulation, turned the Supreme Court into a weapon against renewable energy solutions, and toppled industries that would have helped to reduce the damage.

Through these actions, they have been successful in preventing the necessary and rapid shift away from fossil fuel burning, halting a burgeoning American leadership in renewable energy, and in flooding the world with the low-cost coal, oil, and gas that is now so destructive to Earth System stability. Now, it appears that some of the more dangerous impacts of climate change are already locked in. So when history looks back and asks — why were we so stupid? We can honestly point our fingers to those ignoramuses and say ‘here were the infernal high priests who sacrificed a secure future and our children’s safety on the altar of their foolish pride.’

Worst Fears For Global Heating Realized

We knew there’d be trouble. We knew that human greenhouse gas emissions had loaded the world ocean up with heat. We knew that a record El Nino would blow a big chunk of that heat back into the atmosphere as it began to fade. And we knew that more global temperature records were on the way in late 2015 and early 2016. But I have to say that the early indications for February are just staggering.

Extreme Global Warming

(The GFS model shows temperatures averaged 1.01 C above the already significantly hotter than normal 1981-2010 baseline. Subsequent observations from separate sources have confirmed this dramatic February temperature spike. We await NASA, NOAA, and JMA observations for a final confirmation. But the trend in the data is amazingly clear. What we’re looking at is the hottest global temperatures since record keeping began by a long shot. Note that the highest temperature anomalies appear exactly where we don’t want them — the Arctic. Image source: GFS and M. J. Ventrice.)

Eric Holthaus and M. J. Ventrice on Monday were the first to give warning of an extreme spike in temperatures as recorded by the Global satellite record. A slew of media reports followed. But it wasn’t until today that we really began to get a clear look at the potential atmospheric damage.

Nick Stokes, a retired climate scientist and blogger over at Moyhu, published an analysis of the recently released preliminary data from NCAR and the indicator is just absolutely off the charts high. According to this analysis, February temperatures may have been as much as 1.44 C hotter than the 1951 to 1980 NASA baseline. Converting to departures from 1880s values, if these preliminary estimates prove correct, would put the GISS figure at an extreme 1.66 C hotter than 1880s levels for February. If GISS runs 0.1 C cooler than NCAR conversions, as it has over the past few months, then the 1880 to February 2016 temperature rise would be about 1.56 C. Both are insanely high jumps that hint 2016 could be quite a bit warmer than even 2015.

It’s worth noting that much of these record high global temperatures are centered on the Arctic — a region that is very sensitive to warming and one that has the potential to produce a number of dangerous amplifying feedbacks. So we could well characterize an impending record warm February as one in which much of the excess heat exploded into the Arctic. In other words — the global temperature anomaly graphs make it look like the world’s roof is on fire. That’s not literal. Much of the Arctic remains below freezing. But 10-12 C above average temperature anomalies for an entire month over large regions of the Arctic is a big deal. It means that large parts of the Arctic haven’t experienced anything approaching a real Arctic Winter this year.

Looks Like The 1.5 C Threshold Was Shattered in the Monthly Measure and We May Be Looking at 1.2 to 1.3 C+ Above 1880s For all of 2016

Putting these numbers into context, it looks like we may have already crossed the 1.5 C threshold above 1880s values in the monthly measure during February. This is entering a range of high risk for accelerating Arctic sea ice and snow melt, albedo loss, permafrost thaw and a number of other related amplifying feedbacks to a human-forced heating of our world. A set of changes that will likely add to the speed of an already rapid fossil fuel based warming. But we should be very clear that monthly departures are not annual departures and the yearly measure for 2016 is less likely to hit or exceed a 1.5 C departure. It’s fair to say, though, that 1.5 C annual departures are imminent and will likely appear within 5-20 years.

If we use the 1997-1998 El Nino year as a baseline, we find that global temperatures for that event peaked at around 1.1 C above 1880s averages during February. The year, however, came in at about 0.85 C above 1880s averages. Using a similar back of napkin analysis, and assuming 2016 will continue to see Equatorial sea surface temperatures continue to cool, we may be looking at a 1.2 to 1.3 C above 1880s average for this year.

CFSv2

(El Nino is cooling down. But will it continue to linger through 2016? Climate Prediction Center CFSv2 model ensembles seem to think so. The most recent run shows the current El Nino restrengthening through Fall of 2016. Such an event would tend to push global annual temperatures closer to the 1.5 C above 1880s threshold. It would also set in place the outside potential for another record warm year in 2017. It’s worth noting that the NOAA consensus is still for ENSO Neutral to weak La Nina conditions by Fall. Image source: NOAA’s Climate Prediction Center.)

NOAA is currently predicting that El Nino will transition to ENSO neutral or a weak la Nina by year end. However, some model runs show that El Nino never really ends for 2016. Instead, these models predict a weak to moderate El Nino come Fall. In 1998, a strong La Nina began to form — which would have helped to suppress atmospheric temperatures by year-end. The 2016 forecast, however, does not seem to indicate quite as much atmospheric cooling assistance coming from the world ocean system. So end 2016 annual averages may push closer to 1.3 C (or a bit higher) above 1880s levels.

We’ve Had This Warming in the System for a While, It was Just Hiding Out in the Oceans

One other bit of context we should be very clear on is that the Earth System has been living with the atmospheric heat we’re now seeing for a while. The oceans began a very rapid accumulation of heat due to greenhouse gas emissions forcing during the 2000s. A rate of heat accumulation in the world’s waters that has accelerated through to this year. This excess heat has already impacted the climate system by speeding the destabilization of glaciers in the basal zone in Greenland and Antarctica. And it has also contributed to new record global sea ice losses and is a likely source of reports from the world’s continental shelf zones that small but troubling clathrate instabilities have been observed.

Nature Global Ocean Heat Accumulation

(Global ocean heat accumulation has been on a high ramp since the late 1990s with 50 percent of the total heat accumulation occurring in the 18 years from 1997 though 2015. Since more than 90 percent of the greenhouse gas heat forcing ends up in the world ocean system, this particular measure is probably the most accurate picture of a rapidly warming world. Such a swift accumulation of heat in the world’s oceans guaranteed that the atmosphere would eventually respond. The real question now is — how fast and far? Image source: Nature.)

But pushing up atmospheric heating will have numerous additional impacts. It will put pressure on the surface regions of global glaciers — adding to the basal melt pressure jump we’ve already seen. It will further amplify the hydrological cycle — increasing the rates of evaporation and precipitation around the world and amplifying extreme droughts, wildfires and floods. It will increase peak global surface temperatures — thereby increasing the incidence of heatwave mass casualty events. It will provide more latent heat energy for storms — continuing to push up the threshold of peak intensity for these events. And it will help to accelerate the pace of regional changes to climate systems such as weather instability in the North Atlantic and increasing drought tendency in the US (especially the US Southwest).

Entering the Climate Change Danger Zone

The 1-2 C above 1880s temperatures range we are now entering is one in which dangerous climate changes will tend to grow more rapid and apparent. Such atmospheric heat has not been experienced on Earth in at least 150,000 years and the world then was a much different place than what human beings were used to in the 20th Century. However, the speed at which global temperatures are rising is much more rapid than anything seen during any interglacial period for the last 3 million years and is probably even more rapid than the warming seen during hothouse extinction events like the PETM and the Permian. This velocity of warming will almost certainly have added effects outside of the paleoclimate context.

Arctic Degree Days Below Zero Anomaly

(Anyone looking at the temperature anomaly graph on the top of this post can see that a disproportionate amount of the global temperature anomaly is showing up in the Arctic. But the region of the High North above the 80 degree Latitude line is among the regions experiencing global peak anomalies. There, degree days below freezing are at the lowest levels ever recorded — now hitting a -800 anomaly in the Arctic record. In plain terms — the less degree days below freezing the High Arctic experiences, the closer it is to melting. Image source: CIRES/NOAA.)

One final point to be clear on is then worth repeating. We, by listening to climate change deniers and letting them gum up the political and economic works, have probably already locked in some of the bad effects of climate change that could have been prevented. The time for pandering to these very foolish people is over. The time for foot-dragging and half-measures is now at an end. We need a very rapid response. A response that, at this point, is still being delayed by the fossil fuel industry and the climate change deniers who have abetted their belligerence.

Links:

The Old Normal is Now Gone

NASA GISS

Hot, Hot, Hot

Michael J. Ventrice

No Winter for the Arctic in 2016

Big Jump in Surface and Satellite Temperature Measures

NOAA’s Climate Prediction Center

Industrial Era Global Ocean Heat Uptake Doubles in Recent Decades

CIRES/NOAA

Republican Governors Sue to Stop Clean Power Plan


More Weather Weirding — Godzilla El Nino vs a Mean Polar Amplification

We may have never seen heat like this before in the Equatorial Pacific. And as for atmospheric temperatures, 2015 is already locking in to shatter all-time global records set just last year. But despite a Monster El Nino raging across the world’s mid-section, despite a strengthening Jet Stream and a roaring storm track, the greatest warm atmospheric temperature anomalies are still centering in on the Arctic.

In other words, it appears that human-forced warming has taken so much cold out of the poles that there isn’t much of it left for the strengthening circumpolar winds to lock in.

A Godzilla El Nino

Equatorial Red Scar

(The angry red scar of anomalous ocean heat that is the tell-tale of a monster El Nino is plainly visible in today’s Climate Reanalyzer Sea Surface Temperature Anomaly [SSTA] graphic.)

All you have to do is look at the great red scar spanning more than half of the Equatorial Pacific Ocean on the upper Climate Reanalyzer map to tell it’s a Monster El Nino year. A zone that in this measure is now showing an amazing +1.26 C sea surface temperature anomaly above the already hotter than normal 1979-to-2000 average. A region where weekly average sea surface temperatures in NOAA’s El Nino monitor are now tied with the record 1997 event. There, according to NOAA, temperatures last week hit 2.8 degrees Celsius above average along an Equatorial band stretching from 120 to 180 West Longitude. As a result, the Equatorial atmosphere continued to heat up, continued to contribute to global temperatures that for 2015 will be the hottest ever recorded over the past 135 years.

Considering such a massive amount of heat boiling up off this key Equatorial zone, we’d tend to think that this region would also show atmospheric temperatures that are much warmer than average. And it does. But strangely, perhaps ominously, the highest average atmospheric temperature departures do not reside over these record hot waters. They instead show up where we might least expect them during a record El Nino year — at or near the poles.

Odd Polar Amplification

Atmospheric temperature anomalies

(El Nino is already contributing to stronger circumpolar wind fields, so why are the Antarctic and Arctic regions still so warm? Image source: Climate Reanalyzer.)

For both within the Arctic and Antarctic — it’s still much warmer than normal. In the Antarctic, a zone from 70 to 90 South features air temperatures that are between 10 and 20 degrees Celsius hotter than average. In the northern polar zone an even warmer region ranging from 14 to 20+ degrees Celsius above average stretches over the fractured and greatly thinned sea ice along an arc just north of Svalbard and on into Russian Siberia. Overall, the Arctic as a whole shows an extraordinary +1.27 C positive anomaly. The Antarctic is at +0.90 C. And the tropics, which includes our massive El Nino still lags at an admittedly impressive +0.64 C above the already hotter than normal 1979 to 2000 average.

Why is this temperature anomaly pattern so darn weird? It all has to do with atmospheric physics. During times of strong El Ninos, the temperature difference between the poles and the Equator tends to increase as the Equator warms. This, in turn, strengthens the Jet Stream. A strong Jet Stream, for its part, tends to keep cold air locked away at the poles. So, ironically, as the Equator warms with El Nino, the poles have a tendency to cool off a bit.

So far, for the Fall of 2015, this isn’t really what we’ve seen. Sure, the Equator has warmed up quite a bit. Concordantly, the Jet Stream appears to have strengthened somewhat. We still have a big ridge that tends to keep forming over the ridiculously and persistently warm Northeastern Pacific, but it’s not stretching all the way into the Arctic like it did last year. Meanwhile, Jet Stream velocities and related storm track intensities are hitting rather high values. Arctic Oscillation has also recently hit extremely high positive values. A strongly positive Arctic Oscillation traditionally tends to result in cold air remaining locked away in the Arctic, but considering the temperature anomaly maps, Arctic cold hasn’t really been all that cold of late.

image

(North America — surrounded on all sides by ridiculously hot water. How will the influences of this off the charts ocean warming impact North American and North Atlantic weather systems this Winter? Image source: Earth Nullschool.)

Is Human Forced Warming Meddling with the El Nino-Polar Interplay?

So why are the poles still tending to remain very warm even as the Equator warms? The first answer is that high greenhouse gas concentrations from human fossil fuel emissions tend to preferentially warm these regions. This is due to the fact that greenhouse gasses have their greatest warming impact during times of darkness or when the sun is at a low angle. Compounding this impact for the Arctic is the fact that a high overburden of both CO2 and methane hangs over the region — possibly due to heightening emissions from thawing permafrost, increasing forest fires, and increasing ocean-to-atmosphere carbon fluxes.

A second answer is that the overall atmospheric impacts of the current Monster El Nino may not have come into full swing yet. We do still have a very warm pool of water in the Northeastern Pacific and this warm pool has tended to somewhat resist the polar wind field intensifying effects of a strong El Nino. This warm pool has also given the current El Nino a springboard upon which to further intensify. So the push and pull between these two hot water zones may not be over yet.

All in all, this pattern points to more and more weather weirding on tap for this Winter. Jet Streams and storm tracks may run further to the north as a result — especially in the areas of the Pacific Northwest and in Northern Europe. Troughs may also tend to dig a bit deeper along the Central and Eastern US and on out into the North Atlantic. This is not exactly the forecast we would expect with such a strongly positive Arctic Oscillation. But the related cool air pool has retreated so far north as to, at least for now, not fully result in a strong El Nino + strong Arctic Oscillation related weather pattern. Instead, for now, what we are seeing is a weird kind of hybrid weather pattern that appears to be incorporating the influences of a Monster El Nino, of ongoing polar amplification, of the cool pool in the North Atlantic, of the abnormally warm Barents Sea, and of the Hot Blob still firmly entrenched in the Northeastern Pacific.

Links:

NOAA’s Weekly El Nino Report

NOAA’s Arctic Oscillation Index

Weather Underground El Nino Reports

Climate Reanalyzer

Earth Nullschool

Hat Tip to Ryan in New England

June Snow Melt Brings July Arctic Sea Ice Drop-off

It’s a pretty well established theory. If snow over the Northern Hemisphere land and sea ice masses substantially melts during May and June, it can tend to set up a general weather pattern that is conducive to large-scale reductions of the Arctic sea ice come July, August and September.

Arctic Sea Ice in ragged condition during mid July

(Arctic sea ice in very ragged condition by July 19, 2015. A situation born of a continuous Greenland and Central Arctic high pressure ridge setting up warm air build-ups and a sea ice-flushing dipole weather pattern. Image source: LANCE-MODIS.)

Arctic High Pressure, Heat, Collapsing the Sea Ice

And, during June, we saw just this kind of trend emerge. Arctic heatwaves over both the Continental land masses and the Arctic sea ice resulted in a rapid melting of snow cover. Heatwaves fed by massive bulges in the Northern Hemisphere Jet Stream, particularly along the now-famous Ridiculously Resilient Ridge over what is today an amazing (horrific) hot zone of Northeastern Pacific surface waters. El Nino and Positive PDO played their role too, kicking up the hot zones and the ridge to ever greater intensity. An atmospheric and ocean synergy in a 1 C hotter than 1880s context that kept hurling more and more heat into the Arctic environs. Melting more snow and setting the stage for a potential sea ice massacre to come.

By early July there were indications that just such an event may be on the way. A ‘heat dome’ type high pressure system had become well established over the Greenland side of the High Arctic. And for the past three weeks now, this high has remained entrenched. A persistent weather pattern that has allowed more sunlight to hit the sea ice during periods of peak insolation, a pattern that compacts sea ice in the Central Arctic, a pattern that draws storms into the Siberian side of the Arctic to chew away at the ice edge, and a pattern, that overall, drives the ice inexorably toward its Atlantic Ocean flush valve in the Fram Strait.

Arctic Heat

(Hot to record hot conditions have remained in place over the Arctic Ocean throughout July. Image source: NSIDC)

All this extra heat, transport, compaction and storms chewing away at the sea ice edge has finally started to take a very serious toll. As of today, sea ice extent measures had dropped from 7th to 10th lowest on record to 6th to 7th lowest. Area has remained at 4th to 5th lowest on record for the date. Meanwhile volume in the DMI measure has dropped to 2nd lowest on record.

Most charts now are starting to show a steep ‘cliff’ type rate of decline indicative of rapid sea ice collapse. This is particularly true in NSIDC’s Charctic and Cryosphere Today’s sea ice graphs which now show both extent and area lines plunging at rates that will rapidly cross new thresholds if they continue over the coming days.

Sea Ice Concentration in a Rough State

But perhaps most disturbing of all are the indicators that are now showing up in nearly all of the visual concentration monitors. Uni Bremen sea ice concentration continues to look like a massacre on the Pacific side. NSIDC doesn’t appear to be much better. But Cryosphere Today takes the cake for an overall display of sea ice weakness that, on the 19th (updated as the CT measure used earlier ended up being a bit off), looked nearly as bad as on the same day during the record melt year of 2012:

2012 to 2015 Comparison

(Comparison of July 19, 2015 and July 19, 2012 shows 2015 looking nearly as bad as 2012 in the concentration measure. Image source: Cryosphere Today.)

Comparing the left frame image with the MODIS satellite shot at the top of this post, we find confirmation of an overall, very weak sea ice state. Concentration throughout the Arctic appears low. This is especially true on the Beaufort, Chukchi and East Siberian Sea side (see MODIS shot at bottom of post). But extensive weakness and low concentration appears to pervade the entire ice mass. Zooming in on the sea ice surface, we find that some of this low concentration is possible to confirm. The entire Arctic is now full of broken floes, polynya and melt ponds.

Though it is also possible that this extensive melt ponding (also a feature that weakens sea ice) may have kicked the Crysosphere Today concentration sensor a bit into the extreme scale (corrected during the past 24 hours), the 2012-to-2015 comparison above is still apples to apples. And what’s a bit disturbing about this comparison is the fact that much of the concentration in red (55 to 70 percent) in the 2012 measure completely melted out at the ocean surface by mid September of that year. More notably, perhaps, is the fact that the Cryosphere Today concentration measure is, at least in part, confirmed by the US Navy ARCc Concentration model which has now begun to pick up some of the earlier predicted rapid melt in the observational ensemble:

US Navy Concentration

US Navy Concentration Forecast

(Sea ice massacre starting to show up in the US Navy ARCc model daily observations [top frame] and continues to be predicted in the 30 day history and 7 day forecast [bottom frame]. Image source: US Navy.)

Above, we see very low sea ice concentration practically anywhere outside the 80 degree North Latitude line. Most notably, concentration is very thin and rapidly weakening in the Beaufort, Chukchi, East Siberian, and Laptev Seas. And the seven day forecast shows very rapid melt throughout all these regions with the low concentration bulge beginning to invade north of the 80 degree line on the Laptev and ESS side in particularly troubling fashion.

Forecast — Continued Rapid Melt, Some Records May be Threatened

So the question, going forward, is — what next? And it appears that the sea ice is being prepped for continued rapid to accelerating melt over at least the next 7-10 days. Seven day forecasts show the ridge remaining on the Greenland side of the Arctic throughout the period. A position that will continue the current melt, transport and ice weakening regime. Longer range, ten day, ECMWF forecasts find the high shifting more toward a strong ‘heat dome’ located in the Central Arctic with a somewhat weaker high remaining over Greenland — a minor variation of the current ice-weakening state that may slow down ice export but leave compaction, melt ponding, heat build-up, and ice edge weakening due to storms in tact.

Very weak sea ice

(Sea ice throughout the Beaufort, Chukchi, ESS and Laptev is very weak. Can it survive another 10 days of the Greenland/Central Arctic heat dome? Image source: LANCE-MODIS.)

Due to this weather forecast and due to some observations beginning to come in line with ARCc model runs, we cannot rule out a very rapid melt and recession of sea ice along a broad arc running all the way from the Canadian side to East-Central Siberia. The sea ice is visibly very weak there. Perhaps the weakest we’ve ever seen it for this time of year. Ice that will continue to be pulled poleward by the highs that are forecast to remain in place. Ice that will run into weakened, melt pond invaded ice — a paltry respite for its retreat. And ice that will continue to be harried by edge storms and an influx of much hotter than normal air and water from the Pacific Ocean side. It’s a rapid melt risk that calls into effect the potential that some old sea ice area, extent, and volume records may be challenged or broken — probably not 2012’s all time low marks, but more possibly 2011 or 2007.

It’s, overall, a very tenuous situation for sea ice, one that is continuing to be fed by a growing El Nino and still firmly entrenched RRR to the south. So the evolution of sea ice melt over the next few weeks will likely be a critical game-maker for the state of Arctic Sea ice melt and the overall story of Arctic Sea Ice decline in this sad age of human-forced climate change.

UPDATED JULY 21, 2015

Links:

LANCE-MODIS

NSIDC

US Navy

Cryosphere Today

Uni Bremen

June Arctic Heatwave Takes Down Northern Hemisphere Snow Cover

Halfway to 2 C

Arctic Heatwave Pummels Sea Ice in Early July

See Beaufort and Northwest Passage Melt Progress Over at The Arctic Sea Ice Blog

(Please support public, non-special interest based science like the work conducted by the national snow and sea ice monitors, NOAA and NASA. Without their ongoing work, this analysis and commentary would not be possible.)

Late October Sees Strong Polar Amplification, Mangled Jet Stream Impacting Much of Antarctica

Globally speaking, it’s a rather hot day.

According to GFS model runs and observational data, the past 24 hour period has shown temperatures in the range of +0.72 C above the already hotter than normal 1979 to 2000 average. A hot day in a hot month that is likely to be among the hottest on record, if not an all-time record-breaker itself.

A couple of days ago, hourly CO2 levels rocketed from 396 ppm to 399.5 ppm. A rather odd and somewhat ominous jump back toward the 400 ppm level at a time of year when atmospheric CO2 should be just starting a slow rebound from lowest ebb. A bottom that this year hit about 395 ppm during mid September. A measure already more than 2.2 ppm above last year’s low. To say the least, an hourly upward swing of 3.5 ppm isn’t exactly normal, especially when one considers the fact that the world hasn’t seen near 400 ppm CO2 levels for about three million years (this year peaked near 403 ppm during late spring).

And all that extra CO2, when combined with other greenhouse gasses, is having an increasingly obvious impact on climate. We see it in the record global average temperatures. We see it in the rising oceans which have come more and more to threaten the cities, lands and isles upon which so many of us reside. We see it in increasing instances of extreme weather around the globe — in the extraordinary and often persistent droughts, floods, storms and wildfires. And we see it in the form of a rather strong temperature amplification at both poles.

Antarctic Amplification

(Global temperature anomaly maps provided by GFS and the University of Maine shows no regions of the world cooler than average with the highest abnormal warm temperature departures concentrated, as usual, at the poles.)

Greenhouse Gasses as Primary Driver of Polar Amplification

Today, the Arctic is 1.60 C above the already hotter than normal 1979 to 2000 average. Meanwhile, the Antarctic boasts the highest departures for any global region at +2.09 C. Taking a closer look at the Antarctic Continent, we find an angry red splotch featuring temperature anomalies in the range of +12 to +20 C above average. A region associated with a tropics-to-pole transfer of airs we’ll discuss more in depth later.

What causes such a powerful and visible polar amplification? In short, it can best be described as the general impact of added greenhouse gasses on the global climate system.

Because most of the sun’s radiation falls on the equatorial regions, temperatures there are governed to a greater degree by direct solar insolation. But move toward the poles where sunlight hits the earth at a much lower angle, if at all, then the impact of the greenhouse effect holds greater sway. There, the ability of a gas like CO2 to trap and re-radiate long wave solar heat radiation can have a rather extraordinary impact.

On an Earth with no atmosphere, the temperature differential between poles and equator, between night and day, would be even more extreme than the variance we see today. But as the atmosphere thickens and the greenhouse gas overburden intensifies, the temperature difference grows less. For Earth’s present climate the temperature difference between the Equator and the Arctic averages about 42 degrees C. For the Antarctic, the average is about 71 degrees C.

On a world like Venus, where a kind of super greenhouse is in force and much of the atmosphere is composed of CO2, there is practically no difference in temperature between the equator and the poles. The reason for this is that greenhouse gasses trap the sun’s long wave radiation and recirculate it around a planetary system. And on Venus, a ray of long wave sunlight that comes in has very little chance to get out. So its heat recirculates many times within Venus’s atmosphere before it finally escapes.

On a place like Earth, where greenhouse gas levels are increasing, we would expect the temperature difference between the equator and the poles to drop as the poles warm faster due to the added impact of the increased greenhouse gasses. And since about the mid 20th Century, this is exactly what we’ve seen.

North Pole to Equator Temperature Difference

South Pole to Equator temperature difference

(Top frame shows North Pole to Equator temperature difference since 1948. Bottom frame shows South Pole to Equator temperature difference from 1948 to 2011. Note the approximate 3 C temperature swing indicating a faster warming at the poles in both graphs. Data is from the NCAR-NCEP reanalysis model.)

Lowering differences in Equator to polar temperature on a warming world also denotes a much faster warming of the polar zones. Hence the term polar amplification.

Now, for the Arctic, polar amplification has also become synonymous with loss of sea ice, loss of snow cover, increased land darkening due to changes in vegetation, and local release of greenhouse gasses via feedbacks from the Arctic environment. Each of these changes has the potential to add increased warming on top of the warming already being driven by global greenhouse gas increase even as such changes likely also drive changes to local and Northern Hemisphere weather. But as important as these additional changes may be, the larger driver remains an increase in global greenhouse gases driven by human emissions.

How Polar Amplification Drives Changes to the Jet Stream

In the end, such a polar amplification is a strong driver for changes to the world’s weather. Primarily, by reducing the difference in temperature between the poles and the Equator, we tend to see weaknesses forming in the circumpolar wind field known as the Jet Stream. At times, the Jet will slow and meander, allowing for the formation of ridges that extend far into polar zones and for troughs that dip deep into the middle and lower latitudes. Rather than a west-to-east flow of wind and weather, such a shift generates more of an Equator-to-pole flow:

image

(Triple tendrils — meridional flows converge on Antarctica. Note the massive highs sitting in the ridge systems driving the poleward wind flows. Image source: Earth Nullschool.)

And today we see two large north to south flows issuing from the 20 degree south latitude region, traversing thousands of miles of ocean in a poleward flood and terminating at the great ice sheets of Antarctica in the region of 70 to 75 south latitude.

Note that the flow originating off the west coast of South America terminates at the vulnerable West Antarctic Ice Sheet — a region that has been warming at an extraordinary pace of 0.25 to 0.5 C each decade. The second flow, originating from the South Atlantic and terminating over East Antarctica is heavily involved in the +12-20 degree C temperature anomalies ongoing there today.

Looking at these massive flows of air and the related spikes in temperature anomalies, it is easy to become confused over the issue of cause and effect. But it is simple to recall if you understand that first, added greenhouse gasses warmed the pole which in turn weakened the Jet Stream, which in turn allowed an amplification of the north-south meridional flow transporting yet more heat into this southern polar region.

For the southern polar region, today, we see some extraordinary high temperature departures for mid-to-late spring. At this time, polar amplification should be fading as more sunlight streams in. And yet we have a still strong positive temperature anomaly.

And as for the northern polar zone with its numerous additional polar amplification vectors, we shall see to what degree, if any, a potentially emerging El Nino tamps down the extraordinary meridional flows and polar vortex disruptions seen during just this past year’s freakish winter of 2013-2014.

Links:

University of Maine

NCAR-NCEP reanalysis model

Earth Nullschool

The Keeling Curve

Polar Amplification

Rapid Arctic Warming and Wacky Weather — Are They Linked?

Sudden Arctic Cyclone Churns Through Beaufort Sea Ice

Sudden Arctic Cyclone 2013

Sudden Arctic Cyclone 2013 over Beaufort Sea. Image source: DMI

In a new incarnation of the Warm Storm event that has increasingly come to impact summer Arctic sea ice, a rapidly intensifying low pressure system formed Tuesday over the Beaufort, tracking directly through a large section of vulnerable ice and moving on toward the Canadian Archipelago. At its most intense the storm dropped to 977 millibars but has weakened slightly today to 980 millibars. The storm is expected to continue slowly weakening through today and tomorrow until finally fading by late Saturday or early Sunday.

Though strong, this storm is expected to be brief and is likely to not have the same impacts seen during the Great Arctic Cyclone of 2012. That storm approached the Arctic as an already well-developed system. Packing winds in excess of 60 miles per hour, it had the opportunity to rile a large section of open water and then fling waves as high as 10 feet up against the ice pack. Though this particular storm has hosted gale force winds, they have mostly blown parallel to the ice edge and did not have the same opportunity to develop a longer fetch over open water. It is also worth noting that the Great Arctic Cyclone lasted for about two weeks while this most recent Sudden Arctic Cyclone is likely to last for only about four to five days. So ongoing effects are likely to be limited.

All that said, this storm should have some impact. Already, an increasing number of slats of open water are visible through large sections of the Beaufort and the ice edge appears to have been torn at like a large swatch of tissue paper might act when forcibly twisted. The ice this year is particularly thin and slushy, making it subject to much more rapid motion and deformation. So we are already seeing such effects.

The below image shows a section of central Beaufort sea ice just after the storm center passed. Note the cracked and more diffuse condition of the ice.

Traumatized Sea Ice 80N 150W

Sea ice traumatized by Sudden Arctic Cyclone at 80N and 150W. Image source: NASA

In addition to the impacts described above, warmer air and constant sunlight over the Beaufort have likely provided a number of reservoirs of heat energy for the storm to tap to melt and thin the ice. Cyclonic pumping will be able to dredge warmer, saltier waters from the bottom layer even as surface churning will mix both ice and water warmed by these cyclonic forces. Brine channels within the ice are more likely to activate now that summer has had the opportunity to soften up the ice, pushing an increasing number of patches above the critical -5 C threshold.

CICE model runs do show a substantial thinning of Beaufort sea ice over the next few days even as the thick sea ice remaining near the Canadian Archipelago is both shoved into narrow island channels and ablated toward the Fram Strait between Greenland and Svalbard. Note the shift of light blue to dark blue, and yellow and red to green in many regions indicating significant predicted thinning in response to storm conditions. The two meter ice line is seen to rapidly retreat into the Beaufort from near the Canada/Alaska coast and also from the Chukchi, East Siberian, and Laptev Seas. Meanwhile, the four meter ice line is slammed directly against the Canadian Archipelago as thicker ice is slammed against shores or jammed into the island channels:

Sudden Arctic Cyclone Effects CICE

CICE model run. Image source: US Navy.

In summary, we can expect these effects from this, rather strong, storm. Not likely to be as pronounced as GAC 2012 nor as ongoing as PAC 2013 (whose scars are still visible in the large region of melt in a wide triangle from the Laptev toward the North Pole). But this Sudden Arctic Cyclone will certainly leave its own mark on the 2013 melt season.

World CO2 at 396.8 PPM and Climbing; May Break 400 PPM This Year

According to the most recent report from the Mauna Loa Observatory, world CO2 concentrations reached a record 396.8 PPM in February.

Considering that we have three more months of seasonally increasing world CO2 values, it is possible that 2013 will see CO2 levels break 400 PPM for the first time in at least 3 million years.

The last time CO2 levels were this high was during the Pliocene epoc. This geological period, occurring about 2.5-5.3 million years ago, exhibited CO2 averages in the range of 365 to 410 ppm.

During the Pliocene, no ice covered Greenland or West Antarctica. Sea levels during the Pliocene were about 75 feet higher than they are today.

For February 2013, world CO2 levels were 3.26 PPM higher than CO2 levels in February of 2012. On average, world CO2 levels are increasing at a rate of 2.2 parts per million each year (but ramping higher). At this rate of increase, it will be less than five years before world CO2 levels exceed that of the Pliocene and begin to enter a range prevalent during the Miocene of around 400-600 ppm CO2.

Early Miocene was a time when no glaciers covered the poles. So pushing world CO2 values out of the range of the Pliocene and into that of the Miocene presents a serious amplification of already challenging climate difficulties.

Links:

http://www.esrl.noaa.gov/gmd/ccgg/trends/

Human CO2 Emissions Continue to Play Russian Roulette with Clathrate Gun: New Study Shows East Coast Methane Hydrates Destabilizing

According to a new study published in the journal Nature, increasing ocean temperatures combined with changes in the structure of the Gulf Stream are causing the rapid destabilization of large amounts of methane off the US East Coast. What the study shows is that the Gulf Stream is getting warmer due to human-caused global warming and that the warmth is pushing deeper and deeper into the ocean. As the warmer waters encounter the Continental Shelf they begin to affect massive frozen reserves of methane called methane hydrates or clathrates on the sea bed.

Clathrates are a frozen combination of methane and water. The substance is very unstable and, once disturbed, can rapidly transition from its frozen state to methane gas. Hundreds of gigatons of methane lie trapped in clathrate in the region affected by the Gulf Stream. If even a fraction of these clathrates were to destabilize, it could result in a powerful amplifying feedback to global warming, ocean and atmospheric anoxia (oxygen loss) and worse.

The study postulates that ocean warming of 5 degrees Celsius may have caused a massive release of methane about 50 million years ago resulting in a large release of methane that caused both wide-spread ocean acidification and a major increase of about 5-7 degrees Celsius in world temperatures. The sea bed in the region in question is  shown to have warmed by about 8 degrees Celsius since the last ice age with rapid warming occurring since the advent of human greenhouse gas emissions.

The study found than an area of 10,000 square kilometers off the East Coast showed rapidly destabilizing clathrates. The total volume at immediate risk of destabilization was 2.5 gigatons. Because methane is many times as potent as carbon dioxide, a single release of methane of the size estimated would triple or quadruple the amount of heat forcing produced by human greenhouse gas emissions in one year. Futhermore, this study focused only on the US East Coast as a potential methane source. Other studies have found large methane releases coming from the Alaskan Continental Shelf, the East Siberian Arctic Shelf, and other regions of the Arctic. This was the first major mid-latitude study and it is also likely that vulnerable methane deposits exist in other continental shelf zones around the world.

In total, the East Coast methane store of about 300-500 gigatons of methane clathrate adds to another 1000-1400 gigatons of Arctic clathrate, 1000+ gigatons of methane stored in permafrost and at least 100 gigatons of methane stored beneath Antarctica. This total contains more carbon than all the world’s remaining conventional fossil fuels and has a very large potential to greatly enhance human-caused warming. Furthermore, unknown amounts of methane hydrate lie in wait in other world ocean regions.

Continued human CO2 emission creates an added forcing that is likely to increase the risk of a large methane release from frozen permafrost and from clathrates. It has been hypothesized that large releases of this kind caused a major temperature spike and mass extinction in the ocean about 50 million years ago. A larger release of methane about 250 million years ago called the Permian extinction event is thought to have caused a major die off of 96 percent of ocean species.

Russian Arctic researcher Shakhova has estimated that it is possible for as much as 50 gigatons of Arctic methane to be released in single large events called pulses. Such large events, if they were to occur, would have terrible regional, local, global and oceanic impacts. Large regions of the ocean would be stripped of oxygen. The local atmosphere, as well, would be at risk of becoming anoxic. Areas where atmospheric concentration of methane exceeded 5% (5000 ppm) would be at risk of severe firestorms.

But even a more gradual release of the methane would be devastating, causing an amplifying feedback to human CO2 emission that could raise world temperatures by as much as 18 degrees Fahrenheit by the end of this century. The difference between Shakhova’s large pulse and the more gradual release expected by other scientists is the difference between a flash fire or a slow bake. But the end result is the same — a world that really isn’t livable for human beings or for many other creatures either.

The Recent changes to the Gulf Stream causing widespread gas hydrate destabilization study shows that the Arctic Ocean is no longer the only region of concern for rapid methane release due to human climate forcings. Now, the Eastern Continental Shelf of the United States is shown to contain a substantial methane reserve and that 2.5 gigatons of this methane is undergoing rapid destabilization. And all of these studies, when taken into context show that continued human greenhouse gas emission is a severe and unconscionable risk. Each year, as more of these gasses enter the atmosphere, there is more and more risk of a catastrophic methane release event. Each year, as the heat builds up, we are at greater risk of entering an age when the heat content of the atmosphere is so great that large methane releases continue to occur for centuries and may result in a world that is devastated and unlivable for humans.

So for each year that we continue to emit CO2 we continue to play a game of Russian Roulette with the largest weapon on the planet — the Clathrate Gun. We know the bullet is in the chamber. We have found evidence for it in the Arctic, the Antarctic and now just off the US East Coast. But we don’t quite know whether this year’s trigger pull of another 30+ gigatons of human CO2 emission will spark a series of unstoppable and terrible events. Or if it will be next year. Or the year after.

Only one thing is certain. If we pull the trigger enough, that terrible gun is bound to go off. The best course of action is to stop pulling the CO2 trigger. To put the gun down and step away from the burning of fossil fuels which have become so very dangerous.

Links:

http://www.nature.com/nature/journal/v490/n7421/full/nature11528.html?WT.ec_id=NATURE-20121025

http://en.wikipedia.org/wiki/Clathrate_gun_hypothesis

https://robertscribbler.wordpress.com/2012/03/18/arctic-sea-ice-melt-methane-release-shows-amplifying-feedbacks-from-human-caused-climate-change/

http://www.skepticalscience.com/Wakening_the_Kraken.html

Global Warming Brings Hell in the Heartland, High Water on the East Coast

Joe Romm in his seminal book on climate change ‘Hell and High Water‘ described how human caused global warming was likely to ravage both the US and the world, if left unchecked. It is an alarming revelation of the immediate problem posed by climate change that shows many of the effects and impacts resulting from greenhouse gas emissions are far more current than initially thought. These impacts occur within the span of our generation, not just as a nasty form of generational sabotage foisted on our children and grandchildren.

This year, as climate scientists around the world acknowledged the fact that global warming was having a direct impact on weather, causing it to worsen, the first strong effects of human caused climate change began to take shape. These first outliers of ‘Hell and High Water’ climate change are now being visited upon the United States. Off the East Coast, as described in a previous blog, it appears that a storm to rival the Perfect Storm of 1991 may well be forming. Meanwhile a severe drought that began this Spring continues to ravage the heartland.

Currently, over 62 percent of the United States’ landmass continues to struggle under the assaults of a historic drought. By mid-October of any normal year you would have expected dryness and drought to have slackened its grip on our country. But this year the drought that peaked at 65% of the total continental landmass has barely even paused. Enormous swaths of the country remain under drought with the most extreme drought burning a hole directly in the country’s center.

Overall, extreme conditions have mainly shifted north and west. But the coverage and impact of drought areas remains substantial. According to this week’s Drought Monitor:

Significant precipitation was limited to the eastern Dakotas, while the High Plains’ hard red winter wheat belt received little or no rain.  As a result, soil moisture shortages continued to limit wheat emergence and development across the northwestern half of the Plains.  In addition, mid-week wind gusts locally in excess of 70 mph raised dust and temporarily closed major roadways across parts of the Plains.

Overall, the risk to the nation’s wheat harvest remains high with more than 60% of the nation’s wheat under threat. That said, wheat is a much hardier crop than corn and may well show less impact from the ongoing drought. However, stakes remain high as the US is a major wheat exporter and UN food analysts are saying the world may enter a food crisis if any more climate-driven shortages crop up.

Russian and Ukraine wheat output is at a nine year low. EU stockpiles are at a 14 year low. Argentina, the world’s sixth largest wheat exporter, has experienced a 16 percent fall in production. Though US wheat prices are running $20 per ton higher than the world average, the world may turn to the US as EU and South American wheat stocks set aside for export begin to run low. In such an event, any damage to the US wheat harvest would cause serious difficulties for importing countries like Egypt and other Middle Eastern and African nations reliant on world trade to supplement their people’s nutritional requirements.

Persistent US drought could pose a problem for next year’s crops as well. Back to back years like 2012 would result in severe consequences for both the US and the community of nations reliant on international trade to prevent hunger.

Links:

http://droughtmonitor.unl.edu/

http://www.businessweek.com/news/2012-10-24/france-tops-u-dot-s-dot-wheat-with-premium-seen-at-record-commodities

Arctic Sea Ice Melt, Methane Release Shows Amplifying Feedbacks from Human Caused Climate Change

For years now, scientists have warned that additional atmospheric heat caused by human releases of carbon dioxide (CO2) could result in amplifying feedbacks that cause even more heat. At first, most of these comments were academic, an exercise in predicting what would happen if humans did not curtail greenhouse gas emissions. But as human CO2 emissions continued to increase, global warming amplified and changes accelerated. Now the warnings from scientists are much more direct. Consider NASA scientist James Hansen’s most recent statement:

“We don’t have a substantial cushion between today’s climate and dangerous warming. Earth is poised to experience strong amplifying feedbacks in response to moderate additional global warming.” – James Hansen

Amplifying Feedbacks via Microphone

An amplifying feedback is a rapidly increasing response to an initial forcing. In everyday life, people are generally familiar with what happens when you put a microphone close to a speaker. The microphone picks up ambient noise, and pushes it out through the speaker. This, now louder, noise is picked up again by the microphone and sent back to the speaker as a much louder input. The loop continues until the speaker is pouring out a rapidly rising wail of sound.

Arctic Sea Ice Melt as Amplifying Feedback

In nature, something very similar can happen as a result of an initial climate forcing. In the Arctic, we can see this in the form of sea ice melt over the past few decades. Increases in ocean temperature and stored heat has gradually worn away at both Arctic sea ice area and Arctic sea ice volume.

In 2007, Arctic sea ice area reached the lowest levels ever recorded, a level far below the 1979-2001 average. Sea ice lost area equal to 20% of the total summer coverage of the previous year. More than 20% of Arctic sea ice gone in one year. Since that time, Arctic sea ice area has failed to recover with 2011 showing the second lowest area on record at end of summer, an area very close to the unprecedented 2007 record low.

Image

The above image shows the difference between 1980 and 2007 Arctic sea ice (Source: Cryosphere Today).

But sea ice area as seen from above only tells half the story. The second half is told by total sea ice volume. Area measures how much surface is covered by ice. Volume measures the total amount of ice by taking into account sea ice thickness. And when looking at volume, there has been a precipitous and unrelenting fall.

Image

Sea Ice Volume shown above is calculated using data from the Pan-Arctic Ice Ocean Modeling and Assimilation System of the Applied Physics Lab at the Polar Science Center and inserting it into a curve fitting process. And the curve shows a near-ice free Arctic under current trends by or before the summer of 2020. In fact, the model shows that September could see ice-free seas as early as 2013. Not likely, but another couple summers like 2007 could bring us very close.

But even if current trends don’t hold, additional statistical analysis shows nearly ice free summers by or before 2035.

And the, usually guarded, IPCC findings point toward ice-free summers before 2050. So depending on the dynamics of Arctic weather, which can certainly be very dynamic, our best analysis points toward a continuation of rapid collapse or a shift to a more gradual melt down.

Regardless of final melt dates, APL sea ice volume measurements show Arctic sea ice is getting very, very thin.

The reason Arctic sea ice melt is an amplifying feedback is due to the heat reflective nature of ice vs the heat absorption nature of water. Water just by virtue of color alone, absorbs more sunlight than ice. This results in water temperature in ice free seas being as much as 5 degrees C warmer than water beneath sea ice. And this warmer water heats both the air and the entire water column. Loss of sea ice alone is a powerful amplifier of temperatures during the Arctic summer and this extra absorbed heat is on top of the extra heat added by human caused global warming via CO2 emissions.

Arctic Methane Releases as Amplifying Feedback

It is the nature of single amplifying feedbacks that they tend to kick off other feedbacks. And this is exactly what is happening with Arctic methane.

In the Arctic, both methane and ice have been locked together in a chilly marriage ever since the roof of the world began to freeze about 10 million years ago. The reason for this is that the bodies of dead plants and animals have accumulated in the tundra’s frozen soil year after year. Dead and decayed biological matter has also been locked in formations called methane hydrates in the shallow Arctic sea.

When the ice melts, seas warm. This results in warmer winds blowing over the tundra. The tundra’s permfrost soils begin to melt and, when they do, bacteria begin to break down the dead matter locked in these frozen soils for so long. Once the matter breaks down, methane is released.

Now methane is a very powerful greenhouse gas — packing a potency twenty times that of CO2. So Arctic methane releases result in a powerful global warming force adding to the effects of sea ice melt and human CO2 emissions. The result is that the Arctic warms even more, more tundra melts, and more methane is released.

Image

Often, when heat melts the tundra, new lakes form. These lakes contain large volumes of methane. Sometimes, researchers ignite this methane to demonstrate how much is being emitted from the lakes. Often, these ignitions result in dramatic plumes of fire, illustrating the explosive nature of methane emissions in the Arctic.

But, sometimes, this new methane seeping up from Arctic soils are ignited by nature in the form of lightning strikes. And these lightning strikes can result in vast tundra fires that burn massive swaths of the Arctic. One such tundra fire recently burned an area the size of Cape Cod in Alaska.

Image

These tundra fires convert massive volumes of biological matter into CO2 which adds another amplifying feedback.

Out Gassing of Submerged Arctic Methane

Even though vast areas of land are now providing amplifying feedbacks as Arctic tundra thaws, some of the thawing tundra isn’t on land, it’s under the water. North of Siberia, the East Siberian Arctic Shelf (ESAS) is a protrusion of tundra now flooded by the Arctic Ocean. As the water above this shallow shelf warmed, the submerged tundra began to thaw, and as it thawed it began to release methane.

These underwater methane releases were only recently discovered. Since their discovery, the rate of methane release has defied all expectations, pouring more methane into the atmosphere than any other natural source. Just this summer, Arctic researchers including Igor Semiletov discovered enormous plumes of methane venting up from the sea bed. According to the researchers, some of these methane plumes were more than 1 kilometer across.

“Earlier we found torch-like structures like this but they were only tens of metres in diameter. This is the first time that we’ve found continuous, powerful and impressive seeping structures, more than 1,000 metres in diameter. It’s amazing,” Dr Semiletov said in a 2011 interview. “I was most impressed by the sheer scale and high density of the plumes. Over a relatively small area we found more than 100, but over a wider area there should be thousands of them.”

Some of this submerged methane comes from the decomposition of submerged tundra, the rest comes in the form of destabilized methane hydrates. As seen on the map below, the ESAS is just one of many areas where high concentrations of methane hydrate are expected.

Overall, 1700 gigatons of carbon are estimated to be locked up in the melting tundra and more than 4400 gigatons of carbon are estimated to be stored in the form of methane hydrates. By comparison, remaining conventional fossil fuel sources are estimated to contain about 1100 gigatons of carbon — about equal to the amount already emitted. So even if a fraction of Arctic Methane destabilizes it could more than double the impacts of human caused climate change.

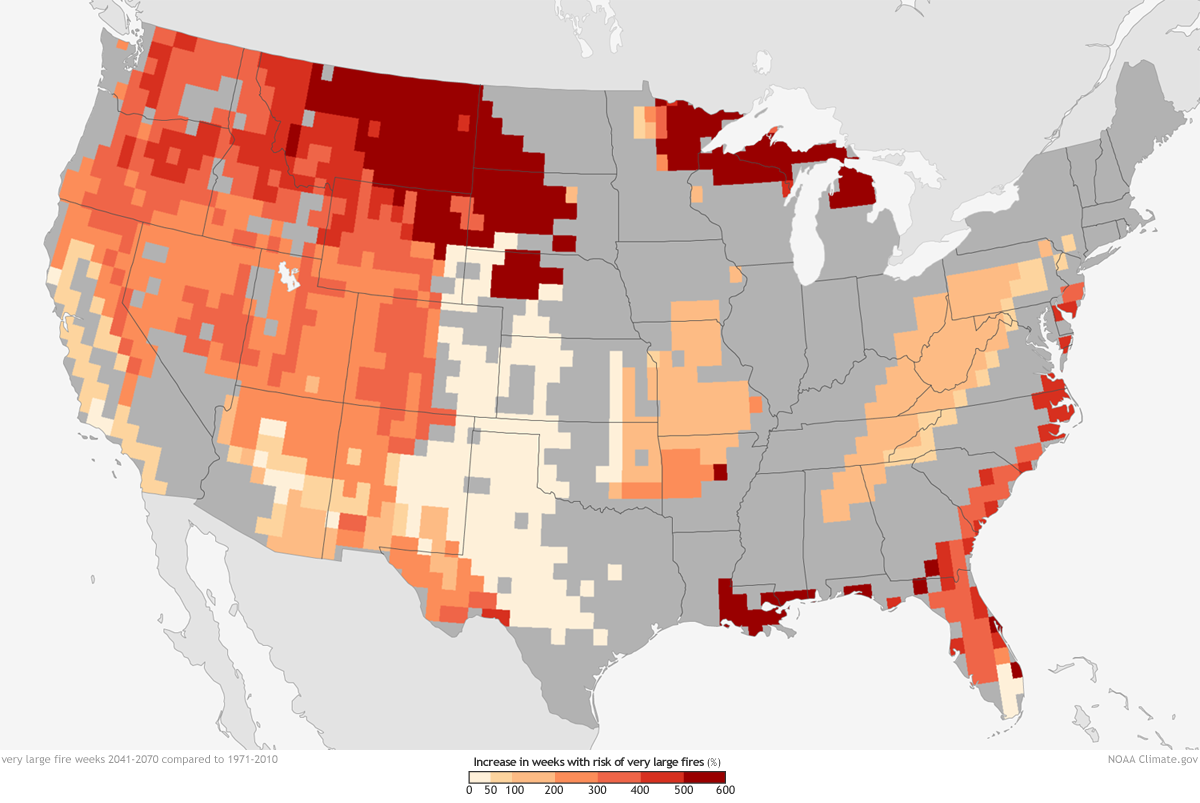
But there is additional danger. They include loss of oxygen in the world’s oceans, rapidly increasing ocean acidification, the risk of much larger tundra fires, and the risk of very large fires sparked by lightning strikes in the event of sudden, large methane releases. These dangers should be seen as directly related to the risk posed by amplifying feedbacks.

Combined Impacts

When added to the very high volumes of CO2 produced by human activity, a volume 150 times that produced yearly by volcanoes, the increased heating caused by melting sea ice and increased methane release creates a dangerous amplifying feedback to global warming. The effects of these feedbacks are large and growing larger. The valid concern among scientists and those researching climate change is that these feedbacks will only expand exponentially as human forcing increases, eventually creating a cascade of effects whose scale is beyond the ability of humans to reign in.

Sources:

Cryosphere Today: http://arctic.atmos.uiuc.edu/cryosphere/

National Snow and Ice Data Center: http://nsidc.org/arcticseaicenews/

The Polar Science Center: http://psc.apl.washington.edu/wordpress/research/projects/arctic-sea-ice-volume-anomaly/

“Vast Plumes of Methane Seen in Arctic as Sea Ice Retreats” http://www.independent.co.uk/news/science/vast-methane-plumes-seen-in-arctic-ocean-as-sea-ice-retreats-6276278.html

International Arctic Research Center: http://www.iarc.uaf.edu/en/about

The Storms of My Grandchildren by James Hansen, 2008


Please help support our continuing efforts.

Please help support our continuing efforts.